

Abstract
Introduction
Hepatocellular carcinoma is the prevalent primary liver cancer, a silent disease that killed 782,000 worldwide in 2018. Multimodal deep learning is the application of deep learning techniques, fusing more than one data modality as the model’s input.
Purpose
A computer-aided diagnosis system for hepatocellular carcinoma developed with multimodal deep learning approaches could use multiple data modalities as recommended by clinical guidelines, and enhance the robustness and the value of the second-opinion given to physicians. This article describes the process of creation and evaluation of an algorithm for computer-aided diagnosis of hepatocellular carcinoma developed with multimodal deep learning techniques fusing preprocessed computed-tomography images with structured data from patient Electronic Health Records.
Results
The classification performance achieved by the proposed algorithm in the test dataset was: accuracy = 86.9%, precision = 89.6%, recall = 86.9% and F-Score = 86.7%. These classification performance metrics are closer to the state-of-the-art in this area and were achieved with data modalities which are cheaper than traditional Magnetic Resonance Imaging approaches, enabling the use of the proposed algorithm by low and mid-sized healthcare institutions.
Conclusion
The classification performance achieved with the multimodal deep learning algorithm is higher than human specialists diagnostic performance using only CT for diagnosis. Even though the results are promising, the multimodal deep learning architecture used for hepatocellular carcinoma prediction needs more training and test processes using different datasets before the use of the proposed algorithm by physicians in real healthcare routines. The additional training aims to confirm the classification performance achieved and enhance the model’s robustness.
Keywords: Multimodal deep learning, Computer-aided diagnosis, Convolutional neural networks, Hepatocellular carcinoma
Introduction
According to the World Health Organization global estimates, about 1 in 6 deaths were caused by cancer in 2018. Cancer was responsible for about 9.6 million deaths worldwide, and liver cancer was the fourth deadliest cancer, accounting for 782,000 deaths in that year [48].
Hepatocellular Carcinoma (HCC) is the most prevalent liver cancer and can be associated with previous chronic liver diseases [3]. In the early stages of the disease, it runs a silent course with no pathognomonic symptoms [2]. This characteristic difficult disease detection resulting in a decreased survival probability, as the treatment often starts when the cancer is in advanced stages [44].
The European Association for the Study of the Liver (EASL) and the American Association for the Study of Liver Diseases (AASLD) maintain diagnostic protocols for HCC, which recommends imaging depending on nodules count and size. The differences between these protocols are that EASL guidelines can vary depending on the quality of the image acquisition hardware, and AASLD suggests the use of attributes of the patient’s context during diagnoses, such as daily habits and previous diseases [16, 20].
Deep learning (DL) is a promising artificial intelligence technique that can be used to develop Computer-Aided Diagnosis (CAD) systems for cancer using imaging [15, 38], clinical attributes [34, 45] or genetic information [7, 51]. Multimodal Deep Learning (MDL) is an approach that allows the use of more than one data modality in DL architectures [24], enabling the creation of models for CAD of HCC, which combines, for instance, imaging and patient’s context attributes as suggested by the AASLD guidelines.
Creating an algorithm for CAD of HCC that has diagnosis precision closer to human specialists can benefit healthcare professionals and patients. Healthcare professionals can use this CAD system to simplify the diagnostic process and keep the same performance to detect the disease even after long working hours. For the patient, the advantages are related to early cancer detection and treatment, which are factors associated with an increased survival probability and the possibility of disease remission [41].
The initial ideas about an algorithm that fuses Computed Tomography (CT) images with attributes representing the patient’s context to develop a CAD for HCC had already been described in our previous article [30]. This article outlines the evolution of the original ideas, the algorithm’s evaluation process and the results achieved with the proposed model.
The paper is structured as follows: Section 2 describes a brief comparison of related work found in the literature. Section 3 describes the proposed algorithm and the experiments performed to test its classification performance. In section 4, it is outlined the experiment’s results. Section 5 discusses these results and future enhancements for the proposed algorithm. The last section contains final considerations about the topics described in this text.
Related work
In the literature, it predominates researches that use traditional machine learning algorithms such as Support Vector Machine (SVM) or Random Forests (RF) processing structured data to perform HCC CAD [23]. It is unusual to find DL approaches to develop CAD systems for HCC using unimodal input in the literature, and the application of MDL is also rare to find [4]. This lack of interest can be explained by the low number of HCC datasets ready to train and validate DL architectures, regardless of the number of modalities used.
Related work search aimed to find articles written after 2015 that described MDL architectures to predict HCC. We performed the search on Google Scholar using the keywords ‘multimodal deep learning (“hepatocellular carcinoma” OR hepatocarcinoma)’. The articles found in the search were:
Miotto et al. [31] combined radiological reports, clinical and sociodemographic attributes. A Stacked Denoising Autoencoder (sDAE) was used for feature extraction, and an RF classified these features to predict 72 diseases. The prediction of liver cancer was the highest performance achieved in this work, with an Area Under the Receiver Operating Characteristics (AUROC) = 0.925 using a dataset divided into 100,000 patients for training and 5,000 for validation. The computational requirements of deep unsupervised algorithms in large datasets and the extensive preprocessing steps required to process the clinical records are the main limitations of this work.
Wang et al. [46] fused axial, sagittal and coronal 2D patches of Contrast-enhanced Magnetic Resonance Imaging (MRI) into an orthogonal plane, representing the Region of Interest (ROI) of the radiological findings. A multimodal Convolutional Neural Network (CNN) processed this volume for feature extraction and, a multi-kernel SVM classified these features to determine the malignancy degree of a liver nodule. The highest accuracy achieved in this article was . This study used a dataset comprising 46 confirmed HCC patients, processed in 4-fold cross-validation divided into 33 patients for training and 13 for testing. Despite the promising quantitative results, using such a small dataset for training and validation often results in low-performance models in the real world.
Dou et al. [13] used a multimodal CNN to determine the malignancy degree of hepatic nodules. For this, it was combined patches of size 16 16 pixels extracted from multi-plane Contrast-enhanced MRI with volumetric 16 16 16 patches, forming a 3D image. The highest accuracy achieved in this example of Early Fusion was , using the same dataset and cross-validation parameters of the Wang et al. [46] study. Therefore, it shares the same limitations related to the model’s training and validation with a small number of patients.
Dou et al. [11] extracted features from Contrast-enhanced MRI using image processing techniques and fused them with the MRI itself. Based on these inputs, it was used a multimodal CNN to determine the malignancy degree of carcinogenic liver nodules. Processing the images and features as 3D tensors resulted in the highest accuracy achieved in this study, . This study also used the same dataset of 46 confirmed HCC patients described in [46] and [13], which results in the same limitations of the other studies related to the small dataset for training and validation.
Dou et al. [12] used images of the pre-contrast, arterial and portal phases of an abdominal Contrast-enhanced MRI study to determine the malignancy of liver nodules. They combined the images using intermediate fusion and used a 3D multimodal CNN for feature extraction and classification. The highest accuracy achieved with the fusion of all the phases was . This study also used the same dataset described in [13, 46] and [11], sharing the same limitations of the other articles.
Zhou et al. [52] used a multimodal CNN to combine attributes extracted from diffuse MRI (DWI-MRI) and the image itself using late fusion to determine the tissue malignancy. A dataset composed of 100 confirmed HCC patients for training and validation was used, and the highest accuracy achieved was 0.80. The lack of the interpretability of high-dimensional vectors and the use of retrospective data from one oncological center are the main limitations of this study.
Lin et al. [26] fused multiple histopathological images using intermediate fusion for HCC diagnostic support. They used a multimodal CNN based on the VGG16 network for HCC detection and achieved an accuracy = 0.941 with a dataset of 113 samples for training and validation. The lack of high-grade G4 HCC samples in the dataset is the major limitation of this study.
The articles found described architectures that fused either multiple perspectives of the same high-quality imaging study or clinical and genetic attributes. It was not found any article mixing distinct data modalities such as imaging and clinical attributes. Only Miotto et al. [31] used a dataset with enough samples to train a deep architecture however did not use a multimodal CNN in the proposed architecture, probably because of the data modalities chosen to predict HCC.
Table 1 summarizes the key characteristics found in related works to simplify the comparison between them.
Table 1.
Related Work Overview
| Reference | Inputs | Results |
|---|---|---|
| Miotto et al. [31] | Radiological report fused with clinical and sociodemographic attributes | AUROC = 0.92; F-Score = 0.22 |
| Wang et al. [46] | Multiple Planes of MRI fused with the image itself | acc = ; recall = ; specificity = |
| Dou et al. [13] | Fused 2D and 3D MRI Patches | acc = ; recall=; specificity = |
| Dou et al. [11] | Features extracted from MRI by image processing techniques fused with the image itself | acc = ; recall = ; specificity = |
| Dou et al. [12] | Fused abdominal contrast-enhanced MRI acquired in pre-contrast, arterial and portal phases | acc = ; recall = ; specificity = |
| Zhou et al. [52] | Features extracted from dwi-MRI fused with the image itself | acc = ; recall = ; specificity = |
| Lin et al. [26] | Fused features extracted from multiple histopathological images with the image itself | acc = 0.94 |
As could be seen in this section, there is a trend in processing high-quality imaging studies using multimodal CNN to develop CAD systems for HCC. The algorithm proposed in this article uses a similar MDL architecture focusing on distinct data modalities commonly found in a patient Electronic Health Record (EHR), acquired using non-invasive techniques. Moreover, the proposed algorithm preprocessing steps can be fully automated, enabling truly end-to-end processing. The last advantage of the proposed algorithm over the related works described in this section is that the fusion of imaging with structured data results in a decreased computational requirement when compared with the fusion of multiple perspectives of high-quality imaging.
Materials and methods
Imaging and structured health data used in the experiments were downloaded from public databases. Patients’ data with confirmed HCC were obtained from TCGA-LIHC database [14], and patient data without HCC were obtained from TCGA-STAD [28], TCGA-KIRP [27] and CPTAC-PDA [33] databases. These projects provided CT images in Digital Imaging and Communications in Medicine (DICOM) format and structured data as Comma-Separated Value (CSV) files.
After that, axial plane CT images were extracted from imaging datasets and all the structured data were merged into a single CSV file. In the end, there were available datum from 174 patients to train and test a MDL architecture.
Imaging preprocessing comprised CT noise removal using the Total Variation (TV) Denoising algorithm written by Chambolle [6] and histogram equalization using Contrast Limited Adaptive Histogram Equalization (CLAHE) algorithm [37]. Both algorithms had already been used successfully in multiple examples found in the literature to enhance medical images [32, 35, 39].
Structured datum preprocessing started with attributes selection to reduce the dataset dimensions. The selection of attributes was based on the guidelines described by EASL to monitor hepatic functions [1, 16]. Table 2 list the chosen attributes and its correlation with the target variable. The data correlation was measured using the Chi-Square Association Test in all structured data available and was calculated using the Scikit-Learn framework [36]:
Table 2.
Tabular data overview
| Attribute | Correlation | Position |
|---|---|---|
| Alpha-Fetoprotein | 981,086.96986 | 1 |
| Bilirubin | 229.40616 | 2 |
| Platelets | 147.26518 | 3 |
| Weight | 36.04819 | 4 |
| Ethnicity | 35.4899 | 5 |
| Family history cancer number relatives | 26.86949 | 6 |
| Family history cancer indicator | 9.47763 | 7 |
| Other malignancy | 8.24278 | 8 |
| Race | 7.76693 | 9 |
| Gender | 7.71761 | 10 |
| Other liver disease | 3.99837 | 11 |
| Alcohol consumption | 3.96676 | 12 |
| Hepatitis | 2.84892 | 13 |
| Height | 1.63207 | 14 |
| Albumin | 1.05199 | 15 |
| Age atDiagnosis | 0.62082 | 16 |
| Hemochromatosis | 0.58248 | 17 |
| Creatinine | 0.28554 | 18 |
| Prothrombin Time | 0.20623 | 19 |
| Non-alcoholic fatty liver disease | 0.17894 | 20 |
After the dimension reduction of the tabular dataset, steps were performed to fill missing values, convert text into binary attributes and equalize unit metrics of laboratory tests results. Missing values imputation was performed using neural networks, splines and delimited pseudo-random number generators. The last step was a validation process to enforce that all the synthetic tabular data have values similar to the real-life, based on reference values found in the literature for each attribute.
The Patient Identification (ID) was the attribute used to create a link between image and structured data. This attribute was concatenated in the image filename, and can be read during modality fusion by the DL algorithm.
Aiming to confirm that the image preprocessing steps did not remove patterns excessively, two image datasets based on the same source images were created. In the first image dataset, raw DICOM images were converted directly to Portable Network Graphics (PNG) format and, in the second image dataset, preprocessing steps described in this article were applied before the PNG conversion.
Both image datasets were subdivided into train, validation and test subsets using the Holdout validation method with 70%/20%/10% ratio. Table 3 describes the number of CT slices in each image subset.
Table 3.
Number of CT slices in each image subset
| Source | Train | Validation | Test | Class |
|---|---|---|---|---|
| TCGA-LIHC | 14.552 | 4.158 | 2.082 | Confirmed HCC |
| TCGA-KIRP | 1.100 | 316 | 160 | Negative HCC |
| TCGA-STAD | 7.680 | 2.193 | 1.096 | Negative HCC |
| CPTAC-PDA | 5.772 | 1.649 | 826 | Negative HCC |
| Totals | 29.104 | 8.316 | 4.164 |
Development of deep models using a limited set of training images requires the application of a technique known as Data Augmentation, which aims to increase the examples available for training and validation without losing correlation between created and original images [17]. The data augmentation operations used during the training process were:
pseudo-random rotation of the image’s X-axis within 15 degrees;
horizontal and vertical pseudo-random translation within 20%;
pseudo-random image deformation up to 10 degrees;
pseudo-random image zoom factor up to 20%;
pseudo-random image resizes within .
In a CAD system developed with DL techniques, the network architecture plays a key role in the performance of the classification algorithm. Three candidate CNNs were evaluated using the same dataset, parameters and fusion approach:
InceptionV3 [42] is a CNN developed by Google in 2014. This network accepts images with dimension (299 299 3) and has already been used for classification of medical images [15].
Xception [10] is a CNN developed by Google in 2016. Its architecture was inspired by InceptionV3, accepts images with dimension (299 299 3) but uses depth-wise separable convolutional layers to maximize parameters utilization and reduces the model’s size.
VGG19 [40] is a CNN created in 2014 by the Visual Geometry Group of Oxford University. It accepts images with dimensions (224 224 3) and requires fewer computational resources than InceptionV3 and Xception networks for training and usage.
Keras framework [9] version 2.2, running on top of TensorFlow-1.14, provides an out-of-the-box unimodal implementation of these networks with pre-trained weights. The following modifications were required to adapt these architectures to process multiple modalities:
adding an input layer to accept 20 attributes;
adding a concatenate layer to fuse image features with the structured data;
adding new dense layers to process multiple modalities;
creating a data generator class which provides multimodal samples when required by the model.
Figure 1 shows the multimodal Xception architecture used in the experiments without the ReLU and Dropout layers, which were removed for brevity. Xception is the only architecture depicted in this article because it was the CNN that achieved the best performance for CAD of HCC, as the results will show in the next section.
Fig. 1.

Multimodal xception architecture with intermediate fusion
The idea behind the fusion of imaging with clinical, sociodemographic and anthropometric attributes is the enhancement of the features extracted from the image in the convolutional layers with the patient’s context information. This fusion tries to mimic the physician’s disease detection procedures and the AASLD guidelines, which recommend considering the patient’s history, daily habits and other health information during the computer-aided diagnosis, aiming to increase the overall performance.
All the evaluated CNNs used the same hyperparameters during training and tests. The optimization function chosen was Stochastic Gradient Descendent (SGD) with a learning rate of 0.0001 and momentum of 0.9. The network output layer uses Softmax as the activation function because of the binary output, and the weight decay factor used in convolutional layers was 0.00005, a value commonly used in state-of-the-art networks [10, 22, 43]. Early stopping was parameterized to quit the training after ten epochs without accuracy increase. Regularization methods such as Data Augmentation, Weight Decay and Early Stopping help to ensure that the network is not over-trained [17].
The classification metrics chosen to evaluate the proposed CAD algorithm for HCC were Accuracy, Precision, Recall (also known as Sensitivity), Specificity and F-Score. These metrics were calculated at slice level using functions of Scikit-Learn framework Version 0.21.3 [21] based on the classification reports provided by Keras in one test cycle for each image dataset. The tests were performed after training the multimodal CNNs for 500 Epochs using Batch Size of 128 and the Early Stopping setup previously described. This number of training epochs was chosen to stress the learning capabilities of the model and test if more training would cause higher classification performance.
The experiments ran in Virtual Machines (VMs) rented from Amazon EC2 service. These instances have 23.5 ECU, 8 vCPUs 2.7 GHz Intel Xeon E5-2686v4, 61 GB RAM, 16 GB Tesla V100 GPU, a 75 GB SSD disk for the operating system and a 40 GB SSD disk to store datasets, source code and experiments logs. The operating system chosen was Linux using an Ubuntu 18.04 distribution.
Results
The average performance achieved during preliminary experiments by the candidate architectures is listed in Table 4. These experiments were performed to choose the DL architecture with the highest performance to compose the proposed algorithm for CAD of HCC.
Table 4.
Average results in the preliminary experiments
| Base CNN | Fusion approach | Raw image | Acc. | Prec. | Recall | F-Score |
|---|---|---|---|---|---|---|
| InceptionV3 | Intermediate | Yes | 0.851 | 0.881 | 0.851 | 0.847 |
| InceptionV3 | Intermediate | No | 0.820 | 0.864 | 0.820 | 0.814 |
| InceptionV3 | Late | Yes | 0.856 | 0.888 | 0.856 | 0.852 |
| InceptionV3 | Late | No | 0.827 | 0.872 | 0.827 | 0.820 |
| Xception | Intermediate | Yes | 0.854 | 0.885 | 0.854 | 0.851 |
| Xception | Intermediate | No | 0.868 | 0.895 | 0.868 | 0.866 |
| Xception | Late | Yes | 0.835 | 0.877 | 0.835 | 0.829 |
| Xception | Late | No | 0.809 | 0.866 | 0.809 | 0.797 |
| VGG19 | Intermediate | Yes | 0.842 | 0.864 | 0.842 | 0.840 |
| VGG19 | Intermediate | No | 0.868 | 0.895 | 0.868 | 0.866 |
| VGG19 | Late | Yes | 0.868 | 0.895 | 0.868 | 0.866 |
| VGG19 | Late | No | 0.831 | 0.853 | 0.831 | 0.829 |
Precision was the metric defined in our previous article to compare the candidate architectures [30]. The multimodal Xception CNN achieved the highest precision using an intermediate fusion approach, and it was chosen as the MDL architecture for the proposed algorithm.
1 shows the proposed steps for CAD of HCC regarding the modification and fine-tuning to train a DL model using a multimodal approach.

After training, the MDL model can be used as a component or embedded in other applications using approaches such as Python scripts or Representational State Transfer (REST) endpoints, as cited in our previous article [30]. Algorithm 2 describes the steps to use the knowledge previously acquired by the DL model.

After algorithm proposition, one more round of experiments was conducted to measure the performance of the proposed algorithm for CAD of HCC, as described in Sect. 3. The classification performance achieved in this experiment was: True Positive (TP) = 2082, False Positive (FP) = 0, True Negative (TN) = 1540 and False Negative (FN) = 542. Using these basic metrics, the overall performance achieved can be calculated: Accuracy = 0.869, Precision = 0.896, Recall = 0.869, Specificity = 1.00 and F-Score = 0.867. Figure 2 shows the Receiver Operating Characteristic (ROC) Curve of the proposed algorithm for CAD of HCC achieved during the final experiments.
Fig. 2.
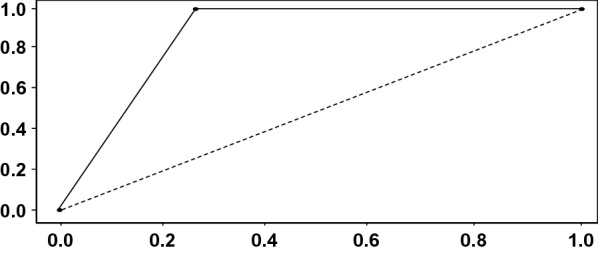
Proposed algorithm ROC curve
During the final round of experiments, we analyzed the activation maps of the output of the convolutional layers. This last step aims to avoid the black box concept often present in CAD systems developed with CNNs. These activation maps were generated using the Grad-CAM algorithm [8] for the patient TCGA-K7-A6G5. Figure 3 shows two activation maps for different CT slices of an abdominal study, and Fig. 4 shows the superimposed version of these heat maps over the original image.
Fig. 3.

Two examples of activation maps from the last convolutional layer
Fig. 4.

Superimposed activation maps from the last convolutional layer
In each case, the feature map resulting from the convolutional layers was fused with the patient’s structured health data. The final dense layers, which handle the multimodal output, processed the combined modalities. Both the predictions resulted in a probability of 0.99 for the HCC diagnosis.
Discussion
This article is the final part of a research initially described in [30]. It was described the evolution of the original ideas, the process of evaluation and the results achieved with the proposed algorithm. This section discusses the decisions took during the process of creation and evaluation, and its consequences for the overall results of the research.
Imaging preprocessing aimed to reduce noise and enhance image sharpness. The proposed approach for CT images preprocessing resulted in visually better images at first sight, but using preprocessed imaging resulted in a performance gain only for MDL architectures that use intermediate fusion in the experiments. Figure 5 shows the average performance metrics of each multimodal CNN considering the data fusion strategy used in the preliminary experiments.
Fig. 5.

Fusion strategy vs image preprocessing
The proposed algorithm for CAD of HCC uses a multimodal Xception CNN that fuses CT images with structured health data. These distinct data modalities are combined using intermediate fusion and achieved promising classification performance results considering that it uses CT images instead of MRI. However, it is unwise to state that this model will achieve the same classification performance on other datasets without further training. This future training step can be done in healthcare partners institutions such as hospitals or polyclinics, in backstage mode, until the classification results achieve enough performance to put the algorithm in daily usage by physicians.
It can be considered enough classification performance the same diagnostic performance of physicians, but it wasn’t found articles in the literature measuring hepatocarcinoma human specialist’s diagnostic performance using specifically axial CT images combined with laboratory exam results, clinical, anthropometric and sociodemographic attributes. Aiming to provide a start point for comparison, Table 5 shows the diagnosis performance results of human specialists in hepatocarcinoma using different data modalities found in the literature.
Table 5.
Hepatocarcinoma physicians diagnosis performance
| Reference | Input | Recall |
|---|---|---|
| [5, 18, 25] | Non-contrasted Ultrasound | 59.3% |
| [5, 18, 25] | Contrasted-Enhanced Ultrasound | 84.4% |
| [5, 18, 25] | Contrast-Enhanced CT | [72.0% - 73.6%] |
| [5, 18, 25] | Contrasted-Enhanced MRI | [72.0% - 85.6%] |
| [19] | microRNA | 81.9% |
| [19] | microRNA + Alpha-Fetoprotein | 87.4% |
| [29, 47] | Alpha-Fetoprotein L3 | 76.3% |
| [29, 47] | PIVKA-II | 51.0% |
| [29, 47] | microRNA + AFP-L3 + PIVKA-II | 90.00% |
It can be observed in the literature the inferior classification performance of unimodal approaches in HCC diagnosis. Moreover, the classification performance achieved by the proposed algorithm for CAD of HCC with the test subset is less than 4% inferior when compared to the best scenarios in Table 5, even if other data modalities are used.
The algorithm proposed in this article cannot be fairly compared with related works described previously in Table 1 because they do not use the same diagnosis inputs. However, observing related work generates ideas for enhancements in the proposed algorithm that can be implemented in the future.
Using MRI images resulted in higher results, when compared with architectures that used CT images [11–13, 46, 52]. This superiority is also observable in the diagnostic performance of physicians described in Table 5. Therefore, the first possible enhancement in the proposed architecture is to use MRI instead of CT images, which will require a new fine-tuning.
Processing images as 3D matrices also resulted in superior performance in related works, and this can be explained by features and patterns that cannot be extracted when images are processed in 2D [50]. The multimodal Xception CNN does not accept 3D imaging, but is possible to add recurrent layers in the architecture which can capture temporal relations, simulating the use of 3D inputs.
Applying Holdout validation in datasets subdivisions can cause degraded performance [49]. Therefore, using 10-fold cross-validation during the training/validation steps of the proposed algorithm is another enhancement that can be done and result in performance enhancement.
The algorithm created and evaluated in this article has at least three limitations:
The use of just one dataset to train and evaluate the proposed algorithm;
Missing values in structured data demanded the application of multiple approaches for data imputation. These synthetic values can negatively affect the performance of the proposed algorithm during usage in the real world because attributes correlation and existing patterns can be affected by these artificial data;
The intrinsic bias of the dataset and decisions taken during the creation and evaluation of a DL model can have a negative impact on overall results.
Even though the algorithm described in this article has inferior performance when compared to related works, some points can be explored to enhance its performance and reach state-of-the-art performance using a low-cost imaging exam. At this moment, the performance achieved with public datasets by the proposed algorithm is higher than the performance of human specialists using only CT images for HCC detection, even though there is more information available in patient EHR that wasn’t used during diagnosis. This fact does not represent a fair comparison but instigates the research continuation with focus on the enhancements described in this section.
Conclusion
Diseases without pathognomonic symptoms are hard to detect. It is known that early detection of any cancer increases a patient’s survival rates. Therefore, a support decision tool that uses patient’s data already stored in EHR systems to help the detection of HCC can save time for both physicians and patients.
The algorithm proposed in this article fused CT imaging and structured health data to create a CAD tool for HCC. Classification performance achieved in the experiments performed to test the algorithm is closer to the current state-of-the-art but use cheaper diagnostic inputs instead of multiple views of the same MRI or histopathological images. Moreover, the algorithm classification performance is superior to the average diagnostic performance of physicians using only CT images and can be used as a second-opinion tool.
These results sound promising, but the application of the proposed algorithm in real healthcare routines is only possible with further training and experiments using new samples. Enhancements discussed in the article can be done in the algorithm training process before real-life usage to increase its classification performance.
Limitations of the proposed algorithm are the bias of the actions and decisions taken by the researchers, the use of just one dataset to train and evaluate the proposed algorithm, and the synthetic data created to fill missing values, which can affect correlation between attributes and data patterns.
Multimodal architectures as the one described in this article can be applied to detect other diseases which can be diagnosed fusing imaging and patient EHR attributes. This approach is emerging in the literature but looking at how the five human senses are used for decision taking shows that this can be the future for the development of CAD tools. The steps to adapt the proposed architecture for other diseases involve the acquisition of datasets and the fine-tuning process to teach the model the new patterns of the target disease.
Future work to enhance the algorithm described in this article is related mainly to apply new algorithms for image preprocessing, adapt new state-of-the-art CNNs or add new biomarkers or genetic attributes in structured data that has a higher correlation with HCC.
Author Contributions
All authors have made a substantial, direct, intellectual contribution to this study. Menegotto, Cazella and Becker: study concept and design, data analysis, manuscript drafting and critical review for important intellectual content.
Funding
This research did not receive any specific grant from funding agencies in the public, commercial, or not-for-profit sectors.
Availability of data and material
Both image datasets are available for download at https://pyliver-research-data.s3.amazonaws.com/balanced-with-preprocess.tar.gz and https://pyliver-research-data.s3.amazonaws.com/balanced-without-preprocess.tar.gz. Structured health data is available for download at https://github.com/amenegotto/pyLiver/blob/master/csv/clinical_data.csv.
Declarations
Conflicts of interest
The authors declare that they have no conflict of interest.
Code availability
All the source code developed in this article is available at https://github.com/amenegotto/pyLiver.
Footnotes
Publisher's Note
Springer Nature remains neutral with regard to jurisdictional claims in published maps and institutional affiliations.
Contributor Information
Alan Baronio Menegotto, Email: alan.menegotto@gmail.com.
Carla Diniz Lopes Becker, Email: carladiniz@ufcpa.edu.br.
Silvio Cesar Cazella, Email: silvioc@ufcspa.edu.br.
References
- 1.Afdhal N, Bedossa P, Rust M, Han KH, Pinzani M. Non-invasive testsfor evaluation of liver disease severity and prognosis. J Hepatol. 2015;63:237–264. doi: 10.1016/j.jhep.2015.04.006. [DOI] [PubMed] [Google Scholar]
- 2.Attwa MH, El-Etreby SA. Guide for diagnosis and treatment of hepatocellular carcinoma. World J Hepatol. 2015;7(12):1632. doi: 10.4254/wjh.v7.i12.1632. [DOI] [PMC free article] [PubMed] [Google Scholar]
- 3.Balogh J, David Victor III, E.H.A., Burroughs, S.G., Boktour, M., Saharia, A., Li, X., Ghobrial, R.M., Monsour Jr, H.P. Hepatocellular carcinoma: a review. J Hepatocell Carcinoma 2016;3:41. [DOI] [PMC free article] [PubMed]
- 4.Brunetti A, Carnimeo L, Trotta GF, Bevilacqua V. Computer-assisted frameworks for classification of liver, breast and blood neoplasias via neural networks: A survey based on medical images. Neurocomputing. 2019;335:274–298. doi: 10.1016/j.neucom.2018.06.080. [DOI] [Google Scholar]
- 5.Carvalho PB, Pereira E. Imagiological diagnosis of gastrointestinal diseases-diagnostic criteria of hepatocellular carcinoma. GE Portuguese J Gastroenterol. 2015;22(4):153–160. doi: 10.1016/j.jpge.2015.04.002. [DOI] [PMC free article] [PubMed] [Google Scholar]
- 6.Chambolle A. An algorithm for total variation minimization and applications. J Math Imaging Vis. 2004;20(1–2):89–97. [Google Scholar]
- 7.Chaudhary K, Poirion OB, Lu L, Garmire LX. Deep learning-based multi-omics integration robustly predicts survival in liver cancer. Clin Cancer Res. 2018;24(6):1248–1259. doi: 10.1158/1078-0432.CCR-17-0853. [DOI] [PMC free article] [PubMed] [Google Scholar]
- 8.Choi J, Choi J, Rhee W. Interpreting neural ranking models using grad-cam. arXiv preprint arXiv:2005.05768 2020.
- 9.Chollet F. Keras. 2015. https://keras.io. Accessed on: Aug, 2020
- 10.Chollet F. Xception: Deep learning with depthwise separable convolutions. In: Proceedings of the IEEE conference on computer vision and pattern recognition, 2017; pp. 1251–1258.
- 11.Dou T, Zhang L, Zheng H, Zhou W. Local and non-local deep feature fusion for malignancy characterization of hepatocellular carcinoma. In: International Conference on Medical Image Computing and Computer-Assisted Intervention, 2018; pp. 472–479. Springer.
- 12.Dou T, Zhang L, Zhou W. 3d deep feature fusion in contrast-enhanced mr for malignancy characterization of hepatocellular carcinoma. In: 2018 IEEE 15th International Symposium on Biomedical Imaging (ISBI 2018), 2018; pp. 29–33. IEEE.
- 13.Dou T, Zhou W. 2D and 3D Convolutional Neural Network Fusion for Predicting the Histological Grade of Hepatocellular Carcinoma. In: 24th International Conference on Pattern Recognition (ICPR), 2018;pp. 3832–3837. IEEE). 10.1109/ICPR.2018.8545806. https://ieeexplore.ieee.org/document/8545806/
- 14.Erickson BJ, Kirk S, Lee Y, Bathe O, Kearns M, Gerdes C, Lemmerman J. TCGA-LIHC - The Cancer Genome Atlas Liver Hepatocellular Carcinoma [TCGA-LIHC] collection. 2017. 10.7937/K9/TCIA.2016.IMMQW8UQ. https://wiki.cancerimagingarchive.net/display/Public/TCGA-LIHC#49e04d416a274e2c9a1218c4350512e9. Accessed on: Aug, 2020
- 15.Esteva A, Kuprel B, Novoa RA, Ko J, Swetter SM, Blau HM, Thrun S. Dermatologist-level classification of skin cancer with deep neural networks. Nature. 2017;542(7639):115. doi: 10.1038/nature21056. [DOI] [PMC free article] [PubMed] [Google Scholar]
- 16.Galle PR, Forner A, Llovet JM, Mazzaferro V, Piscaglia F, Raoul JL, Schirmacher P, Vilgrain V. Easl clinical practice guidelines: management of hepatocellular carcinoma. J Hepatol. 2018;69(1):182–236. doi: 10.1016/j.jhep.2018.03.019. [DOI] [PubMed] [Google Scholar]
- 17.Goodfellow I, Bengio Y, Courville A. Deep Learning. 1. London: MIT Press; 2016. [Google Scholar]
- 18.Hanna RF, Miloushev VZ, Tang A, Finklestone LA, Brejt SZ, Sandhu RS, Santillan CS, Wolfson T, Gamst A, Sirlin CB. Comparative 13-year meta-analysis of the sensitivity and positive predictive value of ultrasound, ct, and mri for detecting hepatocellular carcinoma. Abdom Radiol. 2016;41(1):71–90. doi: 10.1007/s00261-015-0592-8. [DOI] [PubMed] [Google Scholar]
- 19.He S, Hu XW, Wang D, Han LF, Zhang DC, Wei C. Accuracy of micrornas for the diagnosis of hepatocellular carcinoma: a systematic review and meta-analysis. Clin Res Hepatol Gastroenterol. 2016;40(4):405–417. doi: 10.1016/j.clinre.2016.02.001. [DOI] [PubMed] [Google Scholar]
- 20.Heimbach JK, Kulik LM, Finn RS, Sirlin CB, Abecassis MM, Roberts LR, Zhu AX, Murad MH, Marrero JA. Aasld guidelines for the treatment of hepatocellular carcinoma. Hepatology. 2018;67(1):358–380. doi: 10.1002/hep.29086. [DOI] [PubMed] [Google Scholar]
- 21.Jones E, Oliphant T, Peterson P et al. SciPy: Open source scientific tools for Python. 2019. https://www.scipy.org/. Accessed on: Aug, 2020
- 22.Krizhevsky A, Sutskever I, Hinton GE: ImageNet Classification with Deep Convolutional Neural Networks. In: Proceedings of the 25th International Conference on Neural Information Processing Systems - Volume 1, NIPS’12, 2012;pp. 1097–1105. Curran Associates Inc., USA. http://dl.acm.org/citation.cfm?id=2999134.2999257
- 23.Kumar S, Devapal D. Survey on recent cad system for liver disease diagnosis. In: 2014 International Conference on Control, Instrumentation, Communication and Computational Technologies (ICCICCT), 2014; pp. 763–766. IEEE.
- 24.Lahat D, Adali T, Jutten C. Multimodal data fusion: an overview of methods, challenges, and prospects. Proc IEEE. 2015;103(9):1449–1477. doi: 10.1109/JPROC.2015.2460697. [DOI] [Google Scholar]
- 25.Lee YJ, Lee JM, Lee JS, Lee HY, Park BH, Kim YH, Han JK, Choi BI. Hepatocellular carcinoma: diagnostic performance of multidetector ct and mr imaging-a systematic review and meta-analysis. Radiology. 2015;275(1):97–109. doi: 10.1148/radiol.14140690. [DOI] [PubMed] [Google Scholar]
- 26.Lin H, Wei C, Wang G, Chen H, Lin L, Ni M, Chen J, Zhuo S. Automated classification of hepatocellular carcinoma differentiation using multiphoton microscopy and deep learning. J Biophoton 2019; p. e201800435. [DOI] [PubMed]
- 27.Linehan, M., Gautam, R., Kirk, S., Lee, Y., Roche, C., Bonaccio, E., Jarosz, R.: Radiology Data from The Cancer Genome Atlas Cervical Kidney renal papillary cell carcinoma [KIRP] collection (2016). 10.7937/K9/TCIA.2016.ACWOGBEF. https://wiki.cancerimagingarchive.net/display/Public/TCGA-KIRP#a34f742158a14169822d8a6efc79a063
- 28.Lucchesi FR, Aredes ND. Radiology Data from The Cancer Genome Atlas Stomach Adenocarcinoma [TCGA-STAD] collection. (2016. 10.7937/K9/TCIA.2016.GDHL9KIM. https://wiki.cancerimagingarchive.net/display/Public/TCGA-STAD#83f2a7e42a374981b8085c22815065d6
- 29.Luo P, Wu S, Yu Y, Ming X, Li S, Zuo X, Tu J. Current status and perspective biomarkers in afp negative hcc: Towards screening for and diagnosing hepatocellular carcinoma at an earlier stage. Pathol Oncol Res. 2019;1:1–5. [DOI] [PubMed]
- 30.Menegotto AB, Becker CDL, Cazella SC. Computer-aided hepatocarcinoma diagnosis using multimodal deep learning. In: International Symposium on Ambient Intelligence, 2019; pp. 3–10. Springer.
- 31.Miotto R, Li L, Dudley JT. Deep learning to predict patient future diseases from the electronic health records. In: Lecture Notes in Computer Science (including subseries Lecture Notes in Artificial Intelligence and Lecture Notes in Bioinformatics), 2016; pp. 768–774.
- 32.Mousania Y, Karimi S. Contrast improvement of ultrasound images of focal liver lesions using a new histogram equalization. In: Fundamental Research in Electrical Engineering, 2019; pp. 43–53. Springer.
- 33.National Cancer Institute Clinical Proteomic Tumor Analysis Consortium: Radiology Data from the Clinical Proteomic Tumor Analysis Consortium Pancreatic Ductal Adenocarcinoma [CPTAC-PDA] Collection (2018). 10.7937/k9/tcia.2018.sc20fo18. https://wiki.cancerimagingarchive.net/display/Public/CPTAC-PDA#81570df507e4478e83710196b5b1f6c1. Accessed on: Aug, 2020
- 34.Nezhad MZ, Zhu D, Li X, Yang K, Levy P. Safs: A deep feature selection approach for precision medicine. In: 2016 IEEE International Conference on Bioinformatics and Biomedicine (BIBM), 2016; pp. 501–506. IEEE.
- 35.Omer AA, Hassan OI, Ahmed AI, Abdelrahman A. Denoising ct images using median based filters: a review. In: 2018 International Conference on Computer, Control, Electrical, and Electronics Engineering (ICCCEEE), 2018; pp. 1–6. IEEE.
- 36.Pedregosa F, Varoquaux G, Gramfort A, Michel V, Thirion B, Grisel O, Blondel M, Prettenhofer P, Weiss R, Dubourg V, Vanderplas J, Passos A, Cournapeau D, Brucher M, Perrot M, Duchesnay E. Scikit-learn: machine learning in python. J Mach Learn Res. 2011;12:2825–2830. [Google Scholar]
- 37.Pizer SM, Amburn EP, Austin JD, Cromartie R, Geselowitz A, Greer T, ter Haar Romeny B, Zimmerman JB, Zuiderveld K. Adaptive histogram equalization and its variations. Comput Vision Graphics Image Process. 1987;39(3):355–368. doi: 10.1016/S0734-189X(87)80186-X. [DOI] [Google Scholar]
- 38.Qu J, Hiruta N, Terai K, Nosato H, Murakawa M, Sakanashi H. Gastric pathology image classification using stepwise fine-tuning for deep neural networks. J Healthcare Eng. 2018;2018:1–13. doi: 10.1155/2018/8961781. [DOI] [PMC free article] [PubMed] [Google Scholar]
- 39.Sidar I, Davidson T, Kronman A, Lior M, Levy I. Endoscopic image enhancement using contrast limited adaptive histogram equalization (clahe) implemented in a processor. 2019. US Patent 10,516,865
- 40.Simonyan K, Zisserman A. Very deep convolutional networks for large-scale image recognition. In: 3rd International Conference on Learning Representations, ICLR 2015, San Diego, CA, USA, May 7-9, 2015, Conference Track Proceedings. 2015.
- 41.Singal AG, Pillai A, Tiro J. Early detection, curative treatment, and survival rates for hepatocellular carcinoma surveillance in patients with cirrhosis: a meta-analysis. PLoS Med. 2014;11(4):e1001624. doi: 10.1371/journal.pmed.1001624. [DOI] [PMC free article] [PubMed] [Google Scholar]
- 42.Szegedy C, Liu W, Jia Y, Sermanet P, Reed S, Anguelov D, Erhan D, Vanhoucke V, Rabinovich A. Going deeper with convolutions. In: Proceedings of the IEEE conference on computer vision and pattern recognition, 2015; pp. 1–9.
- 43.Szegedy C, Vanhoucke V, Ioffe S, Shlens J, Wojna Z. Rethinking the inception architecture for computer vision. In: Proceedings of the IEEE conference on computer vision and pattern recognition, 2016; pp. 2818–2826.
- 44.Tsai WC, Kung PT, Wang YH, Kuo WY, Li YH. Influence of the time interval from diagnosis to treatment on survival for early-stage liver cancer. PLoS ONE. 2018;13(6):e0199532. doi: 10.1371/journal.pone.0199532. [DOI] [PMC free article] [PubMed] [Google Scholar]
- 45.Wang J, Jain S, Chen D, Song W, Hu CT, Su YH. Development and evaluation of novel statistical methods in urine biomarker-based hepatocellular carcinoma screening. Sci Rep. 2018;8(1):3799. doi: 10.1038/s41598-018-21922-9. [DOI] [PMC free article] [PubMed] [Google Scholar]
- 46.Wang Q, Zhang L, Xie Y, Zheng H, Zhou W. Malignancy characterization of hepatocellular carcinoma using hybrid texture and deep features. In: 2017 IEEE International Conference on Image Processing (ICIP), 2017; pp. 4162–4166. IEEE. 10.1109/ICIP.2017.8297066
- 47.Wang X, Wang Q. Alpha-fetoprotein and hepatocellular carcinoma immunity. Can J Gastroenterol Hepatol. 2018;2018:9049252 [DOI] [PMC free article] [PubMed]
- 48.World Health Organization: Cancer fact sheets. 2018. https://www.who.int/news-room/fact-sheets/detail/cancer. Accessed on: Aug, 2020
- 49.Yadav S, Shukla S. Analysis of k-fold cross-validation over hold-out validation on colossal datasets for quality classification. In: 2016 IEEE 6th International Conference on Advanced Computing (IACC), 2016; pp. 78–83. IEEE.
- 50.Yan X, Pang J, Qi H, Zhu Y, Bai C, Geng X, Liu M, Terzopoulos D, Ding X. Classification of lung nodule malignancy risk on computed tomography images using convolutional neural network: A comparison between 2d and 3d strategies. In: Asian Conference on Computer Vision, 2016; pp. 91–101. Springer.
- 51.Yuan Y, Shi Y, Li C, Kim J, Cai W, Han Z, Feng DD. Deepgene: an advanced cancer type classifier based on deep learning and somatic point mutations. BMC Bioinformatics. 2016;17(17):476. doi: 10.1186/s12859-016-1334-9. [DOI] [PMC free article] [PubMed] [Google Scholar]
- 52.Zhou W, Wang G, Xie G, Zhang L. Grading of hepatocellular carcinoma based on diffusion weighted images with multiple b-values using convolutional neural networks. Med Phys 2019;46(9):3951-3960 [DOI] [PubMed]
Associated Data
This section collects any data citations, data availability statements, or supplementary materials included in this article.
Data Availability Statement
Both image datasets are available for download at https://pyliver-research-data.s3.amazonaws.com/balanced-with-preprocess.tar.gz and https://pyliver-research-data.s3.amazonaws.com/balanced-without-preprocess.tar.gz. Structured health data is available for download at https://github.com/amenegotto/pyLiver/blob/master/csv/clinical_data.csv.