

Abstract
The evolutionary and adaptive potential of a pathogen is a key determinant for successful host colonization and proliferation but remains poorly known for most of the pathogens. Here, we used experimental evolution combined with phenotyping, genomics, and transcriptomics to estimate the adaptive potential of the bacterial plant pathogen Ralstonia solanacearum to overcome the quantitative resistance of the tomato cultivar Hawaii 7996. After serial passaging over 300 generations, we observed pathogen adaptation to within-plant environment of the resistant cultivar but no plant resistance breakdown. Genomic sequence analysis of the adapted clones revealed few genetic alterations, but we provide evidence that all but one were gain of function mutations. Transcriptomic analyses revealed that even if different adaptive events occurred in independently evolved clones, there is convergence toward a global rewiring of the virulence regulatory network as evidenced by largely overlapping gene expression profiles. A subset of four transcription regulators, including HrpB, the activator of the type 3 secretion system regulon and EfpR, a global regulator of virulence and metabolic functions, emerged as key nodes of this regulatory network that are frequently targeted to redirect the pathogen’s physiology and improve its fitness in adverse conditions. Significant transcriptomic variations were also detected in evolved clones showing no genomic polymorphism, suggesting that epigenetic modifications regulate expression of some of the virulence network components and play a major role in adaptation as well.
Keywords: experimental evolution, adaptive potential, fitness measure, genomic polymorphisms, transcriptomic variation, bacterial plant pathogen
Introduction
Plant–pathogen interaction is in constant evolution through an arms race of pathogen attack and plant defense (Jones and Dangl 2006). The evolutionary and adaptive potential of a pathogen is a crucial determinant for successful host colonization and proliferation. Characterizing the adaptive potential of a pathogen is therefore important to guide strategies for durable resistance breeding.
In bacterial plant pathogens, the evolutionary potential depends on three main factors: 1) their potential for gene flow between geographically separated populations, 2) gene exchange between individuals through horizontal gene transfers, and 3) genomic (or epigenomic) modifications (McDonald and Linde 2002). Several types of genomic modifications could occur and have a severe impact on the bacterial phenotype such as single nucleotide polymorphisms (SNPs), insertions, inversions, deletions, translocations, mobile element insertions, duplications, or large genomic rearrangements. These genomic modifications are specifically important for bacterial pathogen evolution because bacterial pathogens exist as large populations in their host thus enhancing the probability to new mutants with higher fitness to multiply within the population before the mutation is lost through genetic drift.
An elegant approach to investigate the adaptive potential of bacteria through genomic modifications is to study its evolution in real time by conducting an experimental evolution. In this approach, adaptation of the experimentally evolved isolates occur by natural selection in the experimental environment by competing bacteria from the later generation against the ancestral strain (Ebert 1998; Lenski 2017). Whole-genome sequencing of the experimentally evolved isolates and comparison with the ancestral strain genomic sequence allows the detection of all genomic modifications that appeared during experimental evolution (Tenaillon et al. 2012; Barrick and Lenski 2013). This approach has been used to investigate the genomic bases of adaptation of bacterial plant pathogen to their host plant (Guidot et al. 2014; Trivedi and Wang 2014; Meaden and Koskella 2017).
Variable adaptive strategies could occur according to the genetic background conferring resistance of the host plant against pathogens. Plant disease resistance is usually divided into qualitative and quantitative resistance (Poland et al. 2009). Qualitative resistance is controlled by major resistance (R) gene(s), whereas quantitative resistance involves multiple genes or quantitative resistance loci (QRL) with small to moderate effects (Corwin and Kliebenstein 2017). R gene usually confers complete resistance to a specific pathogen inducing a hypersensitive cell death response (HR) at the infection site. However, pathogens can rapidly overcome this resistance through mutations in effectors recognized by the R genes or through acquisition of new effectors by horizontal gene transfers (Jones and Dangl 2006). An experimental evolution conducted with the bacterial plant pathogen Xanthomonas citri subsp. citri on a resistant host plant inducing an HR experimentally demonstrated that the pathogen rapidly overcome the plant resistance through mutations biased toward type 3 secretion system (T3SS) effector genes (Trivedi and Wang 2014). Pathogens also evolve to overcome plant quantitative resistance. However, this evolution is more difficult to detect and is better characterized as a process of “erosion” rather than a process of breakdown (McDonald and Linde 2002). In this study, we used an experimental evolution approach to characterize the adaptive potential of a strain from the Ralstonia solanacearum species complex (RSSC) to overcome the quantitative resistance of tomato.
Strains of the RSSC are responsible for the bacterial wilt disease on more than 250 plant species including economically important crops (Peeters et al. 2013). RSSC strains are recognized as one of the most lethal plant bacterial pathogens with a worldwide geographical distribution (Hayward 1991; Mansfield et al. 2012). Bacteria survive in soil for many years and spread through water, rhizosphere contact, and farming (Genin and Boucher 2004; Genin 2010; Song et al. 2018). They enter the plant through the roots, invades the xylem vessels, and spreads rapidly to aerial parts of the plant through the vascular system (Genin 2010). Within a few days of infection, the bacteria reach high population levels by extensive colonization (up to 1010 colony-forming units per gram of fresh weight) that leads to vascular clogging causing wilting symptoms and ultimately plant death (Peeters et al. 2013). The potential of this pathogen to evolve and adapt to numerous host plants substantiates the field observations of the emergence of strains that colonize new hosts (Hayward 1991; Wicker et al. 2007; Wicker et al. 2009). Various strategies are used to control the bacterial wilt disease such as crop rotation, chemical and biological controls but the use of resistant cultivars remains the most effective control strategy (Lebeau et al. 2011). However, resistance breakdown is continuously observed in the field and breeders have to face the problem of resistance durability against this pathogen.
In tomato, the reference resistant cultivar against the bacterial wilt disease is the cultivar Hawaii 7996 which has the most stable source of resistance against different RSSC strains in the field (Lebeau et al. 2011; Wang et al. 2013). Resistance of Hawaii 7996 to bacterial wilt relies on polygenic traits (Thoquet et al. 1996; Carmeille et al. 2006) and is expressed in both root and shoot tissues (Planas-Marquès et al. 2020). Several QRL controlling RSSC bacterial wilt have been identified (Thoquet et al. 1996; Carmeille et al. 2006; Wang et al. 2013). The products and functions of these QRL are still unknown but they appear to confine the bacteria to the primary xylem vessels, even when large amounts of bacteria are injected into the stem (McGarvey et al. 1999; Nakaho et al. 2004). Structure of the rhizosphere microbiome was also shown to be a key parameter of Hawaii 7996 resistance (Kwak et al. 2018). Here, we conducted an evolution experiment with the RSSC strain GMI1000 by serial passages during 300 bacterial generations on the resistant tomato cultivar Hawaii 7996. Five independent lineages of derived clones were generated and phenotypic analyses were conducted on 25 derived clones to measure their fitness gain. The appearance of bacterial wilt symptoms on Hawaii 7996 was followed at each passage. The genome and transcriptome of ten evolved clones were characterized and compared to that of the ancestral clone. The contribution of the genomic modifications to the enhanced fitness in Hawaii 7996 was then functionally investigated.
Results
Experimental Evolution of GMI1000 Strain on the Resistant Tomato Hawaii 7996
Experimental evolution of RSSC strain GMI1000 was performed by serial passage experiment (SPE) into the stem of the tomato cultivar Hawaii 7996. SPEs were conducted by inoculating the bacteria directly into the plant stem in order to control the number of colony-forming unit (CFU) transferred from one plant to the other and to maintain a homogeneous selective environment during the course of the experiment. Bacteria were recovered from the plant stem 15 days postinoculation by natural diffusion into water and immediately reinoculated into the stem of a healthy tomato Hawaii 7996 plant. Five biological SPE replicates were conducted in parallel thus generating five populations (named “A,” “B,” “C,” “D,” and “E”) of clones derived from the same GMI1000 ancestral clone.
The average estimated number of bacterial generations at each SPE was 9 ± 3 (mean ± SD). A total number of 35 SPE was then necessary to reach at least 300 bacterial generations into Hawaii 7996 which corresponded to 525 days of experimental evolution. The low number of generations obtained by this calculation is undoubtedly underestimated, not taking into account a probable mortality of some of the bacteria in the plant. During the course of the experimental evolution, no wilting symptom were detected and the in planta growth rate of the GMI1000 strain did not increase by remaining around 108 CFU/g of fresh weight after 15 days of infection (supplementary fig. S1, Supplementary Material online). The inoculated populations reached densities above the quorum-sensing threshold (estimated around 107 CFU/ml; Flavier et al. 1997; Peyraud et al. 2016) which is sufficient to fully induce virulence gene expression.
Obtaining Experimentally Derived Clones Showing Fitness Gain
At the end of the experimental evolution, we compared the fitness of the derived clones to the fitness of the ancestral clone into the stem of Hawaii 7996 by conducting competition experiments. In these experiments, the ancestral clone (tagged with a gentamycin resistance cassette) was coinoculated with a derived clone at the same proportion into the stem of a same plant. A competitive index (CI) was calculated (see Materials and Methods) and used as a fitness estimator. The CI was determined for 25 derived clones representing five clones randomly isolated from each of the five independent populations obtained after 35 SPEs. These clones were named “Haw35” followed by a letter corresponding to the population they originate from, and a number (e.g., “Haw35a1” is clone number 1 from population A obtained after 35 SPEs on Hawaii 7996; Haw35a1 could also be named “a1” to simplify). As a control, the ancestral clone was coinoculated with the gentamycin-resistant variant of the ancestral clone.
The CI obtained for the ancestral clone and each of the 25 tested derived clones are shown in figure 1. During this CI experiments, the cell densities for both the tested clone and the gentamycin-resistant variant were around 109 CFU/g of fresh weight after 15 days of infection (supplementary table S1, Supplementary Material online). The CI for the ancestral GMI1000 clone was not significantly different from one thus demonstrating that the gentamycin-resistant cassette did not affect the in planta fitness of the bacteria, the wild-type (WT) strain, and its gentamycin-resistant derivative having the same fitness into Hawaii 7996. The CI values obtained for the 25 tested derived clones were all (but one) significantly superior to one thus demonstrating that all these derived clones (but the c3 clone) have a better fitness than their ancestral clone into the stem of Hawaii 7996 (fig. 1).
Fig. 1.

Box plot of the CI values of the control ancestral GMI1000 clone and the derived clones on tomato Hawaii 7996. All the strains were competed by GRS540 (GMI1000 carrying a Gm resistance cassette). The CI was measured for 25 of the clones derived from GMI1000 after experimental evolution during ∼300 bacterial generations into the stem of the Hawaii 7996. These 25 clones represent five clones randomly isolated from each five independent populations generated by SPE (populations A, B, C, D, and E). A minimum of ten replicates were performed for each clone. Statistical analyses were performed using Wilcoxon test (***P ≤ 0.001). The Y axis gives exponential values of the CI. Extreme individual values (outliers) are represented by empty dots. The black bar inside the box plot indicates the median CI value.
The mean CI for these experimentally evolved clones was 4.96 ± 0.36 (mean ± SE). Comparison of the mean CI for each of the five populations of experimentally evolved clones revealed a significantly better adaptation to Hawaii 7996 for clones of populations A and B than for other clones, the mean CI for these two populations being 5.46 ± 0.75 and 9.80 ± 1.35 (mean ± SE), respectively, whereas the mean CI for the populations C, D, and E were 3.28 ± 0.52, 3.50 ± 0.52, and 3.19 ± 0.41, respectively (table 1). This more rapid adaptation observed for A and B clones could be due either to a more rapid accumulation of adaptive mutations or to the fixation of different adaptive mutations than in the other populations.
Table 1.
Comparison of the Mean CI Values between Populations of Evolved Clones.
| Population A | Population B | Population C | Population D | Population E | |
|---|---|---|---|---|---|
| Mean CI = 5.46 | Mean CI = 9.80 | Mean CI = 3.28 | Mean CI = 3.50 | Mean CI = 3.19 | |
| SE = 0.75 | SE = 1.35 | SE = 0.52 | SE = 0.52 | SE = 0.41 | |
| Population B | 1.19E−4 | ||||
| Population C | 0.02289 | 5.69E−10 | |||
| Population D | 0.0424 | 4.71E−11 | 0.6972 | ||
| Population E | 0.01017 | 2.44E−11 | 0.7894 | 0.4157 |
Note.—Mean CI values were compared using a Wilcoxon test and the table gives the obtained P value. The CI was measured for a total of five clones per population. Significant differences between mean CI are highlighted in gray.
Genomic Resequencing Reveals That Fittest Bacteria Carry Few or No Genetic Changes
In order to identify the genomic polymorphisms associated to fitness gain during experimental evolution, the whole genomes of ten adapted clones (two per population) were sequenced using both Illumina and Pacbio sequencing technologies. The Illumina sequencing technology was used for the detection of SNPs and small Insertion–Deletion (InDels). The PacBio sequencing technology was used for the detection of large genomic rearrangements.
Comparison of the GMI1000 ancestral clone and the evolved clones genomic sequences revealed between zero and two genomic polymorphisms per clone (table 2). Rather surprisingly, despite the use of two efficient and complementary sequencing technologies, no genomic polymorphism could be detected in five of the ten adapted clones studied, including one clone from population A (the Haw35a4 clone) as well as the four clones from populations C and D. One mutation was detected in the clones Haw35a1, Haw35b1, and Haw35e1, and two mutations were identified in the clones Haw35b4 and Haw35e3 (table 2).
Table 2.
List of Genomic Polymorphisms between the Ancestral GMI1000 Clone and the Experimentally Evolved Clones.
| Gene |
Clones Evolved on Hawaii7996 |
|||||||||||
|---|---|---|---|---|---|---|---|---|---|---|---|---|
| ID | Name | Description | a1 | a4 | b1 | b4 | c1 | c2 | d3 | d5 | e1 | e3 |
| Rsc3094 | Hypothetical protein | G486A | ||||||||||
| R162R | ||||||||||||
| Rsp0048 | soxA1 | Sarcosine oxidase alpha subunit | T1915C | |||||||||
| C639R | ||||||||||||
| Rsp0309 | prhP | Phenolic acid decarboxylase regulator (PadR)-like | ISrso9 | |||||||||
| −6 | ||||||||||||
| Rsp1136 | ISrso18 Transposase protein | C-218A | C-218A | |||||||||
| Rsp1574 | Transcription regulator protein | G283T | G283T | |||||||||
| V95L | V95L | |||||||||||
Note.—For each gene, the genomic polymorphism is indicated. For SNPs, both the nucleotide modification and the protein modification are indicated with the original nucleotide or amino acid, the position and the new nucleotide or amino acid. ISrso9 indicates an IS insertion and the number indicates the position of the insertion. The “-” indicates a mutation upstream the start codon of the gene.
The detected genomic polymorphisms were either SNPs or Insertion sequence (IS) insertion. Four SNPs were detected, two were nonsynonymous mutations, one was a synonymous mutation, and one mutation was detected in an intergenic region. The first nonsynonymous mutation occurred in one of the two investigated clones from population A (the Haw35a1 clone) and affected the RSp0048 gene encoding the SoxA1 protein (Sarcosine oxidase alpha subunit) (table 2). The second nonsynonymous mutation was identified in the two investigated clones from population B (Haw35b1 and Haw35b4) and affected the RSp1574 gene encoding a transcription regulator of unknown function (table 2). The synonymous mutation was detected in one of the two investigated clones from population E (Haw35e3) in the RSc3094 gene encoding a hypothetical protein (table 2). The mutation in the intergenic region was identified in the two investigated clones from population E (Haw35e1 and Haw35e3) and occurred between the RSp1136 gene encoding an IS transposase protein and the RSp1137 gene encoding a transmembrane protein (table 2). The IS insertion was detected six nucleotides before the start codon (and so presumably in the ribosomal binding site) of the RSp0309 gene encoding the PrhP protein (phenolic acid decarboxylase regulator) (Zhang et al. 2019). This IS insertion occurred in one of the two investigated clones from population B (Haw35b4) (table 2). All the detected SNPs and IS insertion were confirmed by polymerase chain reaction (PCR) amplification of the mutated region and either Sanger sequencing or gel electrophoresis, respectively.
The Genomic Polymorphisms Detected in the Five Adapted Clones Are Gain of Function Mutations
In order to investigate the fitness advantage of the genomic polymorphisms detected in the adapted clones Haw35a1, Haw35b1, Haw35b4, Haw35e1, and Haw35e3, we created each mutation in the ancestral clone. Five GMI1000 mutants were first generated, mAG68 carrying the soxA1C639R SNP, mAG69 carrying the RSp1574V95L SNP, mAG70 carrying the ISrso9 insertion in the promotor region of the prhP gene (prhPIS-6), mAG71 carrying the RSc3094R162R SNP, and mAG72 carrying the SNP in the RSp1136–1137 intergenic region (RSp1136C-218A). The fitness advantage of these mutations were measured by conducting competitive experiments with the GMI1000 WT strain into the stem of Hawaii 7996. These experiments revealed that all the generated mutants had a CI significantly superior to one thus demonstrating that all the mutants had a better fitness in Hawaii 7996 than the WT strain (fig. 2).
Fig. 2.

Box plot of the CI values of GMI1000 and allelic mutants on tomato Hawaii 7996. mAG68, mAG69, mAG70, mAG71, and mAG72 carry the mutation soxA1C639R, RSp1574V95L, prhPIS-6, RSc3094R162R, and RSp1136C-218A SNP, respectively. A minimum of ten replicates were performed for GMI1000 and each allelic mutant. Statistical analyses were performed using Wilcoxon test. Different letters indicate significantly different CI values (P < 0.05) (see fig. 1 for legend).
When comparing the CI values obtained for each mutant, we found that the CI values of the mAG68 and mAG69 mutants carrying the soxA1C639R and RSp1574V95L SNPs, respectively, were significantly superior to the CI values of the three other mutants (fig. 2). This result suggested that the soxA1C639R and the RSp1574V95L SNPs gave a better fitness advantage than the other mutations. The CI values obtained for the mutants mAG69, mAG71, and mAG72 carrying the mutations RSp1574V95L, RSp1136C-218A, and RSc3094R162R, respectively, fully replicated the levels of fitness gain displayed by the corresponding evolved clones (b1, e3, and e1, respectively; figs. 1 and 2). However, this was not true for the mutants mAG68 and mAG70 carrying the mutations soxA1C639R and prhPIS-6, respectively, for which the CI values were less than the CI values of their corresponding evolved clones (a1 and b4, respectively; figs. 1 and 2). The second mutation, RSp1574V95L, detected in b4 could explain this difference. However, for a1, no other mutation was detected, thus suggesting a role of other epigenetic modification in the fitness gain of a1.
In order to test the hypothesis that fitness gain was associated with a loss of function mutation for the three SNPs detected into the coding region of the soxA1, RSp1574, and RSc3094 genes, we deleted each of these genes in the GMI1000 strain. Competitive experiments into the stem of Hawaii 7996 between each of these three deleted mutants and the WT strain revealed that the mutants were less fit than the GMI1000 WT strain into this tomato stem. Indeed, the CI obtained for these three deleted mutants are significantly inferior to one (fig. 3). These analyses demonstrated that the SNPs that appeared during experimental evolution did not cause any loss of function of the genes but rather enhanced the functionalities of the corresponding proteins.
Fig. 3.
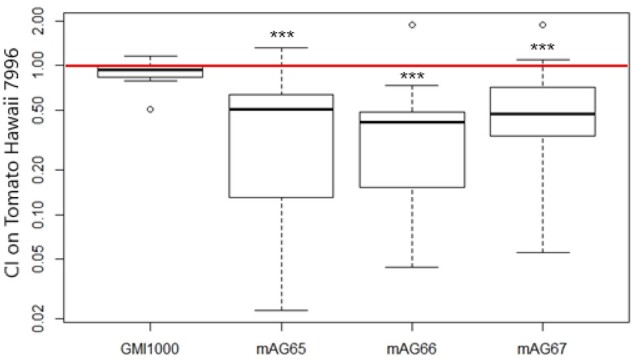
Box plot of the CI values of GMI1000 and unmarked deletion mutants on tomato Hawaii 7996. mAG65, mAG66, and mAG67 correspond to ΔsoxA1, ΔRSp1574, and ΔRSp3094 respectively. A minimum of ten replicates were performed for GMI1000 and each deletion mutant. Statistical analyses were performed using Wilcoxon test (***P ≤ 0.001) (see fig. 1 for legend).
Some Fitness Gains on Resistant Tomato Are Associated with Increased Growth Rates
To evaluate the metabolic efficiency of the evolved clones, we determined their growth rates from in vitro cultures, using minimal medium (MM) supplemented either with glutamine (the most abundant amino acid in tomato xylem) (Zuluaga et al. 2013) or proline, a discriminant marker of metabolic versatility of GMI1000 strain (Perrier et al. 2016; Peyraud et al. 2016). These analyses were conducted for the ten adapted clones sequenced previously, the three deleted mutants and the five reconstructed allelic mutants, all compared with the WT GMI1000 strain. We also used as positive control, the efpR-deleted mutant, which is characterized by both enlarged metabolic diversity and enhanced growth rate in the tested media (Perrier et al. 2016). Four of the ten evolved clones (a1, b1, b4, and c1) had a growth rate significantly higher than their WT ancestor in MM + glutamine (fig. 4A). In MM + proline, the growth of the WT is greatly reduced but the same four clones also acquired an increase in growth rate (fig. 4B). Two groups of clones were distinguished: a1 and c1, which had a growth rate in glutamine and proline similar to the one of the efpR mutants, and b1 and b4 with an intermediate gain in the growth rate. These results suggested that these four clones could probably multiply better than the ancestor in planta, but also indicated that fitness gain was not associated with apparent increased growth rate in the remaining six evolved clones.
Fig. 4.

In vitro growth rate of evolved clones and engineered mutants in MM supplemented with (A) 20 mM glutamine and (B) 20 mM proline. The clones were grown at 28 °C under shaking and the OD600nm was measured until 50 h. Growth rate was calculated during the exponential growth phase. The deleted mutants mAG65, mAG66, and mAG67 correspond to ΔsoxA1, ΔRSp1574, and ΔRSp3094, respectively. The allelic mutants mAG68, mAG69, mAG70, mAG71, and mAG72 carry the mutation soxA1C639R, RSp1574V95L, prhPIS-6, RSc3094R162R, and RSp1136C-218A SNP, respectively. Statistical analysis was performed using Welch t-test. Different letters indicate significantly different growth rates (P < 0.01).
Concerning the deleted and allelic mutants, only the mAG69 allelic mutant, carrying the RSp1574V95L mutation detected in both b1 and b4, had a growth rate in glutamine and proline significantly better than the WT strain (Welch t-test; P value = 0.0038 on glutamine; P value = 1.03E−6 on proline). Increase in growth rate was in a range similar to that of the adapted clones b1 and b4 (fig. 4). This result suggested that the improved growth rate of these two clones in glutamine- and proline-containing environments depends on the RSp1574V95L mutation, which thus contributes to the observed fitness gain in planta.
Evidence for Significant Transcriptomic Variations in Evolved Clones Showing No Genomic Polymorphism
To obtain a broader picture of the physiological changes in the better-adapted clones isolated from Hawaii 7996, we studied potential variation of their transcriptomic profile compared with the ancestral founder. We included in this analysis several of the clones for which no genetic alteration could be detected. We thus established the transcriptomes of the ten adapted clones sequenced previously and the GMI1000 ancestral clone using an RNA-sequencing (RNA-seq) approach of strains grown in MM supplemented with 10 mM glutamine.
Analysis of RNA-seq data revealed that all samples rendered between 1.3 and 4.7 million of GMI1000-mapped reads. Differentially expressed genes (DEGs) between an adapted clone and the ancestral clone were considered as those presenting an absolute fold change between strain |FC| > 2 and an false discovery rate (FDR)-adjusted P value (Padj, FDR) < 0.05. Using these cutoff values, we found between 125 and 1,227 DEGs in the ten investigated adapted clones compared with the ancestral clone (see table 3 for summary and complete lists in supplementary table S2, Supplementary Material online). It thus appeared that a significant variation from the WT transcriptomic pattern were recorded in clones in which no genetic alteration could be identified, going up to 900 DEGs in clone c1. Remarkably, this c1 clone is characterized by a significant variation in the expression pattern of major global/virulence regulators, such as efpR (Perrier et al. 2016) and hrpB, the T3SS regulon transcriptional activator (Genin et al. 1992), or the lecM gene that contributes to the quorum-sensing-dependent virulence signaling pathway (Hayashi et al. 2019) (table 3). In the other clones carrying no genetic polymorphism, the number of DEGs is more modest (from 125 to 270 genes) but remains significant. Interestingly, several of these clones with no genetic change showed an obvious overlap in their transcriptomic signatures (see below).
Table 3.
DEGs between the Clones Experimentally Adapted to Hawaii 7996 and the Ancestral GMI1000 Strain.
| Clones Evolved on Hawaii 7996 |
||||||||||
|---|---|---|---|---|---|---|---|---|---|---|
| a1 | a4 | b1 | b4 | c1 | c2 | d3 | d5 | e1 | e3 | |
| Mutation | soxA1C639R | RSp1574V95L | RSp1574V95L | RSp1136C-218A | RSp1136C-218A | |||||
| prhPIS-6 | RSc3094R162R | |||||||||
| Mean CI value | 8.6 | 7.2 | 6.5 | 12.9 | 4.2 | 4.0 | 5.4 | 4.1 | 3.8 | 5.4 |
| Median CI value | 7 | 2.1 | 5.1 | 8.9 | 2.1 | 2.1 | 2.6 | 2.4 | 1.7 | 2.0 |
| No. of DEGs | 1,227 | 187 | 478 | 503 | 902 | 272 | 125 | 269 | 245 | 212 |
| Downregulated genes | 617 | 148 | 275 | 290 | 481 | 199 | 91 | 201 | 177 | 154 |
| Upregulated genes | 610 | 39 | 203 | 213 | 421 | 73 | 34 | 68 | 68 | 58 |
| Varying expression of known virulence regulators | ||||||||||
| efpR | Down (logFC = −3.65) | Down (logFC = −1.91) | ||||||||
| hrpB | Down (logFC = −1.38) | Down (logFC = −1.68) | Down (logFC = −1.56) | |||||||
| hrpG | Down (logFC = −1.21) | |||||||||
| prhI | Up (logFC = 1.70) | Up (logFC = 1.30) | ||||||||
| prhP | Down (logFC = −1.28) | Down (logFC = −6.36) | ||||||||
| lecM | Down (logFC = −4.46) | Down (logFC = −2.44) | Down (logFC = −1.80) | Down (logFC = −4.86) | ||||||
| xpsR | Down (logFC = −1.10) | |||||||||
| Main deregulated functions (GO enrichment analysis) a | ||||||||||
| Protein secretion | Down | Down | Down | Down | ||||||
| Integral component of membrane | Down | Down | Down | Down | ||||||
| Macromolecule localization | Down | Down | Down | |||||||
| Transaminase activity | Down | Down | Down | Down | ||||||
| Secondary metabolite biosynthetic and metabolic process | Up | Up | Up | |||||||
| Bacterial-type flagellum assembly and organization | Up | Up | ||||||||
| Chemotaxis | Up | Up | ||||||||
| Fatty acid biosynthetic and metabolic process | Up | Up | ||||||||
| Locomotion | Up | Up | ||||||||
| Monocarboxylic acid biosynthetic process | Up | Up | ||||||||
| Receptor activity | Up | Up | ||||||||
| Signal transducer activity | Up | Up | ||||||||
| Signaling receptor activity | Up | Up | ||||||||
| Structural molecule activity | Up | Up | ||||||||
| Transmembrane receptor activity | Up | Up | ||||||||
Note.—Genes were considered as differentially expressed when the absolute log fold change |logFC| > 1 and the FDR-adjusted P value (Padj, FDR) < 0.05.
Full list of functions and statistical threshold used is provided in supplementary table S4, Supplementary Material online.
A Convergent Transcriptomic Signature in a Majority of Independently Evolved Clones
In agreement with the previous observations, the number of DEGs in each of the investigated evolved clones was not correlated to the number of mutations detected in the corresponding genomes. For example, the highest number of DEGs (1,227 DEGs) was identified in the a1 clone carrying a single mutation, whereas the b4 and e3 clones, both carrying two mutations, had 503 and 212 DEGs, respectively (table 3).
Because the b1 and b4 clones both carried mutations presumably altering transcriptional regulator functions, we first sought to identify common regulatory targets or overlap with known PrhP targets (Zhang et al. 2019). b1 and b4 share 225 common DEGs, but rather surprisingly, when the comparison includes other clones such as a1 or c1 which do not carry the RSp1574 mutation, the number of genes specifically shared between b1 and b4 drops to 22 (supplementary fig. S2, Supplementary Material online). Seventeen out of these 22 genes are upregulated, which suggests that the RSp1574 mutation conferred gain-of-function for a transcription factor with enhanced activating abilities. Among these, 17 upregulated genes are found the RSp1575 and RSp1576 genes, just neighboring RSp1574, and which both encode transporters for unknown molecules (supplementary fig. S2, Supplementary Material online). Four additional transporters belong to this group of upregulated genes, raising the hypothesis that the fitness gain associated to the RSp1574 mutation is due to an increased uptake of metabolic compounds in planta.
The prhP regulatory gene appeared downregulated in two different populations: First, an IS movement was detected in the b4 clone with insertion of the transposable element just 6 bp upstream of the prhP start codon, thus probably leading to gene inactivation (table 2). This was confirmed by the transcriptome analysis of clone b4 where the strongest downregulated gene is indeed RSp0309 (prhP) (supplementary table S2, Supplementary Material online). Second, we identified that prhP was also downregulated in the a1 clone (table 3). When comparing the DEGs from the a1 and b4 clones with the previously identified prhP-dependent targets (Zhang et al. 2019), relatively few overlap was found. PrhP was shown to control expression of the T3SS which is also downregulated in the a1 and b4 clones, but several other PrhP targets (e.g., the type IV pili and flagellar genes or the phenolic acid degradation genes) do not follow this pattern in a1 and b4. This observation suggested that prhP is probably an important regulatory node to be downregulated or inactivated, but a complex rewiring of the global regulatory network must take place to lead to partial expression of the PrhP regulon.
A wider comparison of DEG repertoires among clones originating from different populations revealed an indisputable overlap in the transcriptomic profiles of adapted clones, which does not depend solely on common genetic polymorphisms. Figure 5 illustrates the DEG repertoire relationship between five clones originating from four independent evolved populations and reveals a strong convergence of the transcriptomic signatures. For example, clone c1 has up to 85% of its DEGs shared with the four other independently evolved clones. The average overlap of DEGs for each of the five clones ranged from 53% to 85%, whether for down- or upregulated genes. This convergence in terms of transcriptomic response can sometimes be observed with a certain degree of variation within populations: For example, clone b1 has more DEGs in common with c1, from another population, than with clone b4 (the same population), 64% versus 47%, respectively. A similar level of convergence in transcriptomic signatures was also observed when comparing evolved clones with smaller pool of genes (a4, c2, d3, d5, e1, and e3) with predominantly overlapping DEG repertoires between clones (e.g., 87% and 74% of overlap for e3 and d5, respectively). We concluded that the experimental evolution carried out in parallel on five populations propagated in Hawaii 7996 led to the selection of clones exhibiting little genetic polymorphism but with a significant reorganization of gene expression, which strongly converged between the different populations.
Fig. 5.

Grouping of genes differentially expressed (compared with the ancestral clone) of five evolved clones, coming from four independent evolution lines. Clone haw35a1 originates from population A, haw35b1 and haw35b4 from population B, haw35c1 from population C, and haw35d5 from population D. The total number of DEGs in each clone appears at the bottom of Venn’s diagram. Genes were considered as differentially expressed with the following thresholds: absolute fold change between strain |FC| > 2 and an FDR-adjusted P-value (Padj, FDR) < 0.05.
Remarkably, 29 common DEGs were found in at least eight of the ten evolved clones (supplementary table S3, Supplementary Material online). This list included one-third of proteins of unknown function and one-third of genes belonging to the hrpB regulon and associated to the T3SS (further detailed below). Among the last third were two histone-like proteins and an acyl homoserine lactone-synthase, which are associated in the literature with global reorganization of gene expression either through action on DNA supercoiling or through quorum-sensing-dependent gene expression shifts, respectively (Ali et al. 2014; Hawver et al. 2016). These latter genes therefore appear as candidates in the implementation of the gene expression changes observed in the majority of adapted clones.
Expression of the efpR and hrpB Regulons Is Consistently Downregulated in Fittest Clones Isolated from Resistant Tomato
In order to uncover the functions involved in adaptive mechanisms of the fittest clones on Hawaii 7996, we performed a Gene Ontology (GO) enrichment analysis on DEGs. This revealed that 1) several functions (such as chemotaxis, locomotion, signaling activity, and metabolic processes) were commonly upregulated in the a1 and c1 clones and 2) genes associated to the protein secretion process were significantly enriched in the downregulated genes of the b1, b4, c1, and c2 clones (table 3 and supplementary table S4, Supplementary Material online).
Associated to a strong reorganization of gene expression for metabolic functions and increased growth rate compared with the ancestral strain, clones a1 and c1 are characterized by a significant downregulation of the efpR gene (table 3). Because efpR was previously shown to be a master regulatory gene coordinating expression of multiple virulence and metabolic functions and that loss-of-function mutations were associated to fitness gain in R. solanacearum (Perrier et al. 2016; Capela et al. 2017), we suspected that downregulation of efpR was a key adaptive event that occurred in a1 and c1. A closer examination of the DEGs in a1, c1, and an efpR mutant (Perrier et al. 2016; Capela et al. 2017) revealed in fact that only one half of the efpR regulon is shared with a1 and c1, with a total of 245 DEGs common to the three strains (supplementary fig. S3, Supplementary Material online). This subset of common genes included the chemotaxis and flagellar genes as well as most of the exopolysaccharide (EPS) genes, which are associated to main phenotypic features of the efpR mutant (hypermotile, reduced EPS biosynthesis). We investigated if the a1 and c1 clones also showed phenotypic heterogeneity features as described in an efpR mutant (Perrier et al. 2019). We thus compared the morphotypes of the colonies on plates. Whereas the WT GMI1000 strain produces colonies with only one morphotype (type S, mucoid), the efpR mutant produces two morphotypes, the type S and the nonmucoid type EV (Perrier et al. 2019). The a1 and c1 adapted clones also produced colonies with both the type S and the type EV (fig. 6A), thus confirming the strong downregulation of efpR in these two adapted clones and its consequences on major phenotypic traits. The increased growth rate of a1 and c1 in MM supplemented with glutamine or proline similarly as the efpR mutant (fig. 4) further supports the idea that downregulation of efpR is probably a major contribution to the fitness gain acquired by the a1 and c1 clones in the stem of Hawaii 7996.
Fig. 6.
Phenotypical characterization of evolved clones in which the efpR and hrpB genes are downregulated. (A) The haw35a1 and haw35c1 evolved clones display phenotypic heterogeneity on plates similar to an efpR mutant (Perrier et al. 2019). Colonies were grown for 48 h on a complete agar medium supplemented with glucose and triphenyl tetrazolium chloride. (B) The haw35b4, haw35c1, and haw35c2 evolved clones characterized by a significant downregulation of the hrpB gene show a similar HR response on N. tabacum than the ancestral GMI1000 clone. Tobacco leaves were infiltrated with bacterial suspensions at 108 CFU/ml. Pictures were taken 48 h after the infiltration. The seven other tested experimentally evolved clones also show a similar HR response on Nicotiana tabacum than the ancestral GMI1000 clone (see complete picture in supplementary fig. S6, Supplementary Material online).
The GO enrichment analysis highlighted four clones with significant deregulation of protein secretion processes (b1, b4, c1, and c2), which corresponds to a notable downregulation of the hrpB regulon in theses clones (supplementary table S4, Supplementary Material online). In fact, all ten clones except a4 show a more or less pronounced reduction in expression of the hrpB regulon. For example, in clones d5, e1, and e3 which have the lower number of DEGs (150–200), there is a subset of 27 downregulated genes belonging to the hrpB regulon, mostly comprising genes coding for extracellular products (effectors, pilin) or factors modulating secretion (chaperone, associated helper proteins) (supplementary fig. S4, Supplementary Material online). In clones a1, c1, and b4, downregulation of the T3SS and associated effectors reached up to 40% of the hprB regulon (supplementary fig. S5, Supplementary Material online). So we wondered if type 3 secretion was only decreased in its capacities or nonfunctional in the evolved clones. We therefore compared the ability of evolved clones to elicit an HR on resistant plants, a property that depends on the functionality of the T3SS and is controlled by hrpB (Genin et al. 1992). The HR test was conducted for the ten evolved clones sequenced previously on both Nicotiana tabacum and N. benthamiana leaves. The test revealed that the ten evolved clones conserved their ability to elicit an HR on these resistant plants, similarly to the WT GMI1000 clone (fig. 6B and supplementary fig. S6, Supplementary Material online).
Discussion
What Did We Learn from Experimental Evolution of R. solanacearum on a Resistant Host?
We used experimental evolution combined with phenotyping, genomics, and transcriptomics to analyze the adaptive potential of the bacterial plant pathogen R. solanacearum to overcome the quantitative resistance of the tomato cultivar Hawaii 7996. This breeding line is widely used for management of bacterial wilt as it is the most effective source of resistance against various RSSC strains under different environmental conditions (Grimault et al. 1994; Thoquet et al. 1996; Lebeau et al. 2011; Wang et al. 2013). Hawaii 7996 resistance to the RSSC is expressed in both root and shoot tissues (Planas-Marquès et al. 2020). Previous reports indicating that Hawaii 7996 spatially restricts the bacterial movement in the vasculature (Caldwell et al. 2017) and that the T3SS is still expressed in xylem vessels to counteract plant immunity (Monteiro et al. 2012) support the view that R. solanacearum is still exposed to active plant defense responses in our experimental system. Here, we used a stem-inoculation procedure in order to maintain a uniform selective environment within each replicate. After serial passaging over 300 generations, we observed pathogen adaptation to within-plant environment of the resistant cultivar Hawaii 7996 but we did not observe any symptom of the bacterial wilt disease, which suggests that this evolutionary time is not enough to overcome the polygenic resistance of Hawaii 7996 expressed in the shoot tissues. In future work, it might be interesting to compare this result to natural conditions where the pathogen experiences a complete lifecycle including survival in soil and root infection.
Pathogen adaptation was characterized by a better bacterial multiplication rate in planta compared with the ancestor, although this gain was not enough to cause the disease. We showed that three out of the ten tested evolved clones also have a better growth rate than the ancestor in MM supplemented with glutamine, the most abundant amino acid found in tomato xylem (Zuluaga et al. 2013), which most probably explains their better multiplication rate in planta. For two of these clones from population B, we showed that this increased growth rate in presence of glutamine depends on the RSp1574 regulatory gene (fig. 4A). Moreover, the upregulation of transporters in these evolved clones suggests that enhanced growth rates rely on increased metabolic capacities, as we previously observed in other regulatory mutant backgrounds (Perrier et al. 2016; Peyraud et al. 2016). Nevertheless, our study also showed that the fitness gain on tomato Hawaii7996 does not only depend on growth gain (i.e., no significant difference in growth rate between evolved vs. ancestral clone), which suggests the involvement of different mechanism(s) to explain why evolved clones are more competitive than their WT ancestor in planta.
Host Adaptation through Gain of Function Mutations and Regulatory Network Rewiring
Few genomic mutations were detected in the genome of experimentally adapted clones (up to two mutations per clone, half of them having no mutation) after using two distinct sequencing technologies (Illumina/PacBio). This low number of genetic changes is in the range of what was found in a previous evolution experiment of the same R. solanacearum strain on other hosts (Guidot et al. 2014). None of the mutations detected in the former experiment were recovered in this one, but two of the mutated genes identified in Hawaii 7996-adapted clones (soxA1 and RSp1136) were previously found in another experimental evolution aimed to convert R. solanacearum into a plant symbiont (Clerissi et al. 2018). Furthermore, we were able to detect an IS movement which leads to inactivation of prhP, confirming the role played by mobile genetic elements in bacterial adaptation (Vandecraen et al. 2017).
Using reverse genetic approaches, we demonstrated that five genetic alterations detected in the adapted clones were adaptive mutations, providing a competing advantage over the ancestral strain. With the exception of prhP, all these mutations lead to a gain of function. Deletion of the corresponding genes induced instead a decrease in competitiveness (fig. 3), indicating that the WT alleles already contribute to R. solanacearum’s fitness in plant. This work uncovered a previously uncharacterized LysR family regulatory protein, RSp1574, for which a nonsynonymous mutation is associated with both better competitiveness, increased growth rate and upregulation of specific metabolic transporters that we hypothesize are RSp1574 regulatory targets. This evolution experiment also shed light on prhP, a recently described R. solanacearum virulence regulatory gene (Zhang et al. 2019). prhP was identified as a positive regulator on detoxification of phenolic acids, a class of secondary metabolites produced by plants and acting as broad antimicrobials (Lowe et al. 2015; Zhang et al. 2019). Interestingly, prhP was also found to positively control expression of the T3SS genes, but the mechanism involved remains unclear (Zhang et al. 2019). The transcriptome analysis of the clone b4 carrying the prhPIS-6 mutation revealed that prhP was indeed strongly downregulated but, surprisingly, the DEGs of clone b4 did not completely reflect the DEGs previously identified in the prhP deleted mutant (with the notable exception of T3SS genes). It should be noted, however, that clone b4 also carries an additional mutation in the regulatory gene RSp1574. Altogether, these observations lead us to believe that the adaptive events that occurred in the evolved clones induce a rewiring of the global regulatory network that results in novel gene expression patterns associated to fitness gain. This hypothesis is supported by the finding that this rewiring occurred after modifications affecting important nodes in the regulatory network of R. solanacearum (Peyraud et al. 2018) and that these modifications did not appear randomly. It is indeed striking to note that the same regulatory genes are regularly affected by mutations or modifications of expression during R. solanacearum experimental evolution. Thus, efpR (downregulated in a1 and c1) had already been identified as contributing to adaptation to the plant in two previous evolution experiments (Guidot et al. 2014; Capela et al.. 2017), prhP is inactivated by an IS in b4 and downregulated in a1, hrpB is also downregulated in three clones, and lecM, a lectin involved in a feedback loop on the quorum-sensing signaling (Hayashi et al. 2019), is also downregulated in four of them (table 3). All these genes have been associated, more or less directly, with metabolic or virulence functions (Peyraud et al. 2018).
The rewiring of the regulatory network that occur in evolved clones is certainly complex as illustrated by the divergent expression patterns of the regulatory genes hrpB (downregulated in three evolved clones) and prhI (upregulated in two evolved clones), previously known to belong to the same signaling pathway (table 3). However, it is striking to observe that although the regulatory network rewiring results from different adaptive events and leads to large scale changes in expression profiling (hundreds of genes), it appears to converge toward largely overlapping transcriptomic or phenotypic responses. For example, clone b4 shares 62% of its DEGs (310 genes) with the independently evolved clone c1 although they do not carry any mutation in common.
Variations exist in the magnitude of the mean CI between the five populations that evolved independently on Hawaii 7996, suggesting either different evolutionary trajectories or a more rapid accumulation of adaptive genomic changes in populations with the highest CI values (Clerissi et al. 2018; Garoff et al. 2020). It is also interesting to note that the majority of clones with the highest CI values are associated with deregulation or mutation of several transcriptional regulators (EfpR, HrpB, PrhP, and RSp1574) which are presumably key nodes of the regulatory network. Their deregulation should efficiently reorientate the RSSC strain GMI1000 physiology to better adapt to the Hawaii 7996 xylem environment.
efpR and hrpB Are Major Regulatory Nodes for Bacterial Adaptation to Resistant Tomato
EfpR appeared to be a central node in the control of bacterial physiology and a target for mutation during R. solanacearum experimental evolution (Guidot et al. 2014; Perrier et al. 2016; Capela et al. 2017). Here, we did not detect mutations in the efpR gene but significant downregulation of this gene in two evolved clones. Transcriptomic analysis revealed that only one half of the known efpR regulon (Perrier et al. 2016, 2019; Capela et al. 2017) was shared with these two clones so we suspected that other genetic or epigenetic modifications probably superimpose to the downregulation of efpR. In one of the two clones, we detected mutation in the soxA1 gene. However, recreating the soxA1C639R mutation in the WT strain did not enhance the growth rate in glutamine and proline as observed for an efpR mutant (fig. 4), suggesting that the soxA1C639R mutation is not linked to the downregulation of the efpR gene. To support this hypothesis, we also found that recreating the soxA1C639R mutation in the WT strain was not enough to replicate the level of fitness gain of the evolved clone, thus suggesting again a probable role of other genetic or epigenetic modifications.
HrpB, the primary activator of T3SS expression and secreted effectors, was significantly downregulated in three clones, but the majority of them showed a reduced expression of several genes belonging to the HrpB regulon. At first glance, this finding seems counterintuitive because T3SS genes are essential for the multiplication of bacteria in the xylem (Vasse et al. 2000) and remains expressed throughout the infection (Jacobs et al. 2012; Monteiro et al. 2012). We showed that all the ten evolved clones conserved their ability to elicit an HR on resistant plants similarly to the WT ancestor, indicating that the T3SS is still functional despite the reduced expression. Two hypotheses can be raised from this result: Either the evolved clones optimized the expression of T3SS in resistant tomatoes by minimizing the cost of its biosynthesis while keeping it functional or/and only a subpart of the HrpB regulon is downregulated to specifically avoid recognition of the plant immune system. This latter hypothesis is raised by the intriguing observation that in several clones, a majority of the HrpB regulon genes found downregulated are not genes directly involved in the biosynthesis of T3SS but mostly effectors or extracellular components of the secretory machinery (Hrp pilin, T3SS chaperones, and helper proteins). For example, effectors, such as RipAA, PopP2, or the harpin RipX, which all elicit an immune response on diverse hosts (Arlat et al. 1994; Deslandes et al. 2003; Poueymiro et al. 2009), had their expression significantly reduced in almost all the evolved clones. One can therefore wonder whether the polygenic resistance of Hawaii 7996 could be attenuated if the ability to recognize effectors by plant receptors is itself reduced due to dampened (or selective) expression of these effectors by bacteria. It is in any case striking to see that the deregulation of part of the hrpB regulon (this work) as well as that of efpR regulon (Perrier et al. 2016; Capela et al. 2017, this work) is a signature which seems recurrent in a majority of clones having better fitness.
Adaptation Also Probably Relies on Epigenetic Modifications
In this evolution experiment on a resistant tomato, no mutation were detected in several bacterial clones after 300 generations of evolution and extensive resequencing. In contrast, up to 900 DEGs were identified when comparing the transcriptome of clone c1 (with no genetic alteration detected) and the ancestor. We therefore hypothesized that epigenetic modifications could be the cause of such transcriptomic variations and could play a major role in adaptation. Epigenetic modifications, such as DNA methylation, are known to impact gene expression in bacteria (Casadesús and Low 2006; Sánchez-Romero and Casadesús 2019; Vandenbussche et al. 2020). DNA methylation was described in RSSC strains (Erill et al. 2017), thus suggesting that variation of the DNA methylation profile could impact virulence of R. solanacearum, as recently reported for the insect pathogen Photorhabdus luminescens (Payelleville et al. 2017, 2018). By highlighting the probable role of epigenetic variation in host adaptation, this study encourage future works to consider both genetic and epigenetic mutations in bacterial pathogen adaptive evolution.
Materials and Methods
Bacterial Strains, Plant Material, and Growth Conditions
The evolution experiment was performed with the model R. pseudosolanacearum strain GMI1000 (Salanoubat et al. 2002). The list of GMI1000 derivatives used in this work is given in table 4. The bacterial strains were grown at 28 °C (under agitation at 180 rpm for liquid cultures) either in BG complete medium or in MP MM (Plener et al. 2010). The pH of the MP medium was adjusted to 6.5 with KOH. For agar plates, BG medium was supplemented with d-Glucose (5 g/l) and triphenyltetrazolium chloride (0.05 g/l). MP medium was supplemented with l-glutamine (10 mM) and oligoelements (1000 mg/l). Gentamycin (final concentration of 10 mg/l) was added to the media when required.
Table 4.
List of GMI1000 Derivatives Used in This Study.
| Strain | Genotype | References |
|---|---|---|
| GRS540 | GMI1000, GmR | Guidot et al. (2014) |
| GRS704 | GMI1000, ΔefpR, SpR | Guidot et al. (2014) |
| mAG65 | GMI1000, ΔRSp0048 | This study |
| mAG66 | GMI1000, ΔRSp1574 | This study |
| mAG67 | GMI1000, ΔRSc3094 | This study |
| mAG68 | GMI1000, soxA1C639R, GmR | This study |
| mAG69 | GMI1000, RSp1574V95L, GmR | This study |
| mAG70 | GMI1000, prhPIS-6, GmR | This study |
| mAG71 | GMI1000, RSp3094R162R, GmR | This study |
| mAG72 | GMI1000, RSp1136C-218A, GmR | This study |
Note.—SpR and GmR indicate resistance to spectinomycin and gentamycin, respectively.
Four to five-week-old resistant tomato (Solanum lycopersicum) cultivar Hawaii 7996 plants were used for the experimental evolution and the in planta bacterial competition assays. Six-week-old N. tabacum cv. Bottom Special plants and 4-week-old N. benthamiana plants were used for the HR tests. All plants were grown in a greenhouse. Plant experiments were conducted in a growth chamber under the following conditions: 75% humidity, 12 h light at 28 °C and 12 h darkness at 27 °C.
Experimental Evolution
The evolution experiment of GMI1000 strain was performed on the resistant tomato cultivar Hawaii 7996 using the protocol described in Guidot et al. (2014). Overnight culture in liquid complete BG medium from a single colony of GMI1000 was diluted to 106 CFU/ml and 10 µl was injected into the plant stem 0.5 cm above the cotyledons using a microsyringe. SPEs were then conducted as follows. At each SPE, the bacterial population was recovered from the plant stem 15 days postinoculation. For that purpose, the whole stem and petioles were cut at 1 cm above the inoculation point, truncated into 1-cm segments, and incubated in 3 ml sterile water at room temperature for 30 min to allow the bacteria to diffuse from stem and petiole to water. Ten microliters of the recovered bacterial suspension diluted 100× was directly injected into the stem of a healthy plant and 1 ml was stored in glycerol at −80 °C. In order to estimate the number of bacterial generations at each SPE, the effective number of bacterial cells injected into the healthy plant at SPEn was compared with the effective number of cells recovered from the infected plant at SPEn+1. The effective number of bacterial cells recovered from the infected plant and injected into the healthy plant was estimated by plating serial dilutions of the recovered bacterial suspension onto BG complete medium, incubation at 28 °C for 48 h and enumeration of the CFU. Five biological replicates were conducted thus generating five parallel lineages (populations) of clones experimentally derived from GMI1000.
Bacterial Competition Assay
The bacterial competition assay was carried out to determine the in planta fitness of the derived clones and mutants as described previously (Macho et al. 2010; Guidot et al. 2014; Perrier et al. 2016). The assay was performed using a mixed inoculum, consisting of equivalent CFU of a derived clone or mutant and the GMI1000 WT strain or gentamycin-resistant GMI1000 derivative (GRS540 strain). The GMI1000 WT strain was coinoculated with the gentamycin-resistant mutants, and the GRS540 strain was coinoculated with the derived clones and other gentamycin sensitive mutants. As a control, GMI1000 was coinoculated with GRS540. The inoculation dose is an important factor conditioning potential interference between coinoculated strains (complementation and/or dominant negative). Interference takes place when using a high dose of inoculum, whereas lower doses completely avoid this interference (Macho et al. 2007). Here, we injected 10 μl of the mixed inoculum at a 106 CFU/ml concentration into the stem of Hawaii 7996 plant as previously used (Guidot et al. 2014). Bacteria were recovered from the plant stem after 15 days, serial diluted and plated on BG complete medium with and without gentamycin. A CI was calculated as the ratio of derived clone (or mutant)/GRS540 (or GMI1000) strain obtained from the plant stem (output) divided by the ratio in the inoculum (input). A minimum of ten replicates were performed for each derived clone and each mutant. Differences between mean CI values were tested using a Wilcoxon test performed in the R statistical software.
In Vitro Growth Analysis
The growth rates of the derived clones and mutants were compared with the growth rate of the ancestral GMI1000 strain in cultures growing in MP MM supplemented with l-glutamine or l-proline at a 10 mM final concentration. Overnight cultures grown at 28 °C and 180 rpm shaking in MP MM supplemented with l-glutamine 10 mM were used to inoculate 200 μl of fresh MP MM supplemented with l-glutamine or l-proline 10 mM with an initial OD600nm at 0.05. Bacterial growth was performed in 96-well microplates incubated at 28 °C, 700 rpm shaking and monitored using a microplate spectrophotometer (FLUOstar Omega, BMG Labtech, Offenburg, Germany). OD600nm was measured every 5 min during 50 h. Three technical and three biological repeats were performed. Differences between in vitro growth rates were tested using a Student t-test with the R statistical software.
HR Assays
For HR assays, the bacterial strains were grown overnight in liquid BG complete medium at 28 °C. A bacterial suspension at 108 CFU/ml was infiltrated both in the leaves of 6-week-old N. tabacum plants and in the leaves of 4-week-old N. benthamiana plants with a 1-ml needless syringe. HR assays were performed in a controlled environment room (75% humidity, 12 h light/12 h dark, 28/27 °C). The cell death was checked 48 h after infiltrations.
Genome Sequencing
Based on CI experiment results, ten evolved clones (two from each of the five populations) were selected for genomic sequence analysis. A single colony of each of the ten evolved clones and the ancestral GMI1000 clone were grown overnight in 50 ml MP MM supplemented with 10 mM l-glutamine at 28 °C and 180 rpm shaking. The morning, OD600 was adjusted to 0.075 in a final volume of 50 ml MP MM supplemented with glutamine and incubated again at 28 °C and 180 rpm shaking during 8 h. OD600 was then adjusted to 0.001 in a final volume of 100 ml for overnight culture. The next morning, bacterial growth was monitored by measuring the OD600 every 60 min until the bacterial culture reaches mid exponential growth phase, then OD600 was monitored every 15 min until the bacterial culture reaches the stationary phase. Twenty milliliters of bacterial culture was collected at the beginning of stationary phase and centrifuged at 5,000 rpm for 10 min. The pellet was washed with ultrapure water, centrifuged again, and stored at −80 °C until DNA extraction.
DNA extraction was performed as previously described for high molecular weight genomic DNA (Mayjonade et al. 2016; Erill et al. 2017). DNA concentration and quality were measured by spectrometry using the nanodrop (Thermo Fisher Scientific) and fluorometry using the Qubit dsDNA HS Assay Kit (Life Technologies).
The genomic DNAs were first sequenced using the Illumina technology in order to detect any potential SNPs or small InDels between the derived and ancestral clones. DNA sequencing (DNAseq) was performed at the GeT-PlaGe core facility, INRAE Toulouse, France. DNAseq libraries were prepared according to Biooscientific’s protocol using the Biooscientific PCR free Library Prep Kit (Perkin-Elmer). Briefly, DNA was fragmented by sonication, size selection was performed using CLEAN CleanPCR beads, and adaptators were ligated to be sequenced. Library quality was assessed using an Advanced Analytical Fragment Analyzer and libraries were quantified by qPCR using the Kapa Library Quantification Kit (Kapa). DNA-seq experiments were performed on an Illumina Miseq using a paired-end read length of 2 × 150 bp with the Illumina Miseq Reagents micro V2 kits (Illumina). More than 12 million paired-end reads (2 × 150 bp) were generated leading to an ∼100× total coverage of the reference genome.
All genomic DNAs were also sequenced using the single molecule, real time (SMRT) DNA sequencing technology in order to detect any potential large genomic rearrangements between the derived and ancestral clones. Library preparation was performed at GeT-PlaGe core facility, INRAE Toulouse, France and SMRT sequencing at Gentyane core facility, INRAE Clermont-Ferrand, France. Two libraries of five multiplex samples were performed according to the manufacturer’s instructions “Procedure-Checklist-Preparing-Multiplexed-Microbial-SMRTbell-Libraries-for-the-PacBio-Sequel-System.” At each step, DNA was quantified using the Qubit dsDNA HS Assay Kit (Life Technologies) and DNA purity was tested using the nanodrop (Thermo Fisher Scientific). Size distribution and degradation were assessed using the Fragment analyzer (AATI) and High Sensitivity Large Fragment 50 kb Analysis Kit (Agilent). Purification steps were performed using AMPure PB beads (PacBio). The ten individual samples (2 µg) were purified, then sheared at 10 kb using the Megaruptor1 system (Diagenode). Using SMRTBell template Prep Kit 1.0 (PacBio), samples (1 µg) were Exo VII-treated before independently going through DNA Damage Repair and End-Repair. Then, barcoded adapters were ligated to each sample separately. Following ligation, 2 × 5 samples were pooled, then digested with Exo III and Exo VII. The two libraries of five samples were purified tree times. The two SMRTbell libraries were sequenced on two SMRTcell on Sequel1 instrument at 6pM with 120-min preextension and 10-h movies using Sequencing Primer V4, polymerase V3, diffusion loading. Using these conditions, the mean reference genome coverage obtained was 320×.
Detection of Genomic Modifications
The BWA v0.7.15-r1140 software was used to map Illumina reads on R. pseudosolanacearum GMI1000 genome with BWA-MEM algorithm (bwa mem –M) (Li and Durbin 2010). Mapping results was filtered with samtools v1.3.1 to keep only properly paired reads with mapq ≥1 and remove PCR duplicates (Li et al. 2009). SNP variants were called with samtools mpileup and VarScan v2.4.3 mpileup2snp (–min-coverage 33, –min-read2 15, –min-var-freq 0.4, –min-avg-qual 20) and InDel variants were called with mpileup2indel algorithm and the same parameters as SNP calling (Koboldt et al. 2012).
For Structural Variant (SV) calling, we used the PacBio tools (https://github.com/PacificBiosciences/pbbioconda). The first step was to build Circular Consensus Sequencing (CCS) contigs with pbccs v4.1.0 in order to have high-quality contigs for the following steps. Then, the CCS contigs were mapped with pbmm2 v1.1.0v on R. pseudosolanacearum GMI1000 genome with these parameters –min-length 1000 and –preset CCS. Finally, the SV calling was performed with pbsv v2.2.2 and output Variant Call Format (VCF) was filtered to remove artifacts caused by circular genome.
All detected genomic modifications were checked by PCR amplification and sequencing with the Sanger technology using the primers reported in supplementary table S5, Supplementary Material online.
RNA Extraction, Depletion of rRNA, and RNA-Seq
The ten evolved clones selected for genomic sequence analysis were also investigated for transcriptomic analysis. These transcriptomic analyses were conducted from the same bacterial cultures prepared for DNA extraction grown overnight in 50 ml MP MM supplemented with 10 mM l-glutamine. This condition was preferred to the in planta environment to avoid biases associated with bacteria extraction and sequencing, and because glutamine is by far the most abundant amino acid in tomato xylem (Zuluaga et al. 2013). Briefly, 20 ml of the bacterial culture was collected at the beginning of stationary phase for RNA extraction. Three biological replicates were conducted for each of the ten clones and the GMI1000 strain. The bacterial cultures were stopped growing by the addition of 1 ml ethanol/phenol (95:5) to the 20 ml culture and mixed well by vortexing 1 min. The mixture was then centrifuged at 10,000 rpm for 20 min at 4 °C and the pellets were stored at −80 °C until RNA extraction. Total RNA was extracted and ribosomal RNAs were depleted as previously described (Perrier et al. 2016). In order to optimize ribosomal RNA depletion specifically targeting RSSC rRNAs, three novel oligonucleotides were added to the oligonucleotide set used for the ribosomal RNA depletion, 10Sa-75 5′-ATTPATTAACPAGPTGACGPGTC-3′, 10Sa-294 5′-TCAGTLATTTPATTTAALCGPCG-3′, and 23S-1668 5′-GTACLAATTTPCCPAGTTLCTTC-3′. The two first primers target 10Sa RNA (tmRNA) and the last the 23S rRNA. The concentration and quality of the RNA samples were measured by spectrometry using the nanodrop (Thermo Fisher Scientific) and fluorometry using the Qubit (Life Technologies).
Oriented paired-end RNA-seq was performed at the GeT-PlaGe core facility, INRAE Toulouse, France. RNAseq 30 libraries were prepared according to Illumina’s protocols using the Illumina TruSeq Stranded mRNA sample prep kit (Illumina) to analyze mRNA. Briefly, mRNA was selected using poly-T beads. Then, RNA was fragmented to generate double-stranded cDNA, and adaptators were ligated to be sequenced. A total of 11 cycles of PCR were applied to amplify libraries. Library quality was assessed using a Fragment Analyser and libraries were quantified by quantitative PCR using the Kapa Library Quantification Kit (Kapa). RNA-seq experiments were performed on two lanes of an Illumina HiSeq3000 using a paired-end read length of 2 × 150 bp with the Illumina HiSeq3000 sequencing kits (Illumina).
Mapping and Analysis of RNA-seq Data
RNA‐seq read pairs were mapped on R. pseudosolanacearum GMI1000 genome using the Glint v1.0 rc12 software (https://forge-dga.jouy.inra.fr/projects/glint) with parameters set as follows: matches ≥75 nucleotides, ≤4 mismatches, no gap allowed, only best‐scoring hits taken into account. Ambiguous matches (the same best score) were removed.
DEGs were detected with EdgeR Bioconductor package version 3.30.3 (Robinson and Smyth 2008). Genes with no counts across all libraries were discarded prior to further analysis. Normalization was performed using trimmed mean of M values method (Robinson and Oshlack 2010). Quality control plots of normalized data sets and reproducibility of biological repeats were generated by principal component analysis using Ade4 version 1.7-15 package (Dray and Dufour 2007). Correlation between biological repeats was estimated by calculating the correlation coefficient of Spearman. differences and similarities in gene expression between clones were tested by calculating the Euclidean distance and shown on heatmaps. Heatmaps were obtained with the package pheatmap version 1.0.12 (https://CRAN.R-project.org/package=pheatmap) on sample-to-sample Euclidean distances.
Fitted generalized linear models (GLM) with a design matrix multiple factor (biological repeat and factor of interest) were designed for further analyses. The Cox-Reid profile-adjusted likelihood method in estimating dispersions was then used. DEGs were called using the GLM likelihood ratio test using an FDR (Benjamini and Yekutieli 2001) adjusted P value <0.05. Clustering on filtered DEGs (P value <0.05 in at least one biological condition) was generated with heatmap.2 function as available in the gplots Bioconductor package version 3.0.1. (https://CRAN.Rproject.org/package=gplots) using Ward’s minimum variance clustering method on Euclidean (Murtagh and Legendre 2014). Enrichment analysis considering GO was then conducted using the topGO package version 2.40.0 (Alexa et al. 2006). The Venn diagrams were constructed using the jvenn tool (Bardou et al. 2014).
Construction of Mutants
All mutants were constructed in GMI1000 using the multiplex genome editing by natural transformation protocol (MuGENT) as described (Dalia et al. 2014). Primers were designed to amplify 3–3.5 kb arms of homology from either side of the SNPs. PCR was performed on the genomic DNA of the evolved clones. The purified PCR products act as the unselected products, whereas an insertional plasmid cAG10 linearized by ScaI acts as the selected product. Natural transformation of R. solanacearum was achieved using 300 ng of selected product and 1 µg of unselected marker with the addition of 50 µl competent cells. The transformants were selected on selective medium (rich medium supplemented with gentamycin 10 mg/l) and were validated by PCR amplification and Sanger sequencing using the respective primers (supplementary table S5, Supplementary Material online). The mutants were named mAG68, mAG69, mAG70, mAG71, and mAG72 corresponding to soxA1C639R, Rsp1574V95L, Rsp0309ins1.4kb, Rsp3094R162R, and Rsp1136–37 respectively.
Gene deletion was performed on GMI1000 for each SNPs (soxA1, Rsp1574, and Rsc3094) using pK18 plasmid. The plasmid has an sacB gene and antibiotic marker (kanamycin) for selection with restriction sites EcoRI and HindIII. Two border fragments of each gene (700 bp–1 kb) were PCR amplified separately as follows: 1) downstream fragment with flanking regions—EcoRI on the left end and NheI on the right end and 2) upstream fragment with flanking regions—NheI on the right end and HindIII on the left end. The up and downstream fragments were restriction digested using appropriate enzymes and the pK18 plasmid was restriction digested using EcoRI and HindIII. The digested plasmid pK18, upstream, and downstream fragments were ligated overnight using T4DNA ligase. The ligated vector was transformed into competent DH5α Escherichia coli cells followed by blue/white selection and the ligation was verified by sequencing. The plasmid DNA was isolated from the transformants and transformed into competent GMI1000 cells. Selection was performed on sucrose medium, since pK18 plasmid has sacB gene that hinders their growth on sucrose. This was followed by recombination where the crossover occurs resulting in ΔsoxA1, ΔRsp1574, and ΔRsp3094 mutants.
The mutants were tested for in planta fitness using the CI method as described above. The insertion mutants competed with the control ancestral GMI1000 clone, whereas the deletion mutants competed with the control GmR GRS540 clone in the stem of tomato Hawaii 7996. Bacterial recovery was performed at 15 dpi and the CI was calculated.
Supplementary Material
Supplementary data are available at Molecular Biology and Evolution online.
Supplementary Material
Acknowledgments
The authors thank the members of the RAP team and Julien Brillard for support and advices during the course of this work. R.G.N. was funded by a PhD fellowship from the French Laboratory of Excellence project “TULIP” (Grant Nos. ANR-10-LABX-41; ANR-11-IDEX-0002-02). This work was supported by the French National Research Agency (Grant No. ANR-17-CE20-0005-01), the French Laboratory of Excellence project “TULIP” (Grant No. ANR-10-LABX-41; ANR-11-IDEX-0002-02), and the French Research Federation “FR AIB” (Agrobiosciences Interactions and Biodiversity). Part of this work was carried out on the Toulouse Plant-Microbe Phenotyping “TPMP” facility, LIPM—UMR INRAE441/CNRS2594. This work was performed in collaboration with the GeT core facility, Toulouse, France (http://get.genotoul.fr) and was supported by France Génomique National Infrastructure, funded as part of “Investissement d’avenir” program managed by the French National Research Agency (Grant No. ANR-10-INBS-09) and by the GET-PACBIO program (Programme Operationnel FEDER-FSE MIDI-PYRENEES ET GARONNE 2014-2020). Raw sequencing data were deposited on the NCBI Sequence Read Archive, SRP276307.
References
- Alexa A, Rahnenführer J, Lengauer T.. 2006. Improved scoring of functional groups from gene expression data by decorrelating GO graph structure. Bioinformatics 22(13):1600–1607. [DOI] [PubMed] [Google Scholar]
- Ali SS, Soo J, Rao C, Leung AS, Ngai DH-M, Ensminger AW, Navarre WW.. 2014. Silencing by H-NS potentiated the evolution of Salmonella. PLoS Pathog. 10(11):e1004500. [DOI] [PMC free article] [PubMed] [Google Scholar]
- Arlat M, , Van Gijsegem F, , Huet JC, , Pernollet JC, , Boucher CA. 1994. PopA1, a protein which induces a hypersensitivity-like response on specific Petunia genotypes, is secreted via the Hrp pathway of Pseudomonas solanacearum. EMBO J. 13(3):543–553. [DOI] [PMC free article] [PubMed] [Google Scholar]
- Bardou P, Mariette J, Escudié F, Djemiel C, Klopp C.. 2014. jvenn: an interactive Venn diagram viewer. BMC Bioinformatics 15(1):293. [DOI] [PMC free article] [PubMed] [Google Scholar]
- Barrick JE, Lenski RE.. 2013. Genome dynamics during experimental evolution. Nat Rev Genet. 14(12):827–839. [DOI] [PMC free article] [PubMed] [Google Scholar]
- Benjamini Y, Yekutieli D.. 2001. The control of the false discovery rate in multiple testing under dependency. Ann Stat. 29:1165–1188. [Google Scholar]
- Caldwell D, Kim B-S, Iyer-Pascuzzi AS.. 2017. Ralstonia solanacearum differentially colonizes roots of resistant and susceptible tomato plants. Phytopathology 107(5):528–536. [DOI] [PubMed] [Google Scholar]
- Capela D, Marchetti M, Clérissi C, Perrier A, Guetta D, Gris C, Valls M, Jauneau A, Cruveiller S, Rocha EPC, et al. 2017. Recruitment of a lineage-specific virulence regulatory pathway promotes intracellular infection by a plant pathogen experimentally evolved into a legume symbiont. Mol Biol Evol. 34:2503–2521. [DOI] [PubMed] [Google Scholar]
- Carmeille A, Caranta C, Dintinger J, Prior P, Luisetti J, Besse P.. 2006. Identification of QTLs for Ralstonia solanacearum race 3-phylotype II resistance in tomato. Theor Appl Genet. 113(1):110–121. [DOI] [PubMed] [Google Scholar]
- Casadesús J, Low D.. 2006. Epigenetic gene regulation in the bacterial world. Microbiol Mol Biol Rev. 70(3):830–856. [DOI] [PMC free article] [PubMed] [Google Scholar]
- Clerissi C, Touchon M, Capela D, Tang M, Cruveiller S, Genthon C, Lopez-Roques C, Parker MA, Moulin L, Masson-Boivin C, et al. 2018. Parallels between experimental and natural evolution of legume symbionts. Nat Commun. 9(1):2264. [DOI] [PMC free article] [PubMed] [Google Scholar]
- Corwin JA, Kliebenstein DJ.. 2017. Quantitative resistance: more than just perception of a pathogen. Plant Cell 29(4):655–665. [DOI] [PMC free article] [PubMed] [Google Scholar]
- Dalia AB, McDonough E, Camilli A.. 2014. Multiplex genome editing by natural transformation. Proc Natl Acad Sci U S A. 111(24):8937–8942. [DOI] [PMC free article] [PubMed] [Google Scholar]
- Deslandes L, Olivier J, Peeters N, Feng DX, Khounlotham M, Boucher C, Somssich I, Genin S, Marco Y.. 2003. Physical interaction between RRS1-R, a protein conferring resistance to bacterial wilt, and PopP2, a type III effector targeted to the plant nucleus. Proc Natl Acad Sci U S A. 100(13):8024–8029. [DOI] [PMC free article] [PubMed] [Google Scholar]
- Dray S, Dufour A-B.. 2007. The ade4 package: implementing the duality diagram for ecologists. J Stat Softw. 22:1–20. [Google Scholar]
- Ebert D. 1998. Experimental evolution of parasites. Science 282(5393):1432–1436. [DOI] [PubMed] [Google Scholar]
- Erill I, Puigvert M, Legrand L, Guarischi-Sousa R, Vandecasteele C, Setubal JC, Genin S, Guidot A, Valls M.. 2017. Comparative analysis of Ralstonia solanacearum methylomes. Front Plant Sci. 8:504. [DOI] [PMC free article] [PubMed] [Google Scholar]
- Flavier AB, Clough SJ, Schell MA, Denny TP.. 1997. Identification of 3-hydroxypalmitic acid methyl ester as a novel autoregulator controlling virulence in Ralstonia solanacearum. Mol Microbiol. 26(2):251–259. [DOI] [PubMed] [Google Scholar]
- Garoff L, Pietsch F, Huseby DL, Lilja T, Brandis G, Hughes D.. 2020. Population bottlenecks strongly influence the evolutionary trajectory to fluoroquinolone resistance in Escherichia coli. Mol Biol Evol. 37(6):1637–1646. [DOI] [PMC free article] [PubMed] [Google Scholar]
- Genin S. 2010. Molecular traits controlling host range and adaptation to plants in Ralstonia solanacearum. New Phytol. 187(4):920–928. [DOI] [PubMed] [Google Scholar]
- Genin S, Boucher C.. 2004. Lessons learned from the genome analysis of Ralstonia solanacearum. Annu Rev Phytopathol. 42(1):107–134. [DOI] [PubMed] [Google Scholar]
- Genin S, Gough CL, Zischek C, Boucher CA.. 1992. Evidence that the hrpB gene encodes a positive regulator of pathogenicity genes from Pseudomonas solanacearum. Mol Microbiol. 6(20):3065–3076. [DOI] [PubMed] [Google Scholar]
- Grimault V, Gélie B, Lemattre M, Prior P, Schmit J.. 1994. Comparative histology of resistant and susceptible tomato cultivars infected by Pseudomonas solanacearum. Physiol Mol Plant Pathol. 44(2):105–123. [Google Scholar]
- Guidot A, Jiang W, Ferdy JB, Thébaud C, Barberis P, Gouzy J, Genin S.. 2014. Multihost experimental evolution of the pathogen Ralstonia solanacearum unveils genes involved in adaptation to plants. Mol Biol Evol. 31(11):2913–2928. [DOI] [PubMed] [Google Scholar]
- Hawver LA, Jung SA, Ng W-L.. 2016. Specificity and complexity in bacterial quorum-sensing systems. FEMS Microbiol Rev. 40(5):738–752. [DOI] [PMC free article] [PubMed] [Google Scholar]
- Hayashi K, Kai K, Mori Y, Ishikawa S, Ujita Y, Ohnishi K, Kiba A, Hikichi Y.. 2019. Contribution of a lectin, LecM, to the quorum sensing signalling pathway of Ralstonia solanacearum strain OE1-1. Mol Plant Pathol. 20(3):334–345. [DOI] [PMC free article] [PubMed] [Google Scholar]
- Hayward AC. 1991. Biology and epidemiology of bacterial wilt caused by Pseudomonas solanacearum. Annu Rev Phytopathol. 29(1):65–87. [DOI] [PubMed] [Google Scholar]
- Jacobs JM, Babujee L, Meng F, Milling A, Allen C.. 2012. The in planta transcriptome of Ralstonia solanacearum: conserved physiological and virulence strategies during bacterial wilt of tomato. mBio 3(4):e00114. [DOI] [PMC free article] [PubMed] [Google Scholar]
- Jones JDG, Dangl JL.. 2006. The plant immune system. Nature 444(7117):323–329. [DOI] [PubMed] [Google Scholar]
- Koboldt DC, Zhang Q, Larson DE, Shen D, McLellan MD, Lin L, Miller CA, Mardis ER, Ding L, Wilson RK.. 2012. VarScan 2: somatic mutation and copy number alteration discovery in cancer by exome sequencing. Genome Res. 22(3):568–576. [DOI] [PMC free article] [PubMed] [Google Scholar]
- Kwak M-J, Kong HG, Choi K, Kwon S-K, Song JY, Lee J, Lee PA, Choi SY, Seo M, Lee HJ, et al. 2018. Rhizosphere microbiome structure alters to enable wilt resistance in tomato. Nat Biotechnol. 36(11):1100–1109. [DOI] [PubMed] [Google Scholar]
- Lebeau A, Daunay M-C, Frary A, Palloix A, Wang J-F, Dintinger J, Chiroleu F, Wicker E, Prior P.. 2011. Bacterial wilt resistance in tomato, pepper, and eggplant: genetic resources respond to diverse strains in the Ralstonia solanacearum species complex. Phytopathology 101(1):154–165. [DOI] [PubMed] [Google Scholar]
- Lenski RE. 2017. Experimental evolution and the dynamics of adaptation and genome evolution in microbial populations. ISME J. 11(10):2181–2194. [DOI] [PMC free article] [PubMed] [Google Scholar]
- Li H, Durbin R.. 2010. Fast and accurate long-read alignment with Burrows-Wheeler transform. Bioinformatics 26(5):589–595. [DOI] [PMC free article] [PubMed] [Google Scholar]
- Li H, Handsaker B, Wysoker A, Fennell T, Ruan J, Homer N, Marth G, Abecasis G, Durbin R, 1000 Genome Project Data Processing Subgroup. 2009. The sequence alignment/map format and SAMtools. Bioinformatics 25(16):2078–2079. [DOI] [PMC free article] [PubMed] [Google Scholar]
- Lowe TM, Ailloud F, Allen C.. 2015. Hydroxycinnamic acid degradation, a broadly conserved trait, protects Ralstonia solanacearum from chemical plant defenses and contributes to root colonization and virulence. Mol Plant Microbe Interact. 28(3):286–297. [DOI] [PMC free article] [PubMed] [Google Scholar]
- Macho AP, Guidot A, Barberis P, Beuzón CR, Genin S.. 2010. A competitive index assay identifies several Ralstonia solanacearum type III effector mutant strains with reduced fitness in host plants. Mol Plant Microbe Interact. 23(9):1197–1205. [DOI] [PubMed] [Google Scholar]
- Macho AP, Zumaquero A, Ortiz-Martín I, Beuzón CR.. 2007. Competitive index in mixed infections: a sensitive and accurate assay for the genetic analysis of Pseudomonas syringae-plant interactions. Mol Plant Pathol. 8(4):437–450. [DOI] [PubMed] [Google Scholar]
- Mansfield J, Genin S, Magori S, Citovsky V, Sriariyanum M, Ronald P, Dow M, Verdier V, Beer SV, Machado MA, et al. 2012. Top 10 plant pathogenic bacteria in molecular plant pathology. Mol Plant Pathol. 13(6):614–629. [DOI] [PMC free article] [PubMed] [Google Scholar]
- Mayjonade B, Gouzy J, Donnadieu C, Pouilly N, Marande W, Callot C, Langlade N, Muños S.. 2016. Extraction of high-molecular-weight genomic DNA for long-read sequencing of single molecules. BioTechniques 61(4):203–205. [DOI] [PubMed] [Google Scholar]
- McDonald BA, Linde C.. 2002. Pathogen population genetics, evolutionary potential, and durable resistance. Annu Rev Phytopathol. 40(1):349–379. [DOI] [PubMed] [Google Scholar]
- McGarvey JA, Denny TP, Schell MA.. 1999. Spatial-temporal and quantitative analysis of growth and EPS I production by Ralstonia solanacearum in resistant and susceptible tomato cultivars. Phytopathology 89(12):1233–1239. [DOI] [PubMed] [Google Scholar]
- Meaden S, Koskella B.. 2017. Adaptation of the pathogen, Pseudomonas syringae, during experimental evolution on a native vs. alternative host plant. Mol Ecol. 26(7):1790–1801. [DOI] [PMC free article] [PubMed] [Google Scholar]
- Monteiro F, Genin S, van Dijk I, Valls M.. 2012. A luminescent reporter evidences active expression of Ralstonia solanacearum type III secretion system genes throughout plant infection. Microbiology (Reading) 158(8):2107–2116. [DOI] [PubMed] [Google Scholar]
- Murtagh F, Legendre P.. 2014. Ward’s hierarchical agglomerative clustering method: which algorithms implement Ward’s criterion? J Classif. 31(3):274–295. [Google Scholar]
- Nakaho K, Inoue H, Takayama T, Miyagawa H, Nakaho K, Inoue H, Takayama T, Miyagawa H.. 2004. Distribution and multiplication of Ralstonia solanacearum in tomato plants with resistance derived from different origins. J Gen Plant Pathol. 70(2):115–119. [Google Scholar]
- Payelleville A, Lanois A, Gislard M, Dubois E, Roche D, Cruveiller S, Givaudan A, Brillard J.. 2017. DNA adenine methyltransferase (Dam) overexpression impairs photorhabdus luminescens motility and virulence. Front Microbiol. 8:1671. [DOI] [PMC free article] [PubMed] [Google Scholar]
- Payelleville A, Legrand L, Ogier J-C, Roques C, Roulet A, Bouchez O, Mouammine A, Givaudan A, Brillard J.. 2018. The complete methylome of an entomopathogenic bacterium reveals the existence of loci with unmethylated Adenines. Sci Rep. 8(1):12091. [DOI] [PMC free article] [PubMed] [Google Scholar]
- Peeters N, Guidot A, Vailleau F, Valls M.. 2013. Ralstonia solanacearum, a widespread bacterial plant pathogen in the post-genomic era. Mol Plant Pathol. 14(7):651–662. [DOI] [PMC free article] [PubMed] [Google Scholar]
- Perrier A, Barlet X, Rengel D, Prior P, Poussier S, Genin S, Guidot A.. 2019. Spontaneous mutations in a regulatory gene induce phenotypic heterogeneity and adaptation of Ralstonia solanacearum to changing environments. Environ Microbiol. 21(8):3140–3152. [DOI] [PubMed] [Google Scholar]
- Perrier A, Peyraud R, Rengel D, Barlet X, Lucasson E, Gouzy J, Peeters N, Genin S, Guidot A.. 2016. Enhanced in planta fitness through adaptive mutations in EfpR, a dual regulator of virulence and metabolic functions in the plant pathogen Ralstonia solanacearum. PLoS Pathog. 12(12):e1006044-23. [DOI] [PMC free article] [PubMed] [Google Scholar]
- Peyraud R, Cottret L, Marmiesse L, Genin S.. 2018. Control of primary metabolism by a virulence regulatory network promotes robustness in a plant pathogen. Nat Commun. 9(418). Doi:10.1038/s41467-017-02660-4 [DOI] [PMC free article] [PubMed] [Google Scholar]
- Peyraud R, Cottret L, Marmiesse L, Gouzy J, Genin S.. 2016. A resource allocation trade-off between virulence and proliferation drives metabolic versatility in the plant pathogen Ralstonia solanacearum. PLOS Pathog. 12(10):e1005939. [DOI] [PMC free article] [PubMed] [Google Scholar]
- Planas-Marquès M, Kressin JP, Kashyap A, Panthee DR, Louws FJ, Coll NS, Valls M.. 2020. Four bottlenecks restrict colonization and invasion by the pathogen Ralstonia solanacearum in resistant tomato. J Exp Bot. 71(6):2157–2171. [DOI] [PMC free article] [PubMed] [Google Scholar]
- Plener L, Manfredi P, Valls M, Genin S.. 2010. PrhG, a transcriptional regulator responding to growth conditions, is involved in the control of the type III secretion system regulon in Ralstonia solanacearum. J Bacterioal. 192(4):1011–1019. [DOI] [PMC free article] [PubMed] [Google Scholar]
- Poland JA, Balint-Kurti PJ, Wisser RJ, Pratt RC, Nelson RJ.. 2009. Shades of gray: the world of quantitative disease resistance. Trends Plant Sci. 14(1):21–29. [DOI] [PubMed] [Google Scholar]
- Poueymiro M, Cunnac S, Barberis P, Deslandes L, Peeters N, Cazale-Noel A-C, Boucher C, Genin S.. 2009. Two type III secretion system effectors from Ralstonia solanacearum GMI1000 determine host-range specificity on tobacco. Mol Plant Microbe Interact. 22(5):538–550. [DOI] [PubMed] [Google Scholar]
- Robinson MD, Oshlack A.. 2010. A scaling normalization method for differential expression analysis of RNA-seq data. Genome Biol. 11(3):R25. [DOI] [PMC free article] [PubMed] [Google Scholar]
- Robinson MD, Smyth GK.. 2008. Small-sample estimation of negative binomial dispersion, with applications to SAGE data. Biostatistics 9:321–332. [DOI] [PubMed] [Google Scholar]
- Salanoubat M, Genin S, Artiguenave F, Gouzy J, Mangenot S, Arlat M, Billault A, Brottier P, Camus JC, Cattolico L, et al. 2002. Genome sequence of the plant pathogen Ralstonia solanacearum. Nature 415(6871):497–502. [DOI] [PubMed] [Google Scholar]
- Sánchez-Romero MA, Casadesús J.. 2019. The bacterial epigenome. Nat Rev Microbiol. 18:7–20. [DOI] [PubMed] [Google Scholar]
- Song S, Fu S, Sun X, Li P, Wu J, Dong T, He F, Deng Y, Song S, Fu S, et al. 2018. Identification of cyclic dipeptides from Escherichia coli as new antimicrobial agents against Ralstonia solanacearum. Molecules 23(1):214. [DOI] [PMC free article] [PubMed] [Google Scholar]
- Tenaillon O, Rodríguez-Verdugo A, Gaut RL, McDonald P, Bennett AF, Long AD, Gaut BS.. 2012. The molecular diversity of adaptive convergence. Science 335(6067):457–461. [DOI] [PubMed] [Google Scholar]
- Thoquet P, Olivier J, Sperisen C, Rogowsky P, Laterrot H, Grimsley N. 1996. Quantitative trait loci determining resistance to bacterial wilt in tomato cultivar Hawaii7996. Mol Plant Microbe Interact. 9(9):826–836. [Google Scholar]
- Trivedi P, Wang N.. 2014. Host immune responses accelerate pathogen evolution. ISME J. 8(3):727–731. [DOI] [PMC free article] [PubMed] [Google Scholar]
- Vandecraen J, Chandler M, Aertsen A, Van Houdt R.. 2017. The impact of insertion sequences on bacterial genome plasticity and adaptability. Crit. Rev. Microbiol. 43(6):709–730. [DOI] [PubMed] [Google Scholar]
- Vandenbussche I, Sass A, Pinto-Carbó M, Mannweiler O, Eberl L, Coenye T.. 2020. DNA methylation epigenetically regulates gene expression in Burkholderia cenocepacia and controls biofilm formation, cell aggregation, and motility. mSphere 5(4):e00455-20.https://msphere.asm.org/content/5/4/e00455-20 [DOI] [PMC free article] [PubMed] [Google Scholar]
- Vasse J, Genin S, Frey P, Boucher C, Brito B.. 2000. The hrpB and hrpG regulatory genes of Ralstonia solanacearum are required for different stages of the tomato root infection process. Mol Plant Microbe Interact. 13(3):259–267. [DOI] [PubMed] [Google Scholar]
- Wang J-F, Ho F-I, Truong HTH, Huang S-M, Balatero CH, Dittapongpitch V, Hidayati N.. 2013. Identification of major QTLs associated with stable resistance of tomato cultivar ‘Hawaii 7996’ to Ralstonia solanacearum. Euphytica 190(2):241–252. [Google Scholar]
- Wicker E, Grassart L, Coranson-Beaudu R, Mian D, Guilbaud C, Fegan M, Prior P.. 2007. Ralstonia solanacearum strains from Martinique (French West Indies) exhibiting a new pathogenic potential. Appl Environ Microbiol. 73(21):6790–6801. [DOI] [PMC free article] [PubMed] [Google Scholar]
- Wicker E, Grassart L, Coranson-Beaudu R, Mian D, Prior P.. 2009. Epidemiological evidence for the emergence of a new pathogenic variant of Ralstonia solanacearum in Martinique (French West Indies). Plant Pathol. 58(5):853–861. [Google Scholar]
- Zhang Y, Zhang W, Han L, Li J, Shi X, Hikichi Y, Ohnishi K.. 2019. Involvement of a PadR regulator PrhP on virulence of Ralstonia solanacearum by controlling detoxification of phenolic acids and type III secretion system. Mol Plant Pathol. 20(11):1477–1490. [DOI] [PMC free article] [PubMed] [Google Scholar]
- Zuluaga AP, Puigvert M, Valls M.. 2013. Novel plant inputs influencing Ralstonia solanacearum during infection. Front Microbiol. 4:349. [DOI] [PMC free article] [PubMed] [Google Scholar]
Associated Data
This section collects any data citations, data availability statements, or supplementary materials included in this article.