

Abstract
Previous reports have shown that environmental temperature impacts proteome evolution in Bacteria and Archaea. However, it is unknown whether thermoadaptation mainly occurs via the sequential accumulation of substitutions, massive horizontal gene transfers, or both. Measuring the real contribution of amino acid substitution to thermoadaptation is challenging, because of confounding environmental and genetic factors (e.g., pH, salinity, genomic G + C content) that also affect proteome evolution. Here, using Methanococcales, a major archaeal lineage, as a study model, we show that optimal growth temperature is the major factor affecting variations in amino acid frequencies of proteomes. By combining phylogenomic and ancestral sequence reconstruction approaches, we disclose a sequential substitutional scheme in which lysine plays a central role by fine tuning the pool of arginine, serine, threonine, glutamine, and asparagine, whose frequencies are strongly correlated with optimal growth temperature. Finally, we show that colonization to new thermal niches is not associated with high amounts of horizontal gene transfers. Altogether, although the acquisition of a few key proteins through horizontal gene transfer may have favored thermoadaptation in Methanococcales, our findings support sequential amino acid substitutions as the main factor driving thermoadaptation.
Keywords: ancestral sequence reconstruction, horizontal gene transfer, Methanococci, protein, extremophiles, prokaryotes, evolutionary rates
Introduction
Environmental surveys have revealed that microorganisms are able to colonize a wide variety of environments (e.g., soil, ocean, fresh water, subsurface, human body), including those with the most extreme physicochemical conditions (e.g., high solvent/metal contaminations, hydrostatic pressure, aridity, radiations, elevated temperatures, extreme pH values, high salt concentrations) (Pikuta et al. 2007; Merino et al. 2019). The ability of microbes to adapt to these harsh conditions is a key issue with microbiological, ecological, evolutionary, industrial, and biotechnical implications (Canganella and Wiegel 2011; Dumorne et al. 2017; Coker 2019; Sayed et al. 2020). Regarding temperature, prokaryotes are reported to grow in pure culture from −15 °C (the bacterium Planococcus halocryophilus Or1) up to 122 °C (the archaeon Methanopyrus kandleri 116) (see Merino et al. [2019] and references therein). Depending on their optimal growth temperature (OGT), microorganisms are called psychrophiles (OGT < 20 °C), mesophiles (20 °C < OGT ≤ 45 °C), thermophiles (45 °C < OGT < 80 °C), or hyperthermophiles (80 °C ≤ OGT) (Burgess et al. 2007; Merino et al. 2019). Environmental temperature imposes strong constraints on cells as it impacts the structure and the properties of macromolecules, the kinetics of chemical reactions, and enzymatic activities. Low temperature decreases enzymatic activity and membrane fluidity, alters the structure of proteins, and leads to the formation of ice crystals damaging cell structures (D’Amico et al. 2006; Siddiqui et al. 2013; De Maayer et al. 2014; Tribelli and Lopez 2018; Collins and Margesin 2019). Thus, psychrophiles have enzymes able to maintain proper folding and catalytic efficiency at very low temperatures (Privalov 1990; Feller and Gerday 2003). They possess specific chaperones (Petitjean et al. 2012): their membranes are enriched in unsaturated lipids: and they accumulate intracellular cryoprotectant compounds (Chintalapati et al. 2004; Koga 2012; Siliakus et al. 2017; Collins and Margesin 2019). High temperature increases membrane fluidity, denatures nucleic acids and proteins, and impacts protein folding. As a consequence, in thermophilic and hyperthermophilic prokaryotes, membranes are enriched in saturated lipids, stabilized by membranous proteins, and contain specific transporter systems (Albers et al. 2001; Konings 2006; Albers and Driessen 2007; Koga 2012; Siliakus et al. 2017). These microorganisms also have protection systems against DNA damage (Brochier-Armanet and Forterre 2006; Lipscomb et al. 2017). Furthermore, the stems of their structural RNAs (i.e., transfer RNA and ribosomal RNA) are enriched in G:C pairs, resulting in increased RNA thermostability (Galtier and Lobry 1997). Thermophiles also harbor increased frequency and diversity of tRNA modifications, that increase their stability, in comparison with their mesophilic and psychrophilic counterparts (see Lorenz et al. [2017] and reference therein). In addition, proteins from hyperthermophiles and thermophiles are more compact and contain higher numbers of salt bridges, hydrogen bonds, and hydrophobic interactions, and harbor improved packing that increase their stability at high temperature (Vieille and Zeikus 2001; Berezovsky and Shakhnovich 2005; Coquelle et al. 2007; Greaves and Warwicker 2007; Luke et al. 2007; Chakraborty et al. 2015). Finally, chaperones play an important role by protecting nascent proteins from heat-induced misfolding and aggregation (Godin-Roulling et al. 2015; Feller 2018).
Looking at how microbial species have coped with changes in environmental temperature over evolutionary time is key for deciphering the underlying adaptative mechanisms. Phylogenetic studies reported that hyperthermophilic and thermophilic prokaryotes exhibit shorter branches than their mesophilic relatives, most probably as a consequence of slower evolutionary rates (Woese 1987; Friedman et al. 2004; Stetter 2006; Drake 2009; Groussin and Gouy 2011). Protein sequence comparisons in prokaryotes also revealed positive correlations between OGT and glutamate, lysine, valine, tyrosine, and arginine frequencies, whereas glutamine displays the opposite trend (McDonald et al. 1999; Kreil and Ouzounis 2001; Vieille and Zeikus 2001; Tekaia et al. 2002; Farias and Bonato 2003; Zeldovich et al. 2007; Smole et al. 2011). It would be tempting to interpret these observations as the result of a universal pattern of amino acid substitution that drives protein thermoadaptation in prokaryotes (Chakravarty and Varadarajan 2000). Yet, the situation is probably more complex, as temperature is not the unique factor impacting amino acid frequencies in proteomes. For instance, the genomic G + C content was shown to dominate over other factors in prokaryotes, explaining more than 75–80% of the observed variance (Kreil and Ouzounis 2001; Boussau et al. 2008; Puigbo et al. 2008). Furthermore, additional factors such as metabolism and salinity also impact the amino acid composition of prokaryotic proteomes (Paul et al. 2008; Vieira-Silva and Rocha 2008; Narasingarao et al. 2012). As a consequence, the variation of observed amino acid frequencies between proteomes is the result of multiple factors with different and possibly opposite effects. This may explain discrepancies among studies, in particular regarding the impact of OGT on serine, threonine, asparagine, histidine, and isoleucine frequencies in proteomes (Haney et al. 1999; McDonald et al. 1999; Kreil and Ouzounis 2001; Singer and Hickey 2003; Smole et al. 2011). In addition, although many studies focused on proteome amino acid frequency variations, the underlying substitutional process remains to be deciphered. Finally, it was also suggested that horizontal gene transfer (HGT) might facilitate thermoadaptation by providing proteins with key functions and/or with optimal amino acid composition (see, for instance, Brochier-Armanet and Forterre 2006; Brochier-Armanet et al. 2011; van Wolferen et al. 2013; Feng et al. 2014; Lopez-Garcia et al. 2015; and references therein). However, the relative contribution of HGTs to thermoadaptation compared with that of variations in amino acid compositions between proteomes needs to be clarified.
Among prokaryotes, the Methanococci class represents a very interesting model (table S1, Supplementary Material online), factors all known to impact amino acid frequencies in proteomes. The comparison of 115 homologous proteins from the hyperthermophilic Methanocaldococcus jannaschii and mesophilic Methanococcus species identified a set of 26 pairs of amino acids with strong asymmetrical substitution biases possibly linked to temperature adaptation (supplementary table S2, Supplementary Material online) (Haney et al. 1999). A similar analysis performed on 99 proteins identified 19 additional pairs (supplementary table S2, Supplementary Material online) (McDonald et al. 1999). Yet, these studies are incomplete as they are based on a very limited set of proteins from a few strains and do not correct for the influence of phylogenetic relatedness among species, a phenomenon called phylogenetic inertia which can create artificial correlations between two traits evolving along the same phylogeny (Felsenstein 1985).
Here, we present an in-depth investigation of the evolutionary processes and molecular mechanisms driving thermoadaptation, using Methanococcales as a model. By combining phylogenomics and ancestral sequence reconstruction, we show that thermoadaptation is the main factor impacting the variation of amino acid frequencies between proteomes in this major archaeal lineage. Our analysis also reveals that all proteins within proteomes are shaped by temperature following the same pattern, irrespective of protein function. The detailed analysis of the substitution patterns associated with OGT changes disclosed a sequential substitutional scheme involving lysine, as a central hub, and five other major amino acids: arginine, serine, threonine, glutamine, and, to a lesser extent, asparagine. Finally, large-scale phylogenetic analyses showed that thermoadaptation is not quantitatively associated with HGTs, suggesting that adaptation toward mesophilic or thermophilic lifestyles does not involve a massive turnover of gene content.
Results
Temperature Is the Dominant Factor Impacting Amino Acid Frequencies of Methanococcales Proteomes
To measure the individual contribution of temperature on amino acid frequencies, we first performed a correspondence analysis (CA) on the amino acid contents of 18 methanococcales proteomes (fig. 1A). We observed that the first CA factor, accounting for 70% of the total variance, was highly correlated with OGT (r2 = −0.96, P value <0.001) (fig. 1B and table 1), and not with genomic G + C content (r2 = −0.06, P value = 0.8), which is usually the dominant contributing factor in prokaryotes. The second CA factor (21% of the total variance) was highly correlated with genomic G + C content (r2 = −0.77, P value <0.001) (fig. 1C and table 1), and not with OGT (r2 = 0.08, P value = 0.7). After accounting for the effect of phylogenetic inertia (see Materials and Methods) (Felsenstein 1985), OGT remains strongly correlated with the first CA factor (r2 = −0.79, P value <0.001), and the genomic G + C remains associated with the second CA factor (r2 = −0.89, P value <0.001) (table 1). We also verified that OGT and genomic G + C content were independent. As expected, there was no correlation between OGT and genomic G + C content (r2 = 0.0134 and P value = 0.9594, supplementary fig. S2, Supplementary Material online), confirming earlier studies (Galtier and Lobry 1997; Boussau et al. 2008).
Fig. 1.

Correspondence analyses of amino acid compositions of 18 methanococcales proteomes. (A) First factorial map of the correspondence analysis on the amino acid frequencies of 18 methanococcales proteomes. Dots represent the scores of each strain on the first two axes of the analysis. Red dots indicate hyperthermophilic strains with OGT ≥ 80 °C, namely: infer: Methanocaldococcus infernus ME (85 °C), villo: Methanocaldococcus villosus KIN24-T80, vulca: Methanocaldococcus vulcanius M7 (80 °C), ferve: Methanocaldococcus fervens AG86 (85 °C), janna: Methanocaldococcus jannaschii DSM 2261 (85 °C), FS406: Methanocaldococcus sp. FS406-22 (90 °C), igneu: Methanotorris igneus Kol 5 (88 °C). Orange dots indicate strains with 80 °C > OGT > 45 °C, namely: formi: Methanotorris formicicus Mc-S-70, okina: Methanothermococcus okinawensis IH1 (62 °C), thermo: Methanothermococcus thermolithotrophicus DSM 2095, aeoli: Methanococcus aeolicus Nankai-3 (46 °C). Blue dots indicate strains with OGT ≤ 45 °C, namely: vanni: Methanococcus vannielii SB (35 °C), volta: Methanococcus voltae A3 (37 °C), marC5/C6/C7/S2/X1: Methanococcus maripaludis strains C5 (37 °C), C6 (37 °C), C7 (37 °C), S2 (37 °C), and X1. (B) Correlation between OGT and scores on the first axis of the correspondence analysis. Each dot corresponds to a methanococcales proteome. The values on the first axis of the correspondence analysis are strongly correlated with OGT (r2 = −0.96, P value <0.001) but not with genomic G + C content (r2 = −0.06, P value = 0.8). (C) Correlation between genomic G + C content and scores on the second axis of the correspondence analysis. Each dot corresponds to a methanococcales proteome. The values on the second axis of the correspondence analysis are strongly correlated with G + C content (r = −0.77, P value <0.001) but not to OGT (r = 0.08, P value = 0.7). (D) Amino acid position on the first two factorial axes of the correspondence analysis on the amino acid frequencies of Methanococcales proteomes. Amino acids associated with high OGT are on the left, amino acids associated with moderate OGT are on the right.
Table 1.
Correspondence Analyses of Proteome Amino Acid Compositions of 18 Methanococcales.
| Complete Proteome |
Core Proteome |
Accessory Proteome |
BCA |
|||||
|---|---|---|---|---|---|---|---|---|
| 1st Axis | 2nd Axis | 1st Axis | 2nd Axis | 1st Axis | 2nd Axis | 1st Axis | 2nd Axis | |
| Explained variance | 70% | 21% | 69% | 20% | 66% | 22% | 53% | 41% |
| Correlation with OGT | −0.96* | 0.08 | −0.95* | −0.11 | −0.96* | 0.01 | 0.43 | −0.11 |
| Correlation with genomic G + C content | −0.06 | −0.77* | −0.11 | 0.89* | 0.01 | 0.87* | 0.04 | −0.25 |
| Correlation with OGT (PIC) | −0.79* | −0.18 | −0.81* | 0.2 | −0.73* | 0.18 | — | — |
| Correlation with genomic G + C content (PIC) | −0.32 | −0.89* | −0.35 | 0.89* | −0.18 | 0.86* | — | — |
|
WCA |
||||||||
|
Information Storage and Processing |
Cellular Process and Signaling |
Metabolism |
Poorly Characterized |
|||||
| 1st Axis | 2nd Axis | 1st Axis | 2nd Axis | 1st Axis | 2nd Axis | 1st Axis | 2nd Axis | |
| Correlation with OGT | 0.96* | 0.3 | 0.97* | 0.14 | 0.97* | 0.08 | 0.93* | 0.22 |
| Correlation with genomic G + C content | 0.07 | 0.86* | 0.03 | 0.83* | 0.03 | 0.91* | 0.12 | 0.86* |
| Correlation with OGT (PIC) | 0.82* | 0.23 | 0.8* | 0.05 | 0.82* | 0.23 | 0.59* | 0.07 |
| Correlation with genomic G + C content (PIC) | 0.31 | 0.82* | 0.13 | 0.78* | 0.29 | 0.92* | 0.42 | 0.84* |
Note.—The table reports the results of correlation tests between scores on the first two axes of the correspondence analyses and either the OGT or the genomic G + C content of the studied strains. Correspondence analyses were performed on complete proteomes, on the 1,026 methanococcales universal protein families (core proteome), and on the 3,533 remaining protein families (accessory proteome). Between class analysis (BCA) and within class analysis (WCA) were performed on the four functional classes of proteins, defined according to the arCOG classification (Makarova et al. 2015). Variance between classes and within classes explained respectively 53% and 47% of the total variance observed among functional classes. For each analysis, the percentage of variance explained by the first two axes is indicated. For correlation tests, significant results are indicated by a star. Correction with the phylogenetic independence contrast (PIC) method did not change the results of the correlation tests.
To go further, we wondered whether temperature shapes all proteins in the proteome following a consistent pattern, by separately analyzing the core and accessory proteomes. The first factor, accounting for 69% and 66% of the total variance observed in core and accessory proteomes, respectively, was highly correlated with OGT, whereas the second axis was correlated with genomic G + C content (table 1 and supplementary fig. S3, Supplementary Material online). This suggests that OGT is the dominant factor impacting amino acid compositions of both core and accessory proteomes. Then, we wondered if proteins with different functions are differentially impacted by OGT. Applying between- and within-group correspondence analyses (BCA and WCA, respectively) on the four functional classes defined in the arCOG database (supplementary fig. S4, Supplementary Material online) (Makarova et al. 2015) revealed that 53% of the observed variance is linked to between-group differences, whereas the remaining 47% of the observed variance is linked to within-group variations. BCA results indicated that the four functional classes can be discriminated according to their amino acid composition (supplementary fig. S5, Supplementary Material online). The first two axes of the BCA explained 53% and 41% of the amino acid compositional variance observed between functional classes (supplementary fig. S5, Supplementary Material online), but they were linked neither to OGT nor genomic G + C content (table 1), meaning that other factors (e.g., transcription levels) could be responsible of the observed variance. Regarding WCA, the first two axes explained 66% and 20% of the variance in amino acid frequency observed within functional classes (fig. 2). Scores on the first axis were significantly correlated with OGT (r2 = 0.93–0.97, P value <0.01) and not with genomic G + C content (r2 = 0.03–0.12, P value >0.05), which also holds true after correcting for phylogenetic inertia (table 1 and supplementary fig. S6, Supplementary Material online). Conversely, scores on the second axis were significantly correlated with genomic G + C content (r2 = 0.83–0.91, P value <0.01) and not with OGT (r2 = 0.08–0.22, P value >0.05), which also holds true after correcting for phylogenetic inertia (table 1 and supplementary fig. S6, Supplementary Material online). This shows that within each functional class, OGT is the major factor impacting amino acid composition variations among strains (supplementary fig. S6, Supplementary Material online) and that strains can be discriminated according to their OGT, irrespectively of the considered functional class. It is noteworthy that similar results were obtained at a smaller scale. Indeed, when analyzing functional arCOG categories, corresponding to subdivisions of the four functional classes (supplementary fig. S4, Supplementary Material online), 15 out of 19 displayed a significant correlation between scores on the first axis of the CA and OGT (r2 ≥ 0.76, P value <0.01, supplementary table S3, Supplementary Material online). Altogether, these data indicate that, in Methanococcales, environmental temperature has a major and consistent effect on amino acid compositions within each class and category of protein function.
Fig. 2.

Within-group correspondence analysis of proteins from 18 Methanococcales proteomes. Functional classes of the Methanococcales proteins were defined according to the arCOG database. Each mark represents the score of a given functional class in a given Methanococcales strain, on the first factorial map of the analysis. Colored ellipses and labels correspond to strains, light gray ellipses and labels correspond to mesophiles (OGT ≤ 45 °C), thermophiles (45 °C < OGT < 80 °C), and hyperthermophiles (80 °C ≤ OGT). Width and height of ellipses are proportional to scores variances of the group on the first and second axes.
Arg, Ser, Thr, Gln, Asn, and Trp Frequencies Are Correlated with OGT
Next, we identified the amino acids that are hallmarks of OGT. The CA of methanococcales proteomes showed that some charged amino acids (arginine and lysine), uncharged polar residues (asparagine, threonine, glutamine, and serine), and one nonpolar residue (methionine) account most strongly for compositional differences between proteomes (fig. 1D). To go further, we measured the correlation between OGT and individual amino acid frequencies in 538 single copy core protein families shared between Methanococcales and the two other classes of Methanomada using two different approaches: a Pearson correlation test with correction for phylogenetic inertia and the ANCOV method. The ANCOV method, based on a Kalman filtering algorithm, estimates the correlation between a quantitative trait (here OGT) and amino acid frequencies in both extant and extinct species by considering phylogenetic inertia (Lartillot 2014). Both approaches highlighted a significant positive correlation between arginine and OGT and a significant negative correlation between OGT and serine (table 2). Significant negative correlations between OGT and asparagine, threonine, glutamine, and tryptophan were also observed with the ANCOV method (table 2). Interestingly, some of these amino acids were reported to have temperature-dependent impact on protein structure and stability (see Zhou et al. [2008] and reference therein). For instance, arginine is known to increase protein thermostability through hydrogen bonds (Coquelle et al. 2007), whereas asparagine and glutamine are thermolabile and sensitive to deamination, a chemical reaction that can lead to protein backbone cleavage at high temperature (Tomazic and Klibanov 1988).
Table 2.
Correlations between OGT and Amino Acid Frequencies.
| Amino Acid | Pearson Correlation Test after Correction for Phylogenetic Inertia | Kalman–Gibbs Estimated Correlation (ANCOV Method) |
|---|---|---|
| Ala | 0.19 | 0.32 |
| Arg | 0.72* | 0.52* |
| Asn | −0.47 | −0.49* |
| Asp | 0.03 | 0.06 |
| Cys | 0.16 | −0.03 |
| Glu | 0.46 | 0.3 |
| Gln | 0.59 | −0.38* |
| Gly | −0.1 | 0.06 |
| His | 0.23 | 0.12 |
| Ile | 0.02 | −0.04 |
| Leu | 0.18 | 0.09 |
| Lys | 0.59 | 0.25 |
| Met | −0.55 | −0.24 |
| Phe | −0.09 | −0.05 |
| Pro | 0.43 | 0.39 |
| Ser | −0.84* | −0.57* |
| Thr | −0.59 | −0.41* |
| Trp | 0.34 | 0.51* |
| Tyr | 0.2 | 0.16 |
| Val | 0.41 | 0.35 |
Note.—Correlations between OGT and individual amino acid frequencies were tested using a Pearson correlation test and the ANCOV method on the 538 core protein families shared between methanococcales and other methanomada. Statistically significant correlations (P value <0.01 after correction for multiple testing) are marked by a star.
Evolution of OGT in Methanococcales
Next, we wondered how did OGT evolve along the phylogeny of Methanococcales (supplementary fig. S7, Supplementary Material online). To address this question, we used two different in silico methods that leverage existing correlations between amino acid frequencies in proteomes and OGT to estimate ancestral OGT at each node of the Methanococcales phylogeny. The first method relies on the correlation between the CA scores and OGT in present-day species (Boussau et al. 2008; Groussin and Gouy 2011), whereas the second method, ANCOV, allows inferring quantitative traits along phylogenies using ancestral information and, importantly, accounts for phylogenetic inertia when inferring ancestral traits (Lartillot 2014). Before applying these two methods to ancestral OGT inference, we tested their accuracy in OGT prediction. Obviously, it is not possible to revive methanococcales ancestors to compare their OGT with in silico OGT predictions. To circumvent this issue, we applied both methods on the 17 present-day methanococcales strains with known OGT (supplementary table S1, Supplementary Material online). More precisely, we inferred the OGT of each present-day strain using information carried by the 16 other strains as input data for ANCOV and the CA. Both methods provided consistent estimations (r2 = 0.99 and P value <10−14, supplementary fig. S8A, Supplementary Material online) and realistic estimations of the true strain OGT (CA scores: r2 = 0.96 and P value <10−9, ANCOV: r2 = 0.96 and P value <10−8, table 3). The average differences between real and estimated OGTs were lower than 5 °C and 4.5 °C when using the CA scores and ANCOV, respectively. These results suggest that both methods can accurately predict OGT, at least when applied to Methanococcales.
Table 3.
Comparison of Present-Day Strains Real OGT and Inferred OGT with the Correspondence Analysis Score-Based Approach and the ANCOV Method.
| Optimal Growth Temperature |
|||
|---|---|---|---|
| Strain | CAS | ANCOV | Real |
| Methanocaldococcus fervens AG86 | 83 | 81 | 85 |
| Methanocaldococcus infernus ME | 93 | 90 | 85 |
| Methanocaldococcus jannaschii DSM 2661 | 85 | 90 | 85 |
| Methanocaldococcus sp. FS406 22 | 84 | 85 | 90 |
| Methanocaldococcus villosus | 90 | 80 | 80 |
| Methanocaldococcus vulcanius M7 | 78 | 79 | 80 |
| Methanococcus aeolicus Nankai 3 | 41 | 44 | 46 |
| Methanococcus maripaludis C5 | 42 | 37 | 37 |
| Methanococcus maripaludis C6 | 42 | 37 | 37 |
| Methanococcus maripaludis C7 | 42 | 37 | 37 |
| Methanococcus maripaludis S2 | 41 | 38 | 37 |
| Methanococcus maripaludis X1 | 41 | 37 | — |
| Methanococcus vannielii SB | 41 | 25 | 35 |
| Methanococcus voltae A3 | 37 | 51 | 37 |
| Methanothermococcus okinawensis IH1 | 55 | 60 | 62 |
| Methanothermococcus thermolithotrophicus | 58 | 58 | 65 |
| Methanotorris formicicus | 75 | 86 | 75 |
| Methanotorris igneus Kol 5 | 77 | 79 | 88 |
Note.—The approach based on correspondence analysis scores (CAS) and the ANCOV method applied on present-day strain to estimate their OGT provided consistent results (r2 = 0.99 and P value <10−14). Furthermore, the estimated OGT were consistent with the real OGT of the strains (correspondence analysis scores: r2 = 0.96 and P value <10−9 and ANCOV: r2 = 0.96 and P value = 10−8).
Inferring ancestral OGT with these approaches requires the estimation of ancestral amino acid frequencies, and thus the reconstruction of ancestral sequences. We used two different probabilistic methods to infer ancestral sequences: BPPANCESTOR (Dutheil and Boussau 2008) and FASTML (Ashkenazy et al. 2012) (see Materials and Methods). Both methods applied on the 538 single copy core protein families of methanococcales provided consistent results. In fact, the ancestral sequences inferred at each node of the Methanococcales phylogeny displayed very similar amino acid frequencies (all r2 > 0.99 and P values <10−20, supplementary table S4, Supplementary Material online), suggesting that the choice of one method over the other will not significantly impact the estimation of ancestral OGT. Then, ancestral amino acid frequencies were used to infer OGT of the each methanococcales ancestors using CA scores. As expected, no significant difference was observed when using FASTML or BPPANCESTOR data to infer ancestral OGT (r2 = 0.98 and P value <10−21, table 4). Interestingly, ancestral OGTs inferred at each node of the phylogeny with either CA scores or ANCOV were consistent (r2 < 0.99 and P value = 10−14, table 4 and supplementary fig. S9A and B, Supplementary Material online), yet with smaller confidence intervals with ANCOV predictions (supplementary fig. S9A and C, Supplementary Material online).
Table 4.
Comparison of the Ancestral OGT Inferred with Correspondence Analysis Scores and ANVOC Approaches Using Either the Ancestral Sequences Reconstructed with FASTML or BPPANCESTOR.
| Correspondence Analysis Scores-Based Ancestral OGT Estimation |
ANCOV-Based Ancestral OGT Estimation |
||
|---|---|---|---|
| Ancestral node | FASTML | BPPANCESTOR | BPPANCESTOR |
| ancestor_2 | 88 | 86 | 86 |
| ancestor_7 | 78 | 78 | 82 |
| ancestor_9 | 60 | 58 | 59 |
| ancestor_14 | 41 | 41 | 36 |
| ancestor_17 | 41 | 41 | 34 |
| ancestor_16 | 41 | 41 | 36 |
| ancestor_15 | 42 | 41 | 36 |
| ancestor_13 | 47 | 46 | 41 |
| ancestor_1 | 91 | 90 | 85 |
| ancestor_12 | 56 | 53 | 51 |
| ancestor_11 | 65 | 62 | 62 |
| ancestor_10 | 68 | 65 | 65 |
| ancestor_8 | 79 | 76 | 78 |
| ancestor_5 | 85 | 85 | 86 |
| ancestor_4 | 85 | 84 | 86 |
| ancestor_3 | 85 | 84 | 84 |
Note.—Applying the approach based on correspondence analysis scores on ancestral sequences reconstructed either with FASTML or BPPANCESTOR provided very consistent ancestral OGT estimations (r2 = 0.98 and P value <10−21). Similarly, OGT estimations based on the correspondence analysis scores and ANCOV were very consistent (r2 = 0.99 and P value <10−14).
Both approaches predicted that the last common ancestor of all present-day methanococcales was hyperthermophilic, with an OGT close to 80 °C (fig. 3 and node 6 in supplementary fig. S9A, Supplementary Material online). Although all Methanocaldococcus lineages remained adapted to hot environments, independent OGT shifts occurred in Methanotorris, Methanothermococcus, and Methanococcus. Interestingly, opposite adaptation trajectories can be observed for three pairs of sister lineages: 1) although the ancestral Methanotorris OGT was predicted to be close to 80 °C, it increased up to 88 °C in the branch leading to Methanotorris igneus and decreased down to 75 °C in Methanotorris formicicus, 2) the OGT dropped down to 46 °C in the Methanococcus aeolicus lineage, whereas it remained close to 60 °C in Methanothermococcus okinawensis, and 3) the OGT was stable in the branch leading to Methanothermococcus thermolithotrophicus, whereas it decreased to 35–37 °C in Methanococcus vannielii, Methanococcus voltae and Methanococcus maripaludis. Finally, along the tree, a negative correlation is observed between branch lengths and OGT (supplementary fig. S10, Supplementary Material online), confirming that mesophilic organisms have globally higher substitution rates (Friedman et al. 2004; Drake 2009; Groussin and Gouy 2011). The only exception concerns Methanocaldococcus villosus and Methanocaldococcus infernus, two sister hyperthermophilic lineages with very long branches as compared with other hyperthermophiles. It is tempting to interpret this as ancient marks of OGT shifts toward colder environments that would have occurred in this lineage. Testing this hypothesis would require a better taxonomic coverage of this part of the Methanococcales tree. Altogether, our data showed that, originating from a hyperthermophilic ancestor, several adaptations to lower OGTs independently occurred during the diversification of Methanococcales, and that the colonization of these moderate environments was associated with higher evolutionary rates.
Fig. 3.

Evolution of OGT in Methanococcales. Rooted maximum likelihood phylogeny of Methanococcales inferred with 538 single copy core protein families shared between Methanococcales and other Methanomada (127,077 amino acid positions). The tree is rooted in the branch separating Methanococcales from other Methanomada classes. The whole tree is shown as supplementary figure S7, Supplementary Material online. Branches were colored according to OGT estimated at each node of the phylogeny with the ANCOV method. Estimated ancestral OGT and confidence interval (95%) are on the left of each node. OGT of present-day strains are indicated at each leave. Scale bars represent the OGT (°C) color scheme and the average number of substitutions per site.
Substitution Patterns Underlying OGT Shifts
The different adaptive trajectories observed in Methanococcales represent a valuable resource to uncover the molecular mechanisms underlying thermoadaptation. For this, we computed the amino acid substitution matrices corresponding to each of the 34 branches of the Methanococcales phylogeny. Comparisons of sij, the number of substitutions from amino acid i to amino acid j, and sji, the number of substitutions from j to i (with i ≠ j), using binomial tests corrected for multiple testing identified 48 out of 190 amino acid pairs with a significant biased net balance (supplementary table S5, Supplementary Material online). For 34 amino acid pairs, substitutions were biased in only one direction (i.e., from i to j but not from j to i), whereas for the 14 remaining pairs, biased substitutions were observed in either one or the other direction, depending on given branches. Altogether, among the 62 substitution types displaying a biased net balance, 23 (37.1%) were observed in a single branch of the methanococcales tree, 9 (14.5%) in two different branches, and 30 (48.4%) in at least three different branches (supplementary table S5, Supplementary Material online). It is worth noting that 21 out of these 30 pairs involved at least one amino acid whose frequency was correlated with OGT (table 5).
Table 5.
Substitution Types Displaying a Significant Asymmetrical Net Balance in at least Three Branches of the Methanococcales Tree and Involving at least One Amino Acid with Frequency Correlated with OGT.
| i | j | Number of Branches | Net Change | OGT Variation (min/max) |
|---|---|---|---|---|
| Ser | Ala | 3 | 48–69 | +2/+6 |
| Lys | Arg | 13 | 79–655 | −7/+6 |
| Met | Leu | 3 | 92–128 | −0/+1 |
| Gly | Asn | 5 | 56–78 | −6/+1 |
| Asn | Ser | 8 | 53–135 | −13/+6 |
| Asp | Asn | 7 | 131–241 | −14/+3 |
| Lys | Ser | 12 | 42–664 | −14/+3 |
| Glu | Ser | 11 | 42–112 | −14/+3 |
| Glu | Asn | 8 | 89–156 | −14/+3 |
| Asp | Ser | 5 | 44–78 | −14/+3 |
| Ala | Ser | 11 | 57–281 | −14/0 |
| Lys | Asn | 8 | 106–459 | −14/+3 |
| Lys | Gln | 5 | 56–178 | −14/+3 |
| Glu | Gln | 5 | 44–248 | −14/+3 |
| Glu | Thr | 4 | 32–55 | −13/−5 |
| Lys | Thr | 8 | 51–188 | −14/−4 |
| Thr | Ser | 3 | 72–88 | −13/−6 |
| Arg | Lys | 4 | 140–226 | −13/−6 |
| Leu | Met | 3 | 70–142 | −14/−5 |
| Pro | Ser | 3 | 40–83 | −14/−7 |
| Val | Thr | 3 | 86–110 | −13/−11 |
Note.—The data were extracted from the table shown as supplementary , Net change corresponds to the net difference between the number substitutions from i → j and from j → i in the branches where an asymmetrical flow is observed. OGT variation corresponds to the minimum and maximum OGT variations associated with these branches.
Recurrent substitutional biases were rare in branches of hyperthermophiles where no major OGT shift was observed, excepted for substitutions from lysine to arginine (supplementary fig. S11A, Supplementary Material online). This suggests that these lineages have reached a near equilibrium state. The only exception concerned the stem of the clade encompassing Methanothermococcus infernus and Methanothermococcus, where biased substitutions from glutamine, serine, and threonine toward lysine were also detected (supplementary fig. S11A, Supplementary Material online). Surprisingly, this pattern mirrored the one observed in branches associated with a decrease in OGT, yet in opposite directions (see below).
For lineages that shifted toward lower temperatures, a strong and recurrent substitutional bias from arginine to lysine was observed (table 5 and supplementary fig. S11B, Supplementary Material online). Yet, the pool of lysine did not expand because the lysine enrichment from arginine was concomitantly counterbalanced by biased substitutions from lysine toward serine and asparagine, and to a lesser extent to threonine and glutamine (supplementary fig. S11B, Supplementary Material online). Our analysis also showed that glutamate and aspartate represent other sources of serine, threonine, asparagine, and glutamine when OGT decreases. Interestingly, biased substitutions between alanine and serine were associated with OGT variations, suggesting that alanine may represent another path to fine tune the pool of serine in proteomes. Finally, slight substitutional biases between methionine and leucine were associated with OGT variations. Regarding Methanothermococcus thermolithotrophicus and Methanothermococcus okinawensis, two thermophilic lineages with stable OGT, an intermediary pattern is observed, with biased substitutions from lysine to arginine, and biased substitutions from lysine to glutamine, asparagine, and serine (supplementary fig. S11B, Supplementary Material online). This suggests that these two lineages are in a kind of transition zone, around 60–65 °C, where substitution patterns associated with OGT increase and OGT decrease coexist.
We showed that OGT is the dominant factor shaping proteome amino acid frequencies in Methanococcales and that no other genetic or environmental factor (e.g., genomic G + C content, pH, metabolism) is as strong as temperature to change the amino acid frequencies of proteomes (see above). The analysis of substitutional patterns along the Methanococcales phylogeny disclosed a scheme in which lysine represents a substitutional hub that controls the frequencies of amino acids shown to be directly correlated with OGT (fig. 4). It is interesting to note that in this substitutional scheme, the frequency of lysine was not correlated with OGT because of the coexistence of opposite, yet equilibrated, substitution patterns leading to lysine from the one hand and departing from lysine on the other hand.
Fig. 4.
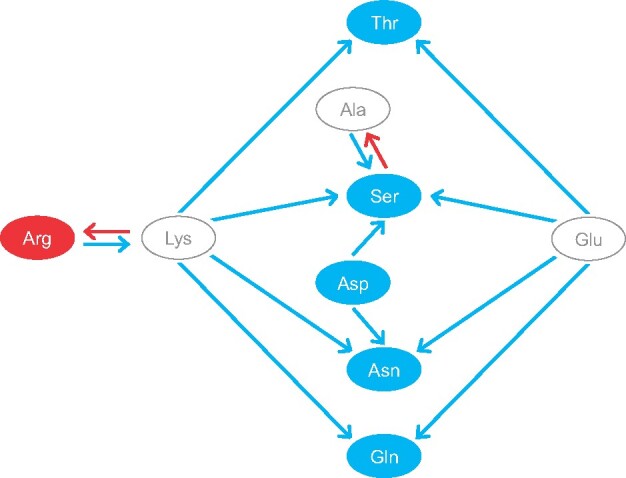
Substitutional patterns associated with thermoadaptation in Methanococcales. Red and blue circles highlight amino acids whose frequencies are positively and negatively correlated to OGT, respectively. Arrows indicate substitutions associated with OGT decrease (blue) and OGT increase (red).
Horizontal Gene Transfer and the Adaptation to Moderate Environments
We then asked whether transitions from hot to moderate environments in Methanococcales were promoted or facilitated by HGT. To test this hypothesis, we checked whether HGT occurred at higher rates in branches associated with OGT shifts. Among the 9,540 protein families assembled from the 27 methanomada proteomes, 2,116 contained more than two sequences and at least one sequence of methanococcales. Using the ALE software (Szöllősi et al. 2013), we identified 2,360 HGT events in Methanococcales affecting 1,394 (65.9%) protein families (fig. 5). This represents in average 1.12 events per protein family. We see a weakly significant correlation between the distribution of these HGT events along the phylogeny of Methanococcales and OGT (r2 = −0.31, P value = 0.07) or OGT variations (r2 = 0.34, P value = 0.048). Using COUNT (Csuros 2010) or GLOOME (Cohen et al. 2010), two other programs modeling gene gain and loss along a phylogeny, provided similar results (supplementary table S6, Supplementary Material online). The comparison of sister-branches associated with opposite OGT variations did not show correlation between HGT and OGT (fig. 5). For instance, a similar amount of HGT events was inferred in two sister-lineages with opposite OGT variations: 141 events in the branch of Methanotorris formicicus Mc-S-70 (OGT variation = −7 °C) and 132 events in the branch of Methanotorris igneus Kol 5 (OGT variation = +6 °C). Similarly, in the branch leading to Methanothermococcus okinawensis IH1, 128 HGT events were associated with a slight OGT increase (+3 °C), whereas 101 events were predicted in the Methanococcus aeolicus Nankai-3 branch despite an important decrease in OGT (−13 °C). Finally, the slight OGT increase observed in Methanothermococcus thermolithotrophicus DSM 2095 (+3 °C) was associated with a large number of HGTs (219 events), whereas many less events occurred in Methanococcus voltae A3 (149 events) and Methanococcus vannielii SB (160 events), despite large decreases in OGT (−25 °C and −27 °C, respectively). As HGT events are not distributed evenly along the phylogeny, we verified that the lack of association between OGT variation and the number of HGTs was consistent all along the phylogeny of Methanococcales. We found that most HGT events are located along terminal branches rather than along internal branches (fig. 5), which is expected as HGTs associated with internal branches correspond to gene acquisition that got fixed over evolutionary times. When focusing our analysis on HGT events occurring on terminal branches only, we observed even weaker correlations between HGT and OGT variations (fig. 5). Altogether, these results suggest that adaptation toward cold environments was not promoted or accompanied by higher rates of HGT in Methanococcales.
Fig. 5.

Quantification of HGT in Methanococcales. Internal branches are named according to their reference number on the tree (black number) or according to the strain name for terminal branches. The number of HGTs detected with ALE is indicated above each branch (blue). On the right part, branches are ordered according to the number of inferred HGTs. For each bar, the corresponding OGT variation according to figure 3 is indicated between brackets, colors correspond to mesophiles (OGT ≤ 45 °C): blue; thermophiles (45 °C < OGT < 80 °C): orange; hyperthermophiles (80 °C ≤ OGT): red.
Because punctual HGT events may have played an important role in thermoadaptation, we searched for transferred protein families specifically associated with mesophilic and thermophilic lifestyles in methanococcales. Among the 2,116 protein families, we identified 358 families (16.9%) present in mesophiles/thermophiles and absent in hyperthermophiles: 291 (13.8%) were specific to methanococcales, whereas 67 (3.1%) were also present in some methanobacteriales (supplementary table S7, Supplementary Material online). Because the ancestor of Methanomada is inferred as hyperthermophilic (fig. 3), it is tempting to interpret the presence of these 67 protein families in unrelated thermophilic and mesophilic strains of methanococcales and methanobacteriales as the result of convergent acquisitions via HGT, possibly linked to the OGT decreases observed during the diversification of these two lineages. Among these 67 protein families, 15 (0.7%) are largely distributed, being present in more than 80% of the mesophilic and thermophilic methanomada strains (supplementary table S7, Supplementary Material online). This suggests that these protein families could correspond to important factors for adaptation toward moderate environments, whereas the protein families with more restricted taxonomic distributions could result from punctual and strain-specific HGT, without a link to a mesophilic lifestyle. The phylogenetic analysis of these 15 protein families confirmed that they spread among mesophilic and thermophilic methanomada through independent HGT from various and unrelated prokaryotic donors, and in most cases from mesophilic or thermophilic species (supplementary fig. S12, Supplementary Material online). Altogether, our data show that only 67 proteins have been acquired via independent HGT in mesophilic and thermophilic methanomada. If these proteins have contributed to thermoadaptation, most of them are likely not essential to mesophilic lifestyle, as only 15 of them are largely distributed in these lineages.
A survey of the literature identified interesting links between temperature and some of these protein families, such as type B cyclophilin (PpiB) protein family (FAM000106). This protein is part of the peptidyl-prolyl cis–trans isomerases (PPiases) that are involved in protein folding in the three domains of life (Maruyama et al. 2004; Manteca et al. 2006). Several studies established a link between PpiB and cold resistance (e.g., in Bacillus subtilis, Graumann et al. 1996; Legionella pneumophila, Rasch et al. 2019; Methanococcoides burtonii, Goodchild et al. 2004; Thermococcus sp. KS1, Ideno et al. 2001; and yeast, Lee et al. 2018), suggesting that PpiB could be important for life at low or suboptimal OGT and thus for the colonization of moderate environments. The FAM001035 corresponds to the GlpF protein, a membrane transporter that is essential for the uptake of glycerol, an important cryoprotectant (Richey and Lin 1972). Furthermore, an elegant experimental evolution study showed that the deletion of the glpf gene induces an increase of OGT in Escherichia coli (Blaby et al. 2012), suggesting again a link between GlpF and thermoadaptation. It was also shown that the Aldo/Keto reductases (FAM00281) enhance cold tolerance in plants (Éva et al. 2014). Finally, correlations between the expression of some of other protein families and cold shock factors were reported in some organisms. For instance, the expression of the sodium/proline symporter coding gene putp (FAM000590) and several cold shock protein coding genes was shown to be controlled by the same regulator (YcfR) in E. coli (Zhang et al. 2007), whereas the acyl-CoA thioesterase FadM (FAM001298) belongs to the Fad and Fab super-families that contained many members involved in lipid metabolism that are induced by cold shocks (Spaniol et al. 2013). Further investigations on the function of these proteins are needed to confirm a potential role in thermoadaptation and resistance to low temperature in Methanococcales.
Discussion
Deciphering adaptive paths underlying responses to environmental changes is a major challenge in biology. Previous studies have shown that thermoadaptation heavily impacts the amino acid frequencies of proteomes in prokaryotes (Kreil and Ouzounis 2001; Vieille and Zeikus 2001; Tekaia et al. 2002; Farias and Bonato 2003; Zeldovich et al. 2007; McDonald 2010; Smole et al. 2011). Yet, other factors, such as genomic G + C content, optimal growth salinity, optimal growth pH, and metabolism are known to affect amino acid frequencies of proteomes. Because of these confounding factors, the substitutional patterns involved in thermoadaptation remained partially understood. In this context, Methanococcales represent a very interesting model as strains from this major archaeal lineage have very different OGT but are similar with respect to the other aforementioned confounding factors. Consistently, we showed that temperature is the dominant factor affecting proteome amino acid frequencies in this lineage, explaining most of the observed variance, irrespective of protein function.
A recent study revealed large amounts of HGT in three unrelated major archaeal lineages (i.e., uncultured marine groups II and III, Thaumarchaeota, and Halobacteria) known to have evolved from (hyper)thermophilic ancestors, suggesting that, in Archaea, massive HGTs played a crucial role in adaptation to mesophilic lifestyle (Lopez-Garcia et al. 2015). Our data indicated that in Methanococcales OGT shifts toward moderate environments were not associated with higher rate of HGT (see below). This may suggest that the high rates of HGT uncovered in uncultured marine groups II and III, Thaumarchaeota, and Halobacteria are specific of these lineages or that they are linked to multiple factors (e.g., major metabolic changes, colonization of new ecological niches), rather than to thermoadaptation alone. Strengthening this hypothesis, large amounts of HGT are not observed in other lineages that shifted from (hyper)thermophilic toward mesophilic lifestyles (e.g., Methanobacteriales, Methanomicrobiales) (Lopez-Garcia et al. 2015). The in-depth analysis of methanomada proteomes disclosed 2,360 HGT events, mainly located along terminal branches. Weakly significant correlations between the number of HGT and OGT shifts were observed, suggesting that adapting to new OGT did not require massive gene turnovers or acquisitions. Among the 1,394 protein families impacted by HGT, only 358 were specifically found in thermophiles or mesophiles. Interestingly, data from the literature suggested that some of the 15 acquired protein families with the largest taxonomic distribution in mesophilic and thermophilic methanomada could be involved in suboptimal growth temperature or cold temperature adaptation. However, none of the 358 proteins are found ubiquitous in mesophilic methanococcales. In fact, most of them display a narrow taxonomic distribution, indicating punctual and strain-specific acquisitions. This suggests that even if these genes are specifically found in Methanomada living in moderate environments, none of them can be considered as an essential or ubiquitous marker of life in moderate environments. Yet, we do not exclude that HGT might have facilitated to a certain degree the transition to moderate environments, for instance through independent and opportunistic strain-specific acquisitions of a few genes from different microbial communities living in such environments.
By combining phylogenomics and ancestral sequence reconstruction, we investigated OGT evolution in Methanococcales. Ancestral sequence reconstruction methods are powerful approaches allowing to decipher ancient phenotypes and the properties of ancient biomolecules (Thomson et al. 2005; Boussau et al. 2008; Gaucher et al. 2008; Finnigan et al. 2011; Groussin and Gouy 2011). The inference of ancestral quantitative traits from molecular sequences requires efficient methods 1) to reconstruct reliable ancestral sequences and 2) to deduce ancestral traits from the reconstructed sequences. This issue has been addressed in a recent study by Randall et al. (2016) who benchmarked the efficiency of ancestral reconstruction methods using an elegant approach based on random mutagenesis PCR to artificially evolve a gene along a phylogeny. They showed that tested methods inferred correctly the ancestral states of most amino acid sites in sequences and captured the true ancestral phenotype even when the true ancestral genotype was not accurately reconstructed. They showed also that probabilistic approaches outperform maximum parsimony-based approaches. In the case of Methanococcales, we used two different probabilistic methods (including the best method identified by Randall and colleagues) to reconstruct ancestral sequences corresponding to 538 single copy core proteins at each node of the Methanococcales phylogeny. These sequences represented approximatively 25–40% of the proteomes of the strains and were used to estimate proteome ancestral amino acid frequencies. Both methods provided very similar results. This strongly suggests that the choice of the method is unlikely to have strong impact on our analysis, which we confirmed when inferring ancestral OGTs from reconstructed ancestral amino acid frequencies. To avoid methodological biases, we used two in silico methods relying on very different approaches to infer ancestral OGT. One relies on existing correlations between amino acid frequencies in present-day methanococcales proteomes and OGT, whereas the second uses a Kalman filtering algorithm to infer quantitative traits along the phylogeny using ancestral information. Both methods provided consistent estimations of ancestral OGT. In particular, they predicted the OGT of the ancestor of Methanococcales to be close to 80 °C, and provided similar OGT variation patterns along the phylogeny. Of course, this does not fully guarantee that these ancestral OGTs were estimated with complete accuracy. Addressing this issue is challenging as it would require to resurrect the ancestral organisms. An alternative approach would consist in resurrecting ancestral proteins and to experimentally determine their properties, such as thermostability. We would also need to account for the heterogeneous thermostability among individual proteins in a given organism, some proteins being poor predictors of the OGT of the organism (see, for instance, Dehouck et al. 2008; Romero-Romero et al. 2016; and references therein). As a consequence, evaluating the accuracy of methods used to reconstruct ancestral OGT would require large-scale in vitro investigations that are beyond the scope of our study. To circumvent this issue, we used an empirical approach to test for the accuracy of OGT reconstruction methods. Using a leave-one-out approach, we predicted the OGT of each individual present-day methanococcales using the association between amino acid frequencies and OGT found with the rest of the data (“training” data) and compared these estimations with known OGTs. This cross-validation approach showed that both OGT reconstruction methods have high accuracy. It further suggests that the 538 single copy core proteins contained sufficient information to provide a good estimate of OGT.
By comparing sequence evolution along the phylogeny of Methanococcales, we disclosed a substitutional scheme in which lysine occupies a key position, acting as a hub contributing to fine tune the pool of arginine and the pool of serine, threonine, asparagine, and glutamine during OGT shifts. It is noteworthy that, despite its key position in the network, the frequency of lysine does not appear correlated with OGT because of opposite substitution patterns. The central position of lysine in the substitutional network is puzzling, because using lysine as an intermediate is costlier from an evolutionary point of view. In fact, although a single mutation at the DNA level is required to directly substitute arginine to serine or threonine, at least three mutations are needed when using lysine as an intermediate (supplementary fig. S13, Supplementary Material online). Similarly, one substitution is required to move directly from arginine to glutamine, while two are required when lysine is used as intermediate. This strongly suggests that site-specific antagonist selective pressures against direct substitutions from arginine to serine, threonine, asparagine, and glutamine might exist and remain to be discovered. As a consequence, parallel substitution patterns are observed in sequences, with sites carrying arginine shifting to lysine, whereas those carrying lysine shift to serine, threonine, glutamine, or asparagine leading to a global relaxation of structural and packing constrains of proteins in mesophiles. Accordingly, viewing thermoadaptation as variations in amino acid frequency is an oversimplification of the underlying process.
In conclusion, our study reveals Methanococcales as an interesting biological model to investigate the molecular mechanisms associated with thermoadaptation. Next steps will require additional investigations and data. For instance, increasing the taxonomic sampling in key regions of the Methanococcales phylogeny could provide a more precise picture of OGT variations that occurred during the diversification of this important archaeal lineage. Priority targets would be the region encompassing Methanocaldococcus infernus and Methanocaldococcus villosus, two hyperthermophilic sister-strains with abnormal high evolutionary rates, as well as branches associated with major OGT shifts (e.g., the Methanotorris genus, the Methanococcus aeolicus and the Methanococcus voltae lineages). Increasing the genomic coverage within Methanococcales could also reveal additional major shifts in OGT and provide a finer description of the amino acid substitutional patterns associated with OGT variation. For instance, as a consequence of the currently available taxonomic sampling of Methanococcales, most of the identified OGT shifts occurred from hyperthermophilic toward thermophilic or mesophilic lifestyles. Accordingly, the substitutional scheme proposed is possibly incomplete. A better knowledge of the biology and physiology of Methanococcales is also essential. In particular transcriptomic and proteomic experiments could provide data to investigate the function of the genes acquired via horizontal gene transfer by mesophilic and thermophilic strains and determine if they have played a role in thermoadaptation. Finally, identifying additional clades in which OGT dominates over other confounding factors with respect to variations in amino acid frequencies in proteomes is essential to determine whether the substitutional scheme disclosed in this study is specific of Methanococcales or common to Prokaryotes.
Materials and Methods
Data Retrieval and Protein Family Assembly
We retrieved and assembled in a local database 27 methanomada proteomes deduced from complete or nearly complete genomes available at the National Center for Biotechnology Information (ftp://ftp.ncbi.nlm.nih.gov/genomes/Bacteria/) (supplementary table S1, Supplementary Material online): 18 corresponded to Methanococcales, eight to Methanobacteriales, and one to Methanopyrales strains. OGTs were recovered from literature and from the DSMZ cultivation database (https://www.dsmz.de/, last accessed 2020/12/12) (supplementary table S1, Supplementary Material online).
Homologous protein families were assembled using the SILIX (v1.2.9) program (Miele et al. 2011). More precisely, pairs of proteins providing High-scoring Segment Pair (HSP) with at least 35% of amino acid identity and 80% of sequence coverage were gathered in the same family. Assembled protein families were refined using the HIFIX software (v1.0.5) (Miele et al. 2012) with default parameters. This led to the assembly of 9,540 protein families, among which 3,435 are specific to Methanococcales, 4,981 do not contain methanococcales sequences, and 1,124 are shared between methanococcales and other methanomada. Among the 9,540 protein families, 538 were largely distributed in Methanomada (i.e., present in a single copy in at least 80% of the 27 methanomada proteomes). These protein families represent the core proteome of Methanomada. In contrast, the core and the accessory proteomes of Methanococcales encompass 1,026 and 3,533 protein families, respectively. Functions associated with protein families were retrieved from the archaeal clusters of orthologous genes (arCOG) database (Makarova et al. 2015).
Statistical Analyses and Correction for Phylogenetic Inertia
All statistical analyses were performed using R (R Core Team 2014). Correspondence analyses were performed using the ADE4 package (Dray and Dufour 2007). Interpreting correlations among quantitative traits such as amino acid composition, OGT, and genomic G + C content as the result of an adaptive process, could be misleading as these could be the consequence of the phylogenetic inertia (Felsenstein 1985). Thus, observed correlations could reflect inherited traits rather than a genuine effect of environmental constraints on genomic sequences. Accordingly, the correlations observed in our data were tested using the phylogenetic independent contrast (PIC) method introduced by Felsenstein (1985) and implemented in APE (Paradis et al. 2004). Briefly, the PIC method assumes that traits evolve independently in each daughter branch after a speciation event and calculate contrasts at each node of a given phylogeny. These contrasts are statistically independent, and thus can be further used to test association between traits without the confounding effect of phylogenetic inertia (Blomberg and Garland 2002).
Inference of a Reference ML Phylogeny of Methanomada
For each of the 538 protein families defining the core proteome of methanomada, a multiple alignment was built with the PRANK algorithm (Loytynoja and Goldman 2008) implemented in GUIDANCE (Penn et al. 2010) and trimmed using BMGE version 1.12 (Criscuolo and Gribaldo 2010), with default parameters. The 538 trimmed multiple alignments were combined to build a large supermatrix (127,077 amino acid positions, 27 methanomada strains).
A maximum likelihood phylogenetic analysis of this supermatrix has been performed with the PHYML software (v 3.1) (.
Detection of HGT Events
The quantification of the number of HGT that occurred in each branch of the Methanomada phylogeny was performed with ALE (Patterson et al. 2013). As ALE needs an ultrametric species tree for reconciliation analyses, we have reconstructed an ultrametric reference phylogeny of Methanomada with PhyloBayes version 4.1 (Blanquart and Lartillot 2006) using the supermatrix gathering the 538 methanomada core protein families, with the autocorrelated relaxed clock model (Thorne et al. 1998), a gamma prior (mean = 2,000 and standard deviation = 2,000) on the age of the root, 10,000 points sampling, and a burn-in of 1,000. The multiple alignments of the 2,116 protein families containing more than two sequences and at least one methanococcales sequence were built with PRANK and trimmed using BMGE as described above. For each protein family a maximum likelihood phylogeny has been inferred with PHYML as described above. The 100 maximum likelihood trees resulting from bootstrap replicates were compared with the ultrametric reference phylogeny of Methanomada.
Gene gains and losses were also analyzed using COUNT version 10.04 (Csuros 2010) and GLOOME (Cohen et al. 2010). Contrary to ALE, COUNT and GLOOME evolutionary scenarios are based on gene presence/absence phylogenetic profiles and do not consider gene phylogenies. COUNT was run using the following optimized parameters: uniform duplication and gain rates, three gamma discrete categories for family loss, gain, and duplication factor. Parameters of the phylogenetic birth-and-death model were computed to maximize likelihood. GLOOME was run on a dedicated server (http://gloome.tau.ac.il/, last accessed 2020/12/12) using the following parameters: rate inference with empirical Bayesian estimate using a gamma prior distribution with three discrete categories.
Methanococcales Ancestral Sequences Reconstruction
Ancestral sequence reconstructions of the 538 Methanomada core protein families were performed at each node of the ML reference phylogeny of Methanococcales using two methods: BPPANCESTOR (Dutheil and Boussau 2008) and FASTML (Randall et al. 2016). In the case of BPPANCESTOR, evolutionary parameters for the ancestral sequence reconstruction were estimated with BPPML (Dutheil and Boussau 2008) using the branch heterogeneous model COALA (Groussin et al. 2013). At each node of the Methanococcales phylogeny, 100 ancestral sequences were reconstructed using BPPANCESTOR (Dutheil and Boussau 2008). In the case of FASTML, the reference phylogeny of Methanococcales was inferred using the NJ algorithm in order not to induce biases in the ancestral sequence reconstruction process. However, the resulting NJ tree was identical to the phylogeny inferred with PHYML. FASTML ancestral sequence inference was performed using default parameters (i.e., a WAG substitution matrix and rate variation modeled by a discrete gamma distribution with four rate categories).
Ancestral amino acid frequencies were then computed by averaging the amino acid frequencies of the 100 ancestral sequences and used to estimate ancestral OGT with two independent methods: the approach implemented in the ANCOV software (Lartillot 2014) and the linear regression approach described elsewhere (Boussau et al. 2008; Groussin and Gouy 2011). Briefly, estimation of ancestral OGT by ANCOV uses amino acid frequencies in present-day and ancestral sequences together with OGT of extant species to estimate ancestral OGT within the species phylogeny, whereas the linear regression approach requires calculating CA scores for ancestral sequences. Ancestral OGT are then deduced from the linear regression between scores on the first axis of the CA and present-day OGT.
Supplementary Material
Supplementary data are available at Molecular Biology and Evolution online.
Supplementary Material
Acknowledgments
We would like to thank Bastien Bousseau, Nicolas Lartillot, Gergely Szöllősi, and Dominique Madern for their precious advices, and Jean-Pierre Flandrois for stimulating discussion and support. We acknowledge Marc Bailly Bechet, Jean Lobry, Jean Thioulouse, Vincent Daubin, Eric Tannier, and Adrian Arellano Davin for fruitful discussions. This work was performed using the computing facilities of the CC LBBE/PRABI. This work was supported by the Investissement d'Avenir grant (ANR-10-BINF-01-01 and ANR-16-CE02-0005-01). M.L. held a doctoral fellowship from the French Ministère de l'Enseignement Supérieur et de la Recherche.
References
- Albers SV, Driessen AJ.. 2007. Membrane adaptations of (hyper)thermophiles to high temperatures. In: Gerday C, Glansdorff N, editors. Physiology and biochemistry of extremophiles Washington, D.C.: ASM press. p. 104–116. [Google Scholar]
- Albers S-V, Vossenberg JL, Driessen AJ, Konings WN.. 2001. Bioenergetics and solute uptake under extreme conditions. Extremophiles 5(5):285–294. [DOI] [PubMed] [Google Scholar]
- Ashkenazy H, Penn O, Doron-Faigenboim A, Cohen O, Cannarozzi G, Zomer O, Pupko T.. 2012. FastML: a web server for probabilistic reconstruction of ancestral sequences. Nucleic Acids Res. 40(W1):W580–W584. [DOI] [PMC free article] [PubMed] [Google Scholar]
- Berezovsky IN, Shakhnovich EI.. 2005. Physics and evolution of thermophilic adaptation. Proc Natl Acad Sci U S A. 102(36):12742–12747. [DOI] [PMC free article] [PubMed] [Google Scholar]
- Blaby IK, Lyons BJ, Wroclawska-Hughes E, Phillips GCF, Pyle TP, Chamberlin SG, Benner SA, Lyons TJ, de Crécy-Lagard V, de Crécy E.. 2012. Experimental evolution of a facultative thermophile from a mesophilic ancestor. Appl Environ Microbiol. 78(1):144–155. [DOI] [PMC free article] [PubMed] [Google Scholar]
- Blanquart S, Lartillot N.. 2006. A Bayesian compound stochastic process for modeling nonstationary and nonhomogeneous sequence evolution. Mol Biol Evol. 23(11):2058–2071. [DOI] [PubMed] [Google Scholar]
- Blomberg SP, Garland T.. 2002. Tempo and mode in evolution: phylogenetic inertia, adaptation and comparative methods. J Evol Biol. 15(6):899–910. [Google Scholar]
- Boussau B, Blanquart S, Necsulea A, Lartillot N, Gouy M.. 2008. Parallel adaptations to high temperatures in the Archaean eon. Nature 456(7224):942–945. [DOI] [PubMed] [Google Scholar]
- Brochier-Armanet C, Deschamps P, Lopez-Garcia P, Zivanovic Y, Rodriguez-Valera F, Moreira D.. 2011. Complete-fosmid and fosmid-end sequences reveal frequent horizontal gene transfers in marine uncultured planktonic archaea. ISME J. 5(8):1291–1302. [DOI] [PMC free article] [PubMed] [Google Scholar]
- Brochier-Armanet C, Forterre P.. 2006. Widespread distribution of archaeal reverse gyrase in thermophilic bacteria suggests a complex history of vertical inheritance and lateral gene transfers. Archaea 2(2):83–93. [DOI] [PMC free article] [PubMed] [Google Scholar]
- Burgess EA, Wagner ID, Wiegel J.. 2007. Thermal environments and biodiversity. In: Gerday C, Glansdorff N, editors. Physiology and biochemistry of extremophiles Washington, D.C.: ASM press. p. 12–29. [Google Scholar]
- Canganella F, Wiegel J.. 2011. Extremophiles: from abyssal to terrestrial ecosystems and possibly beyond. Naturwissenschaften 98(4):253–279. [DOI] [PubMed] [Google Scholar]
- Chakraborty D, Taly A, Sterpone F.. 2015. Stay wet, stay stable? How internal water helps the stability of thermophilic proteins. J Phys Chem B. 119(40):12760–12770. [DOI] [PMC free article] [PubMed] [Google Scholar]
- Chakravarty S, Varadarajan R.. 2000. Elucidation of determinants of protein stability through genome sequence analysis. FEBS Lett. 470(1):65–69. [DOI] [PubMed] [Google Scholar]
- Chintalapati S, Kiran MD, Shivaji S.. 2004. Role of membrane lipid fatty acids in cold adaptation. Cell Mol Biol (Noisy-le-grand). 50:631–642. [PubMed] [Google Scholar]
- Cohen O, Ashkenazy H, Belinky F, Huchon D, Pupko T.. 2010. GLOOME: gain loss mapping engine. Bioinformatics 26(22):2914–2915. [DOI] [PubMed] [Google Scholar]
- Coker JA. 2019. Recent advances in understanding extremophiles. F1000Res. 8:1917. [DOI] [PMC free article] [PubMed] [Google Scholar]
- Collins T, Margesin R.. 2019. Psychrophilic lifestyles: mechanisms of adaptation and biotechnological tools. Appl Microbiol Biotechnol. 103(7):2857–2871. [DOI] [PubMed] [Google Scholar]
- Coquelle N, Fioravanti E, Weik M, Vellieux F, Madern D.. 2007. Activity, stability and structural studies of lactate dehydrogenases adapted to extreme thermal environments. J Mol Biol. 374(2):547–562. [DOI] [PubMed] [Google Scholar]
- Criscuolo A, Gribaldo S.. 2010. BMGE (Block Mapping and Gathering with Entropy): a new software for selection of phylogenetic informative regions from multiple sequence alignments. BMC Evol Biol. 10(1):210. [DOI] [PMC free article] [PubMed] [Google Scholar]
- Csuros M. 2010. Count: evolutionary analysis of phylogenetic profiles with parsimony and likelihood. Bioinformatics 26:1910–1912. [DOI] [PubMed] [Google Scholar]
- D’Amico S, Collins T, Marx J‐C, Feller G, Gerday C, Gerday C.. 2006. Psychrophilic microorganisms: challenges for life. EMBO Rep. 7(4):385–389. [DOI] [PMC free article] [PubMed] [Google Scholar]
- De Maayer P, Anderson D, Cary C, Cowan DA.. 2014. Some like it cold: understanding the survival strategies of psychrophiles. EMBO Rep. 15(5):508–517. [DOI] [PMC free article] [PubMed] [Google Scholar]
- Dehouck Y, Folch B, Rooman M.. 2008. Revisiting the correlation between proteins’ thermoresistance and organisms’ thermophilicity. Protein Eng Des Sel. 21(4):275–278. [DOI] [PubMed] [Google Scholar]
- Drake JW. 2009. Avoiding dangerous missense: thermophiles display especially low mutation rates. PLoS Genet. 5(6):e1000520. [DOI] [PMC free article] [PubMed] [Google Scholar]
- Dray S, Dufour AB.. 2007. The ade4 package: implementing the duality diagram for ecologists. J Stat Soft. 22:1–20. [Google Scholar]
- Dumorne K, Cordova DC, Astorga-Elo M, Renganathan P.. 2017. Extremozymes: a potential source for industrial applications. J Microbiol Biotechnol. 27(4):649–659. [DOI] [PubMed] [Google Scholar]
- Dutheil J, Boussau B.. 2008. Non-homogeneous models of sequence evolution in the Bio++ suite of libraries and programs. BMC Evol Biol. 8(1):255. [DOI] [PMC free article] [PubMed] [Google Scholar]
- Éva C, Zelenyánszki H, Tömösközi-Farkas R, Tamás L.. 2014. Transgenic barley expressing the Arabidopsis AKR4C9 aldo-keto reductase enzyme exhibits enhanced freezing tolerance and regenerative capacity. S Afr J Bot. 93:179–184. [Google Scholar]
- Farias ST, Bonato MC.. 2003. Preferred amino acids and thermostability. Genet Mol Res. 2:383–393. [PubMed] [Google Scholar]
- Feller G. 2018. Protein folding at extreme temperatures: current issues. Semin Cell Dev Biol. 84:129–137. [DOI] [PubMed] [Google Scholar]
- Feller G, Gerday C.. 2003. Psychrophilic enzymes: hot topics in cold adaptation. Nat Rev Microbiol. 1(3):200–208. [DOI] [PubMed] [Google Scholar]
- Felsenstein J. 1985. Phylogenies and the comparative method. Am Nat. 125(1):1–15. [Google Scholar]
- Feng S, Powell SM, Wilson R, Bowman JP.. 2014. Extensive gene acquisition in the extremely psychrophilic bacterial species Psychroflexus torquis and the link to sea-ice ecosystem specialism. Genome Biol Evol. 6(1):133–148. [DOI] [PMC free article] [PubMed] [Google Scholar]
- Finnigan GC, Hanson-Smith V, Houser BD, Park HJ, Stevens TH.. 2011. The reconstructed ancestral subunit a functions as both V-ATPase isoforms Vph1p and Stv1p in Saccharomyces cerevisiae. Mol Biol Cell. 22(17):3176–3191. [DOI] [PMC free article] [PubMed] [Google Scholar]
- Friedman R, Drake JW, Hughes AL.. 2004. Genome-wide patterns of nucleotide substitution reveal stringent functional constraints on the protein sequences of thermophiles. Genetics 167(3):1507–1512. [DOI] [PMC free article] [PubMed] [Google Scholar]
- Galtier N, Lobry JR.. 1997. Relationships between genomic G+C content, RNA secondary structures, and optimal growth temperature in prokaryotes. J Mol Evol. 44(6):632–636. [DOI] [PubMed] [Google Scholar]
- Gaucher EA, Govindarajan S, Ganesh OK.. 2008. Palaeotemperature trend for Precambrian life inferred from resurrected proteins. Nature 451(7179):704–707. [DOI] [PubMed] [Google Scholar]
- Godin-Roulling A, Schmidpeter PA, Schmid FX, Feller G.. 2015. Functional adaptations of the bacterial chaperone trigger factor to extreme environmental temperatures. Environ Microbiol. 17(7):2407–2420. [DOI] [PubMed] [Google Scholar]
- Goodchild A, Saunders NF, Ertan H, Raftery M, Guilhaus M, Curmi PM, Cavicchioli R.. 2004. A proteomic determination of cold adaptation in the Antarctic archaeon, Methanococcoides burtonii. Mol Microbiol. 53(1):309–321. [DOI] [PubMed] [Google Scholar]
- Graumann P, Schroder K, Schmid R, Marahiel MA.. 1996. Cold shock stress-induced proteins in Bacillus subtilis. J Bacteriol. 178(15):4611–4619. [DOI] [PMC free article] [PubMed] [Google Scholar]
- Greaves RB, Warwicker J.. 2007. Mechanisms for stabilisation and the maintenance of solubility in proteins from thermophiles. BMC Struct Biol. 7(1):18. [DOI] [PMC free article] [PubMed] [Google Scholar]
- Groussin M, Boussau B, Gouy M.. 2013. A branch-heterogeneous model of protein evolution for efficient inference of ancestral sequences. Syst Biol. 62(4):523–538. [DOI] [PMC free article] [PubMed] [Google Scholar]
- Groussin M, Gouy M.. 2011. Adaptation to environmental temperature is a major determinant of molecular evolutionary rates in archaea. Mol Biol Evol. 28(9):2661–2674. [DOI] [PubMed] [Google Scholar]
- Guindon S, Dufayard JF, Lefort V, Anisimova M, Hordijk W, Gascuel O.. 2010. New algorithms and methods to estimate maximum-likelihood phylogenies: assessing the performance of PhyML 3.0. Syst Biol. 59(3):307–321. [DOI] [PubMed] [Google Scholar]
- Haney PJ, Badger JH, Buldak GL, Reich CI, Woese CR, Olsen GJ.. 1999. Thermal adaptation analyzed by comparison of protein sequences from mesophilic and extremely thermophilic Methanococcus species. Proc Natl Acad Sci U S A. 96(7):3578–3583. [DOI] [PMC free article] [PubMed] [Google Scholar]
- Ideno A, Yoshida T, Iida T, Furutani M, Maruyama T.. 2001. FK506-binding protein of the hyperthermophilic archaeum, Thermococcus sp. KS-1, a cold-shock-inducible peptidyl-prolyl cis-trans isomerase with activities to trap and refold denatured proteins. Biochem J. 357(Pt 2):465–471. [DOI] [PMC free article] [PubMed] [Google Scholar]
- Koga Y. 2012. Thermal adaptation of the archaeal and bacterial lipid membranes. Archaea 2012:1–6. [DOI] [PMC free article] [PubMed] [Google Scholar]
- Konings WN. 2006. Microbial transport: adaptations to natural environments. Antonie Van Leeuwenhoek 90(4):325–342. [DOI] [PubMed] [Google Scholar]
- Kreil DP, Ouzounis CA.. 2001. Identification of thermophilic species by the amino acid compositions deduced from their genomes. Nucleic Acids Res. 29(7):1608–1615. [DOI] [PMC free article] [PubMed] [Google Scholar]
- Lartillot N. 2014. A phylogenetic Kalman filter for ancestral trait reconstruction using molecular data. Bioinformatics 30(4):488–496. [DOI] [PubMed] [Google Scholar]
- Le SQ, Gascuel O.. 2008. An improved general amino acid replacement matrix. Mol Biol Evol. 25(7):1307–1320. [DOI] [PubMed] [Google Scholar]
- Lee SH, Kim YH, Lee K, Im H.. 2018. Peptidyl-prolyl isomerase Cpr7p of yeast prevents protein aggregation upon freezing. Bull Korean Chem Soc. 39(11):1248–1253. [Google Scholar]
- Lipscomb GL, Hahn EM, Crowley AT, Adams MWW.. 2017. Reverse gyrase is essential for microbial growth at 95 degrees C. Extremophiles 21(3):603–608. [DOI] [PubMed] [Google Scholar]
- Lopez-Garcia P, Zivanovic Y, Deschamps P, Moreira D.. 2015. Bacterial gene import and mesophilic adaptation in archaea. Nat Rev Microbiol. 13(7):447–456. [DOI] [PMC free article] [PubMed] [Google Scholar]
- Lorenz C, Lunse CE, Morl M.. 2017. tRNA modifications: impact on structure and thermal adaptation. Biomolecules 7(4):35. [DOI] [PMC free article] [PubMed] [Google Scholar]
- Loytynoja A, Goldman N.. 2008. Phylogeny-aware gap placement prevents errors in sequence alignment and evolutionary analysis. Science 320(5883):1632–1635. [DOI] [PubMed] [Google Scholar]
- Luke KA, Higgins CL, Wittung-Stafshede P.. 2007. Thermodynamic stability and folding of proteins from hyperthermophilic organisms. FEBS J. 274(16):4023–4033. [DOI] [PubMed] [Google Scholar]
- Makarova KS, Wolf YI, Koonin EV.. 2015. Archaeal clusters of orthologous genes (arCOGs): an update and application for analysis of shared features between Thermococcales, Methanococcales, and Methanobacteriales. Life (Basel). 5(1):818–840. [DOI] [PMC free article] [PubMed] [Google Scholar]
- Manteca A, Pelaez AI, Zardoya R, Sanchez J.. 2006. Actinobacteria cyclophilins: phylogenetic relationships and description of new class- and order-specific paralogues. J Mol Evol. 63(6):719–732. [DOI] [PubMed] [Google Scholar]
- Maruyama T, Suzuki R, Furutani M.. 2004. Archaeal peptidyl prolyl cis-trans isomerases (PPIases) update 2004. Front Biosci. 9(1–3):1680–1720. [DOI] [PubMed] [Google Scholar]
- McDonald JH. 2010. Temperature adaptation at homologous sites in proteins from nine thermophile-mesophile species pairs. Genome Biol Evol. 2:267–276. [DOI] [PMC free article] [PubMed] [Google Scholar]
- McDonald JH, Grasso AM, Rejto LK.. 1999. Patterns of temperature adaptation in proteins from Methanococcus and Bacillus. Mol Biol Evol. 16(12):1785–1790. [DOI] [PubMed] [Google Scholar]
- Merino N, Aronson HS, Bojanova DP, Feyhl-Buska J, Wong ML, Zhang S, Giovannelli D.. 2019. Living at the extremes: extremophiles and the limits of life in a planetary context. Front Microbiol. 10:780. [DOI] [PMC free article] [PubMed] [Google Scholar]
- Miele V, Penel S, Daubin V, Picard F, Kahn D, Duret L.. 2012. High-quality sequence clustering guided by network topology and multiple alignment likelihood. Bioinformatics 28(8):1078–1085. [DOI] [PubMed] [Google Scholar]
- Miele V, Penel S, Duret L.. 2011. Ultra-fast sequence clustering from similarity networks with SiLiX. BMC Bioinformatics 12(1):116. [DOI] [PMC free article] [PubMed] [Google Scholar]
- Narasingarao P, Podell S, Ugalde JA, Brochier-Armanet C, Emerson JB, Brocks JJ, Heidelberg KB, Banfield JF, Allen EE.. 2012. De novo metagenomic assembly reveals abundant novel major lineage of Archaea in hypersaline microbial communities. ISME J. 6(1):81–93. [DOI] [PMC free article] [PubMed] [Google Scholar]
- Paradis E, Claude J, Strimmer K.. 2004. APE: analyses of phylogenetics and evolution in R language. Bioinformatics 20(2):289–290. [DOI] [PubMed] [Google Scholar]
- Patterson M, Szollosi G, Daubin V, Tannier E.. 2013. Lateral gene transfer, rearrangement, reconciliation. BMC Bioinformatics 14(Suppl 15):S4. [DOI] [PMC free article] [PubMed] [Google Scholar]
- Paul S, Bag SK, Das S, Harvill ET, Dutta C.. 2008. Molecular signature of hypersaline adaptation: insights from genome and proteome composition of halophilic prokaryotes. Genome Biol. 9(4):R70. [DOI] [PMC free article] [PubMed] [Google Scholar]
- Penn O, Privman E, Landan G, Graur D, Pupko T.. 2010. An alignment confidence score capturing robustness to guide tree uncertainty. Mol Biol Evol. 27(8):1759–1767. [DOI] [PMC free article] [PubMed] [Google Scholar]
- Petitjean C, Deschamps P, Lopez-Garcia P, Moreira D, Brochier-Armanet C.. 2015. Extending the conserved phylogenetic core of archaea disentangles the evolution of the third domain of life. Mol Biol Evol. 32(5):1242–1254. [DOI] [PubMed] [Google Scholar]
- Petitjean C, Moreira D, Lopez-Garcia P, Brochier-Armanet C.. 2012. Horizontal gene transfer of a chloroplast DnaJ-Fer protein to Thaumarchaeota and the evolutionary history of the DnaK chaperone system in Archaea. BMC Evol Biol. 12(1):226. [DOI] [PMC free article] [PubMed] [Google Scholar]
- Pikuta EV, Hoover RB, Tang J.. 2007. Microbial extremophiles at the limits of life. Crit Rev Microbiol. 33(3):183–209. [DOI] [PubMed] [Google Scholar]
- Privalov PL. 1990. Cold denaturation of proteins. Crit Rev Biochem Mol Biol. 25(4):281–305. [DOI] [PubMed] [Google Scholar]
- Puigbo P, Pasamontes A, Garcia-Vallve S.. 2008. Gaining and losing the thermophilic adaptation in prokaryotes. Trends Genet. 24(1):10–14. [DOI] [PubMed] [Google Scholar]
- Randall RN, Radford CE, Roof KA, Natarajan DK, Gaucher EA.. 2016. An experimental phylogeny to benchmark ancestral sequence reconstruction. Nat Commun. 7(1):12847. [DOI] [PMC free article] [PubMed] [Google Scholar]
- Rasch J, Unal CM, Klages A, Karsli U, Heinsohn N, Brouwer R, Richter M, Dellmann A, Steinert M.. 2019. Peptidyl-prolyl-cis/trans-isomerases Mip and PpiB of Legionella pneumophila contribute to surface translocation, growth at suboptimal temperature, and infection. Infect Immun. 87(1)e00939-17. [DOI] [PMC free article] [PubMed] [Google Scholar]
- R Core Team. 2014. R: a language and environment for statistical computing. Vienna (Austria: ): R Foundation for Statistical Computing. [Google Scholar]
- Richey DP, Lin EC.. 1972. Importance of facilitated diffusion for effective utilization of glycerol by Escherichia coli. J Bacteriol. 112(2):784–790. [DOI] [PMC free article] [PubMed] [Google Scholar]
- Romero-Romero ML, Risso VA, Martinez-Rodriguez S, Gaucher EA, Ibarra-Molero B, Sanchez-Ruiz JM.. 2016. Selection for protein kinetic stability connects denaturation temperatures to organismal temperatures and provides clues to Archaean life. PLoS One 11(6):e0156657. [DOI] [PMC free article] [PubMed] [Google Scholar]
- Sayed AM, Hassan MHA, Alhadrami HA, Hassan HM, Goodfellow M, Rateb ME.. 2020. Extreme environments: microbiology leading to specialized metabolites. J Appl Microbiol. 128(3):630–657. [DOI] [PubMed] [Google Scholar]
- Siddiqui KS, Williams TJ, Wilkins D, Yau S, Allen MA, Brown MV, Lauro FM, Cavicchioli R.. 2013. Psychrophiles. Annu Rev Earth Planet Sci. 41(1):87–115. [Google Scholar]
- Siliakus MF, van der Oost J, Kengen SWM.. 2017. Adaptations of archaeal and bacterial membranes to variations in temperature, pH and pressure. Extremophiles 21(4):651–670. [DOI] [PMC free article] [PubMed] [Google Scholar]
- Singer GA, Hickey DA.. 2003. Thermophilic prokaryotes have characteristic patterns of codon usage, amino acid composition and nucleotide content. Gene 317:39–47. [DOI] [PubMed] [Google Scholar]
- Smole Z, Nikolic N, Supek F, Smuc T, Sbalzarini IF, Krisko A.. 2011. Proteome sequence features carry signatures of the environmental niche of prokaryotes. BMC Evol Biol. 11(1):26. [DOI] [PMC free article] [PubMed] [Google Scholar]
- Spaniol V, Wyder S, Aebi C.. 2013. RNA-Seq-based analysis of the physiologic cold shock-induced changes in Moraxella catarrhalis gene expression. PLoS One 8(7):e68298. [DOI] [PMC free article] [PubMed] [Google Scholar]
- Stetter KO. 2006. Hyperthermophiles in the history of life. Philos Trans R Soc B. 361(1474):1837–1842. Discussion 1842–1833. [DOI] [PMC free article] [PubMed] [Google Scholar]
- Szöllősi GJ, Rosikiewicz W, Boussau B, Tannier E, Daubin V.. 2013. Efficient exploration of the space of reconciled gene trees. Syst Biol. 62(6):901–912. [DOI] [PMC free article] [PubMed] [Google Scholar]
- Tekaia F, Yeramian E, Dujon B.. 2002. Amino acid composition of genomes, lifestyles of organisms, and evolutionary trends: a global picture with correspondence analysis. Gene 297(1–2):51–60. [DOI] [PubMed] [Google Scholar]
- Thomson JM, Gaucher EA, Burgan MF, De Kee DW, Li T, Aris JP, Benner SA.. 2005. Resurrecting ancestral alcohol dehydrogenases from yeast. Nat Genet. 37(6):630–635. [DOI] [PMC free article] [PubMed] [Google Scholar]
- Thorne JL, Kishino H, Painter IS.. 1998. Estimating the rate of evolution of the rate of molecular evolution. Mol Biol Evol. 15(12):1647–1657. [DOI] [PubMed] [Google Scholar]
- Tomazic SJ, Klibanov AM.. 1988. Mechanisms of irreversible thermal inactivation of Bacillus alpha-amylases. J Biol Chem. 263(7):3086–3091. [PubMed] [Google Scholar]
- Tribelli PM, Lopez NI.. 2018. Reporting key features in cold-adapted bacteria. Life (Basel). 8(1):8. [DOI] [PMC free article] [PubMed] [Google Scholar]
- van Wolferen M, Ajon M, Driessen AJ, Albers SV.. 2013. How hyperthermophiles adapt to change their lives: DNA exchange in extreme conditions. Extremophiles 17(4):545–563. [DOI] [PubMed] [Google Scholar]
- Vieille C, Zeikus GJ.. 2001. Hyperthermophilic enzymes: sources, uses, and molecular mechanisms for thermostability. Microbiol Mol Biol Rev. 65(1):1–43. [DOI] [PMC free article] [PubMed] [Google Scholar]
- Vieira-Silva S, Rocha EP.. 2008. An assessment of the impacts of molecular oxygen on the evolution of proteomes. Mol Biol Evol. 25(9):1931–1942. [DOI] [PMC free article] [PubMed] [Google Scholar]
- Whitman WB, Boone DR, Koga K.. 2015. Methanococcales. In: Bergey’s manual of systematics of archaea and bacteria. Chichester (United Kingdom: ): John Wiley & Sons. [Google Scholar]
- Woese CR. 1987. Bacterial evolution. Microbiol Rev. 51(2):221–271. [DOI] [PMC free article] [PubMed] [Google Scholar]
- Zeldovich KB, Berezovsky IN, Shakhnovich EI.. 2007. Protein and DNA sequence determinants of thermophilic adaptation. PLoS Comput Biol. 3(1):e5. [DOI] [PMC free article] [PubMed] [Google Scholar]
- Zhang X-S, García-Contreras R, Wood TK.. 2007. YcfR (BhsA) influences Escherichia coli biofilm formation through stress response and surface hydrophobicity. J Bacteriol. 189(8):3051–3062. [DOI] [PMC free article] [PubMed] [Google Scholar]
- Zhou XX, Wang YB, Pan YJ, Li WF.. 2008. Differences in amino acids composition and coupling patterns between mesophilic and thermophilic proteins. Amino Acids. 34(1):25–33. [DOI] [PubMed] [Google Scholar]
Associated Data
This section collects any data citations, data availability statements, or supplementary materials included in this article.