Abstract
Exosomes, important players in cell–cell communication, are small extracellular vesicles of endocytic origin. Although single cells are known to release various kinds of exosomes (referred to as exosomal heterogeneity), very little is known about the mechanisms by which they are produced and released. Here, we established methods of studying exosomal heterogeneity by using polarized epithelial cells and showed that distinct types of small extracellular vesicles (more specifically CD9‐ and CD63‐positive, Annexin I‐negative small extracellular vesicles, which we refer to as exosomes herein) are differentially secreted from the apical and basolateral sides of polarized epithelial cells. We also identify GPRC5C (G protein‐coupled receptor class C group 5 member C) as an apical exosome‐specific protein. We further demonstrate that basolateral exosome release depends on ceramide, whereas ALIX, an ESCRT (endosomal sorting complexes required for transport)‐related protein, not the ESCRT machinery itself, is required for apical exosome release. Thus, two independent machineries, the ALIX–Syntenin1–Syndecan1 machinery (apical side) and the sphingomyelinase‐dependent ceramide production machinery (basolateral side), are likely to be responsible for the polarized exosome release from epithelial cells.
Keywords: ceramide, ESCRT, exosome, multivesicular body, small extracellular vesicle
Subject Categories: Cell Adhesion, Polarity & Cytoskeleton; Membrane & Intracellular Transport
Polarized epithelial cells release two distinct types of small extracellular vesicles at the apical and basolateral side, dependent on ALIX‐Syntenin1‐Syndecan1 and ceramide, respectively.

Introduction
Cells release extracellular vesicles (EVs) of different sizes and intracellular origin. EVs can be largely divided into two categories, exosomes and microvesicles (also known as ectosomes) (Cocucci & Meldolesi, 2015). Microvesicles (~ 50 nm to 1 μm in diameter) are formed from the plasma membrane by budding and/or shedding mechanisms (Cocucci et al, 2009; Cocucci & Meldolesi, 2015), whereas exosomes are small EVs (sEVs; around 100 nm in diameter) that are derived from multivesicular bodies (MVBs) and released by well‐organized systems. Exosomal cargos, such as proteins, lipids, and nucleic acids, are selectively incorporated into intraluminal vesicles (ILVs), i.e., precursors of exosomes, in MVBs. The MVBs are then transported to the plasma membrane, and after fusing with it, the ILVs are released into the extracellular space as exosomes (Pegtel & Gould, 2019; Kalluri & LeBleu, 2020).
It has recently been reported that a single cell releases various types (e.g., sizes and contents) of EVs or exosomes (i.e., exosomal heterogeneity) (Colombo et al, 2013; Kowal et al, 2016; Zhang et al, 2018). Although several distinct mechanisms of exosome biogenesis have been reported (Mathieu et al, 2019; Kalluri & LeBleu, 2020), how these mechanisms are differently used or regulated within a single cell remains completely unknown. This is mainly because the results of the studies varied with the techniques and devices used to conduct them. Hence, the mechanisms by which heterogeneous exosomes are produced within cells are poorly understood.
The Madin–Darby canine kidney (MDCK) cell line is a well‐known epithelial cell line, which has clearly defined apical–basolateral asymmetry (i.e., apical and basolateral domains), and for that reason, MDCK cells are often used as an in vitro model for studying the mechanism of polarization (Simmons, 1982). Once non‐polarized cells release heterogeneous exosomes into the extracellular space, it is extremely difficult to distinguish and collect them separately. However, if heterogeneous exosomes are asymmetrically released from polarized MDCK cells, it would be possible to easily collect apical and basolateral exosomes separately. Thus, we assumed that MDCK cells would become a good model for studying exosomal heterogeneity without using special techniques and devices. Here, we established a method of purifying exosomes (sEVs that are positive for representative exosome markers but negative for the known microvesicle marker Annexin I) released from polarized MDCK cells and found that the polarized cells release distinct types of exosomes (apical and basolateral exosomes) having different protein compositions. Moreover, we showed that the endosomal sorting complexes required for transport (ESCRT) machinery is not unexpectedly required for exosome release from polarized MDCK cells, and instead, ALIX and ceramide independently regulate apical and basolateral exosome release, respectively.
Results and Discussion
Polarized MDCK cells release distinct types of exosomes from apical and basolateral side
To investigate differences between apical and basolateral exosomes, we first purified all sEVs (≤~ 200 nm in diameter) from apical and basolateral MDCK culture media by polyethylene glycol (PEG) precipitation (Rider et al, 2016; Cocozza et al, 2020) (Fig EV1A) and found that five well‐known EV marker proteins (exosome markers: Flotillin‐1, CD63, CD9, and CD81; and a microvesicle marker: Annexin I) (Jeppesen et al, 2019) were asymmetrically recovered in the apical and basolateral PEG pellets (Fig 1A), consistent with the previous reports (Chen et al, 2016; Banfer et al, 2018). Moreover, by using a density gradient floatation assay, each EV marker in the PEG pellets was floated into the same fraction (Fr. 5 in Fig 1B), suggesting that the PEG pellets contained membranous organelles having the same density. Furthermore, an immunofluorescence analysis showed that CD63 (enriched in apical sEVs) was distributed in MVB‐like intracellular punctate structures, whereas CD9 (enriched in basolateral sEVs) was mainly localized at the basolateral membrane and partially distributed in intracellular punctate structures, some of which overlapped CD63‐positive dots in polarized MDCK cells (Fig EV1B). The CD9 enrichment in basolateral sEVs may be related to its basolateral membrane localization; however, CD63, which is enriched in apical sEVs, did not show apical membrane localization. Taken together, these results allowed us to conclude that a single MDCK cell secretes at least two types of sEVs presumably from different origins that have different EV markers: Flotillin‐1‐, CD63‐, and Annexin I‐enriched vesicles from the apical side, and CD9‐ and CD81‐enriched vesicles from the basolateral side.
Figure EV1. Structure of MVBs and sEVs in polarized MDCK cells.
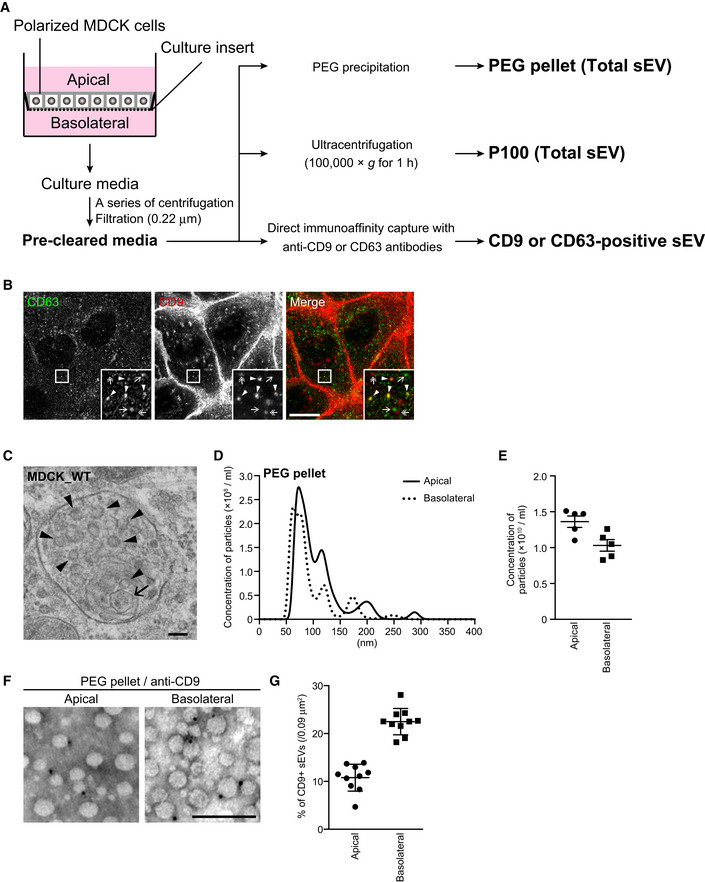
- Scheme of sEV and exosome isolation methods used in this study.
- Polarized MDCK cells were immunostained with anti‐CD63 and anti‐CD9 antibodies. Arrowheads, CD63‐ and CD9‐double‐positive dots; arrows, CD63‐positive dots; and double‐headed arrows, CD9‐positive dots. Scale bar, 20 μm.
- Polarized MDCK cells were analyzed by conventional electron microscopy. Small ILVs and a large ILV were indicated by arrowheads and an arrow, respectively. It is noteworthy that almost all of the ILVs measured < 100 nm in diameter. Scale bar, 100 nm.
- MDCK cells were cultured on cell culture inserts for 4 days. On the last day, the culture medium was replaced with EV‐depleted medium. sEVs released from the apical and basolateral side of the MDCK cells were purified by PEG precipitation and analyzed by NTA. Representative NTA traces were shown. Note that both PEG pellets showed a broad particle size distribution, suggesting that PEG pellets contain various types of sEVs.
- Quantification of the NTA data obtained in five independent experiments of (D). Mean ± s.e.m. was shown.
- PEG pellets prepared as in (D) were immunonegative stained with anti‐CD9 antibody and analyzed by electron microscopy. Scale bar, 100 nm.
- The percentages of CD9‐positive sEVs in 10 images were calculated. Mean ± s.e.m. was shown.
Figure 1. Heterogeneous exosome release from polarized MDCK cells.
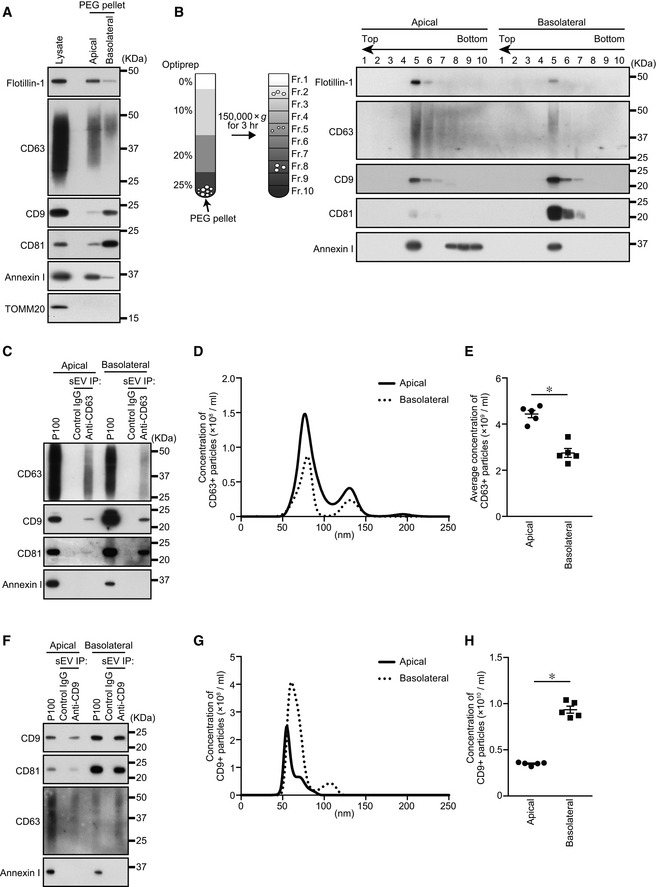
- MDCK cells were cultured on cell culture inserts for 4 days. On the last day, the culture medium was replaced with EV‐depleted medium. EVs released from the apical and basolateral sides of MDCK cells were purified by PEG precipitation. Cell lysates and EV proteins in PEG pellets were analyzed by immunoblotting with the antibodies indicated. Note that the PEG pellets did not contain mitochondrial protein TOMM20, suggesting that the PEG pellets were not contaminated by intracellular organelles.
- PEG pellets prepared as in (A) were subjected to OptiPrep flotation analysis.
- MDCK cells stably expressing human CD63 were cultured as in (A). sEVs were isolated from the pre‐cleared medium by direct immunoaffinity capture using anti‐CD63 antibody.
- sEVs prepared as in (C) were eluted from the beads with a glycine buffer and analyzed by nanoparticle tracking analysis (NTA). Representative NTA traces were shown.
- Quantification of the NTA data obtained in five independent experiments.
- MDCK cells were cultured as in (A). sEVs were isolated from the pre‐cleared medium by direct immunoaffinity capture using anti‐CD9 antibody.
- sEVs prepared as in (F) were eluted from the beads with a glycine buffer and analyzed by NTA. Representative NTA traces were shown.
- Quantification of the NTA data obtained in five independent experiments.
Data information: (A and B) Annexin I blots were separately obtained on different days using the same samples. (E and H) *P < 0.01 (two‐sided Student's unpaired t‐test). Mean ± s.e.m. was shown.
Next, we turned our attention to the size difference between apical and basolateral sEVs. An electron‐microscopic analysis of the MDCK cells revealed that most of the ILVs in their MVBs were less than 100 nm in diameter (Fig EV1C). A nanoparticle tracking assay (NTA) showed that both the apical and basolateral PEG pellets mainly contained 50–100 nm particles together with a smaller number of larger particles and that their size distributions and concentrations were similar (Fig EV1D and E). Moreover, immunonegative staining of the PEG pellets with anti‐CD9 antibody showed that CD9‐positive sEVs (approximately 10–20% of PEG pellets) were also less than 100 nm in diameter (Fig EV1F and G). These observations indicated that the size of apical and basolateral sEVs is not much different.
Because the PEG pellets contained Annexin I‐positive sEVs (Fig 1A) and/or CD9‐negative sEVs (Fig EV1D–G), we decided to use purified sEV samples (CD63‐ and CD9‐positive sEVs) rather than all sEV samples (PEG pellet and P100) to study the mechanisms of exosomal heterogeneity. To do so, we performed direct immunoaffinity capture of CD63‐ and CD9‐positive sEVs by using anti‐CD63‐ and anti‐CD9‐specific antibodies, respectively (see Jeppesen et al, 2019 for details) (Fig EV1A). As shown in Fig 1C, both apical and basolateral CD63‐positive sEVs contained CD9 and CD81 but not Annexin I, and CD63 was more abundant in the apical sample than in the basolateral sample, the same as in the PEG pellets (Fig 1A). Moreover, NTA showed that most of the apical and basolateral CD63‐positive sEVs were < 100 nm in diameter (Fig 1D), consistent with the results of the electron‐microscopic analyses (Fig EV1C), and the concentration of the apical CD63‐positive sEVs was higher than that of the basolateral sEVs (Fig 1E). Since CD63 was not localized at the plasma membrane (Fig EV1B) and the CD63‐positive sEVs were negative for Annexin I (Fig 1C), we concluded that CD63‐positive sEVs are most likely to mainly consist of exosomes. In contrast to the CD63‐positive EVs, the CD9‐positive sEVs were more abundant in the basolateral sample than in the apical sample (Fig 1F and H), but they were similar in size to the CD63‐positive sEVs (Fig 1G). Consistent with a previous report (Jeppesen et al, 2019), no Annexin I was detected in the CD9‐positive sEV samples, the same as in the CD63‐positive sEVs (Fig 1C and F), even though CD9 was predominantly localized at the plasma membrane (Fig EV1B). Since the CD9‐positive sEVs contained CD63 and CD81, the majority of CD9‐positive sEVs are likely to be exosomes, although we could not completely rule out the possibility that CD9‐positive, Annexin I‐negative microvesicles were included in the basolateral sEV sample. Taken together, these results suggested that polarized MDCK cells differentially release CD63‐ and CD9‐positive exosomes from their apical and basolateral sides, respectively.
GPRC5C is a novel apical exosome‐specific protein
To further clarify the difference between the apical and basolateral exosomes, we searched for apical exosome‐ or basolateral exosome‐specific proteins by liquid chromatography–tandem mass spectrometry (LC‐MS/MS; Tables [Link], [Link], [Link]). We used all sEVs collected by ultracentrifugation (Fig EV1A) to perform LC‐MS/MS, because there were too little CD63‐ or CD9‐positive sEVs to analyze. Silver staining of the proteins from apical and basolateral sEVs yielded similar band patterns (Fig 2A), and 84% of the proteins detected by LC‐MS/MS in the two types of sEVs were identical (Fig 2B). One of the proteins detected, GPRC5C (G protein‐coupled receptor class C group 5 member C), was detected only in the apical sample. GPRC5C is an orphan receptor that belongs to the GPRC5 family (Robbins et al, 2000) and is involved in renal acid–base homeostasis (Rajkumar et al, 2018), but it had never been reported as an exosome protein. GPRC5C was detected in the apical PEG pellet alone (Fig 2C) and floated into Fr. 5, the same as other EV marker proteins (Fig 2D). Moreover, GPRC5C was co‐immunopurified only with apical CD9‐ and CD63‐positive sEVs (Fig 2E and F), strongly suggesting that GPRC5C is a novel exosome protein, and that MDCK cells release at least two types of CD9‐ and CD63‐positive exosomes (a GPRC5C‐positive type from the apical side and a GPRC5C‐negative type from the basolateral side).
Figure 2. GPRC5C is an apical exosome‐specific protein.
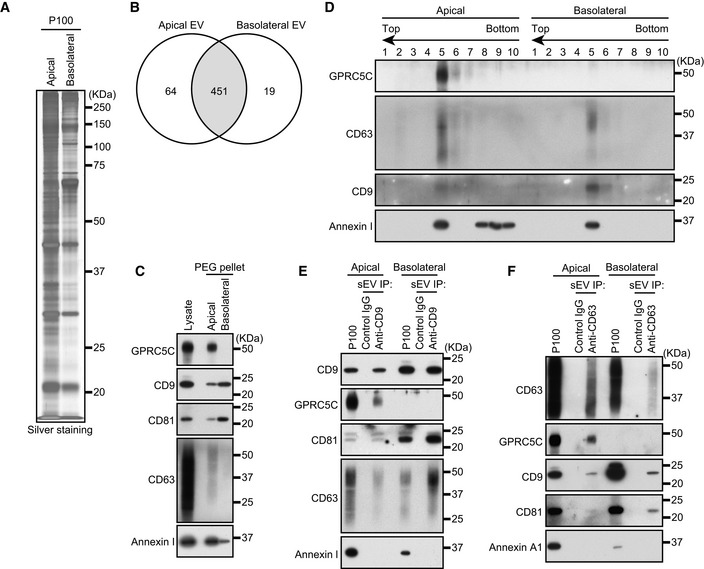
- MDCK cells were cultured on cell culture inserts for 4 days. On the last day, the culture medium was replaced with serum‐free medium. sEVs released from the apical and basolateral sides of MDCK cells were purified by ultracentrifugation. Apical and basolateral sEVs (P100) were analyzed by silver staining.
- MDCK cells were cultured on cell culture inserts for 4 days. On the last day, the culture medium was replaced with EV‐depleted medium. sEVs released from the apical and basolateral sides of MDCK cells were purified by PEG precipitation. Cell lysates and sEV proteins in PEG pellets were analyzed by immunoblotting with the antibodies indicated.
- PEG pellets were subjected to OptiPrep flotation analysis.
- MDCK cells were cultured as in (C). sEVs were isolated from the pre‐cleared medium by direct immunoaffinity capture using anti‐CD9 antibody.
- MDCK cells stably expressing human CD63 were cultured as in (C). sEVs were isolated from the pre‐cleared medium by direct immunoaffinity capture using anti‐CD63 antibody. Note that GPRC5C was detected only in the apical sEV samples in all experiments performed.
Data information: (C and D) Annexin I blots were separately obtained on different days using the same samples.
Inhibition of the ESCRT machinery promotes exosome release
The release of heterogeneous exosomes from a single cell requires the production of ILVs or MVBs having different properties. The ESCRT machinery is known to regulate EV formation from the plasma membrane and cargo sorting (Nabhan et al, 2012; Matusek et al, 2014; Hurley, 2015; Christ et al, 2017; Vietri et al, 2020). However, involvement of ESCRT in exosome biogenesis has been controversial, because some groups have reported that MVBs can be generated and exosomes are released in an ESCRT‐independent manner (Trajkovic et al, 2008; Colombo et al, 2013). We therefore attempted to determine whether the ESCRT machinery is involved in the polarized exosome release from MDCK cells. The ESCRT machinery and its associated proteins can be divided into six functionally distinct subcomplexes: ESCRT‐0/I/II/III, VPS4, and other ESCRT‐associated proteins. We first knocked down the component(s) (HRS [ESCRT‐0], TSG101 [ESCRT‐I], EAP20 and 30 [ESCRT‐II], CHMP6 [ESCRT‐III], VPS4A/B, and ALIX [other ESCRT‐associated proteins]) of each subcomplex and examined the amounts of exosome markers released (Fig 3A and B). Knockdown (KD) of most of the ESCRT proteins (HRS, TSG101, EAP20/30, CHMP6, and VPS4A/B) promoted CD9‐positive sEV secretion from both sides. Moreover, the numbers of sEVs released from these cells increased without any change in their size (Fig 3C and D). It is generally thought that MVBs fuse with lysosomes for their degradation rather than with the plasma membrane to release exosomes and that they are essential for the lysosomal function via the endocytic pathway (Raiborg & Stenmark, 2009; Henne et al, 2011; Huotari & Helenius, 2011). Since lysosomal dysfunction has been shown to result in larger MVBs and to promote exosome release from breast cancer cells (Latifkar et al, 2019), we hypothesized that exosome release is accelerated by the lysosomal dysfunction caused by ESCRT‐KD. To test this hypothesis, we exposed MDCK cells to the vacuolar ATPase inhibitor bafilomycin A1 to abolish the lysosomal function and confirmed that CD9‐positive sEV release from both sides was upregulated in an exposure‐time‐dependent manner (Fig EV2A–D). Moreover, enlarged MVBs were observed in the bafilomycin A1‐exposed cells, the same as in the HRS‐KD and VPS4‐KD cells (Fig EV2E and F) (Stuffers et al, 2009), indicating that most of the ESCRT‐KDs affect the lysosomal function, thereby promoting exosome release.
Figure 3. ALIX, but not the ESCRT machinery, is required for apical exosome release.
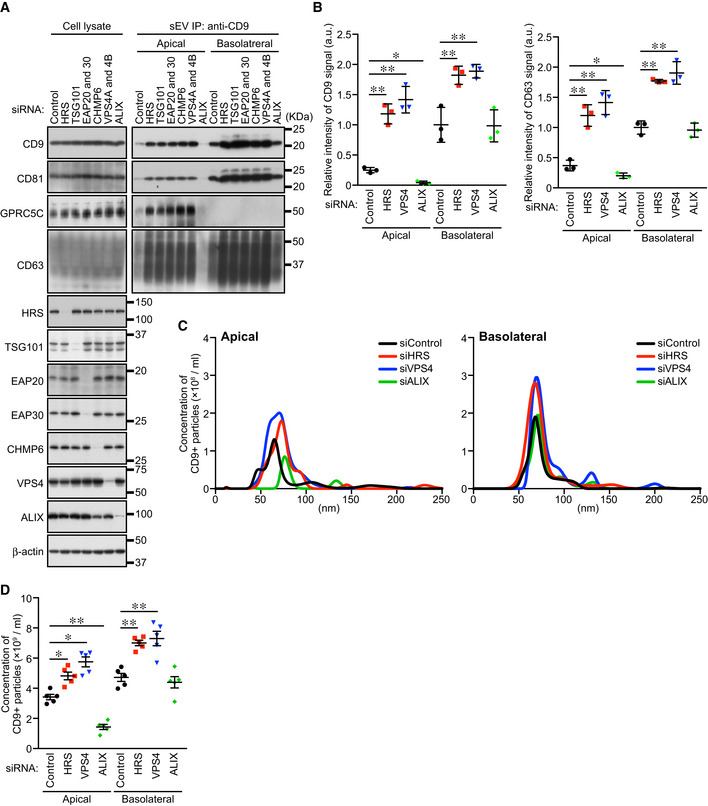
- MDCK cells were transfected with siControl or the siRNAs indicated, and the cells were transferred to cell culture inserts and cultured for 4 days. On the last day, the culture medium was replaced with EV‐depleted medium. sEVs were isolated from the pre‐cleared medium by direct immunoaffinity capture using anti‐CD9 antibody. Cell lysates and sEV samples were analyzed by immunoblotting with the antibodies indicated.
- The intensity of the bands shown in (A) was measured in three independent experiments.
- sEVs prepared as in (A) were eluted from the beads with a glycine buffer and analyzed by NTA. Representative NTA traces were shown.
- Quantification of the NTA data obtained in five independent experiments.
Data information: (A) CD63 blots were separately obtained on different days using the same samples. (B and D) *P < 0.05, **P < 0.01 (one‐way ANOVA and Tukey's test). Mean ± s.e.m. was shown.
Figure EV2. Exosome release is upregulated by inhibition of lysosomal function.
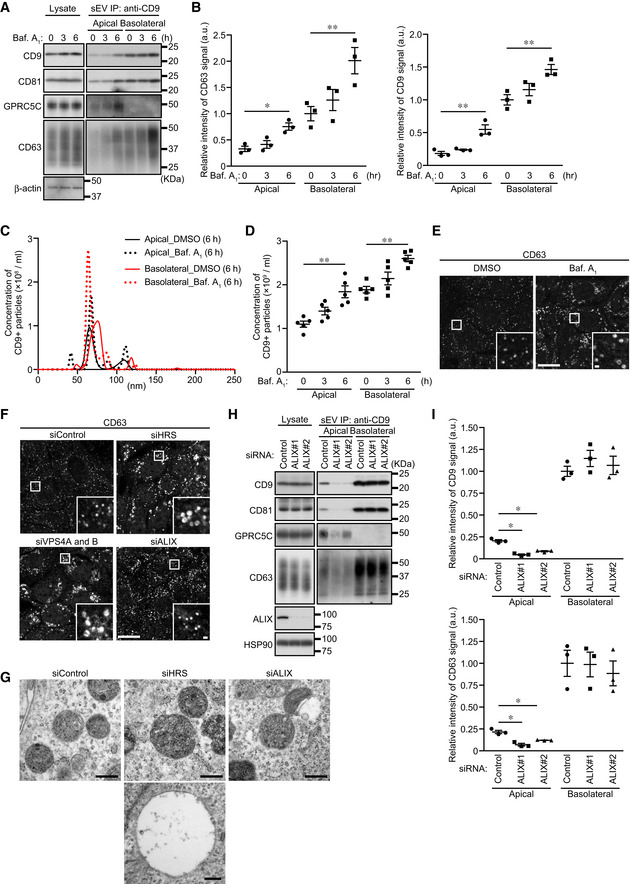
- MDCK cells were cultured on cell culture inserts for 4 days. On the last day, the cells were cultured in EV‐depleted medium with or without 100 nM bafilomycin A1 (Baf A1) for the times indicated until the medium was harvested. sEVs were isolated from the pre‐cleared medium by direct immunoaffinity capture using anti‐CD9 antibody. Cell lysates and sEV samples were analyzed by immunoblotting with the antibodies indicated.
- The intensity of the bands shown in (A) was measured in three independent experiments.
- sEVs prepared as in (A) were eluted from the beads with a glycine buffer and analyzed by NTA. Representative NTA traces were shown.
- Quantification of the NTA data obtained in five independent experiments of (C).
- Polarized MDCK cells were cultured in EV‐depleted medium with or without 100 nM Baf A1 for 6 h and cells were immunostained with anti‐CD63 antibody. Scale bars, 20 μm (1 μm, insets).
- MDCK cells were transfected with siControl or the siRNAs indicated. After 3 days, the culture medium was replaced with EV‐depleted medium. One day later, the cells were immunostained with anti‐CD63 antibody. Scale bars, 20 μm (1 μm, insets).
- MDCK cells were transfected with the siRNAs indicated, cultured as in (E), and analyzed by conventional electron microscopy. Scale bars, 400 nm. Note that in addition to normal MVBs, enlarged and ILV‐less MVB‐like structures were often observed in HRS‐KD cells.
- MDCK cells were transfected with siControl or two independent siALIX. The cells were then transferred to cell culture inserts and cultured for 4 days. On the last day, the culture medium was replaced with EV‐depleted medium. sEVs were isolated from the pre‐cleared medium by direct immunoaffinity capture using anti‐CD9 antibody. Cell lysates and sEV samples were analyzed by immunoblotting with the antibodies indicated.
- The intensity of the bands shown in (H) was measured in three independent experiments.
Data information: (A and H) CD63 blots were separately obtained on different days using the same samples. (B, D and I) *P < 0.05, **P < 0.01 (one‐way ANOVA and Tukey's test). Mean ± s.e.m. was shown.
Depletion of ALIX specifically reduces apical exosome release
Unlike these ESCRT‐KDs, ALIX‐KD specifically decreased apical CD9‐ and CD63‐positive sEV release and did not affect basolateral sEV release (Figs 3, EV2H and I, and EV3). Because the size of the MVBs in the ALIX‐KD cells seemed to be unaffected, unlike the HRS‐KD or VPS4‐KD cells (Fig EV2F and G), ALIX is likely to be involved in apical exosome release independently of the ESCRT machinery. Actually, ALIX is also known to form a ternary complex with Syntenin1 and Syndecan1 and to regulate exosome biogenesis (Baietti et al, 2012; Ghossoub et al, 2014). As shown in Fig EV4, Syntenin1‐KD and Syndecan1‐KD phenocopied ALIX‐KD (Figs 3 and EV2H and I), strongly suggesting that ALIX regulates apical exosome release together with Syntenin1 and Syndecan1, and independently of the ESCRT machinery. Since ALIX has been shown to mediate the sorting of exosome cargo proteins (Dores et al, 2012; Dores et al, 2016; Larios et al, 2020) and Syntenin1 can bind CD63 (Latysheva et al, 2006), an abundant protein in apical exosomes (Fig 1), the ALIX–Syntenin1–Syndecan1 complex presumably regulates the cargo protein sorting to apical exosomes and may also be involved in the efficient exosome formation in MDCK cells.
Figure EV3. The effect of ALIX‐KD and GW4869 treatment on release of CD63‐positive sEVs and all sEVs.
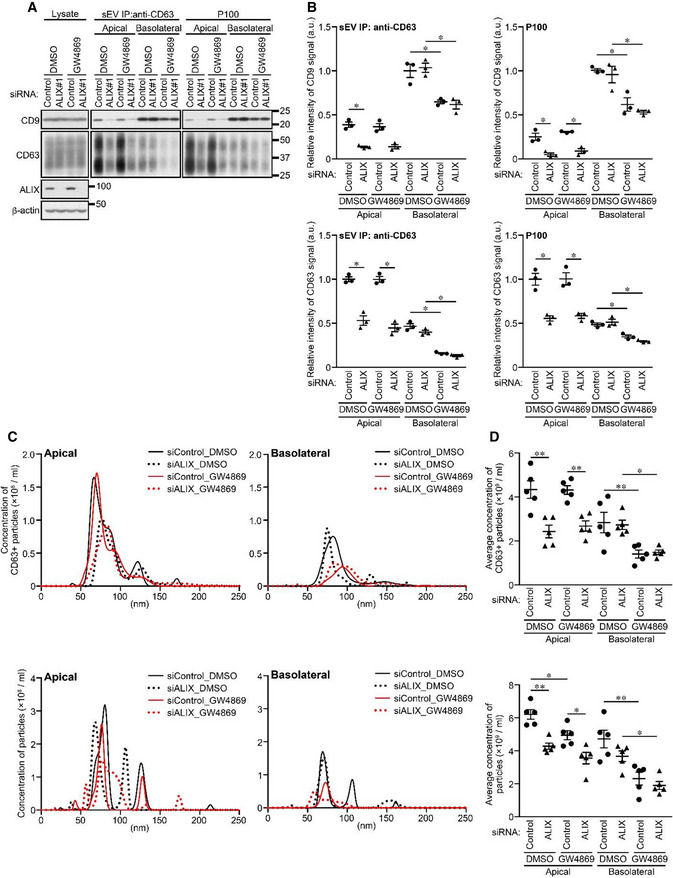
- MDCK cells stably expressing human CD63 were transfected with siControl or siALIX, and the cells were transferred to cell culture inserts and cultured for 4 days. On the last day, the culture medium was replaced with EV‐depleted medium with or without 10 nM GW4869. sEVs were isolated from the pre‐cleared medium by direct immunoaffinity capture using anti‐CD63 antibody or ultracentrifugation. Cell lysates and sEV samples were analyzed by immunoblotting with the antibodies indicated.
- The intensity of the bands shown in (A) was measured in three independent experiments.
- sEVs prepared as in (A) were eluted from the beads with a glycine buffer and analyzed by NTA. Representative NTA traces were shown.
- Quantification of the NTA data obtained in five independent experiments of (C).
Data information: (B and D) *P < 0.05, **P < 0.01 (one‐way ANOVA and Tukey's test). Mean ± s.e.m. was shown.
Figure EV4. Syntenin1 and Syndecan1 are specifically involved in the apical exosome release.
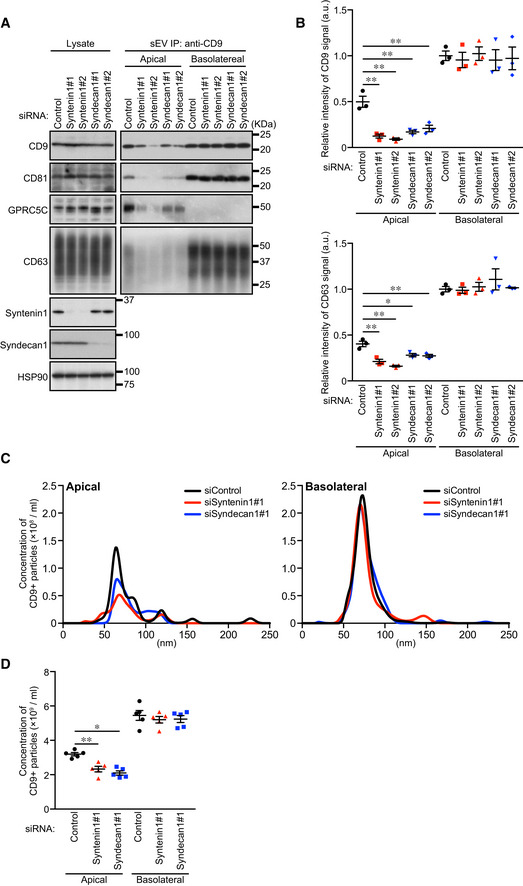
- MDCK cells were transfected with siControl or the siRNAs indicated. The cells were then transferred to cell culture inserts and cultured for 4 days. On the last day, the culture medium was replaced with EV‐depleted medium. sEVs were isolated from the pre‐cleared medium by direct immunoaffinity capture using anti‐CD9 antibody. Cell lysates and sEV samples were analyzed by immunoblotting with the antibodies indicated.
- The intensity of the bands shown in (A) was measured in three independent experiments.
- EVs prepared as in (A) were eluted from the beads with a glycine buffer and analyzed by NTA. Representative NTA traces were shown.
- Quantification of the NTA of data obtained in five independent experiments of (C).
Data information: (A) CD63 blots were separately obtained on different days using the same samples. (B and D) *P < 0.05, **P < 0.01 (one‐way ANOVA and Tukey's test). Mean ± s.e.m. was shown.
Inhibition of ceramide synthesis specifically inhibits basolateral exosome release
To identify the mechanism of the ALIX/ESCRT‐independent basolateral exosome release, we turned our attention to the sphingolipid ceramide, because it is enriched in exosomes and regulates formation and release of EVs independently of the ESCRT machinery (Trajkovic et al, 2008; Menck et al, 2017). Ceramide is formed as a result of the hydrolytic removal of the phosphocholine moiety of sphingomyelin by sphingomyelinases (SMases), and the neutral SMase inhibitor GW4869 is often used as an effective drug to suppress EV release (Trajkovic et al, 2008; Menck et al, 2017; Verweij et al, 2018; Catalano & O'Driscoll, 2020). When MDCK cells were treated with GW4869, basolateral CD9‐ and CD63‐positive sEV release was specifically reduced without affecting apical sEV release (Figs EV3 and EV5A–D). Essentially, the same results were obtained by nSMase2‐KD (Fig EV5E–H), indicating that ceramide is involved only in basolateral CD9‐ and CD63‐positive exosome release.
Figure EV5. Ceramide is specifically involved in the basolateral exosome release.
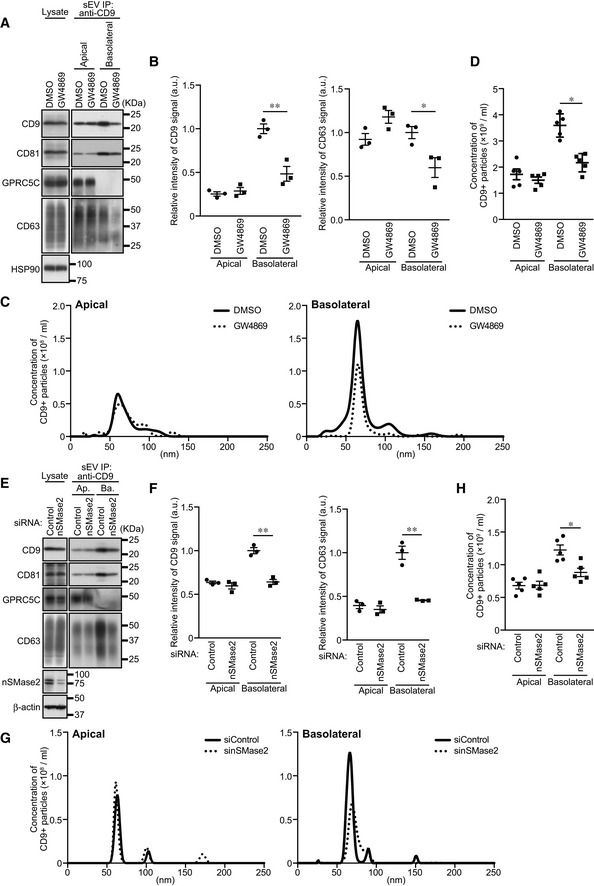
- MDCK cells were cultured on cell culture inserts for 4 days. On the last day, the cells were cultured in EV‐depleted medium with or without 10 nM GW4869. sEVs were isolated from the pre‐cleared medium by direct immunoaffinity capture using anti‐CD9 antibody. Cell lysates and sEV samples were analyzed by immunoblotting with the antibodies indicated.
- The intensity of the bands shown in (A) was measured in three independent experiments.
- sEVs prepared as in (A) were eluted from the beads with a glycine buffer and analyzed by NTA. Representative NTA traces were shown.
- Quantification of the NTA data obtained in five independent experiments of (C).
- MDCK cells were transfected with siControl or the sinSMase2. The cells were then transferred to cell culture inserts and cultured for 4 days. On the last day, the culture medium was replaced with EV‐depleted medium. sEVs were prepared and analyzed as in (A).
- The intensity of the bands shown in (E) was measured in three independent experiments.
- sEVs prepared as in (E) were eluted from the beads and then analyzed as in (C).
- Quantification of the NTA of data obtained in five independent experiments of (G).
Data information: (A and E) CD63 blots were separately obtained on different days using the same samples. (B, D, F and H) *P < 0.05, **P < 0.01 (one‐way ANOVA and Tukey's test). Mean ± s.e.m. was shown.
ALIX and ceramide mediate polarized exosome release independently of each other
Finally, we investigated whether ALIX and ceramide mediate the polarized release of exosomes from MDCK cells independently of each other. The results showed that ALIX‐KD reduced the amount of the apical CD9‐ and CD63‐positive sEVs and number of these sEVs released, and that GW4869 had no effect, whereas the opposite results were obtained regarding basolateral CD9‐ and CD63‐positive sEVs (Figs 4A–D and EV3). Unexpectedly, however, GW4869 treatment of all sEV samples (P100) significantly reduced the number of apical sEV released (Fig EV3C and D, bottom), but it did not affect the release of apical CD63 or CD9 proteins (Fig EV3A and B). Consistent with our findings, it has recently been reported that neutral SMase inhibition decreases EV release from the apical side as well as from the basolateral side of polarized human cholangiocytes (Davies et al, 2020). Hence, ceramide generation is also likely to be involved in the apical CD63‐ and CD9‐negative sEV release from MDCK cells, although whether such sEVs originate from the plasma membrane or MVBs remains unknown. Since no accumulation of exosome markers in total lysates was observed even in ALIX‐KD and GW4869‐treated cells, secretory MVBs may represent only a minor population of all MVBs. Alternatively, inhibition of exosome release may promote degradation of secretory MVBs, in contrast to lysosomal dysfunction, which promoted exosome release (Fig EV2A–D). Taken together, these results indicated that ALIX and ceramide independently mediate apical exosome release and basolateral exosome release, respectively (Fig 4E).
Figure 4. ALIX and ceramide independently mediate apical and basolateral exosome release, respectively.
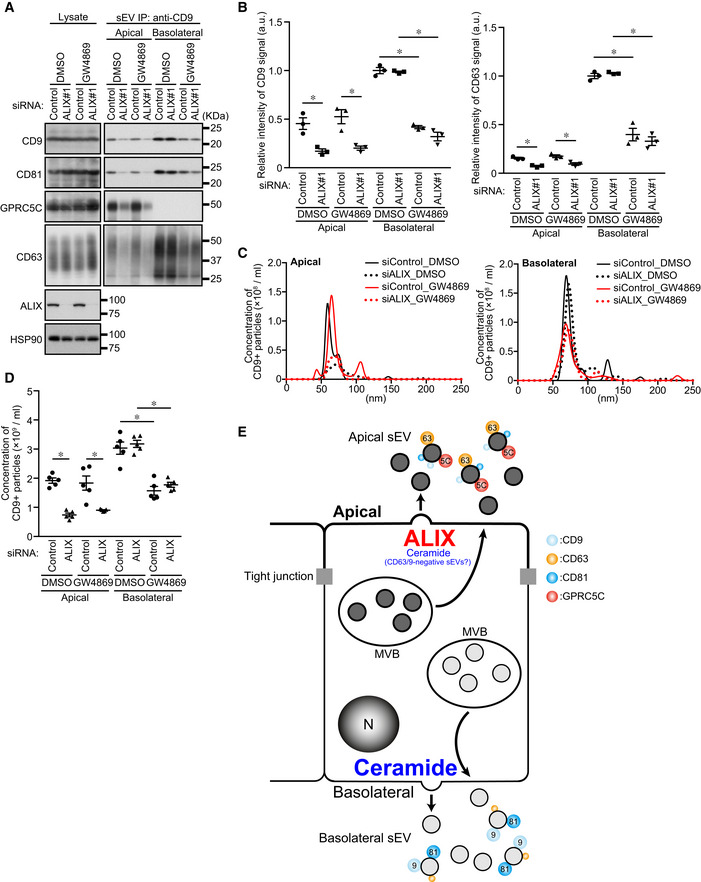
- MDCK cells were transfected with siControl or siALIX, and the cells were transferred to cell culture inserts and cultured for 4 days. On the last day, the culture medium was replaced with EV‐depleted medium with or without 10 nM GW4869. sEVs were isolated from the pre‐cleared medium by direct immunoaffinity capture using anti‐CD9 antibody. Cell lysates and sEV samples were analyzed by immunoblotting with the antibodies indicated.
- The intensity of the bands shown in (A) was measured in three independent experiments.
- sEVs prepared as in (A) were eluted from the beads with a glycine buffer and analyzed by NTA. Representative NTA traces were shown.
- Quantification of the NTA data obtained in five independent experiments.
- Working model of polarized sEV release from MDCK cells. Apical release of sEVs (mainly CD63‐enriched, CD9‐positive, Annexin I‐negative exosomes) and basolateral release of sEVs (mainly CD9‐enriched, CD63‐positive, Annexin I‐negative exosomes) are mediated by ALIX–Syntenin1–Syndecan1 and ceramide, respectively. Marker sizes on sEVs (colored circles) reflect the abundance of each exosome protein. Ceramide also contributes to apical release of uncharacterized “CD9/CD63‐negative sEVs”.
Data information: (A) CD63 blots were separately obtained on different days using the same samples. (B and D) *P < 0.01 (one‐way ANOVA and Tukey's test). Mean ± s.e.m. was shown.
The results of the present study provide evidence that distinct exosomes (apical and basolateral exosomes) are separately generated in polarized MDCK cells via two independent mechanisms. Considering that the significance of the existence of several exosome production mechanisms has never been elucidated thus far, this study is the first to demonstrate that two independent mechanisms, i.e., the ALIX–Syntenin1–Syndecan1 machinery (apical side) and the sphingomyelinase‐dependent ceramide production machinery, are used for polarized exosome release from epithelial cells. Since ALIX and ceramide are also known to be involved in microvesicle formation and release (Matusek et al, 2014; Menck et al, 2017), these two independent mechanisms may play a role in apical and basolateral microvesicle release. Future investigation will be necessary to determine whether apical and basolateral release of CD9/CD63‐negative, Annexin I‐positive microvesicles depends on ALIX and/or ceramide.
Although it still remains unclear whether heterogeneous exosomes are formed in a single MVB or different MVBs, our findings suggest that the source of the exosomal heterogeneity in polarized epithelial cells is different MVBs rather than a single MVB, because CD9‐positive dots were not overlapped well with CD63‐positive dots (Fig EV1B) in polarized MDCK cells. Moreover, since CD63‐ and CD9‐positive EVs were also separately formed via an unknown mechanism in dendritic cells (Kowal et al, 2016), the two mechanisms can be used to generate exosomal heterogeneity even in non‐polarized cells. Thus, our discovery provides an important clue to understanding of the generation of exosomal heterogeneity in many cell types in addition to epithelial cells.
Materials and Methods
Cell culture
MDCK II cells and HEK293T cells were cultured in Dulbecco's modified Eagle's medium (DMEM; Fujifilm Wako Pure Chemical) supplemented with 10% fetal bovine serum (FBS), and 50 μg/ml penicillin and streptomycin in a 5% CO2 incubator. To purify EVs, 1 × 10⁶ cells of MDCK were plated on cell culture inserts (140640, Thermo Fisher scientific). The culture medium was changed every 24 h, and after 3 days, the cells were washed twice with PBS and once with DMEM without FBS. The cells were then cultured for 24 h in 0.5 ml of DMEM containing 1% EV‐depleted FBS. EV‐depleted FBS was obtained by ultracentrifugation at 100,000 g for 24 h and filtration through a 0.22‐μm filter. For siRNA transfection, cells were plated on a culture dish, and 1 day later, the cells were transfected with siRNAs. After an additional 24 h, the cells were transferred to cell culture inserts, and 2 days later, the cells were again transfected with siRNAs. For drug treatments, cells were cultured with 10 nM GW4869 (Sigma‐Aldrich) for 24 h or with 100 nM bafilomycin A1 (Sigma‐Aldrich) for the times indicated.
Antibodies and reagents
All primary antibodies used in this study are listed in Table EV4. Anti‐dog GPRC5C rabbit polyclonal antibody was raised against its C‐terminal region (AA 298–442). Horseradish peroxidase (HRP)‐conjugated anti‐mouse IgG goat polyclonal antibody (Southern Biotech), HRP‐conjugated anti‐rabbit IgG donkey antibody and HRP‐conjugated anti‐goat IgG donkey antibody (GE Healthcare), HRP‐conjugated Protein‐G (Abcam), and Alexa Fluor 488/555‐conjugated anti‐goat/mouse IgG donkey polyclonal antibodies (Thermo Fisher Scientific) were used as secondary antibodies.
Plasmid
cDNA encoding human CD63 was amplified by PCR using human brain Marathon‐Ready cDNA as a template (Clontech). The cDNA was inserted into pMRX‐IRES‐bsr vector (provided by S. Yamaoka, Tokyo Medical and Dental University, Tokyo, Japan) (available from RIKEN BioResource Center, Japan; Cat# RDB18686).
Retroviral infections and generation of stable cell lines
HEK293T cells were transiently transfected with retrovirus vectors, pCG‐gag‐pol, and pCG‐VSV‐G (provided by T. Yasui, The National Institute of Biomedical Innovation, Health and Nutrition, Osaka, Japan) by using Lipofectamine 2000 (Thermo Fisher scientific). Two days after transfection, culture medium containing retrovirus was collected and filtered through a 0.45‐μm pore PES filter (Millipore). MDCK cells were cultured with retrovirus and 8 μg/ml polybrene. Uninfected cells were removed with 5 μg/ml blasticidin S (Fujifilm Wako Pure Chemical). MDCK cells stably expressing human CD63 were used for direct immunoaffinity capture of CD63‐positive sEVs (see below for details), because anti‐CD63 antibody used in this study did not allow for immunoaffinity purification of canine CD63. Human CD63 showed punctate intracellular localization similar to endogenous CD63 and it was also enriched in apical sEVs (data not shown).
RNAi
siRNA oligonucleotides were purchased from Nippon Gene. The target sequences used are listed in Table EV4. Cells were transfected with the siRNA oligonucleotides by using Lipofectamine RNAiMAX (Thermo Fisher Scientific) according to the manufacturer's instructions.
Isolation of extracellular vesicles from cultured cells in culture inserts
The collected media (0.5 ml) from one culture insert were first subjected to a centrifugation step of 700 g for 5 min to pellet and remove cells, and the supernatant was spun at 3,000 g for 10 min to remove cell debris and apoptotic bodies. The 2nd supernatant was re‐centrifuged at 10,000 g for 30 min to remove heavy microvesicles, and any remaining large EVs were removed by passing the final supernatant through a 0.22‐μm pore PES filter (Millipore). The obtained supernatant (pre‐cleared medium) was then subjected to polyethylene glycol (PEG) precipitation as described previously (Rider et al, 2016) or ultracentrifugation to isolate the sEVs. For PEG precipitation, the equal volume of 0.22‐μm filtered 16% PEG‐6000 solution (16% PEG‐6000 and 1 M NaCl) added to the pre‐cleared medium and the mixed samples were then refrigerated overnight. The following day, the samples were centrifuged at 4,000 g for 1 h. The pellets obtained were suspended in 0.22‐μm filtered PBS, and the suspensions were ultracentrifuged at 100,000 g for 1 h in MLS‐50 rotor (Beckman Coulter) to wash the samples (final sample; PEG pellet; Fig EV1A). To isolate sEVs by ultracentrifugation, the pre‐cleared medium was subjected to ultracentrifugation at 100,000 g for 1 h. The pellet obtained was washed with 0.22‐μm filtered PBS the same as after PEG precipitation (final sample; P100; Fig EV1A). For immunoblotting, the final samples were lysed with an SDS sample buffer without reducing agent, and for nanoparticle tracking assay (NTA) or negative staining, the final sample was suspended in 0.22‐μm filtered PBS.
Direct immunoaffinity capture of CD9‐ and CD63‐positive sEVs
Direct immunoaffinity capture was performed as described previously (Jeppesen et al, 2019). In brief, the pre‐cleared medium was split into three portions. One portion was incubated for 16 h at 4°C with Dynabeads (Thermo Fisher Scientific) directly conjugated to anti‐CD9 or anti‐CD63 antibodies with rotation, and the second portion with Dynabeads conjugated to normal mouse IgG (Santa Cruz). The third portion was subjected to ultracentrifugation and washing to obtain P100 (as described above). After incubation, the beads were washed twice with 0.22‐μm filtered ice‐cold 0.1% BSA‐PBS and washed once with 0.22‐μm filtered PBS. Immediately following the final wash, the sEV‐loaded beads were suspended in an SDS sample buffer without reducing agent. The beads were removed from the suspension with a magnet, and the clarified lysates were used for immunoblotting. For NTA, sEVs were eluted from the beads as follows: After the final wash, the sEV‐loaded beads were incubated in 0.22‐μm filtered 0.1 M glycine‐HCl buffer (pH 3.0) for 5 min at room temperature and then equilibrated with one‐fourth volume of 0.22‐μm filtered 1 M Tris–HCl (pH 8.0). The supernatant that remained after removing of the beads with the magnet was suspended in 0.22‐μm filtered PBS.
Immunoblotting
Cells were collected with an SDS sample buffer without reducing agent and dispersed through a 25‐gauge needle. Samples were subsequently separated by SDS–PAGE and transferred to Immobilon‐P polyvinylidene difluoride membranes (Millipore). Immunoblot analysis was performed with the antibodies indicated, and visualization was achieved with the Immobilon Western Chemiluminescent HRP substrate (Millipore). All sEV samples used this study were particles recovered from the pre‐cleared whole conditioned medium. The intensity of the immunoreactive bands was quantified with the Fiji software (https://fiji.sc). The blots shown in this study are representative of three independent experiments.
Nanoparticle tracking assay
Purified sEV samples were analyzed for particle concentration and size distribution by using the NTA method by Malvern NanoSight NS300 (Malvern Panalytical). The assays were performed according to the protocol recommended by the manufacturer. Briefly, three independent replicates of sEV preparations diluted in PBS (see above) were injected at a constant rate into the tracking chamber with the syringe pump provided. The specimens were tracked at room temperature for 60 s. Shutter and gain were manually adjusted for optimal detection and kept at the optimized settings for all samples. The data were captured and analyzed with NTA software (version 3.4, Malvern Panalytical).
Floatation assay
PEG pellets were suspended in 0.5 ml of an ice‐cold homogenization buffer (250 mM sucrose, 20 mM HEPES‐KOH [pH 7.4], 1 mM EDTA, and complete EDTA‐free protease inhibitor). The suspensions were diluted with an equal volume of 50% OptiPrep (Cosmo Bio) in the homogenization buffer. Discontinuous OptiPrep gradients were generated in MLS‐50 tubes (Beckman Coulter) by overlaying the following OptiPrep solutions in the homogenization buffer: 1 ml of the diluted sample in 25% OptiPrep, 1.5 ml in 20% OptiPrep, 1.875 ml in 10% OptiPrep, and 0.625 ml in 0% OptiPrep. The gradients were centrifuged at 150,000 g in MLS‐50 rotors for 3 h, and then 10 fractions (0.5 ml each) were collected from the top. Proteins in each fraction were isolated by TCA precipitation. The final pellets were suspended in an SDS sample buffer without reducing agent.
Mass spectrometry and data analysis
Proteins in P100, which was obtained from culture medium without FBS to avoid serum protein contamination, were concentrated by TCA (trichloroacetic acid) precipitation. The precipitates were suspended in 50 mM TEAB and 0.1% SDS, and the protein concentrations were determined by the BCA method. A 2 μg sample of the proteins from each suspension was reduced by adding DTT to a final concentration of 134 mM and incubating at 35°C for 2 h. Free thiol groups were alkylated by adding 230 mM iodoacetic acid and allowing to stand at room temperature for 30 min in the dark. Samples were digested with trypsin (APRO Science) overnight at 37°C, and the digested samples were prepared for mass spectrometry analysis by passage through a GL‐Tip SCX (GL Science). The samples were reconstituted in a starting buffer composed of 10 mM KH2PO4 (pH 3.0), 25% acetonitrile, and 10 mM KCl. The peptides were eluted off the elution buffer of 10 mM KH2PO4 (pH 3.0), 25% acetonitrile, and 350 mM KCl. Each eluate was concentrated by vacuum centrifugation and resuspended in 50 μl of 0.1% (v/v) formic acid, and the samples were desalted using SPE C‐Tip (Nikkyo Technos). The desalted samples were concentrated by vacuum centrifugation and resuspended in 40 μl of 0.1% (v/v) formic acid. All samples were stored at −20°C until LC‐MS analysis. The peptides recovered were analyzed with a Q Exactive Plus mass spectrometer (Thermo Fisher Scientific) coupled on‐line with a capillary high‐performance liquid chromatography (HPLC) system (EASY‐nLC 1200, Thermo Fisher Scientific) to acquire MS/MS spectra. For electrospray ionization, a 0.075 × 150 mm‐EASY‐Spray column (3‐μm particle diameter, 100 Å pore size, Thermo Fisher Scientific) with mobile phases of 0.1% formic acid and 0.1% formic acid/80% acetonitrile was used. Data derived from the MS/MS spectra were used to search the SWISS‐Prot protein database by using the MASCOT Server (http://www.matrixscience.com) and to identify proteins by using the Scaffold viewer program (http://www.proteomesoftware.com/products/scaffold).
Immunocytochemistry
Cells grown on coverslips were washed with PBS and fixed in 10% TCA or ice‐cold 100% MeOH for 10 min at −30°C. The fixed cells were permeabilized with 50 μg/ml digitonin (Sigma‐Aldrich) in PBS for 3 min, blocked with 3% bovine serum albumin in PBS for 30 min, and then incubated with anti‐CD63 goat and/or anti‐CD9 mouse antibodies for 1 h. After washing three times with PBS, the cells were incubated with Alexa Fluor 488‐conjugated anti‐goat IgG and Alexa Fluor 555‐conjugated anti‐mouse IgG secondary antibodies for 1 h. The coverslips were observed using a confocal laser scanning microscope (FV1000 IX81, Olympus) with a 100× oil‐immersion objective lens (1.45 NA, Olympus) and captured with FluoView software (Olympus). The images were processed by using Photoshop 2020 software (Adobe).
Electron microscopy
Cells were cultured on cell tight C‐2 cell disks (Sumitomo Bakelite) and fixed for 2 h in 2.5% glutaraldehyde (Electron Microscopy Science) in 0.1 M phosphate buffer (pH 7.4) on ice. The cells were washed with 0.1 M phosphate buffer (pH 7.4) three times, postfixed in 1% osmium tetroxide in 0.1 M phosphate buffer (pH 7.4) for 2 h, dehydrated, and embedded in Epon 812 according to the standard procedure. Ultrathin sections were stained with uranyl acetate and lead citrate. For immunonegative staining, a PEG pellet suspended in PBS was added to a nickel‐coated formvar grid for 5 min. The excess solution was soaked off with a filter paper, and the samples were washed with 0.1 M phosphate buffer (pH 7.4) three times and then postfixed in 1% PFA (TAAB Laboratories Equipment) in 0.1 M phosphate buffer (pH 7.4) for 3 min. The grids were transferred to a solution containing mouse anti‐CD9 antibody diluted 1:2,000 for 2 h and then rinsed with 0.1 M phosphate buffer (pH 7.4) six times. Bound antibodies were detected with goat anti‐mouse IgG (H + L) 5‐nm colloidal Gold particles (BBI Solutions) and rinsed with 0.1 M phosphate buffer (pH 7.4) six times. The grids were washed twice with distilled water and negatively stained with 1% uranyl acetate for 2 min. All samples were examined with an H‐7100 electron microscope (Hitachi).
Statistical analysis
Two groups of data were evaluated by the unpaired two‐tailed Student's t‐test, and multiple comparisons were performed by one‐way analysis of variance (ANOVA) followed by the Tukey's test. Statistical analysis was performed with Prism6 (GraphPad software).
Author contributions
TM and MF designed the experiments, interpreted the data, and wrote the manuscript. TM, FO, and SH carried out the experiments and interpreted the data. YS performed EM analysis. All authors discussed the results and commented on the manuscript.
Conflict of interest
The authors declare that they have no conflict of interest.
Supporting information
Expanded View Figures PDF
Table EV1
Table EV2
Table EV3
Table EV4
Review Process File
Acknowledgements
We thank K. Shoji for technical assistance, and E. Morita, N. Tanaka, and all members of the Fukuda laboratory for helpful discussions. This work was supported in part by Grant‐in‐Aid for Research Activity Start‐up 19K21174 from the Ministry of Education, Culture, Sports, Science and Technology (MEXT) of Japan (to TM); the Kao Foundation for Arts and Sciences (to TM); Grant‐in‐Aid for Scientific Research (B) 19H03220 from MEXT (to MF); and Japan Science and Technology Agency (JST) CREST Grant JPMJCR17H4 (to MF).
EMBO reports (2021) 22: e51475.
Contributor Information
Takahide Matsui, Email: takahide.matsui.c1@tohoku.ac.jp.
Mitsunori Fukuda, Email: nori@tohoku.ac.jp.
Data availability
Mass spectrometry data have been deposited in PRIDE (https://www.ebi.ac.uk/pride/) (accession number PXD024031; http://www.ebi.ac.uk/pride/archive/projects/PXD024031).
References
- Baietti MF, Zhang Z, Mortier E, Melchior A, Degeest G, Geeraerts A, Ivarsson Y, Depoortere F, Coomans C, Vermeiren E et al (2012) Syndecan‐syntenin‐ALIX regulates the biogenesis of exosomes. Nat Cell Biol 14: 677–685 [DOI] [PubMed] [Google Scholar]
- Banfer S, Schneider D, Dewes J, Strauss MT, Freibert SA, Heimerl T, Maier UG, Elsasser HP, Jungmann R, Jacob R (2018) Molecular mechanism to recruit galectin‐3 into multivesicular bodies for polarized exosomal secretion. Proc Natl Acad Sci USA 115: E4396–E4405 [DOI] [PMC free article] [PubMed] [Google Scholar]
- Catalano M, O'Driscoll L (2020) Inhibiting extracellular vesicles formation and release: a review of EV inhibitors. J Extracell Vesicles 9: 1703244 [DOI] [PMC free article] [PubMed] [Google Scholar]
- Chen Q, Takada R, Noda C, Kobayashi S, Takada S (2016) Different populations of Wnt‐containing vesicles are individually released from polarized epithelial cells. Sci Rep 6: 35562 [DOI] [PMC free article] [PubMed] [Google Scholar]
- Christ L, Raiborg C, Wenzel EM, Campsteijn C, Stenmark H (2017) Cellular functions and molecular mechanisms of the ESCRT membrane‐scission machinery. Trends Biochem Sci 42: 42–56 [DOI] [PubMed] [Google Scholar]
- Cocozza F, Grisard E, Martin‐Jaular L, Mathieu M, Thery C (2020) SnapShot: extracellular vesicles. Cell 182: 262 [DOI] [PubMed] [Google Scholar]
- Cocucci E, Racchetti G, Meldolesi J (2009) Shedding microvesicles: artefacts no more. Trends Cell Biol 19: 43–51 [DOI] [PubMed] [Google Scholar]
- Cocucci E, Meldolesi J (2015) Ectosomes and exosomes: shedding the confusion between extracellular vesicles. Trends Cell Biol 25: 364–372 [DOI] [PubMed] [Google Scholar]
- Colombo M, Moita C, van Niel G, Kowal J, Vigneron J, Benaroch P, Manel N, Moita LF, Thery C, Raposo G (2013) Analysis of ESCRT functions in exosome biogenesis, composition and secretion highlights the heterogeneity of extracellular vesicles. J Cell Sci 126: 5553–5565 [DOI] [PubMed] [Google Scholar]
- Davies BA, Morton LO, Jefferson JR, Rozeveld CN, Doskey LC, LaRusso NF, Katzmann DJ (2020) Polarized human cholangiocytes release distinct populations of apical and basolateral small extracellular vesicles. Mol Biol Cell 31: 2463–2474 [DOI] [PMC free article] [PubMed] [Google Scholar]
- Dores MR, Chen B, Lin H, Soh UJK, Paing MM, Montagne WA, Meerloo T, Trejo J (2012) ALIX binds a YPX3L motif of the GPCR PAR1 and mediates ubiquitin‐independent ESCRT‐III/MVB sorting. J Cell Biol 197: 407–419 [DOI] [PMC free article] [PubMed] [Google Scholar]
- Dores MR, Grimsey NJ, Mendez F, Trejo J (2016) ALIX regulates the ubiquitin‐independent lysosomal sorting of the P2Y1 purinergic receptor via a YPX3L motif. PLoS One 11: e0157587 [DOI] [PMC free article] [PubMed] [Google Scholar]
- Ghossoub R, Lembo F, Rubio A, Gaillard CB, Bouchet J, Vitale N, Slavik J, Machala M, Zimmermann P (2014) Syntenin‐ALIX exosome biogenesis and budding into multivesicular bodies are controlled by ARF6 and PLD2. Nat Commun 5: 3477 [DOI] [PubMed] [Google Scholar]
- Henne WM, Buchkovich NJ, Emr SD (2011) The ESCRT pathway. Dev Cell 21: 77–91 [DOI] [PubMed] [Google Scholar]
- Huotari J, Helenius A (2011) Endosome maturation. EMBO J 30: 3481–3500 [DOI] [PMC free article] [PubMed] [Google Scholar]
- Hurley JH (2015) ESCRTs are everywhere. EMBO J 34: 2398–2407 [DOI] [PMC free article] [PubMed] [Google Scholar]
- Jeppesen DK, Fenix AM, Franklin JL, Higginbotham JN, Zhang Q, Zimmerman LJ, Liebler DC, Ping J, Liu Q, Evans R et al (2019) Reassessment of exosome composition. Cell 177: 428–445 [DOI] [PMC free article] [PubMed] [Google Scholar]
- Kalluri R, LeBleu VS (2020) The biology, function, and biomedical applications of exosomes. Science 367: eaau6977 [DOI] [PMC free article] [PubMed] [Google Scholar]
- Kowal J, Arras G, Colombo M, Jouve M, Morath JP, Primdal‐Bengtson B, Dingli F, Loew D, Tkach M, Thery C (2016) Proteomic comparison defines novel markers to characterize heterogeneous populations of extracellular vesicle subtypes. Proc Natl Acad Sci USA 113: E968–E977 [DOI] [PMC free article] [PubMed] [Google Scholar]
- Larios J, Mercier V, Roux A, Gruenberg J (2020) ALIX‐ and ESCRT‐III‐dependent sorting of tetraspanins to exosomes. J Cell Biol 219: e201904113 [DOI] [PMC free article] [PubMed] [Google Scholar]
- Latifkar A, Ling L, Hingorani A, Johansen E, Clement A, Zhang X, Hartman J, Fischbach C, Lin H, Cerione RA et al (2019) Loss of sirtuin 1 alters the secretome of breast cancer cells by impairing lysosomal integrity. Dev Cell 49: 393–408 [DOI] [PMC free article] [PubMed] [Google Scholar]
- Latysheva N, Muratov G, Rajesh S, Padgett M, Hotchin NA, Overduin M, Berditchevski F (2006) Syntenin‐1 is a new component of tetraspanin‐enriched microdomains: mechanisms and consequences of the interaction of syntenin‐1 with CD63. Mol Cell Biol 26: 7707–7718 [DOI] [PMC free article] [PubMed] [Google Scholar]
- Mathieu M, Martin‐Jaular L, Lavieu G, Thery C (2019) Specificities of secretion and uptake of exosomes and other extracellular vesicles for cell‐to‐cell communication. Nat Cell Biol 21: 9–17 [DOI] [PubMed] [Google Scholar]
- Matusek T, Wendler F, Poles S, Pizette S, D'Angelo G, Furthauer M, Therond PP (2014) The ESCRT machinery regulates the secretion and long‐range activity of Hedgehog. Nature 516: 99–103 [DOI] [PubMed] [Google Scholar]
- Menck K, Sonmezer C, Worst TS, Schulz M, Dihazi GH, Streit F, Erdmann G, Kling S, Boutros M, Binder C et al (2017) Neutral sphingomyelinases control extracellular vesicles budding from the plasma membrane. J Extracell Vesicles 6: 1378056 [DOI] [PMC free article] [PubMed] [Google Scholar]
- Nabhan JF, Hu R, Oh RS, Cohen SN, Lu Q (2012) Formation and release of arrestin domain‐containing protein 1‐mediated microvesicles (ARMMs) at plasma membrane by recruitment of TSG101 protein. Proc Natl Acad Sci USA 109: 4146–4151 [DOI] [PMC free article] [PubMed] [Google Scholar]
- Pegtel DM, Gould SJ (2019) Exosomes. Annu Rev Biochem 88: 487–514 [DOI] [PubMed] [Google Scholar]
- Raiborg C, Stenmark H (2009) The ESCRT machinery in endosomal sorting of ubiquitylated membrane proteins. Nature 458: 445–452 [DOI] [PubMed] [Google Scholar]
- Rajkumar P, Cha B, Yin J, Arend LJ, Paunescu TG, Hirabayashi Y, Donowitz M, Pluznick JL (2018) Identifying the localization and exploring a functional role for Gprc5c in the kidney. FASEB J 32: 2046–2059 [DOI] [PMC free article] [PubMed] [Google Scholar]
- Rider MA, Hurwitz SN, Meckes DG Jr (2016) ExtraPEG: a polyethylene glycol‐based method for enrichment of extracellular vesicles. Sci Rep 6: 23978 [DOI] [PMC free article] [PubMed] [Google Scholar]
- Robbins MJ, Michalovich D, Hill J, Calver AR, Medhurst AD, Gloger I, Sims M, Middlemiss DN, Pangalos MN (2000) Molecular cloning and characterization of two novel retinoic acid‐inducible orphan G‐protein‐coupled receptors (GPRC5B and GPRC5C). Genomics 67: 8–18 [DOI] [PubMed] [Google Scholar]
- Simmons NL (1982) Cultured monolayers of MDCK cells: a novel model system for the study of epithelial development and function. Gen Pharmacol 13: 287–291 [DOI] [PubMed] [Google Scholar]
- Stuffers S, Sem Wegner C, Stenmark H, Brech A (2009) Multivesicular endosome biogenesis in the absence of ESCRTs. Traffic 10: 925–937 [DOI] [PubMed] [Google Scholar]
- Trajkovic K, Hsu C, Chiantia S, Rajendran L, Wenzel D, Wieland F, Schwille P, Brugger B, Simons M (2008) Ceramide triggers budding of exosome vesicles into multivesicular endosomes. Science 319: 1244–1247 [DOI] [PubMed] [Google Scholar]
- Verweij FJ, Bebelman MP, Jimenez CR, Garcia‐Vallejo JJ, Janssen H, Neefjes J, Knol JC, de Goeij‐de HR, Piersma SR, Baglio SR et al (2018) Quantifying exosome secretion from single cells reveals a modulatory role for GPCR signaling. J Cell Biol 217: 1129–1142 [DOI] [PMC free article] [PubMed] [Google Scholar]
- Vietri M, Radulovic M, Stenmark H (2020) The many functions of ESCRTs. Nat Rev Mol Cell Biol 21: 25–42 [DOI] [PubMed] [Google Scholar]
- Zhang H, Freitas D, Kim HS, Fabijanic K, Li Z, Chen H, Mark MT, Molina H, Martin AB, Bojmar L et al (2018) Identification of distinct nanoparticles and subsets of extracellular vesicles by asymmetric flow field‐flow fractionation. Nat Cell Biol 20: 332–343 [DOI] [PMC free article] [PubMed] [Google Scholar]
Associated Data
This section collects any data citations, data availability statements, or supplementary materials included in this article.
Supplementary Materials
Expanded View Figures PDF
Table EV1
Table EV2
Table EV3
Table EV4
Review Process File
Data Availability Statement
Mass spectrometry data have been deposited in PRIDE (https://www.ebi.ac.uk/pride/) (accession number PXD024031; http://www.ebi.ac.uk/pride/archive/projects/PXD024031).


