Abstract
Treatment of triple‐negative breast cancer (TNBC) remains challenging due to a lack of effective targeted therapies. Dysregulated glucose uptake and metabolism are essential for TNBC growth. Identifying the molecular drivers and mechanisms underlying the metabolic vulnerability of TNBC is key to exploiting dysregulated cancer metabolism for therapeutic applications. Mitogen‐inducible gene‐6 (MIG‐6) has long been thought of as a feedback inhibitor that targets activated EGFR and suppresses the growth of tumors driven by constitutive activated mutant EGFR. Here, our bioinformatics and histological analyses uncover that MIG‐6 is upregulated in TNBC and that MIG‐6 upregulation is positively correlated with poorer clinical outcomes in TNBC. Metabolic arrays and functional assays reveal that MIG‐6 drives glucose metabolism reprogramming toward glycolysis. Mechanistically, MIG‐6 recruits HAUSP deubiquitinase for stabilizing HIF1α protein expression and the subsequent upregulation of GLUT1 and other HIF1α‐regulated glycolytic genes, substantiating the comprehensive regulation of MIG‐6 in glucose metabolism. Moreover, our mouse studies demonstrate that MIG‐6 regulates GLUT1 expression in tumors and subsequent tumor growth in vivo. Collectively, this work reveals that MIG‐6 is a novel prognosis biomarker, metabolism regulator, and molecular driver of TNBC.
Keywords: glucose metabolism, GLUT1, HIF1α, MIG‐6, triple‐negative breast cancer
Subject Categories: Cancer, Metabolism
MIG‐6 is upregulated in TNBC and promotes tumor growth by fueling glycolytic flux via the HIf1α‐Glut1 pathway.

Introduction
Triple‐negative breast cancer (TNBC) is highly metastatic and the most aggressive breast cancer subtype. Since TNBC lacks expression of the estrogen receptor, the progesterone receptor, and human epidermal growth factor receptor 2 (HER2), no effective targeted therapies are currently available for TNBC. TNBC cells exhibit dysregulated metabolism to meet their increased biosynthetic and bioenergetic demands for supporting tumor growth and progression (Palaskas et al, 2011; Pelicano et al, 2014). TNBC cells frequently upregulate the membrane‐associated glucose transporter 1 (GLUT1) to facilitate the uptake and subsequent utilization and metabolism of glucose. GLUT1 upregulation in TNBC is associated with worse prognosis and treatment resistance (Hussein et al, 2011). Other processes associated with glucose metabolism, including glycolysis and oxidative phosphorylation, are found to be essential for the survival and growth of TNBC (Petrocca et al, 2013; Shen et al, 2015). Alterations of glucose metabolism are frequent and arise from multiple mechanisms (DeBerardinis & Chandel, 2016). Thus, understanding the genetic cues that underlie the metabolism dependence of TNBC offers new opportunities for the development of effective TNBC therapies.
Mitogen‐inducible gene‐6 (MIG‐6), also known as gene 33, receptor‐associated late transducer (RALT) or ErbB receptor feedback inhibitor 1 (ERRFI1), is an immediate, early response gene whose expression can be rapidly induced by many factors, including hormones, stress stimuli, and growth factors (e.g., EGF). MIG‐6 encodes a scaffolding adaptor protein that modulates signal transduction by interacting with other signal molecules. The discoveries that MIG‐6 is a feedback inhibitor of EGFR and that it selectively targets activated EGFR suggest that MIG‐6 plays a vital role in human cancers (Ferby et al, 2006; Zhang et al, 2007b). MIG‐6 directly binds to the intracellular domain of EGFR and inhibits EGFR signaling by reducing the catalytic activity and/or accelerating the internalization and degradation of EGFR. Depletion of MIG‐6 gene expression prolongs the activation of EGFR signaling and subsequently promotes tumorigenesis in mouse models of lung adenocarcinoma, glioblastoma, etc.—the cancer types driven by constitutively activated EGFR (Ying et al, 2010; Maity et al, 2015). In humans, MIG‐6 is genetically altered and transcriptionally silenced in lung cancer and glioblastoma (Zhang et al, 2007b; Ying et al, 2010). Besides EGFR, MIG‐6 inhibits the activity of other ErbB family members. Genetic silencing of MIG‐6 increases EGFR phosphorylation and EGF‐mediated cell proliferation in ErbB2 (HER2)‐amplified breast cancer cells (Anastasi et al, 2005). Although these findings point to MIG‐6 having growth inhibitory and tumor‐suppressive functions in human cancers, accumulating evidence has implied a contrasting role for MIG‐6 in growth regulation and tumor progression. For instance, Anastasi et al (2005) showed that inactivation mutations of the MIG‐6 gene were rarely detected in human breast carcinomas. Xu et al (2005) demonstrated that the endogenous expression of MIG‐6 protein is correlated with decreased doubling time in a panel of breast cancer cell lines and that exogenous overexpression of MIG‐6 inhibits apoptosis in MCF‐7 breast cancer cells. These observations suggest that MIG‐6 is a context‐dependent regulator in breast cancer. In particular, the precise role of MIG‐6 in TNBC remains elusive.
Here, we showed that MIG‐6 is upregulated in TNBC and its upregulation correlates with worse disease outcomes, suggesting an unexpected tumor‐promoting role for MIG‐6 in TNBC. Using gene arrays, functions assays, animal models, and human cancer samples, we demonstrate an essential role of MIG‐6 in glucose metabolism and tumor growth in TNBC. We also unveil the mechanism by which MIG‐6 regulates glucose metabolism. Our study establishes a metabolic prosurvival role of MIG‐6 in TNBC.
Results
MIG‐6 is positively correlated with disease progression and worse prognosis in TNBC
To explore the relationship of MIG‐6 gene expression in different breast cancer subtypes, we analyzed The Cancer Genome Atlas (TCGA) datasets using cBioPortal (Cerami et al, 2012; Gao et al, 2013; Lee et al, 2016). The bioinformatics analysis uncovered that the MIG‐6 gene (ERRFI1) is upregulated in basal‐like breast cancer (BLBC), a cancer subtype that largely overlaps with TNBC (Figs 1A and EV1A) (Kreike et al, 2007). Moreover, transcriptomic analyses of various genomic datasets, including the Servant (GSE30682) and Bertucci (GSE21653) sets (Sabatier et al, 2011; Servant et al, 2012), showed that MIG‐6 gene expression is more upregulated in TNBC/BLBC than in luminal A, luminal B, or HER2‐enriched subtypes (Figs 1B and EV1B). We next compared MIG‐6 protein expression in various breast cancer cell lines and found that the MIG‐6 protein is abundantly expressed in TNBC but not in other breast cancer subtypes (Fig 1C). To further assess the pathological relevance of MIG‐6 in TNBC, we examined the protein expression of MIG‐6 and its relationship to disease progression and survival outcomes in 85 TNBC cases (Fig EV1C, and Tables EV1 and EV2). Histological analyses demonstrated that MIG‐6 is overexpressed in high‐grade TNBCs (Fig 1D) and that MIG‐6 overexpression is significantly correlated with tumor stage increments (Fig 1E and Table EV1). Moreover, Kaplan–Meier analyses showed that MIG‐6 protein expression is inversely correlated with the overall and metastasis‐free survival of TNBC patients (Fig 1F and G, and Table EV2), indicating that MIG‐6 is a predictive biomarker for poor prognosis of TNBC.
Figure 1. MIG‐6 upregulation is positively correlated with disease progression and worse survival in TNBC patients.
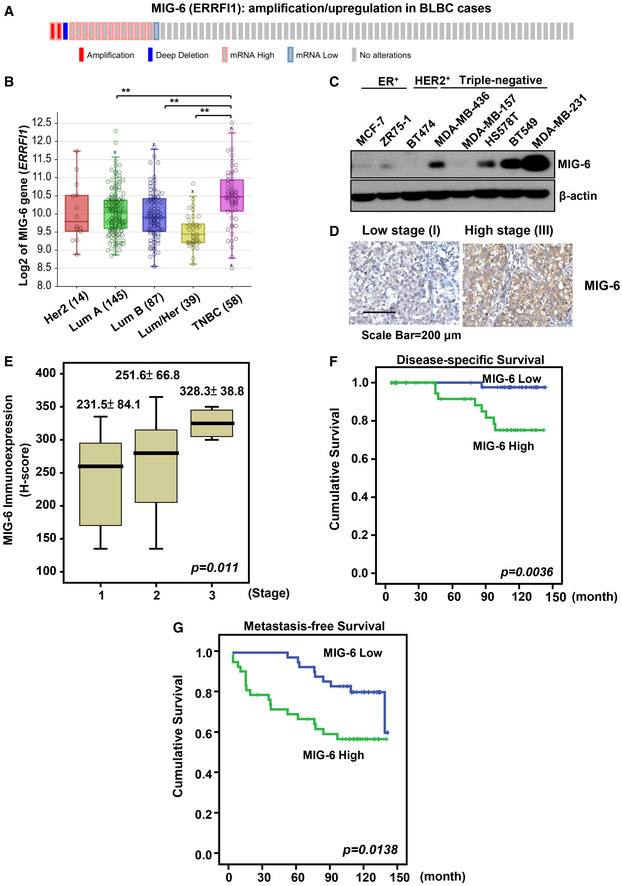
- cBioPortal was used to access and visualize TCGA data for MIG‐6 (ERRFI1) gene expression in 81 cases of invasive carcinoma of basal‐like breast cancer (The Cancer Genome Atlas Network, 2012). Each column represents an individual sample.
- Box plots show the MIG‐6 (ERRFI1) gene expression in different breast tumor subtypes in the Servant dataset of 343 primary breast cancer carcinomas, analyzed using Illumina HumanWG‐6_v3 Arrays. The gene expression levels are determined using the R2 Genomics Analysis and Visualization Platform (http://r2.amc.nl). In the box plot, error bars are the 95% confidence interval, the bottom and top of the box are the 25th and 75th percentiles, the line inside the box is the 50th percentile (median), and any outliers are shown as open circles. **P < 0.01, by Student’s t‐test.
- Immunoblotting analysis for MIG‐6 protein expression in various human breast cancer cell lines.
- Representative images of histological analyses of MIG‐6 in TNBC patients in low‐grade (stage I) and high‐grade (stage III) tumors. Scale bar, 200 µm.
- Quantification analysis of MIG‐6 expression in 85 cases of resected TNBCs. In the box plot, error bars are the 95% confidence interval, the bottom and top of the box are the 25th and 75th percentiles, the line inside the box is the 50th percentile (median). The P‐value 0.011 is used for the comparison of all three groups, determined by the Kruskal–Wallis H test.
- Kaplan–Meier plot analysis of the disease‐specific survival of 85 TNBC breast cancer patients with low or high expression of MIG‐6.
- Kaplan–Meier plot analysis of the metastasis‐specific survival of 85 TNBC patients with low or high expression of MIG‐6. MIG‐6 protein expression in the 85 TNBC specimens was determined by H‐score (please refer to “Immunohistochemistry and scoring” for details) and widely distributed. MIG‐6 expression greater than or equal to the median is classified as “high”, while expression less than the median is classified as “low”.
Figure EV1. Examination of MIG‐6 genetic alterations in different breast cancer subtypes.
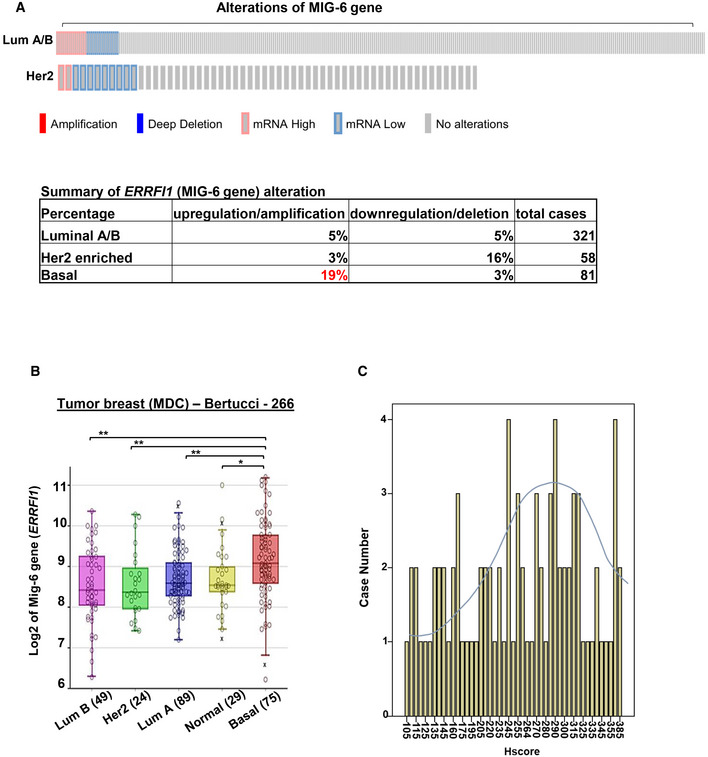
- cBioPortal was used to access and visualize TCGA data for MIG‐6 (ERRFI1) gene expression in 321 luminal and 58 HER2‐enriched breast cancer subtypes. Each column represents an individual sample. The table at the bottom summarizes the frequency (%) of genetic alterations of the MIG‐6 gene in different breast cancer subtypes.
- Box plots show the MIG‐6 (ERRFI1) gene expression in different breast tumor subtypes in the Bertucci dataset of 266 primary breast cancer carcinomas, analyzed using Illumina HumanWG‐6_v3 Arrays. The gene expression levels are determined using the R2 platform. In the box plot, error bars are the 95% confidence interval, the bottom and top of the box are the 25th and 75th percentiles, the line inside the box is the 50th percentile (median), and any outliers are shown as open circles. **P < 0.01, by Student’s t‐test.
- The bar graph shows the wide distribution of MIG‐6 protein expression across the 85 tumor samples used for IHC staining.
Depleting MIG‐6 protein expression suppresses TNBC cell growth
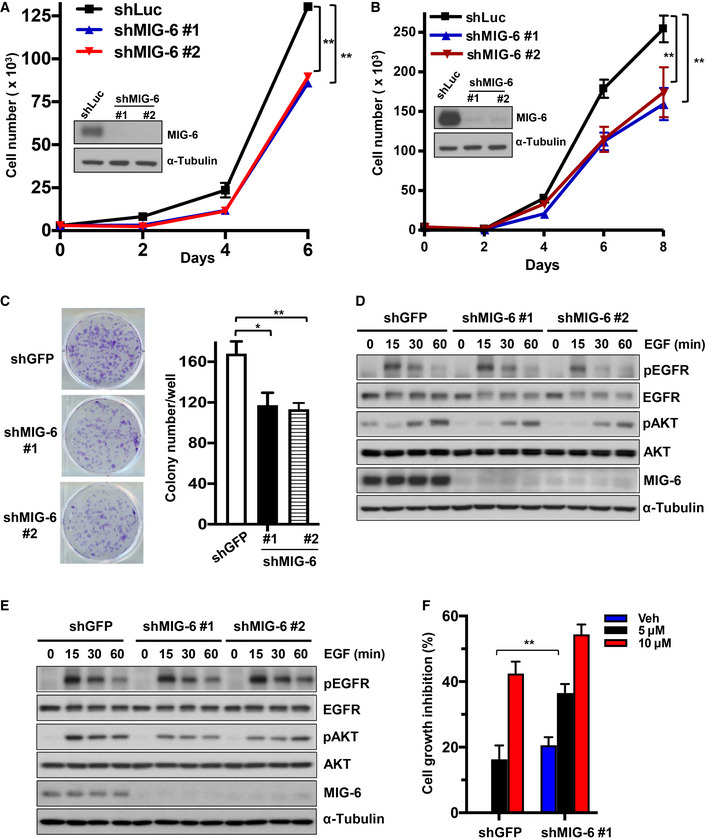
To determine the role of MIG‐6 in TNBC development, we depleted MIG‐6 expression in two TNBC cell models, BT549 and MDA‐MB‐231. We found that the genetic depletion of MIG‐6 suppressed the abilities of TNBC cells to grow and form colonies (Fig 2A–C), suggesting that MIG‐6 is a previously unrecognized molecular driver of TNBC. EGFR plays a critical role in cancer inhibition and growth (Haber et al, 2011; Lee et al, 2018). MIG‐6 executes its growth inhibitory and overall tumor‐suppressive functions by inhibiting EGFR and its downstream signaling pathways (Ferby et al, 2006; Zhang et al, 2007b; Hopkins et al, 2012). We thus investigated the impact of MIG‐6 on EGFR activation and signaling in TNBC cells. Intriguingly, MIG‐6 depletion did not change the phosphorylation of EGFR and the EGFR downstream signaling effector Akt in both BT549 and MDA‐MB‐231 cell lines (Fig 2D and E). These findings collectively demonstrate that the inhibitory role of MIG‐6 in EGFR signaling is mitigated in TNBC cells. Moreover, MIG‐6 knockdown further suppressed the growth of TNBC cells under gefitinib treatment (Fig 2F), suggesting that MIG‐6 regulates an EGFR‐independent mechanism to promote the growth of TNBC cells. Of note, we found that MIG‐6 knockdown in PC9 lung cancer cells, which harbor constitutively active EGFR, enhanced EGFR phosphorylation (Fig EV2A and B), illustrating that MIG‐6 suppresses EGFR activation in lung cancer, as anticipated. Moreover, MIG‐6 knockdown promoted the growth of PC9 cells (Fig EV2C), consistent with the previously reported tumor‐suppressive role of MIG‐6 in lung cancer (Zhang et al, 2007b; Li et al, 2014; Maity et al, 2015).
Figure 2. MIG‐6 deficiency suppresses the growth and colony formation of TNBC cells.
-
ACell proliferation and immunoblotting assays in BT549 cells with Luciferase or MIG‐6 knockdown.
-
BCell proliferation and immunoblotting assays in MDA‐MB‐231 cells with Luciferase or MIG‐6 knockdown.
-
CRepresentative images and quantification results for a colony formation assay in BT549 cells with GFP or MIG‐6 knockdown.
-
D, EImmunoblotting analysis for EGFR signaling in BT549 (D) and MDA‐MB‐231 (E) cells with GFP or MIG‐6 knockdown.
-
FCell growth assay in BT549 cells with GFP or MIG‐6 knockdown in the absence and presence of gefitinib for 72 h.
Data information: Two different MIG‐6‐targeting shRNAs were used in (A–E). The quantified results are presented as mean ± SD (n = 3; biological replicates). *P < 0.05, **P < 0.01, by Student’s t‐test.
Figure EV2. MIG‐6 deficiency promotes EGFR signaling and cell growth in lung cancer cells.
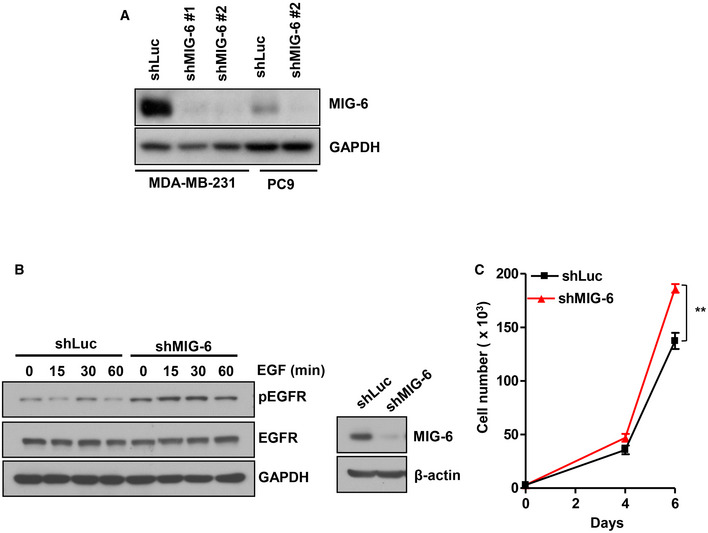
- Immunoblotting analysis for MIG‐6 expression in Luciferase and MIG‐6 knockdown MDA‐MB‐231 and PC9 cells.
- Immunoblotting analysis for phosphorylation and protein expression of EGFR in Luciferase and MIG‐6 knockdown PC9 cells. Cells were serum‐starved, treated with EGF for various time periods, and harvested for immunoblotting analysis.
- Cell proliferation and immunoblotting assays in Luciferase and MIG‐6 knockdown PC9 cells (n = 3). The quantified results are presented as mean ± SD. **P < 0.01, by Student’s t‐test.
MIG‐6 knockdown attenuates aerobic glycolysis in TNBC cells
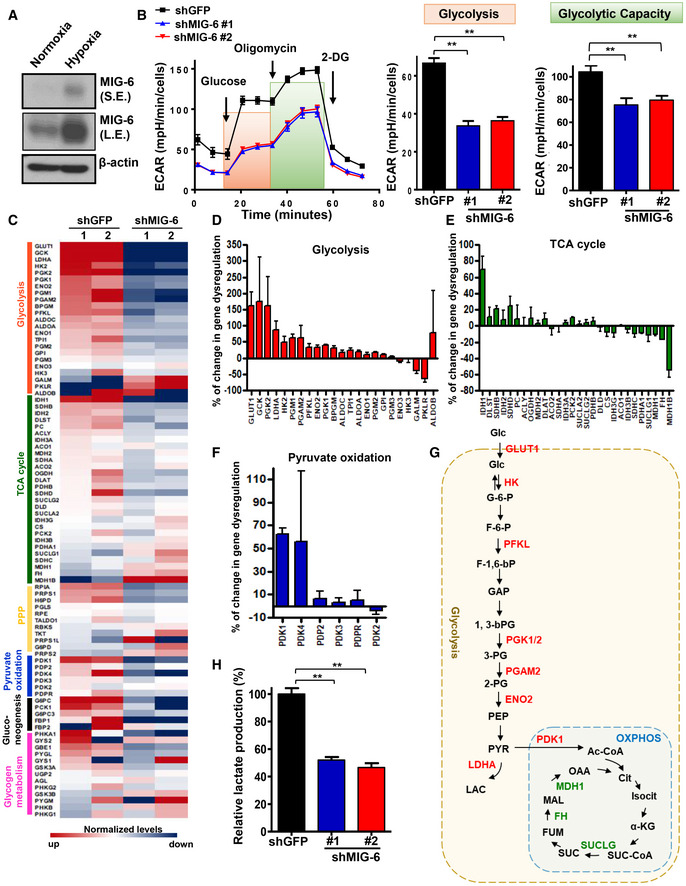
Aerobic glycolysis (also known as the Warburg effect) is a hallmark of cancer. It has been well‐established that proliferating cancer cells accelerate glucose uptake and glycolysis to meet their increased biosynthetic and bioenergetic demands (DeBerardinis & Chandel, 2016; Hay, 2016; Lee et al, 2019). We found that hypoxia, a pervasive environmental stimulus of glucose metabolic reprogramming, robustly induces MIG‐6 protein expression in BT549 and MDA‐MB‐231 cells (Figs 3A and EV3A). We thus sought to determine whether and how MIG‐6 regulates glucose metabolism. To elucidate the involvement of MIG‐6 in aerobic glycolysis and/or oxidative phosphorylation metabolism, we measured the extracellular acidification rate (an indicator of glycolysis) and the oxygen consumption rate (a readout for oxidative phosphorylation) of control and MIG‐6‐depleted BT549 cells using a Seahorse XF Analyzer. Our data showed that the MIG‐6 depletion in BT549 cells reduced both the basal and maximal capacities of glycolysis (Fig 3B). MIG‐6 deficiency did not alter oxidative phosphorylation in BT549 cells (Fig EV3, EV4, EV5).
Figure 3. MIG‐6 deficiency attenuates glucose metabolism and lactate production in TNBC cells.
-
AImmunoblotting analysis for MIG‐6 expression in BT549 cells under normoxia and hypoxia.
-
BExtracellular acidification rate (ECAR) in BT549 cells with GFP or MIG‐6 knockdown. The ECAR flux profile of GFP and MIG‐6 knockdown BT549 cells upon stimulation of glucose, oligomycin, and 2‐DG is shown on the left. Quantitative results for the basal glycolysis and maximal glycolytic capacities in GFP and MIG‐6 knockdown BT549 cells are indicated by orange and green boxes, graphed on the right. Results are presented as mean ± SEM (n = 15; biological replicates).
-
CA heatmap diagram shows the expression profile of genes involved in glycolysis, the TCA cycle, the pentose phosphate pathway, pyruvate oxidation, gluconeogenesis, and glycogen metabolism obtained from two sets of GFP and MIG‐6 knockdown BT549 cells.
-
D–FHistograms show the percentage of gene dysregulation in glycolysis, TCA cycle, and pyruvate oxidation pathways upon MIG‐6 knockdown in BT549 cells. For each gene, the change was calculated based on the equation: (shGFP‐shMIG6)/shMIG‐6. Results are presented as mean ± SEM (n = 3; biological replicates).
-
GSchematic illustration depicts the metabolic changes in the glycolytic pathway and oxidative phosphorylation (OXPHOS) regulated by MIG‐6. MIG‐6‐upregulated genes are indicated in red; MIG‐6‐downregulated genes are marked in green.
-
HLactate production assay in BT549 cells with GFP or MIG‐6 knockdown (n = 3). The medium was collected to measure lactate concentration using lactate test strips and an Accutrend Lactate analyzer. The rate of lactate production was determined (lactate production rate = lactate concentration/cells/time) and normalized to the rate detected in the control group. The quantified results are presented as mean ± SEM (n = 3; biological replicates).
Data information: In (B) and (H), **P < 0.01, by Student's t‐test.
Figure EV3. MIG‐6 reprograms glucose metabolism toward glycolysis.
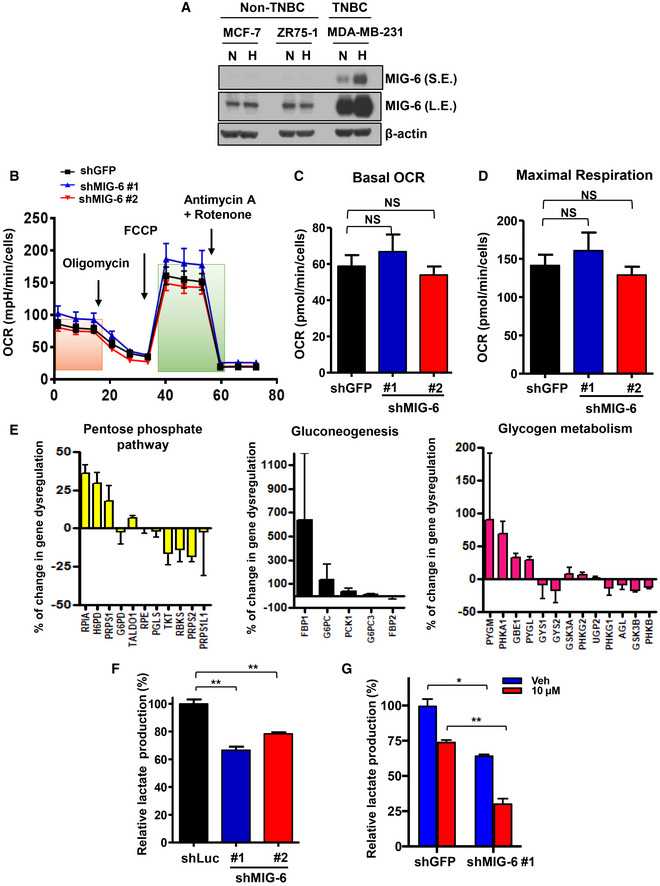
- Immunoblotting analysis for MIG‐6 expression in breast cancer cells under normoxia (N) and hypoxia (H).
- Oxygen consumption rate (OCR) in BT549 cells with GFP or MIG‐6 knockdown (n = 15; biological replicates).
- Quantitative results for basal OCR in the GFP and MIG‐6 knockdown BT549 cells indicated by the orange box in Fig EV3B (n = 15).
- Quantitative results for maximal OCR in the GFP and MIG‐6 knockdown BT549 cells indicated by the green box in Fig EV3B (n = 15).
- Histograms show the percentage of up/downregulated genes in the pentose phosphate pathways (left), gluconeogenesis (middle), and glycogen metabolism pathways (right) whose expressions were affected by MIG‐6 knockdown in BT549 cells. For each gene, the change was calculated based on the equation: (shGFP‐shMIG6)/shMIG‐6 (n = 3).
- Lactate production assay in MDA‐MB‐231 cells with Luciferase or MIG‐6 knockdown (n = 3).
- Lactate production assay in GFP and MIG‐6 knockdown BT549 cells with or without gefitinib treatment for 72 h (n = 3).
Data information: The quantified results are presented as mean ± SEM. *P < 0.05, **P < 0.01, by Student’s t‐test.
Figure EV4. MIG‐6 depletion reduces the expression of GLUT1.
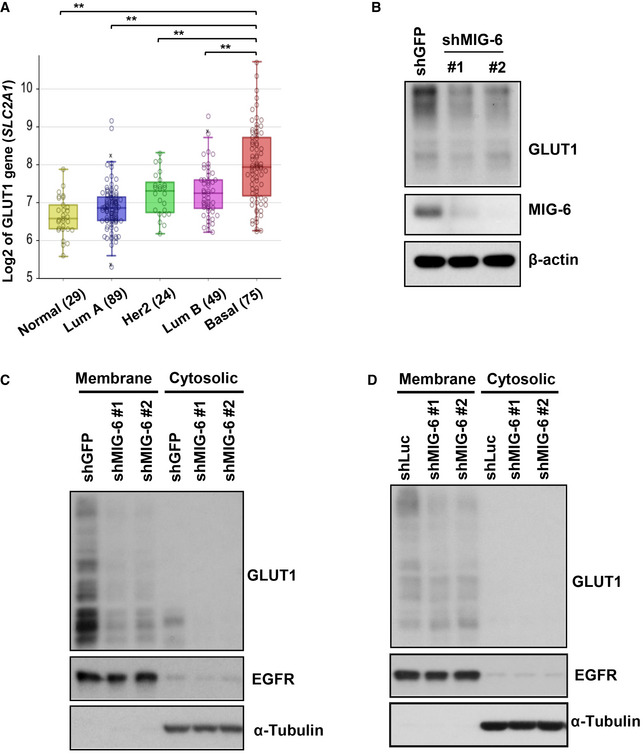
- Box plots show the GLUT1 (SLC2A1) gene expression in different breast tumor subtypes in the Bertucci dataset of 266 primary breast cancer carcinomas, analyzed using Illumina HumanWG‐6_v3 Arrays. The gene expression levels are determined using the R2 platform. In the box plot, error bars are the 95% confidence interval, the bottom and top of the box are the 25th and 75th percentiles, the line inside the box is the 50th percentile (median), and any outliers are shown as open circles. **P < 0.01, by Student’s t‐test.
- Immunoblotting analysis for GLUT1 protein expression in MDA‐MB‐231 cells with GFP or MIG‐6 knockdown.
- Immunoblotting analysis for GLUT1 expression in the membrane and cytosolic fractions in BT549 cells with GFP or MIG‐6 knockdown. EGFR and α‐Tubulin served as markers for membrane and cytosolic fractions, respectively.
- Immunoblotting analysis for GLUT1 expression in the membrane and cytosolic fractions of MDA‐MB‐231 cells with Luciferase or MIG‐6 knockdown.
Figure EV5. Characterization of the mechanism by which MIG‐6 regulates GLUT1 expression.
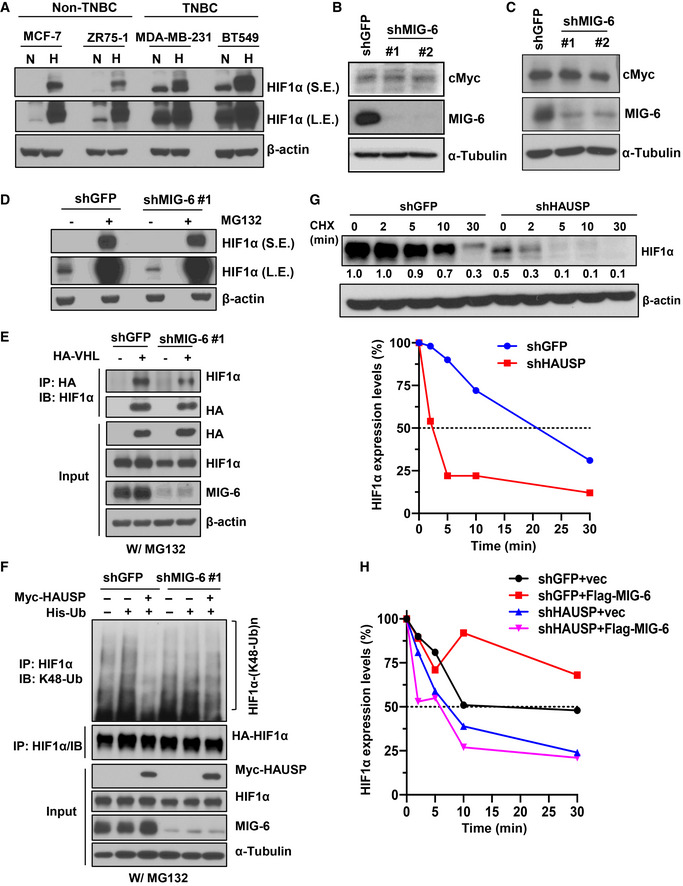
- Immunoblotting analysis for HIF1α expression in various breast cancer cells under normoxia (N) and hypoxia (H).
- Immunoblotting analysis for cMyc protein expression in BT549 cells with GFP or MIG‐6 knockdown.
- Immunoblotting analysis for cMyc protein expression in MDA‐MB‐231 cells with GFP or MIG‐6 knockdown.
- Immunoblotting analysis for HIF1α expression in response to MG132 treatment in BT549 cells with GFP or MIG‐6 knockdown.
- GFP and MIG‐6 knockdown BT549 cells transfected with the indicated plasmids were treated with MG132, subjected to immunoprecipitation with the HA‐tag antibody, followed by immunoblotting analysis.
- Luciferase and MIG‐6 knockdown BT549 cells were transfected with the indicated plasmids and subjected to MG132 treatment. Afterward, cells were harvested for IP with the HIF1α antibody, followed by immunoblotting analysis to determine the level of K48‐linked ubiquitination of HIF1α.
- The upper panel shows an immunoblotting analysis for the half‐life of the HIF1α protein in BT549 cells with GFP or HAUSP knockdown upon cycloheximide (CHX) treatment. The relative intensities of HIF1α protein expression are quantified by ImageJ software and normalized to that in shGFP cells without CHX. The lower panel shows the quantitative results for the half‐life of the HIF1α protein in BT549 cells with GFP or HAUSP knockdown. The relative intensities of HIF1α protein expression quantified by ImageJ software are normalized to that in shGFP or shHAUSP cells without CHX treatment. The dotted line indicates 50% abundance of HIF1α, and the half‐life (t 1/2) HIF1α protein.
- Quantitative result for the half‐life of the HIF1α protein upon MIG‐6 overexpression in BT549 cells with GFP or HAUSP knockdown upon CHX treatment. The relative intensities of HIF1α protein expression quantified by ImageJ software are normalized to that in each group without CHX treatment. The dotted line indicates 50% abundance of HIF1α, and the half‐life (t 1/2) HIF1α protein.
To gain a comprehensive insight into how MIG‐6 regulates cancer metabolism, we profiled the expression of metabolic genes involved in glycolysis, the pentose phosphate pathway (PPP), gluconeogenesis, and glycogen metabolism pathways in control and MIG‐6 knockdown BT549 cells. Systematic analyses of metabolism real‐time PCR arrays and a panel of glucose metabolism regulatory genes demonstrated that MIG‐6 deficiency inhibits several glycolytic genes, including GLUT1, HK2, PFK, PGK1/2, PGAM2, ENO2, and LDHA, whereas MIG‐6 deficiency promotes TCA cycle‐regulating genes, including MDH1B, FH, and SUCLG1 (Figs 3C–E and EV3E, and Table EV3). Of note, MIG‐6 depletion reduced the gene expression of the glycolysis gatekeeper PDK1 (Fig 3F) (Dupuy et al, 2015), suggesting that MIG‐6 orchestrates the metabolic shift from pyruvate oxidation via the TCA cycle toward lactate production via glycolysis. Wild‐type IDH1 catalyzes the reversible oxidative decarboxylation of isocitrate to α‐ketoglutarate in the cytoplasm, redirecting carbon metabolites away from the TCA cycle (Molenaar et al, 2018). Additionally, a recent study showed that wild‐type IDH2 enhances glycolysis by lowering the intracellular level of α‐ketoglutarate (Li et al, 2018). Our data that the IDH1/2 genes are downregulated by MIG‐6 knockdown in BT549 cells (Fig 3C and E) imply that MIG‐6 overexpression confers glycolytic features to TNBC. These findings together underscore MIG‐6’s crucial role in reprogramming glucose metabolism toward aerobic glycolysis (Fig 3G). We next utilized lactate test strips to directly measure the concentration of lactate, a readout of aerobic glycolysis. We found that MIG‐6 depletion significantly suppressed the lactate production in both BT549 and MDA‐MB‐231 cells (Figs 3H and EV3F), verifying the importance of MIG‐6 in promoting aerobic glycolysis in TNBC cells. Additionally, MIG‐6 knockdown further reduced lactate production in the presence of gefitinib (Fig EV3G), suggesting that MIG‐6’s effect on glucose metabolism in TNBC cells is not mediated by the EGFR pathway.
MIG‐6 regulates GLUT1 expression and glucose uptake
Glucose uptake is mediated by glucose transporters (GLUTs). Among all the mammalian GLUTs, GLUT1 is the most frequently overexpressed in many types of human cancers, including breast cancer (Young et al, 2011). A comprehensive meta‐analysis of 4,079 patients indicated that overexpression of GLUT1 is associated with worse patient survival (Yu et al, 2017). Previous studies by others and by us demonstrated that breast tumors overexpress GLUT1 to facilitate glucose uptake and subsequent glycolysis (Kang et al, 2002; Hussein et al, 2011; Chan et al, 2012). In light of our metabolic gene screening finding that MIG‐6 regulates GLUT1 gene expression, we examined GLUT1 expression in different breast cancer subtypes using two public microarray datasets (GSE30682 and GSE21653). Similar to the MIG‐6 gene expression profiles (Figs 1B and EV1B), gene expression of GLUT1 is significantly increased in TNBC compared with other subtypes (Figs 4A and EV4A). Real‐time PCR analysis confirmed that MIG‐6 deficiency mitigates GLUT1 mRNA expression in BT549 cells (Fig 4B). We next explored the relationship between MIG‐6 and GLUT1 at the protein expression level and found that MIG‐6 depletion markedly reduces GLUT1 protein expression in both BT549 and MDA‐MB‐231 TNBC cell models (Figs 4C and EV4B). GLUT1 is predominantly localized in the plasma membrane for glucose uptake. Immunofluorescence and biochemical fraction assays demonstrated that while the majority of GLUT1 is present in the plasma membrane of BT549 cells, knocking down MIG‐6 in BT549 cells mitigated the level of membrane‐bound GLUT1 (Figs 4D and Fig EV4C). Likewise, MIG‐6 deficiency reduced the expression of membrane‐bound GLUT1 in MDA‐MB‐231 cells (Fig EV4D). The observed reduction in membrane‐bound GLUT1 driven by MIG‐6 knockdown was not accompanied by GLUT1 retention in the cytosol (Figs 4D, and EV4C and D), suggesting that MIG‐6’s effect on membrane‐localized GLUT1 is due to a reduction in Glut1 gene expression.
Figure 4. MIG‐6 deficiency inhibits GLUT1 expression and glucose uptake in TNBC cells.
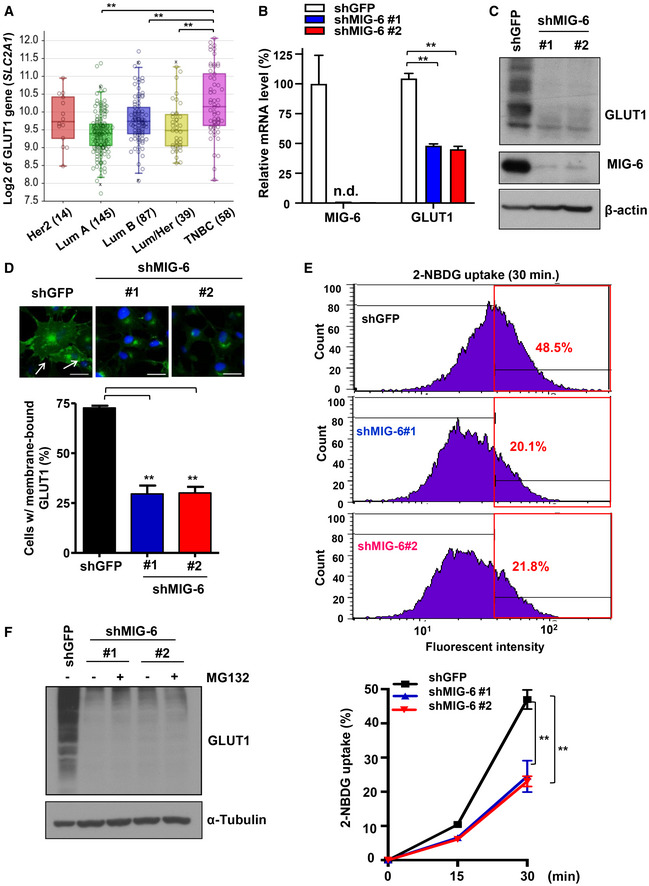
- Box plots show the GLUT1 (SLC2A1) gene expression in different breast tumor subtypes in the Servant dataset of 343 primary breast cancer carcinomas, analyzed using Illumina HumanWG‐6_v3 Arrays. The gene expression levels are determined using the R2 platform. In the box plot, error bars are the 95% confidence interval, the bottom and top of the box are the 25th and 75th percentiles, the line inside the box is the 50th percentile (median), and any outliers are shown as open circles. **P < 0.01, by Student's t‐test.
- Real‐time PCR analysis for GLUT1 and MIG‐6 mRNA expression in GFP and MIG‐6 knockdown BT549 cells (n = 3).
- Immunoblotting analysis for GLUT1 protein expression in BT549 cells with GFP or MIG‐6 knockdown.
- Confocal image analysis results for membrane‐bound GLUT1 in GFP and MIG‐6 knockdown BT549 cells are shown in the top panel. The arrow indicates membrane‐localized GLUT1. Scale bar, 25 μm. Quantitative analysis results of the percentage of GFP and MIG‐6 knockdown BT549 cells expressing membrane‐localized GLUT1 are shown in the bottom panel (n = 3).
- Representative flow cytometry images (upper) and quantitative results (lower) of measuring glucose uptake in GFP and MIG‐6 knockdown BT549 cells (n = 3). Cells were grown in the presence of the fluorescent analog 2‐NBDG for various time periods, and glucose uptake was quantified using flow cytometric analysis. The red box indicates the gating for 2‐NBDG+ cells, and the number indicates the percentage of 2‐NBDG+ cells.
- Immunoblotting analysis for GLUT1 protein expression in GFP and MIG‐6 knockdown BT549 cells with or without MG132 treatment.
Data information: In (B, D, and E), the quantified results are presented as mean ± SD (n = 3). **P < 0.01, by Student's t‐test.
2‐NBDG is a fluorescent glucose analog that is widely used to measure direct glucose uptake in live cells. We found that while 2‐NBDG uptake rapidly increased in BT549 cells at various time points as anticipated, MIG‐6 depletion attenuated the 2‐NBDG uptake in BT549 cells (Fig 4E). To further examine whether MIG‐6 regulates GLUT1 post‐transcriptionally, we analyzed the protein stability of GLUT1 in control and MIG‐6 knockdown cells. We found that GLUT1 protein downregulation was not rescued by the proteasome inhibitor MG132 (Fig 4F). These findings together suggest that MIG‐6 regulates GLUT1 expression and function by promoting transcription of the GLUT1 gene.
MIG‐6 regulates aerobic glycolysis and cell growth through HIF1α‐driven gene transcription of GLUT1
GLUT1 gene transcription can be enhanced by two transcription factors: HIF1α and Myc (Osthus et al, 2000; Chen et al, 2001). To dissect which transcription factor is involved in MIG‐6‐regulated GLUT1 gene expression, we examined HIF1α and Myc expression in control and MIG‐6 knockdown cells (Fig 5A). We found that TNBC cells express a high level of HIF1α protein under normoxic conditions (Fig EV5A), as reported previously (Briggs et al, 2016). HIF1α protein expression is significantly higher in TNBC than in non‐TNBC cells (Fig EV5A). Immunoblotting analyses demonstrated that HIF1α protein is downregulated in MIG‐6 knockdown BT549 and MDA‐MB‐231 cells (Fig 5B and C). In contrast, protein expression of Myc in both TNBC cell models remained unchanged upon MIG‐6 knockdown (Fig EV5B and C). To further elucidate the mechanism by which MIG‐6 regulates HIF1α expression, we analyzed the gene expression and protein stability of HIF1α in response to MIG‐6 depletion. Real‐time PCR analysis illustrated that MIG‐6 knockdown did not reduce the HIF1α mRNA level (Fig 5D). Moreover, the HIF1α protein reduction resulting from MIG‐6 knockdown was rescued by MG132 treatment (Figs 5E and EV5D), suggesting that MIG‐6 stabilizes the HIF1α protein by preventing proteasome‐mediated protein degradation. HIF1α is a master regulator of cellular responses to hypoxia (Majmundar et al, 2010). Under normoxia, HIF1α binds to von Hippel‐Lindau tumor‐suppressor protein (VHL), a substrate recognition component of an E3 ubiquitin ligase complex that triggers ubiquitination‐mediated proteasomal degradation of HIF1α (Ivan et al, 2001; Jaakkola et al, 2001). To determine the mechanism by which MIG‐6 stabilizes HIF1α, we examined the impact of MIG‐6 on the interaction between VHL and HIF1α using a co‐immunoprecipitation assay. We found that MIG‐6 knockdown did not increase the formation of the VHL/HIF1α complex (Fig EV5E). A recent study by Wu et al (2016) reported that HAUSP (USP7) deubiquitinase interacts with and increases HIF1α protein stability. Our co‐immunoprecipitation assay showed that MIG‐6 deficiency in BT549 cells reduced the binding between HAUSP and HIF1α (Fig 5F). Using a K48 linkage‐specific polyubiquitin antibody, we found that HAUSP removed the K48‐linked ubiquitination of HIF1α and that this deubiquitination process was mitigated upon MIG‐6 knockdown (Figs 5G and H, and EV5F). Moreover, HAUSP knockdown reduced HIF1α stability (Fig EV5G). Additionally, we found that MIG‐6 overexpression increased the half‐life of the HIF1α protein in GFP‐ but not HAUSP knockdown cells (Fig EV5H). Furthermore, MIG‐6 overexpression promoted GLUT1 expression, and this effect depended on the expression of HIF1α and HAUSP (Fig 5I and J). HAUSP overexpression promoted HIF1α protein expression, and MIG‐6 knockdown attenuated the effect (Fig 5K). These findings together underscore that MIG‐6 facilitates HAUSP interaction with HIF1α, promoting the deubiquitination and subsequent stabilization of HIF1α in TNBC.
Figure 5. MIG‐6 regulates GLUT1 gene expression by stabilizing HIF1α protein expression.
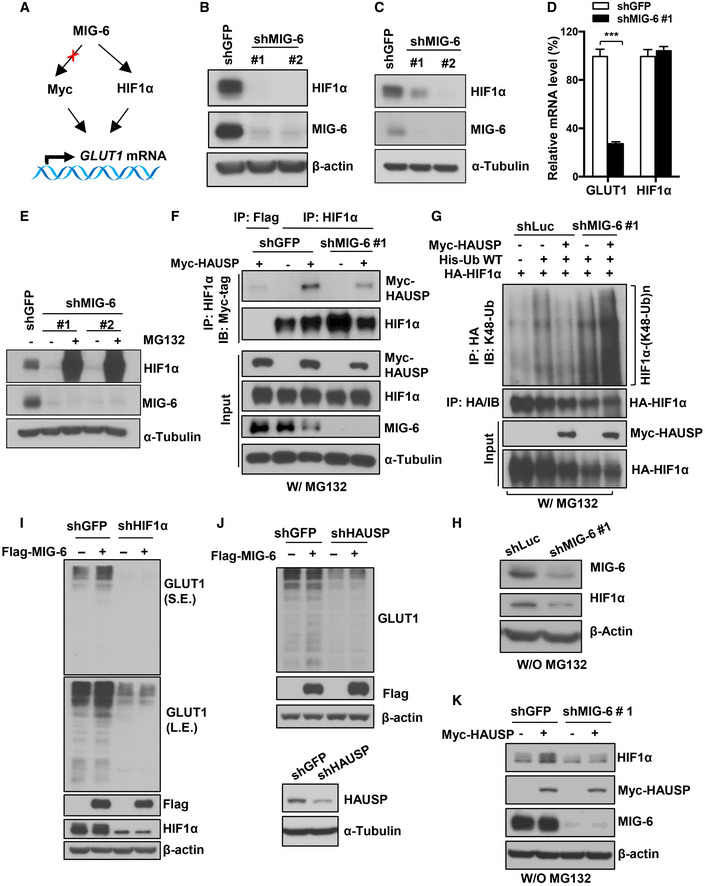
- Schematic illustration of the potential mechanisms by which MIG‐6 regulates GLUT1 gene expression.
- Immunoblotting analysis for HIF1α protein expression in BT549 cells with GFP or MIG‐6 knockdown.
- Immunoblotting analysis for HIF1α protein expression in MDA‐MB‐231 cells with GFP or MIG‐6 knockdown.
- Real‐time PCR analysis for HIF1α mRNA expression in BT549 cells with GFP or MIG‐6 knockdown. The quantified results are presented as mean ± SD (n = 4). ***P < 0.001, by Student's t‐test.
- Immunoblotting analysis for HIF1α protein expression in GFP and MIG‐6 knockdown BT549 cells in the absence or presence of the proteasome inhibitor MG132.
- GFP and MIG‐6 knockdown BT549 cells transfected with the indicated plasmids were treated with MG132, subjected to immunoprecipitation (IP) with Flag‐tag or HIF1α antibody, followed by immunoblotting analysis. MG132 was used to rescue HIF1α protein degradation mediated by MIG‐6 knockdown, leading to similar HIF1α protein levels in control and MIG‐6 knockdown BT549 cells, which were used as the input to examine the role of MIG‐6 in the interaction between HIF1α and HAUSP.
- Luciferase and MIG‐6 knockdown 293 cells were transfected with the indicated plasmids and subjected to MG132 treatment. Afterward, cells were harvested for IP with HA antibody, followed by immunoblotting analysis to determine the level of K48‐linked ubiquitination of HIF1α. MG132 was used to preserve the degradative K48‐linked ubiquitination signals.
- Immunoblotting analysis for MIG‐6 and HIF1α expression in Luciferase and MIG‐6 knockdown 293 without MG132 treatment.
- Immunoblotting analysis for GLUT1 protein expression upon MIG‐6 overexpression in GFP and HIF1α knockdown BT549 cells.
- Immunoblotting analysis for GLUT1 protein expression upon MIG‐6 overexpression in GFP and HAUSP knockdown BT549 cells.
- Immunoblotting analysis for HIF1α protein expression upon HAUSP overexpression in GFP and MIG‐6 knockdown BT549 cells.
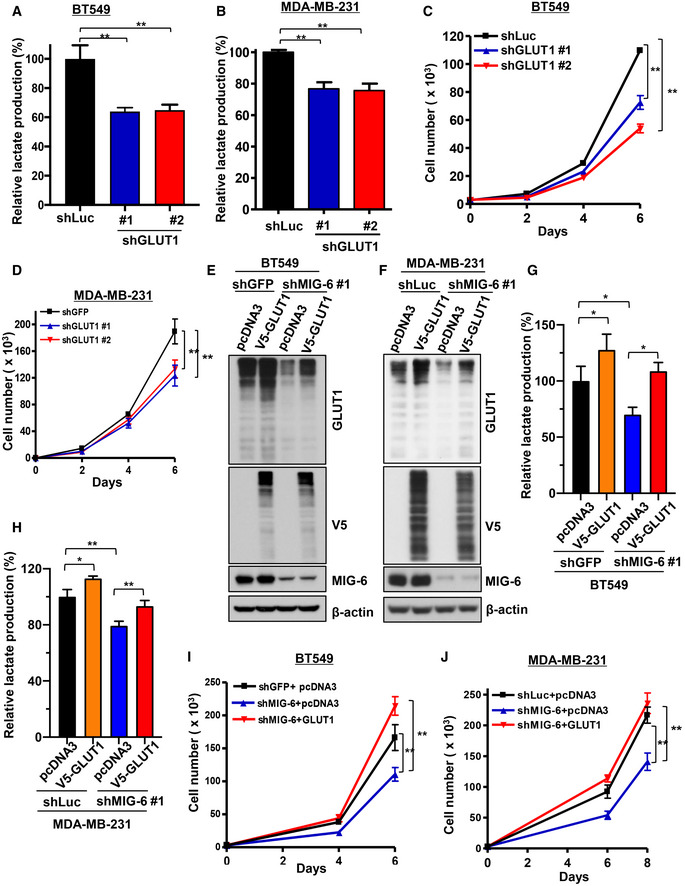
Based on our metabolic gene screening, GLUT1 is among the most downregulated glucose metabolic genes affected by MIG‐6 knockdown (Fig 3C and D). GLUT1, which mediates the flux of glucose into metabolic pathways, is a gatekeeper of glucose metabolism. Indeed, GLUT1 knockdown suppressed aerobic glycolysis and the growth on both BT549 and MDA‐MB‐231 cells (Fig 6A–D), recapitulating the effects regulated by MIG‐6 downregulation. To determine whether glucose metabolism accounts for the tumor‐promoting function of MIG‐6, we restored glucose metabolism in MIG‐6 knockdown cells by GLUT1 re‐expression. Immunoblotting analyses showed that GLUT1 overexpression successfully restored the GLUT1 downregulation observed in MIG‐6 knockdown BT549 and MDA‐MB‐231 cells (Fig 6E and F). Importantly, GLUT1 overexpression fully rescued the functional defects in aerobic glycolysis and cellular growth caused by MIG‐6 depletion (Fig 6G–J).
Figure 6. MIG‐6 regulates aerobic glycolysis and cell growth through GLUT1.
-
A, BLactate production assay in BT549 (A) and MDA‐MB‐231 (B) cells with Luciferase or GLUT1 knockdown.
-
CCell proliferation assay in BT549 cells with Luciferase or GLUT1 knockdown.
-
DCell proliferation assay in MDA‐MB‐231 cells with GFP or GLUT1 knockdown.
-
E, FImmunoblotting analysis for GLUT1 protein expression in control and MIG‐6 knockdown BT549 (E) and MDA‐MB‐231 (F) cells with or without GLUT1 overexpression.
-
G, HLactate production assay in control and MIG‐6 knockdown BT549 (G) and MDA‐MB‐231 (H) cells with or without GLUT1 overexpression.
-
I, JCell proliferation assay in BT549 (I) and MDA‐MB‐231 (J) cells with control knockdown, MIG‐6 knockdown, or MIG‐6 knockdown plus GLUT1 overexpression.
Data information: The quantified results are presented as mean ± SD (n = 3; biological replicates). *P < 0.05, **P < 0.01, by Student's t‐test.
MIG‐6 regulates tumorigenesis and in vivo GLUT1 expression in TNBC
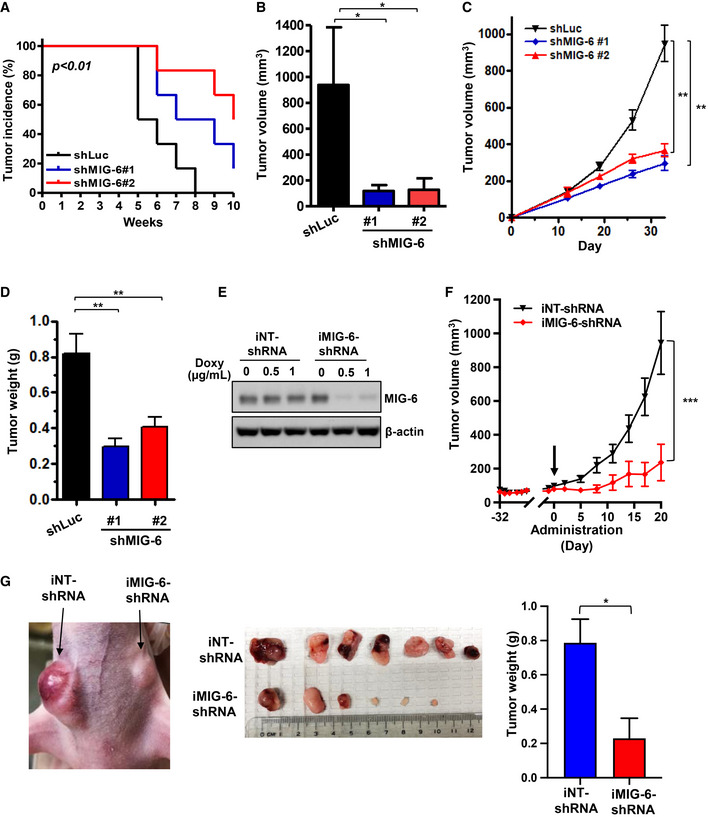
We next carried out tumor xenograft assays to determine whether MIG‐6 drives TNBC development in vivo. A tumor growth assay demonstrated that genetic targeting of MIG‐6 expression delayed the initiation and subsequent growth of BT549‐derived xenograft tumors (Fig 7A and B). Likewise, MIG‐6 deficiency inhibited the growth of MDA‐MB‐231‐derived TNBC (Fig 7C and D). To evaluate the function of MIG‐6 in maintaining tumor growth in vivo, we used a doxycycline‐inducible MIG‐6 shRNA knockdown system in BT549 cells. We first confirmed that doxycycline induced effective MIG‐6 knockdown in BT549 cells with inducible MIG‐6 shRNA but not the non‐targeting shRNA (Fig 7E). These cells were then orthotopically injected into two sides of the mammary glands of the nude mice to monitor tumor growth and progression. When the tumors reached ~ 80–100 mm3, mice were fed doxycycline chow continuously. We showed that doxycycline‐inducible MIG‐6 knockdown suppressed the growth of established TNBC in vivo (Fig 7F and G). These findings collectively underscore an essential role of MIG‐6 in tumor initiation and growth in TNBC.
Figure 7. MIG‐6 deficiency inhibits tumor growth in TNBC.
-
A, BIn vivo primary tumor growth derived from BT549 cells with Luciferase or MIG‐6 knockdown (six mice per group). Cells were injected into the mammary fat pads of nude mice, and tumor sizes were measured weekly by caliper. Kaplan–Meier plot analysis is used to determine the incidence of Luciferase or MIG‐6 knockdown BT549‐xenograft tumors (A). Volumes of Luciferase or MIG‐6 knockdown BT549 tumors at week 10 are presented as mean ± SEM (B).
-
C, DIn vivo primary tumor growth derived from MDA‐MB‐231 cells with Luciferase or MIG‐6 knockdown (nine mice per group). Volumes of Luciferase or MIG‐6 knockdown MDA‐MB‐231 tumors were measured weekly by caliper are presented as mean ± SEM (C). Tumor weights of MDA‐MB‐231‐derived xenografts were measured at the endpoint (day 33) and are presented as mean ± SEM (D).
-
EImmunoblotting analysis for MIG‐6 expression in BT549 cells with MIG‐6 inducible knockdown (iMIG‐6‐shRNA) and the non‐targeting shRNA control (iNT‐shRNA) upon doxycycline treatment.
-
FIn vivo primary tumor growth derived from BT549 cells containing iNT‐shRNA and iMIG‐6‐shRNA (n = 7 per group). The arrow indicates the time point when the diet was given to induce MIG‐6 knockdown in vivo. Volumes of iNT‐shRNA and iMIG‐6‐shRNA BT549 tumors are presented as mean ± SEM.
-
GRepresentative images for tumor growth and quantitative results for tumor weight at the experimental endpoint (seven mice per group). Results are presented as mean ± SEM.
Data information: *P < 0.05, **P < 0.01, ***P < 0.001, by Student's t‐test.
Having shown the critical role of MIG‐6 in promoting GLUT1 expression and GLUT1 functions in glycolysis and cell growth in vitro, we further examined the impact of MIG‐6 on GLUT1 expression in vivo. Immunohistochemistry staining results illustrated that MIG‐6 deficiency downregulated GLUT1 protein expression in BT549‐derived xenograft tumors (Fig 8A and B), implying that glucose uptake and glycolysis in TNBC are attenuated upon MIG‐6 depletion in vivo. We assessed the clinical relationship between MIG‐6 and GLUT1 by analyzing the protein expressions of MIG‐6 and GLUT1 in 85 cases of TNBC. Histopathological analyses showed that MIG‐6 protein expression is significantly correlated with GLUT1 protein expression in TNBC (Fig 8C and D, and Table EV1). Additionally, we utilized the R2 bioinformatics tool to interrogate whether the correlation between MIG‐6 and GLUT1 also occurs at the mRNA level. The transcriptomic analysis revealed that MIG‐6 is positively correlated with GLUT1 at the mRNA level in BLBC/TNBC (Appendix Fig S1). Besides, a multiplex immunofluorescence assay was carried out to examine the subcellular localization of MIG‐6 and its potential colocalization with HIF1α in TNBC specimens. Our data showed positive immunostaining of MIG‐6 and HIF1α proteins in the nucleus and the cytoplasm and that MIG‐6 and HIF1α were co‐localized in both cellular compartments in vivo (Fig 8E). Notably, most TNBC tissues exhibit strong colocalization between MIG‐6 and HIF1α protein expression (Appendix Fig S2). These findings together illustrate the importance of MIG‐6 in regulating tumor development and glycolysis in TNBC and suggest that disrupting glycolysis by targeting MIG‐6 is a novel therapeutic avenue to treat this deadly disease.
Figure 8. MIG‐6 deficiency inhibits GLUT1 protein expression in vivo .
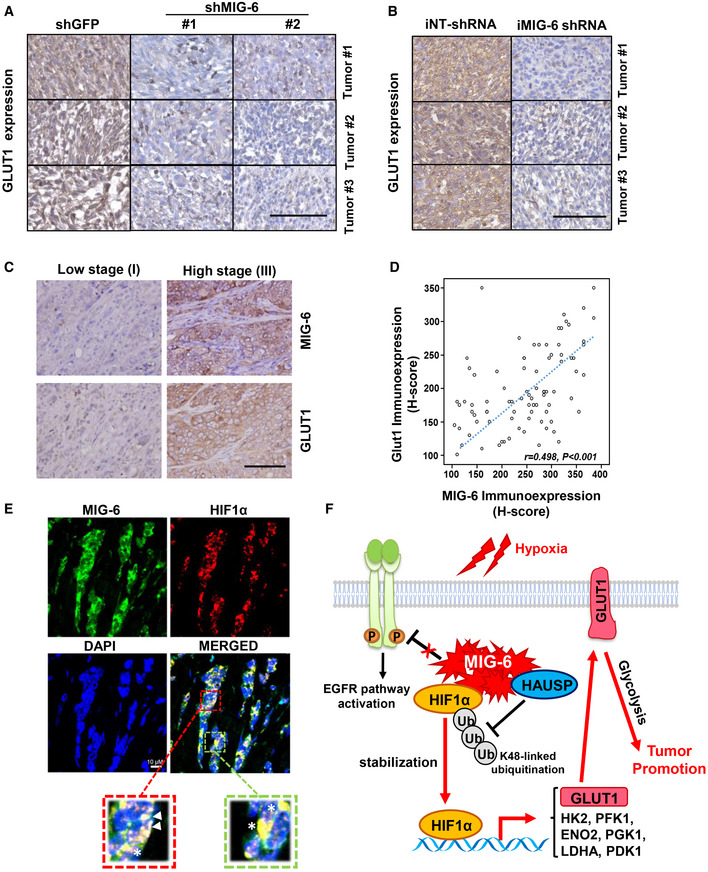
- Representative images of histological analysis for GLUT1 protein expression in BT549‐derived xenograft tumors. Scale bar, 100 μm.
- Representative images of histological analysis for GLUT1 protein expression in xenograft tumors derived from BT549 cells containing iNT‐shRNA and iMIG‐6‐shRNA. Scale bar, 100 μm.
- Representative images of histological analyses for GLUT1 and MIG‐6 expressions in TNBC patients in low‐grade (stage I) and high‐grade (stage III) tumors Scale bar, 200 µm.
- Scatterplot analysis for the correlation between GLUT1 and MIG‐6 expression levels (n = 85). The r value was calculated by Spearman’s rank correlation coefficient analysis.
- Representative images of the immunofluorescence multiplex assay for colocalization of MIG‐6 and HIF1α protein expression in TNBC tumor specimens. The triangle indicates nuclear colocalization, and the star indicates cytoplasmic colocalization.
- A working model depicts the mechanism by which MIG‐6 exerts its tumor‐promoting function in TNBC. MIG‐6 overexpression promotes HIF1α stabilization and the subsequent upregulation of GLUT1 gene transcription, metabolic reprogramming, and tumorigenesis.
Discussion
MIG‐6 is a multi‐adapter protein best known for its interaction and negative regulation of EGFR. MIG‐6‐deficient mice display hyperactivated EGFR signaling and skin hyperplasia and are highly susceptible to tumor formation in the skin, lungs, and other tissues. Besides EGFR inhibition, MIG‐6 integrates and fine‐tunes various signal transduction pathways, leading to diverse pathophysiological outcomes. Hopkins et al (2012) showed that MIG‐6 binds to and activates c‐Abl kinase to trigger apoptosis. Izumchenko et al compared multiple erlotinib‐resistant cancer cell lines of different tissue origins (head and neck, lung, and bladder) with their paired erlotinib‐sensitive lines and showed that MIG‐6 expression is considerably higher in the erlotinib‐resistant lines. The observed MIG‐6 upregulation in the erlotinib‐resistant cells was associated with a concomitant decrease in EGFR activity and activation of Akt (Izumchenko et al, 2014). These studies suggest that MIG‐6 exhibits paradoxical roles in different tumor contexts. MIG‐6 appears to act as a tumor suppressor in lung cancer and glioblastoma, in which constitutive active forms of EGFR drive tumor development (Ying et al, 2010; Maity et al, 2015). MIG‐6 is genetically mutated or transcriptionally silenced in lung cancer and glioblastoma. However, the loss‐of‐function mutations in MIG‐6 are not prevalent in breast cancer; thus, further investigation into MIG‐6 abnormalities and their subsequent biological consequences in different cancer types is needed. In the current study, we showed that MIG‐6 gene expression is significantly upregulated in TNBC. Moreover, MIG‐6 protein expression was robustly elevated in TNBC compared with other breast and lung cancer subtypes. Our histological studies revealed that MIG‐6 is positively correlated with the pathogenesis of human cancer and that MIG‐6 is a significant prognostic marker of aggressiveness and clinical outcomes in TNBC. We showed that MIG‐6 stabilizes HIF1α protein expression and orchestrates HIF1α‐directed metabolic reprogramming toward glycolysis, which includes the transcription of GLUT1 and other HIF1α target genes. Furthermore, genetic targeting of MIG‐6 inhibited glycolysis and subsequent tumor growth in vivo (Fig 8F). Our study, for the first time, reports that MIG‐6 depletion attenuates glucose metabolism and tumor growth in TNBC, uncovering a previously under‐recognized prosurvival role of MIG‐6 in cancer.
Our results indicate that MIG‐6 depletion does not promote EGFR signaling in TNBC, in which tumor tissues express wild‐type EGFR. MIG‐6 interacts with EGFR via its ErbB‐binding region in the C terminus. Two segments within the ErbB‐binding region have been shown to orchestrate MIG‐6’s inhibition of EGFR (Anastasi et al, 2007). The crystal structure of MIG‐6 segment 1 (residues 336–364) in complex with EGFR shows that segment 1 mediates the binding to EGFR and can partially inhibit EGFR by blocking the formation of the activating EGFR receptor dimer (Zhang et al, 2007a). Functional studies have shown that the inclusion of segment 2 (residues 365–412) is required for MIG‐6’s full inhibition of EGFR. This inhibitory activity of MIG‐6 is coordinated by EGFR‐driven Y394 phosphorylation of MIG‐6, primed by the prior Y395 phosphorylation by Src (Park et al, 2015). Park et al’s (2015) study of the crystal structures of the MIG‐6 segment 2‐EGFR complex further demonstrated that once MIG‐6 is phosphorylated at Y394, MIG‐6 rearranges to form a hairpin‐like structure that blocks the peptide substrate‐binding site of EGFR. Their study provides clear evidence that MIG‐6 is an activity‐based inhibitor of EGFR and that EGFR‐mediated Y394 phosphorylation dictates the selectivity of MIG‐6 for the activated EGFR. In line with these studies, we showed that MIG‐6 indeed inhibited EGFR in PC9, a lung cancer cell line expressing the constitutively active form of EGFR. However, MIG‐6 knockdown does not promote EGFR phosphorylation and signaling in multiple TNBC cell models. It has been shown that TNBC cells express wild‐type EGFR (Thomas et al, 2019) and that TNBC patients rarely harbor active EGFR mutations (Santarpia et al, 2012; Tilch et al, 2014). In line with the previous study by Park et al, we found that MIG‐6 is tyrosine phosphorylated at Y394/Y395 in the lung cancer cell lines PC9 and H3255 and that MIG‐6 tyrosine phosphorylation is attenuated by EGFR inhibition. Intriguingly, MIG‐6 in TNBC cells, albeit expressed at high levels, does not undergo Y394/Y395 tyrosine phosphorylation (Appendix Fig S3). Therefore, we reasoned that the defective Y394 phosphorylation of MIG‐6 in TNBC cells may be one of the mechanisms that attenuate MIG‐6’s tumor‐suppressive effect on EGFR inhibition. Future studies are needed to verify this notion.
Our study revealed that MIG‐6 is an upstream regulator of HIF1α and a versatile regulator of glucose metabolism. Hypoxia is a common feature of solid tumors. Oxygen is a primary substrate of oxidative phosphorylation metabolism commonly utilized in human cells. To adapt to the low oxygen supply and high metabolic demands in tumors, cancer cells activate several metabolic reprogramming responses that are orchestrated by the HIF1α transcription factor (Nakazawa et al, 2016). It has been shown that HIF1α contributes to the metabolic switch from oxidative phosphorylation to glycolysis by inducing the transcription of genes essential for glucose metabolism (Xie & Simon, 2017). For instance, HIF1α promotes several glycolytic genes, e.g., GLUT1, GLUT3, HK1/2, PFK1, ENO2, PGK1, and LDHA. Kim et al (2006) and Papandreou et al (2006) reported that HIF1α actively suppresses pyruvate catabolism and oxidative phosphorylation by inducing PDK1. Our biochemical analyses demonstrated that MIG‐6 is essential for the binding of HAUSP to HIF1α, in turn leading to the stabilization of the HIF1α protein. Moreover, our metabolic gene profiling assays revealed that MIG‐6 regulates several HIF1α‐directed metabolic reprogramming genes, including GLUT1, HK2, PFK1, ENO2, PGK1, LDHA, and PDK1. These findings show that MIG‐6 exhibits pleiotropic effects on glucose metabolism. Under hypoxia, cancer cells utilize glutamine to generate citrate and lipids through the reductive carboxylation of α‐ketoglutarate. These processes are mediated by IDH1 or IDH2 (Metallo et al, 2011; Wise et al, 2011). Our metabolic profiling showed that MIG‐6 knockdown decreases the gene expressions of both IDH1 and IDH2, suggesting MIG‐6’s potential engagement in fatty acid synthesis and metabolism. Our findings together suggest a prominent role for MIG‐6 in hypoxia‐induced metabolism adaption and the subsequent promotion of tumor development. Because of the diverse roles of HIF1α in angiogenesis and antitumor immunity, our study sets the stage for the future characterization of MIG‐6 in other tumor‐promoting processes in TNBC. Based on our studies, MIG‐6 targeting represents a new therapeutic strategy for TNBC.
Materials and Methods
Cell culture and reagents
All cancer breast cell lines were gifts from Dr. Mien‐Chie Hung (MD Anderson Cancer Center) and Binhua P. Zhou (University of Kentucky). All cells were cultured in DMEM containing 10% fetal bovine serum and 1% penicillin‐streptomycin, except the ZR75‐1 cells, which were cultured in RPMI containing 10% fetal bovine serum and 1% penicillin‐streptomycin. All cell lines were verified to be free of mycoplasma contamination by the R&D Systems MycoProbe® Mycoplasma Detection Kit every 6 months. The cell lines were authenticated by short tandem repeat profiling by American Type Culture Collection. The human pcDNA3‐GLUT1 and HA‐VHL plasmids were gifts from Drs. Wolf Frommer and William Kaelin, respectively (Addgene plasmids #18085 and #19999). MG132 and pLKO.1 lentiviral plasmids that contain shRNA sequences targeting GFP, luciferase, MIG‐6, or GLUT1 were from Sigma‐Aldrich.
Generation of stable knockdown and inducible knockdown cells
For lentiviral shRNA infection, the shRNA vectors targeting MIG‐6, GLUT1, HAUSP, HIF1α, luciferase, and GFP were transfected into 293T cells using a packing plasmid (deltaVPR8.9) and an envelope plasmid (VSV‐G) with calcium phosphate reagent, according to the manufacturer’s standard procedures. MIG‐6‐lentiviral shRNA‐1 (5′‐GCCAGTAAGGTTCCTTGCATT‐3′), MIG‐6‐lentiviral shRNA‐2 (5′‐GCAGGTTACTTGGCAACCATA‐3′), Doxycycline‐inducible MIG‐6‐lentiviral shRNA (5′‐CCAGATTATAGAAGATGGT‐3′), GLUT1‐lentiviral shRNA‐1 (5′‐GCCACACTATTACCATGAGAA‐3′), GLUT1‐lentiviral shRNA‐2 (5′‐CTTCAAAGTTCCTGAGACTAA‐3′), HAUSP‐lentiviral shRNA (5′‐CCTGGATTTGTGGTTACGTTA‐3′), HIF1α‐lentiviral shRNA (5′‐GTGATGAAAGAATTACCGAAT‐3′), and GFP shRNA (5′‐GCAAGCTGACCCTGAAGTTC‐3′) were transfected with packing plasmids into 293T cells for 2 days, and virus‐particles were then used to infect mammalian cells. All of the infected cells were selected with puromycin for at least 4 days to establish stable cell lines. A new batch of stable cell lines was generated about every 2–3 months.
Cell proliferation assay
A total of 3,000 cells were seeded in 12 wells in triplicate for 24 h. Cells were harvested and mixed with 0.4% trypan blue solution at indicated days. Viable and non‐viable cells were counted using a hemocytometer under a microscope by the trypan blue dye exclusion method.
Colony formation assay
BT549 cells with GFP or MIG‐6 knockdown (2,000 cells per well) were seeded and cultured in six‐well plates and refreshed with growth media every 3 days. The colonies were stained with a solution of 0.5% crystal violet in 25% methanol. Then, the number of colonies was counted by ImageJ software (version 1.6.0; National Institutes of Health, Bethesda, MD, USA).
Immunoblotting analysis
Cells were lysed on ice with radioimmunoprecipitation assay (RIPA) buffer containing a proteinase inhibitor (Roche) and a phosphatase inhibitor cocktail (Sigma‐Aldrich). Immunoblotting was performed using antibodies against MIG‐6 (Cell Signaling Technology, Cat. #2440), GLUT1 (Abcam, clone SPM498), p‐EGFR (Tyr1173) (Cell Signaling Technology, clone 53A5), EGFR (Santa Cruz Biotechnology, clone 1005), pAKT(S473) (Cell Signaling Technology, Cat.9271), AKT (Cell Signaling Technology, clone C67E7), HIF1α (BD Biosciences, Clone 54), cMyc (Roche, clone 9E10), β‐actin (Sigma‐Aldrich, clone AC‐15), and α‐Tubulin (Sigma‐Aldrich, clone B‐5‐1‐2). Detailed antibody information is listed in Table EV4.
Extracellular flux analysis
The extracellular acidification rate (ECAR) and basal oxygen consumption rate (OCR) were measured using the Seahorse XP96 Extracellular Flux Analyzer (Seahorse Bioscience) with the standard program, as recommended by the manufacturer. Briefly, 40,000 cells per well were plated in a XF96 (V3) polystyrene cell culture plate, and the next day, the media were replaced with XF media for 1 h in a 37°C/non‐CO2 incubator before the assay. Sensor cartridges were incubated in sterile water for 24 h then refreshed with XF calibrant solution for 1 h before running the assay. Three OCR measurements were taken at baseline and after each injection of the following mitochondrial stress test compounds: oligomycin (1 μM); FCCP (0.5 μM), and antimycin A (0.5 μM). The ECAR of cells was measured in the medium without glucose. Glucose (10 mM) was then injected into the XF media, followed by oligomycin (1 μM), and then 2‐deoxy‐D‐glucose (2‐DG) (50 mM). The amount of DNA in each well was determined using CyQUANT Cell Proliferation Assays (Thermo Fisher Scientific). OCR and ECAR values were normalized to DNA content for each well.
Lactate production assay
Cells were seeded in 24‐well plates in triplicate for 24 h. Cells were then refreshed with serum‐free medium for 24 h, followed by treatment with EGF (50 ng/ml) for 9 h. The culture medium was harvested, and lactate concentration was measured using lactate test strips and an Accutrend Lactate analyzer (Roche). Viable cells in each well were counted by the trypan blue dye exclusion method for normalization. The rate of lactate production was determined (lactate production rate = lactate concentration/cells/time) and normalized to the rate determined for the control group.
Glucose metabolism RT2 profiler PCR array
The Qiagen RT2 Profiler PCR Array for analyzing human glucose metabolism was performed with the first‐strand cDNA, and quantitative real‐time PCR was carried out according to the manufacturer’s instructions (Qiagen). The C t values were normalized to the levels of the ribosomal protein RPLP0 as ΔCt. For each gene, the 2Δ C t values of the GFP and MIG‐6 knockdown samples normalized to the average were calculated and presented in a heat map. The percentages of gene up/downregulation upon MIG‐6 knockdown were calculated and presented in histograms and Table EV3.
Real‐time PCR
Total RNA was extracted from breast cancer cell lines using an RNeasy Mini Kit (Qiagen), and the concentration of total RNA was measured using a NanoDrop 2000 spectrophotometer (Thermo Fisher Scientific). The total RNA was reverse transcribed using a SuperScript™ II Reverse Transcriptase (RT) kit (Life Sciences). SYBR‐based real‐time PCR was carried out on a StepOnePlus Real‐Time PCR system (Applied Biosystems) with the following primers: MIG‐6, 5′‐ATGTCAATAGCAGGAGTTGCTG‐3′ (forward) and 5′‐GTCTAAGGAGAAACCACATAGG‐3′ (reverse); GLUT1, 5′‐TGACCATCGCGCTAGCACTGC‐3′ (forward) and 5′‐AACGGCAATGGCAGCTGGACG‐3′ (reverse); LDHA, 5′‐TGGAGTGGAATGAATGTTGC‐3′ (forward) and 5′‐ATAGCCCAGGATGTGTAGCG‐3′ (reverse); GAPDH, 5′‐GATTCCACCCATGGCAAATTC‐3′ (forward) and 5′‐CTTCTCCATGGTGGTGAAGAC‐3′ (reverse); and HIF1α, 5′‐CCAGCAGACTCAAATACAAGAACC‐3′ (forward) and 5′‐TGTATGTGGGTAGCAGATGGAGAT‐3′ (reverse). Data were analyzed using the comparative C t method, with values normalized to GAPDH levels and expressed relative to the levels in control cells.
Immunofluorescent staining
Cells were grown in a four‐well chamber slide (Falcon) and fixed with 4% paraformaldehyde in phosphate‐buffered saline (PBS) for 20 min, permeabilized with 2% bovine serum albumin (BSA), and 0.1% saponin in PBS for 30 min at room temperature. Cells were incubated overnight at 4°C with the primary antibody against GLUT1 (Abcam, clone SPM498, 1:1,000) in 2% BSA and 0.1% saponin in PBS. Cells were washed three times in PBS and incubated with a secondary antibody. Confocal analysis was performed with a Leica SP5 confocal microscope.
Membrane fractionation
MDA‐MB‐231 and BT549 cells with GFP or MIG‐6 knockdown were seeded in 10 cm cell culture plates for 24 h, and then, the cytosolic and membrane fractions were prepared using a ProteoExtract kit (Calbiochem) according to the manufacturer’s standard procedures, with a slight modification. Briefly, cells were washed with PBS twice, then harvested and resuspended with extraction buffer I for 15 min at 4°C. After centrifugation at 15,000 g for 5 min at 4°C, the supernatant was transferred into a new tube as a cytosolic fraction. For the membrane fraction, the pellet was washed with PBS and centrifuged at 15,000 g for 5 min at 4°C. The pellet was resuspended with extraction buffer II and rotated for 45 min at 4°C. The suspensions were centrifuged at 15,000 g for 5 min at 4°C, and then, the supernatants were collected as membrane fractions.
Glucose uptake assay
BT549 cells with GFP or MIG‐6 knockdown were seeded in a 6 cm cell culture plate for 24 h followed by starvation in serum‐free and glucose‐free DMEM for 16 h. Afterward, cells were incubated with the serum‐free and glucose‐free DMEM in the absence and presence of 50 µM 2‐NBDG for 15 and 30 min, respectively. Glucose uptake was then analyzed by flow cytometry.
Animal studies
For the xenograft tumor mouse models, 5 × 10⁶ GFP and MIG‐6 knockdown BT549 or MDA‐MB‐231 cells were suspended in 200 µl of HBSS and Matrigel (1:1). The suspended cells were injected subcutaneously into the mammary fat pads of 5‐ to 6‐week‐old female athymic nude (NCr‐Foxn1nu) purchased from Envigo (Indianapolis, IN, USA). Tumor growth was monitored, with tumor size measured weekly with a caliper. The tumor volume was calculated using the standard formula of L × W2 × 0.52, where L and W are the length and width, respectively. For the doxycycline‐inducible MIG‐6 knockdown xenograft model, 5 × 10⁶ doxycycline‐inducible non‐targeting control or MIG‐6 knockdown BT549 cells were suspended in 200 µl of HBSS and Matrigel (1:1). The suspended control and inducible MIG‐6 knockdown cells were injected subcutaneously into the right and left mammary fat pads of the same 6‐ to 7‐week‐old female athymic nude mouse (NCr‐Foxn1nu) purchased from Envigo (Indianapolis, IN, USA). Tumor size was measured twice a week by caliper. Once the average tumor volume reached ~ 80–100 mm3, mice were fed a doxycycline diet (625 mg/kg doxycycline hyclate, Envigo) to induce non‐targeting or MIG‐6 knockdown. Mice were randomly grouped for tumor cell inoculation. Blinding was not done during tumor inoculation but the measurement of tumor size.
Immunohistochemistry and scoring
The procedures for the immunohistochemical staining of human samples were approved by the institutional review board of Chi‐Mei Foundational Medical Center (Tainan City, Taiwan). Briefly, formalin‐fixed and paraffin‐embedded tumor sections were deparaffinized, rehydrated, and soaked in 3% hydrogen peroxide solution to remove endogenous peroxidase activity. After antigen retrieval, the sections were incubated in blocking buffer and incubated overnight at 4°C with primary antibodies targeting MIG‐6 (ProteinTech, cat no. 11630‐1‐AP, 1:20) and GLUT1 (Abcam, clone SPM498, 1:200). Each primary antibody was detected by the ChemMate DAKO EnVision kit (DAKO, K5001). A combination of both the percentage and intensity of positively stained tumor cells was used to generate H‐scores. H‐scores were calculated using the following equation: H‐score = ΣPi (i + 1), where i is the intensity of the stained tumor cells (0 to 4+) and Pi is the percentage of stained tumor cells for each intensity. The staining intensity and area extent of the immunohistochemical reactions were evaluated using a multi‐headed microscope by two pathologists, as previously described (Chan et al, 2012). MIG‐6 expression greater than or equal to the median is classified as “high,” while expression less than the median is classified as “low”, as indicated in Table EV2. Patient tissues used in this study were obtained with consent under the protocol approved by the institutional review board of the Chi‐Mei Foundational Medical Center.
Multiplex immunocytochemistry assay
An Opal™ multiplex tissue staining kit (PerkinElmer Inc., USA; #NEL794001KT) was applied, according to manufacturer’s instructions, for immunofluorescence analysis on 85 human primary breast cancer specimens to evaluate the colocalization of MIG‐6 and HIF1α. The primary and secondary antibodies were diluted as described in Table EV4. The fluorescent images of tissue sections were captured under an OLYMPUS FV10i confocal microscope (Olympus America Inc., USA), and the fluorescent staining was evaluated by an expert pathologist (Dr. Chien‐Feng Li).
Analysis of public datasets
Transcriptome datasets by Servant et al (GSE30682) and Bertucci et al (GSE21653) for Figs 1Bm 4A, EV1B and EV4A were retrieved from the Gene Expression Omnibus (GEO) database and analyzed by R2: Genomics Analysis and Visualization Platform (http://r2.amc.nl).
Statistics
All data are shown as mean ± SD or mean ± SEM from at least two independent experiments. Statistical significance was determined by ANOVA (Tukey’s test or Dunnett’s test) for multiple variables or with unpaired two‐tailed Student’s t‐tests for comparisons between two groups. For human breast samples, disease‐specific survival and metastasis‐free survival analyses based on MIG‐6 immunoexpression in 85 TNBC cases were performed using the Kaplan–Meier method with the log‐rank test and Cox regression model. These analyses were performed using the SPSS 14 software package. The difference in the MIG‐6 expression levels among the clinicopathological variables was analyzed using ANOVA with pairwise comparisons. Spearman’s rank correlation coefficient was used to analyze the correlation between the MIG‐6 and GLUT1 genes. In all cases, P < 0.05 was considered statistically significant.
Study approval
All animals were maintained under pathogen‐free conditions, and all procedures were performed according to an approved institutional animal care and use committee (IACUC) protocol (#1525700) and following recommendations for the proper use and care of laboratory animals.
Author contributions
Design and experiments, data analysis, and manuscript writing: JH; Histological and clinical data analyses: C‐FL; Experiments and data analysis: H‐JL, D‐HS, Y‐JC, and BPDC; Project conception, overall guidance, and manuscript writing: C‐HC.
Conflict of interest
The authors declare that they have no conflict of interest.
Supporting information
Appendix
Expanded View Figures PDF
Table EV1
Table EV2
Table EV3
Table EV4
Review Process File
Acknowledgements
We sincerely appreciate Drs. Mien‐Chie Hung, Binhua P. Zhou, Wolf Frommer, and William Kaelin for providing cell lines and/or constructs. We thank Dr. Jeonghee Cho for the generous gift of the pMIG‐6 Y394/395 antibody. We thank the members of Dr. Chan’s laboratory for their valuable comments and suggestions. This work was supported by an NIH grant (R01 CA211912) and the Susan G. Komen Career Catalyst Grant (CCR17480331) to CHC, as well as a MOST grant (MOST 109‐2628‐B‐384‐003) to CFL. The study was partly supported by a health and welfare surcharge on tobacco products, Taiwan (MOHW109‐TDU‐B‐212‐134014) to CFL.
EMBO reports (2021) 22: e50781.
Data availability
The study does not generate any primary data to be deposited in a depository.
References
- Anastasi S, Sala G, Huiping C, Caprini E, Russo G, Iacovelli S, Lucini F, Ingvarsson S, Segatto O (2005) Loss of RALT/MIG‐6 expression in ERBB2‐amplified breast carcinomas enhances ErbB‐2 oncogenic potency and favors resistance to Herceptin. Oncogene 24: 4540–4548 [DOI] [PubMed] [Google Scholar]
- Anastasi S, Baietti MF, Frosi Y, Alema S, Segatto O (2007) The evolutionarily conserved EBR module of RALT/MIG6 mediates suppression of the EGFR catalytic activity. Oncogene 26: 7833–7846 [DOI] [PubMed] [Google Scholar]
- Briggs KJ, Koivunen P, Cao S, Backus KM, Olenchock BA, Patel H, Zhang Q, Signoretti S, Gerfen GJ, Richardson AL et al (2016) Paracrine induction of HIF by glutamate in breast cancer: EglN1 senses cysteine. Cell 166: 126–139 [DOI] [PMC free article] [PubMed] [Google Scholar]
- The Cancer Genome Atlas Network (2012) Comprehensive molecular portraits of human breast tumours. Nature 490: 61–70 [DOI] [PMC free article] [PubMed] [Google Scholar]
- Cerami E, Gao J, Dogrusoz U, Gross BE, Sumer SO, Aksoy BA, Jacobsen A, Byrne CJ, Heuer ML, Larsson E et al (2012) The cBio cancer genomics portal: an open platform for exploring multidimensional cancer genomics data. Cancer Discov 2: 401–404 [DOI] [PMC free article] [PubMed] [Google Scholar]
- Chan CH, Li CF, Yang WL, Gao Y, Lee SW, Feng Z, Huang HY, Tsai KK, Flores LG, Shao Y et al (2012) The Skp2‐SCF E3 ligase regulates Akt ubiquitination, glycolysis, herceptin sensitivity, and tumorigenesis. Cell 149: 1098–1111 [DOI] [PMC free article] [PubMed] [Google Scholar]
- Chen C, Pore N, Behrooz A, Ismail‐Beigi F, Maity A (2001) Regulation of glut1 mRNA by hypoxia‐inducible factor‐1. Interaction between H‐ras and hypoxia. J Biol Chem 276: 9519–9525 [DOI] [PubMed] [Google Scholar]
- DeBerardinis RJ, Chandel NS (2016) Fundamentals of cancer metabolism. Sci Adv 2: e1600200 [DOI] [PMC free article] [PubMed] [Google Scholar]
- Dupuy F, Tabaries S, Andrzejewski S, Dong Z, Blagih J, Annis MG, Omeroglu A, Gao D, Leung S, Amir E et al (2015) PDK1‐dependent metabolic reprogramming dictates metastatic potential in breast cancer. Cell Metab 22: 577–589 [DOI] [PubMed] [Google Scholar]
- Ferby I, Reschke M, Kudlacek O, Knyazev P, Pante G, Amann K, Sommergruber W, Kraut N, Ullrich A, Fassler R et al (2006) Mig6 is a negative regulator of EGF receptor‐mediated skin morphogenesis and tumor formation. Nat Med 12: 568–573 [DOI] [PubMed] [Google Scholar]
- Gao J, Aksoy BA, Dogrusoz U, Dresdner G, Gross B, Sumer SO, Sun Y, Jacobsen A, Sinha R, Larsson E et al (2013) Integrative analysis of complex cancer genomics and clinical profiles using the cBioPortal. Sc Signal 6: pl1 [DOI] [PMC free article] [PubMed] [Google Scholar]
- Haber DA, Gray NS, Baselga J (2011) The evolving war on cancer. Cell 145: 19–24 [DOI] [PubMed] [Google Scholar]
- Hay N (2016) Reprogramming glucose metabolism in cancer: can it be exploited for cancer therapy? Nat Rev Cancer 16: 635–649 [DOI] [PMC free article] [PubMed] [Google Scholar]
- Hopkins S, Linderoth E, Hantschel O, Suarez‐Henriques P, Pilia G, Kendrick H, Smalley MJ, Superti‐Furga G, Ferby I (2012) Mig6 is a sensor of EGF receptor inactivation that directly activates c‐Abl to induce apoptosis during epithelial homeostasis. Dev Cell 23: 547–559 [DOI] [PMC free article] [PubMed] [Google Scholar]
- Hussein YR, Bandyopadhyay S, Semaan A, Ahmed Q, Albashiti B, Jazaerly T, Nahleh Z, Ali‐Fehmi R (2011) Glut‐1 expression correlates with basal‐like breast cancer. Transl Oncol 4: 321–327 [DOI] [PMC free article] [PubMed] [Google Scholar]
- Ivan M, Kondo K, Yang H, Kim W, Valiando J, Ohh M, Salic A, Asara JM, Lane WS, Kaelin WG Jr (2001) HIFalpha targeted for VHL‐mediated destruction by proline hydroxylation: implications for O2 sensing. Science 292: 464–468 [DOI] [PubMed] [Google Scholar]
- Izumchenko E, Chang X, Michailidi C, Kagohara L, Ravi R, Paz K, Brait M, Hoque MO, Ling S, Bedi A et al (2014) The TGFbeta‐miR200‐MIG6 pathway orchestrates the EMT‐associated kinase switch that induces resistance to EGFR inhibitors. Can Res 74: 3995–4005 [DOI] [PMC free article] [PubMed] [Google Scholar]
- Jaakkola P, Mole DR, Tian YM, Wilson MI, Gielbert J, Gaskell SJ, von Kriegsheim A, Hebestreit HF, Mukherji M, Schofield CJ et al (2001) Targeting of HIF‐alpha to the von Hippel‐Lindau ubiquitylation complex by O2‐regulated prolyl hydroxylation. Science 292: 468–472 [DOI] [PubMed] [Google Scholar]
- Kang SS, Chun YK, Hur MH, Lee HK, Kim YJ, Hong SR, Lee JH, Lee SG, Park YK (2002) Clinical significance of glucose transporter 1 (GLUT1) expression in human breast carcinoma. Jpn J Cancer Res 93: 1123–1128 [DOI] [PMC free article] [PubMed] [Google Scholar]
- Kim JW, Tchernyshyov I, Semenza GL, Dang CV (2006) HIF‐1‐mediated expression of pyruvate dehydrogenase kinase: a metabolic switch required for cellular adaptation to hypoxia. Cell Metab 3: 177–185 [DOI] [PubMed] [Google Scholar]
- Kreike B, van Kouwenhove M, Horlings H, Weigelt B, Peterse H, Bartelink H, van de Vijver MJ (2007) Gene expression profiling and histopathological characterization of triple‐negative/basal‐like breast carcinomas. Breast Cancer Res 9: R65 [DOI] [PMC free article] [PubMed] [Google Scholar]
- Lee HJ, Li CF, Ruan D, Powers S, Thompson PA, Frohman MA, Chan CH (2016) The DNA damage transducer RNF8 facilitates cancer chemoresistance and progression through twist activation. Mol Cell 63: 1021–1033 [DOI] [PMC free article] [PubMed] [Google Scholar]
- Lee PC, Fang YF, Yamaguchi H, Wang WJ, Chen TC, Hong X, Ke B, Xia W, Wei Y, Zha Z et al (2018) Targeting PKCdelta as a therapeutic strategy against heterogeneous mechanisms of EGFR inhibitor resistance in EGFR‐mutant lung cancer. Cancer Cell 34: 954–969 e954 [DOI] [PMC free article] [PubMed] [Google Scholar]
- Lee HJ, Li CF, Ruan D, He J, Montal ME, Lorenz S, Girnun GD, Chan CH (2019) Non‐proteolytic ubiquitination of Hexokinase 2 by HectH9 controls tumor metabolism and cancer stem cell expansion. Nat Commun 10: 2625 [DOI] [PMC free article] [PubMed] [Google Scholar]
- Li ZX, Qu LY, Wen H, Zhong HS, Xu K, Qiu XS, Wang EH (2014) Mig‐6 overcomes gefitinib resistance by inhibiting EGFR/ERK pathway in non‐small cell lung cancer cell lines. Int J Clin Exp Pathol 7: 7304–7311 [PMC free article] [PubMed] [Google Scholar]
- Li J, He Y, Tan Z, Lu J, Li L, Song X, Shi F, Xie L, You S, Luo X et al (2018) Wild‐type IDH2 promotes the Warburg effect and tumor growth through HIF1alpha in lung cancer. Theranostics 8: 4050–4061 [DOI] [PMC free article] [PubMed] [Google Scholar]
- Maity TK, Venugopalan A, Linnoila I, Cultraro CM, Giannakou A, Nemati R, Zhang X, Webster JD, Ritt D, Ghosal S et al (2015) Loss of MIG6 accelerates initiation and progression of mutant epidermal growth factor receptor‐driven lung adenocarcinoma. Cancer Discov 5: 534–549 [DOI] [PMC free article] [PubMed] [Google Scholar]
- Majmundar AJ, Wong WJ, Simon MC (2010) Hypoxia‐inducible factors and the response to hypoxic stress. Mol Cell 40: 294–309 [DOI] [PMC free article] [PubMed] [Google Scholar]
- Metallo CM, Gameiro PA, Bell EL, Mattaini KR, Yang J, Hiller K, Jewell CM, Johnson ZR, Irvine DJ, Guarente L et al (2011) Reductive glutamine metabolism by IDH1 mediates lipogenesis under hypoxia. Nature 481: 380–384 [DOI] [PMC free article] [PubMed] [Google Scholar]
- Molenaar RJ, Maciejewski JP, Wilmink JW, van Noorden CJF (2018) Wild‐type and mutated IDH1/2 enzymes and therapy responses. Oncogene 37: 1949–1960 [DOI] [PMC free article] [PubMed] [Google Scholar]
- Nakazawa MS, Keith B, Simon MC (2016) Oxygen availability and metabolic adaptations. Nat Rev Cancer 16: 663–673 [DOI] [PMC free article] [PubMed] [Google Scholar]
- Osthus RC, Shim H, Kim S, Li Q, Reddy R, Mukherjee M, Xu Y, Wonsey D, Lee LA, Dang CV (2000) Deregulation of glucose transporter 1 and glycolytic gene expression by c‐Myc. J Biol Chem 275: 21797–21800 [DOI] [PubMed] [Google Scholar]
- Palaskas N, Larson SM, Schultz N, Komisopoulou E, Wong J, Rohle D, Campos C, Yannuzzi N, Osborne JR, Linkov I et al (2011) 18F‐fluorodeoxy‐glucose positron emission tomography marks MYC‐overexpressing human basal‐like breast cancers. Can Res 71: 5164–5174 [DOI] [PMC free article] [PubMed] [Google Scholar]
- Papandreou I, Cairns RA, Fontana L, Lim AL, Denko NC (2006) HIF‐1 mediates adaptation to hypoxia by actively downregulating mitochondrial oxygen consumption. Cell Metab 3: 187–197 [DOI] [PubMed] [Google Scholar]
- Park E, Kim N, Ficarro SB, Zhang Y, Lee BI, Cho A, Kim K, Park AKJ, Park WY, Murray B et al (2015) Structure and mechanism of activity‐based inhibition of the EGF receptor by Mig6. Nat Struct Mol Biol 22: 703–711 [DOI] [PMC free article] [PubMed] [Google Scholar]
- Pelicano H, Zhang W, Liu J, Hammoudi N, Dai J, Xu RH, Pusztai L, Huang P (2014) Mitochondrial dysfunction in some triple‐negative breast cancer cell lines: role of mTOR pathway and therapeutic potential. Breast Cancer Res 16: 434 [DOI] [PMC free article] [PubMed] [Google Scholar]
- Petrocca F, Altschuler G, Tan SM, Mendillo ML, Yan H, Jerry DJ, Kung AL, Hide W, Ince TA, Lieberman J (2013) A genome‐wide siRNA screen identifies proteasome addiction as a vulnerability of basal‐like triple‐negative breast cancer cells. Cancer Cell 24: 182–196 [DOI] [PMC free article] [PubMed] [Google Scholar]
- Sabatier R, Finetti P, Cervera N, Lambaudie E, Esterni B, Mamessier E, Tallet A, Chabannon C, Extra JM, Jacquemier J et al (2011) A gene expression signature identifies two prognostic subgroups of basal breast cancer. Breast Cancer Res Treat 126: 407–420 [DOI] [PubMed] [Google Scholar]
- Santarpia L, Qi Y, Stemke‐Hale K, Wang B, Young EJ, Booser DJ, Holmes FA, O'Shaughnessy J, Hellerstedt B, Pippen J et al (2012) Mutation profiling identifies numerous rare drug targets and distinct mutation patterns in different clinical subtypes of breast cancers. Breast Cancer Res Treat 134: 333–343 [DOI] [PMC free article] [PubMed] [Google Scholar]
- Servant N, Bollet MA, Halfwerk H, Bleakley K, Kreike B, Jacob L, Sie D, Kerkhoven RM, Hupe P, Hadhri R et al (2012) Search for a gene expression signature of breast cancer local recurrence in young women. Clin Cancer Res 18: 1704–1715 [DOI] [PubMed] [Google Scholar]
- Shen L, O'Shea JM, Kaadige MR, Cunha S, Wilde BR, Cohen AL, Welm AL, Ayer DE (2015) Metabolic reprogramming in triple‐negative breast cancer through Myc suppression of TXNIP. Proc Natl Acad Sci USA 112: 5425–5430 [DOI] [PMC free article] [PubMed] [Google Scholar]
- Thomas R, Srivastava S, Katreddy RR, Sobieski J, Weihua Z (2019) Kinase‐inactivated EGFR is required for the survival of Wild‐type EGFR‐expressing cancer cells treated with tyrosine kinase inhibitors. Int J Mol Sci 20: 2515 [DOI] [PMC free article] [PubMed] [Google Scholar]
- Tilch E, Seidens T, Cocciardi S, Reid LE, Byrne D, Simpson PT, Vargas AC, Cummings MC, Fox SB, Lakhani SR et al (2014) Mutations in EGFR, BRAF and RAS are rare in triple‐negative and basal‐like breast cancers from Caucasian women. Breast Cancer Res Treat 143: 385–392 [DOI] [PubMed] [Google Scholar]
- Wise DR, Ward PS, Shay JE, Cross JR, Gruber JJ, Sachdeva UM, Platt JM, DeMatteo RG, Simon MC, Thompson CB (2011) Hypoxia promotes isocitrate dehydrogenase‐dependent carboxylation of alpha‐ketoglutarate to citrate to support cell growth and viability. Proc Natl Acad Sci USA 108: 19611–19616 [DOI] [PMC free article] [PubMed] [Google Scholar]
- Wu HT, Kuo YC, Hung JJ, Huang CH, Chen WY, Chou TY, Chen Y, Chen YJ, Chen YJ, Cheng WC et al (2016) K63‐polyubiquitinated HAUSP deubiquitinates HIF‐1alpha and dictates H3K56 acetylation promoting hypoxia‐induced tumour progression. Nat Commun 7: 13644 [DOI] [PMC free article] [PubMed] [Google Scholar]
- Xie H, Simon MC (2017) Oxygen availability and metabolic reprogramming in cancer. J Biol Chem 292: 16825–16832 [DOI] [PMC free article] [PubMed] [Google Scholar]
- Xu J, Keeton AB, Wu L, Franklin JL, Cao X, Messina JL (2005) Gene 33 inhibits apoptosis of breast cancer cells and increases poly(ADP‐ribose) polymerase expression. Breast Cancer Res Treat 91: 207–215 [DOI] [PubMed] [Google Scholar]
- Ying H, Zheng H, Scott K, Wiedemeyer R, Yan H, Lim C, Huang J, Dhakal S, Ivanova E, Xiao Y et al (2010) Mig‐6 controls EGFR trafficking and suppresses gliomagenesis. Proc Natl Acad Sci USA 107: 6912–6917 [DOI] [PMC free article] [PubMed] [Google Scholar]
- Young CD, Lewis AS, Rudolph MC, Ruehle MD, Jackman MR, Yun UJ, Ilkun O, Pereira R, Abel ED, Anderson SM (2011) Modulation of glucose transporter 1 (GLUT1) expression levels alters mouse mammary tumor cell growth in vitro and in vivo . PLoS One 6: e23205 [DOI] [PMC free article] [PubMed] [Google Scholar]
- Yu M, Yongzhi H, Chen S, Luo X, Lin Y, Zhou Y, Jin H, Hou B, Deng Y, Tu L et al (2017) The prognostic value of GLUT1 in cancers: a systematic review and meta‐analysis. Oncotarget 8: 43356–43367 [DOI] [PMC free article] [PubMed] [Google Scholar]
- Zhang X, Pickin KA, Bose R, Jura N, Cole PA, Kuriyan J (2007a) Inhibition of the EGF receptor by binding of MIG6 to an activating kinase domain interface. Nature 450: 741–744 [DOI] [PMC free article] [PubMed] [Google Scholar]
- Zhang YW, Staal B, Su Y, Swiatek P, Zhao P, Cao B, Resau J, Sigler R, Bronson R, Vande Woude GF (2007b) Evidence that MIG‐6 is a tumor‐suppressor gene. Oncogene 26: 269–276 [DOI] [PubMed] [Google Scholar]
Associated Data
This section collects any data citations, data availability statements, or supplementary materials included in this article.
Supplementary Materials
Appendix
Expanded View Figures PDF
Table EV1
Table EV2
Table EV3
Table EV4
Review Process File
Data Availability Statement
The study does not generate any primary data to be deposited in a depository.


