

Preservatives increase the shelf life of cosmetic products by preventing growth of contaminating microbes, including bacteria and fungi. In recent years, the Scientific Committee on Consumer Safety (SCCS) has recommended the ban or restricted use of a number of preservatives due to safety concerns.
KEYWORDS: cosmetics, ethylzingerone, hydroxyethoxyphenyl butanone, HEPB, antifungal, mechanism of action, Candida albicans
ABSTRACT
Preservatives increase the shelf life of cosmetic products by preventing growth of contaminating microbes, including bacteria and fungi. In recent years, the Scientific Committee on Consumer Safety (SCCS) has recommended the ban or restricted use of a number of preservatives due to safety concerns. Here, we characterize the antifungal activity of ethylzingerone (hydroxyethoxyphenyl butanone [HEPB]), an SCCS-approved new preservative for use in rinse-off, oral care, and leave-on cosmetic products. We show that HEPB significantly inhibits growth of Candida albicans, Candida glabrata, and Saccharomyces cerevisiae, acting fungicidally against C. albicans. Using transcript profiling experiments, we found that the C. albicans transcriptome responded to HEPB exposure by increasing the expression of genes involved in amino acid biosynthesis while activating pathways involved in chemical detoxification/oxidative stress response. Comparative analyses revealed that C. albicans phenotypic and transcriptomic responses to HEPB treatment were distinguishable from those of two widely used preservatives, triclosan and methylparaben. Chemogenomic analyses, using a barcoded S. cerevisiae nonessential mutant library, revealed that HEPB antifungal activity strongly interfered with the biosynthesis of aromatic amino acids. The trp1Δ mutants in S. cerevisiae and C. albicans were particularly sensitive to HEPB treatment, a phenotype rescued by exogenous addition of tryptophan to the growth medium, providing a direct link between HEPB mode of action and tryptophan availability. Collectively, our study sheds light on the antifungal activity of HEPB, a new molecule with safe properties for use as a preservative in the cosmetic industry, and exemplifies the powerful use of functional genomics to illuminate the mode of action of antimicrobial agents.
INTRODUCTION
Preservatives are molecules of natural or synthetic origin intended to inhibit the development of microorganisms that can contaminate food, pharmaceutical, or cosmetic products (1–3). Many cosmetic, household, and pharmaceutical products available on the market are supplemented with a variety of preservatives, including parabens (e.g., methylparaben, MPB), isothiazolinones, organic acids, formaldehyde releasers, triclosan (TCS), and chlorhexidine (2, 4). Importantly, parabens appear to be the most frequently used preservatives, found in 44% of cosmetics and 9% of detergents (4), while TCS reaches an estimated ∼75% of the U.S. population likely due to exposure via consumer goods and personal care products (5). Both MPB and TCS are members of the phenols/alcohols chemical class of preservatives and have distinct mechanisms of antimicrobial action. TCS blocks lipid biosynthesis in bacteria by specifically inhibiting the enzyme enoyl-acyl carrier protein reductase (6, 7), whereas MPB exerts its inhibitory activity on membrane transport and mitochondrial function and is more active against fungi than bacteria (8).
Although chemical preservatives prevent microbial growth, their safety is questioned by a growing number of consumers and investigational reports. For instance, the Scientific Committee on Consumer Safety (SCCS, European Commission) has recommended the ban or restriction of using some parabens due to their potential in promoting carcinogenesis through endocrine disruption (2). Yet, the scientific community considers parabens one of the least allergenic preservatives available (9) that also have an excellent safety record (10). However, TCS has been recommended to be removed from all human hygiene biocidal products by the SCCS, as it promotes the emergence of antimicrobial resistance and was shown to cause various adverse effects in cellular and animal models of exposure to TCS (5).
In this context, effort from the cosmetic industry is ongoing for the identification of novel preservative molecules with improved safety profile while retaining antimicrobial activity. Ethylzingerone (hydroxyethoxyphenyl butanone [HEPB]) is one of the recently investigated molecules for use as a cosmetic preservative (11, 12). HEPB is a derivative of zingerone, one of the active compounds in ginger and member of the methoxyphenol family, known to have potent pleiotropic pharmacological activities (13), including antimicrobial activity (14). Importantly, the use of HEPB in rinse-off, oral care, and leave-on cosmetic products was recently considered safe by the SCCS, provided it is supplied at a maximum concentration of 0.7% (wt/vol) (11, 12).
Fungi are responsible for a variety of infections of the skin and mucosa. Fungal growth in cosmetic products can be a source of superficial infections, following a long exposure to the contaminated product in day-to-day use (15). Consequently, microbial stability of cosmetic products is a crucial parameter in evaluating product quality and safety and requires the use of preservatives that are well tolerated and whose mechanism of action is well characterized. Many approaches allowing to investigate the mode of action of preservatives with antifungal activity rely on testing the physiological response of fungal species to preservative exposure (16). With the development of fungal genetics resources and functional genomics technologies, it is possible to better characterize the antifungal mode of action of compounds by exploring the transcriptional response of fungal species to chemical treatment and screening yeast mutant libraries for altered growth following chemical exposure (17). Using such approaches, we characterized the antifungal activity of HEPB and provided clues on its mechanism of action.
RESULTS
Characterization of HEPB antifungal activity.
We tested the antifungal activity of HEPB and compared it to that of two widely used preservatives, MPB and TCS (Fig. 1A). We performed MIC assays and reported MIC values allowing inhibition of 90% of growth (MIC90) of C. albicans SC5314, C. glabrata CBS138, and S. cerevisiae BY4741 strains (Table 1). These Candida species are clinically relevant, both in terms of prevalence (two most isolated species in candidiasis) and their ability to cause cutaneous candidiasis/skin infections (18, 19), while S. cerevisiae is the prototypical fungal species for molecular genetics analyses. MICs were evaluated in both synthetic (synthetic dextrose and RPMI) and rich (yeast extract-peptone-dextrose, YPD) media at 30°C (Table 1). We repeated the MIC assays with strains C. albicans ATCC 10231, C. glabrata BG2, and S. cerevisiae BY4742, and the results were similar between strains of the same species (data not shown). MICs for MPB and HEPB were in the range of 5 to 20 mg/ml for all tested species except S. cerevisiae, which shows significantly lower MIC for MPB in YPD medium (1.25 mg/ml). MICs for TCS were significantly lower in all tested species, ranging from 0.015 to 0.25 mg/ml (Table 1).
FIG 1.

Antifungal activities of ethylzingerone, triclosan, and methylparaben. (A) Chemical structures of methylparaben (MPB), triclosan (TCS), and ethylzingerone (HEPB). (B) Representative killing curves of C. albicans strain SC5314 exposed to different concentrations of each preservative in YPD medium. x axis, exposure time (min) to the indicated concentrations of each preservative; y axis, percentage of CFU counts at each time point relative to CFU counts at time point 0. (■) control with solvent alone, ( ) MPB at 5 mg/ml (1× MIC), (●) HEPB at 10 mg/ml (1× MIC), (
 ) HEPB at 20 mg/ml (2× MIC), and (□) TCS 0.062 mg/ml (1× MIC).
TABLE 1.
MIC90a (mg/ml) for methylparaben, triclosan, and HEPB
| Species/strain | Growth medium | MPBb | TCSb | HEPBb |
|---|---|---|---|---|
| C. albicans SC5314 | YPD | 5 | 0.06 | 10 |
| RPMI | 5 | 0.06 | 10 | |
| SD | 10 | 0.25 | 20 | |
| C. glabrata CBS138 | YPD | 10 | 0.06 | 20 |
| RPMI | 5 | 0.12 | 10 | |
| SD | 10 | 0.12 | 20 | |
| S. cerevisiae BY4741 | YPD | 1.25 | 0.015 | 10 |
MIC90 value, determined as the first concentration (mg/ml) of the preservative able to reduce growth by 90% compared with that of control cells grown in the absence of preservative in YPD, RPMI at pH 7, and SD at pH 5.4.
MPB, methylparaben; TCS, triclosan; HEPB, ethylzingerone.
To determine whether these compounds exert fungicidal or fungistatic activities, we performed killing curves in rich media (YPD) by exposing C. albicans cells to each of the three compounds at various concentrations during 0, 10, 30, and 60 min (Fig. 1B). Cells were washed and plated on YPD for CFU counting. At MIC90, TCS was highly fungicidal, with a killing ability observed within a 10-min exposure period (Fig. 1B). Compound HEPB was also fungicidal, although with a lower killing ability (Fig. 1B). Increasing HEPB concentration (from 1× MIC to 2× MIC, Fig. 1B) correlated with increased fungicidal action, resulting in the viability of only ∼10% of total cells after 60-min exposure. In contrast, at MIC90, MPB displayed fungistatic activity and 100% of total cells were viable, even following a 60-min exposure (Fig. 1B).
Taken together, our results show that all tested compounds display antifungal activities against C. albicans, C. glabrata, and S. cerevisiae, with HEPB and TCS exerting fungicidal activities and MPB displaying a fungistatic action.
Transcriptional response of C. albicans exposed to HEPB.
To gain insight into potential molecular pathways involved in HEPB antifungal activity, we performed transcriptomics analyses of C. albicans cells exposed to low (4 mg/ml, equivalent to 0.4× MIC) and higher (10 mg/ml, equivalent to 1.0× MIC) concentrations of HEPB relative to untreated cells, during 10, 30, and 60 min (see Materials and Methods). These treatments strongly affected the C. albicans transcriptome and led to a potent modulation of gene expression (Table S1). Following treatment with 4 mg/ml HEPB, we found 322, 386, and 489 upregulated and 338, 446, and 393 downregulated genes at time points 10, 30, and 60 min, respectively (Fig. 2A and Table S1) (fold change ≥2 or ≤−2, P < 0.05). Upon increasing the concentration of HEPB to 10 mg/ml, 754, 1,052, and 858 genes were upregulated and 817, 1,117, and 1,094 genes were downregulated at time points 10, 30, and 60 min, respectively (Fig. 2A and Table S1). Many targets of transcription factor Tac1p (20) were strongly upregulated at all tested time points (Fig. 2A, blue asterisks, and Table S1), suggesting that HEPB treatment elicited an early and strong detoxification response through activation of the expression of efflux pumps. Similarly, many genes involved in amino acid biosynthesis were upregulated, including ARG1, ARG3, ARG4, ARG8, LEU1, and others (Fig. 2A, red asterisks, and Table S1). To group the total expressed genes into clusters based on similar expression patterns, we performed K-means analysis (see Materials and Methods). We generated 10 different clusters of coregulated genes, among which two were selected for further analysis (Fig. 2B). Cluster 1 includes a subset of upregulated genes whose expression further increased with increasing HEPB concentration (Fig. 2B, upper panel), whereas cluster 2 may reflect genes whose upregulation is required only during early events following HEPB exposure (Fig. 2B, lower panel). Cluster 1 was significantly enriched in genes involved in amino acid biosynthesis as well as those involved in response to oxidative stress, the latter being particularly observed upon exposure to 1.0× MIC (Fig. 2C, upper panel). Consistently, a significant proportion of the upregulated genes were targets of transcription factor Cap1p, including CIP1, EBP1, OYE32, OYE23, GRP2, CAP1, TRX1, and others (Table S1) (21), suggesting that at higher concentration levels, HEPB induces an oxidative stress response via Cap1p. Cluster 2 is enriched in genes involved in biosynthesis of purine-containing compounds, the metabolism of serine family/glycine amino acids, and aromatic compound biosynthetic process (Fig. 2C, lower panel). It is likely that early HEPB treatment readily perturbs amino acid/purine metabolism, which are interconnected processes (22). Notably, we observed a sequential enrichment of amino acid biosynthesis-, translation-, protein turnover-, and ubiquitination-related Gene Ontology (GO) terms among HEPB (1.0× MIC)-upregulated genes over treatment time. These included “cellular amino acid biosynthetic process” (ARG, HIS, ILV, LEU, SER, and TRP genes, P = 4.53 × 10⁻¹⁶) after 10-min treatment, followed by “peptide biosynthetic process” (P = 7.39 × 10⁻⁶), “translation” (P = 1.09 × 10⁻⁵), and “response to starvation” (P = 4.94 × 10⁻⁴) after 30-min treatment, then “proteolysis involved in cellular protein catabolic process” (P = 3.06 × 10⁻²⁴), “proteasome assembly” (P = 2.17 × 10⁻⁹), and “ubiquitin-dependent protein catabolic process” (P = 1.83 × 10⁻²²) after 60-min treatment.
FIG 2.

Transcript profiling in C. albicans exposed to ethylzingerone. (A) Heat maps of the 50 highest (left panel, red) and lowest (right panel, green) transcriptionally modulated genes (log2-transformed ratios are shown and color scale indicates the maximum and minimum expression ratios, +/−10.08) following exposure of C. albicans strain SC5314 to 4 mg/ml (0.4× MIC) or 10 mg/ml (1.0× MIC) HEPB for 10, 30, and 60 min (combination of 2 or 3 biological replicates in each condition). The most upregulated (descending signal intensity, sorted by average expression under all conditions, left panel) or downregulated (ascending signal intensity, sorted by average expression under all conditions, right panel) genes in HEPB-treated versus untreated cells are indicated with their corresponding name or systematic nomenclature on the right side of each panel. Genes highlighted with a blue asterisk are those that are transcriptionally modulated by activation of transcription factor Tac1p (20), while genes highlighted with a red asterisk are those involved in amino acid biosynthesis. Heat maps were constructed using Genesis version 1.8.1 (50). (B) K-means profile plots of 2 selected clusters (cluster 1, 118 genes, upper panel and cluster 2, 83 genes, lower panel) out of 10 clusters generated through mining of the complete transcript profiling data set (Table S1) using Genesis version 1.8.1 (50). The expression dynamics of each gene (log2-transformed ratios, gray line) are plotted on the y axis, whereas the experimental condition is indicated on the x axis (bottom). (C) GO term enrichment scores (black bars, representing the negative value of log10 transformed P values shown on the x axis) of the significantly enriched functional categories (P value <0.05) among the 118 and 83 genes from K-means clusters 1 (upper chart) and 2 (lower chart), respectively. The GO terminologies are indicated on the y axis. The number of genes belonging to each GO terminology are indicated between parentheses.
To independently validate our data, C. albicans cells were regrown in the presence of HEPB at 1.0× MIC for 0, 10, 30, and 60 min, followed by total RNA extraction, reverse transcription, and qPCR analysis (Fig. S1 and see Materials and Methods). We tested the expression of ARG1 and LEU1 together with GCN4, encoding a key regulator of amino acid biosynthesis (23), at time points 10, 30, and 60 min relative to time point 0 min using ACT1 as an endogenous control (Fig. S1 and see Materials and Methods). The three genes were upregulated at all three time points, with ARG1 and GCN4 displaying a gradual increase in their expression levels over time (Fig. S1).
We suggest that HEPB exposure impairs the integrity of amino acid/protein metabolism in C. albicans, possibly through alteration of amino acid biosynthesis with a consequence on protein synthesis/folding.
C. albicans antimicrobial susceptibility is not altered upon exposure to HEPB.
Because HEPB treatment transcriptionally induced a Tac1p-mediated multidrug resistance response (Fig. 2A), we sought to determine whether such transcriptional induction can translate into acquisition of antifungal resistance in C. albicans. We hypothesized that induction of the Tac1p-mediated multidrug resistance pathway may be a transient adaptive response to preservative treatment, a commonly observed detoxification mechanism when yeast cells are exposed to unrelated toxic compounds (24).
We first tested whether HEPB treatment could favor the development of HEPB resistance in C. albicans, using a predictive protocol that allows to evaluate the propensity of microorganisms to develop resistance to antimicrobials (see Materials and Methods). We found that 24-h exposure to HEPB (0.1% wt/vol) did not alter the susceptibility of C. albicans strain ATCC 10231 to HEPB (Table 2). Next, we exposed strain ATCC 10231 to HEPB under the same growth conditions and determined its susceptibility to a panel of 9 antifungal agents (Table 2). While a 2-fold increase in 5-flucytosine MIC was detected (Table 2), the susceptibility of C. albicans to the remaining major antifungal agents (including azoles) was unaffected, indicating that although a Tac1p-mediated transcriptional response was induced by HEPB, no significant alterations in antifungal drug susceptibility were subsequently observed.
TABLE 2.
Antifungal and HEPB susceptibilities of C. albicans ATCC 10231 (MIC, μg/ml ± standard deviation) after 24-h exposure to 0.1% HEPB (wt/vol, n = 3)
| Treatmenta | HEPB | AND | AB | MF | CAS | FC | PZ | VOR | IZ | FZ |
|---|---|---|---|---|---|---|---|---|---|---|
| −HEPB | 5 mg/ml ± 0.00 | 0.10 ± 0.03 | 0.50 ± 0.00 | 0.015 ± 0.00 | 0.06 ± 0.00 | 0.12 ± 0.00 | 0.06 ± 0.00 | 0.06 ± 0.00 | 0.25 ± 0.00 | 2.00 ± 0.00 |
| +HEPB | 5 mg/ml ± 0.00 | 0.10 ± 0.03 | 0.50 ± 0.03 | 0.015 ± 0.00 | 0.06 ± 0.00 | 0.25 ± 0.00 | 0.06 ± 0.00 | 0.06 ± 0.00 | 0.25 ± 0.00 | 2.00 ± 0.00 |
Treatment: −HEPB, no addition of HEPB; +HEPB, addition of 0.1% HEPB (wt/vol); HEPB, ethylzingerone; AND, anidulafungin; AB, amphotericin B; MF, micafungin; CAS, caspofungin; FC, 5-flucytosine; PZ, posaconazole; VOR, voriconazole; IZ, itraconazole; FZ, fluconazole.
Comparative transcriptomic analyses.
To determine the extent of specificity of C. albicans transcriptional response to HEPB exposure compared to that which could be induced by treatment with unrelated chemical preservatives, we equivalently exposed strain SC5314 to MPB (2 mg/ml, 0.4× MIC and 5 mg/ml, 1.0× MIC) and TCS (0.006 mg/ml, 0.1× MIC and 0.062 mg/ml, 1.0× MIC) during 10, 30, and 60 min (see Materials and Methods). We analyzed the resulting transcript profiling data using hierarchical clustering. As shown in Fig. 3, the transcriptomes of HEPB-treated cells were clearly distinct from those of cells treated with MPB and TCS, except for the transcriptomes of cells treated at low doses of MPB during 30 and 60 min (Fig. 3), which cluster with those of 1.0× MIC HEPB-exposed cells at time points 30 and 60 min. Such a similarity could be explained, at least in part, by the common induction of strong Tac1p- and Cap1p-mediated transcriptional signatures following HEPB and MPB treatments (Table S1). This indicates that although HEPB (fungicidal) and MPB (fungistatic) seem to exert different antifungal activities on C. albicans (Fig. 1B), consistent with distinct modes of action, they may share some common effects on the C. albicans transcriptome. Taken together, comparative analysis of the transcriptomes of C. albicans cells exposed to HEPB, MPB, and TCS suggests distinct mechanisms of antifungal activities of the three compounds, supported by little overlap between their transcriptional signatures.
FIG 3.

Comparative analysis of the transcriptomics data. Hierarchical clustering using average linkage WPGMA (clustering of both genes and conditions) showing the relationships between the distinct 18 compound treatments (top). Each gene is represented by a rectangle colored according to the level of upregulation (red) or downregulation (green) as indicated in the colored scale showing adjusted maximal (+5.0) and minimal (−5.0) log2-transformed ratios. The relatedness between conditions is shown on the upper cladogram, whereas relatedness between gene expression profiles is indicated on the left cladogram. The hierarchical clustering heatmap was generated using Genesis version 1.8.1 (50).
Large-scale phenotypic profiling in S. cerevisiae links HEPB mode of action to tryptophan availability.
We performed phenotypic profiling of all nonessential gene deletion strains of the haploid S. cerevisiae mutant collection (25) in rich medium supplemented with HEPB (see Materials and Methods). We hypothesized that our screen would identify a set of genes whose individual deletion sensitizes cells to HEPB treatment, thus providing information on the metabolic or cellular pathways that are most important in tolerating the toxic activity of HEPB. The pool of mutants was grown for 11 generations in the absence or presence of 0.937 mg/ml or 1.25 mg/ml HEPB, and the relative abundance for each mutant was quantified using barcode microarrays (see Materials and Methods). Strikingly, the trp1Δ strain was the most sensitive mutant among all 4,885 competing S. cerevisiae strains, followed by strains deleted for SOD1, GCN4, ERG2, and DAL81 (Fig. 4A and Table S2). The abundance of additional strains carrying deletions in genes involved in aromatic amino acid biosynthesis (ARO7, ARO3) was also decreased following HEPB treatment (Fig. 4A and Table S2). We hypothesized that HEPB exerts its inhibitory activity by directly or indirectly blocking pathways involved in tryptophan cellular availability and tested whether tryptophan addition to HEPB-containing growth medium rescues the defective growth of the trp1Δ mutant (Fig. 4B). As shown in Fig. 4B, tryptophan supplementation restored the generation time of HEPB-treated trp1Δ mutant to levels similar to those observed in the wild-type strain, contrasting with the nonaddition of tryptophan (Fig. 4B, compare “−” white versus gray bars to “+” white versus gray bars). We also confirmed the specific requirement of exogenous tryptophan for restoring significant growth levels of the trp1Δ mutant in the presence of HEPB, unlike the addition of tyrosine, phenylalanine, or leucine (Fig. 4C, purple curve).
FIG 4.
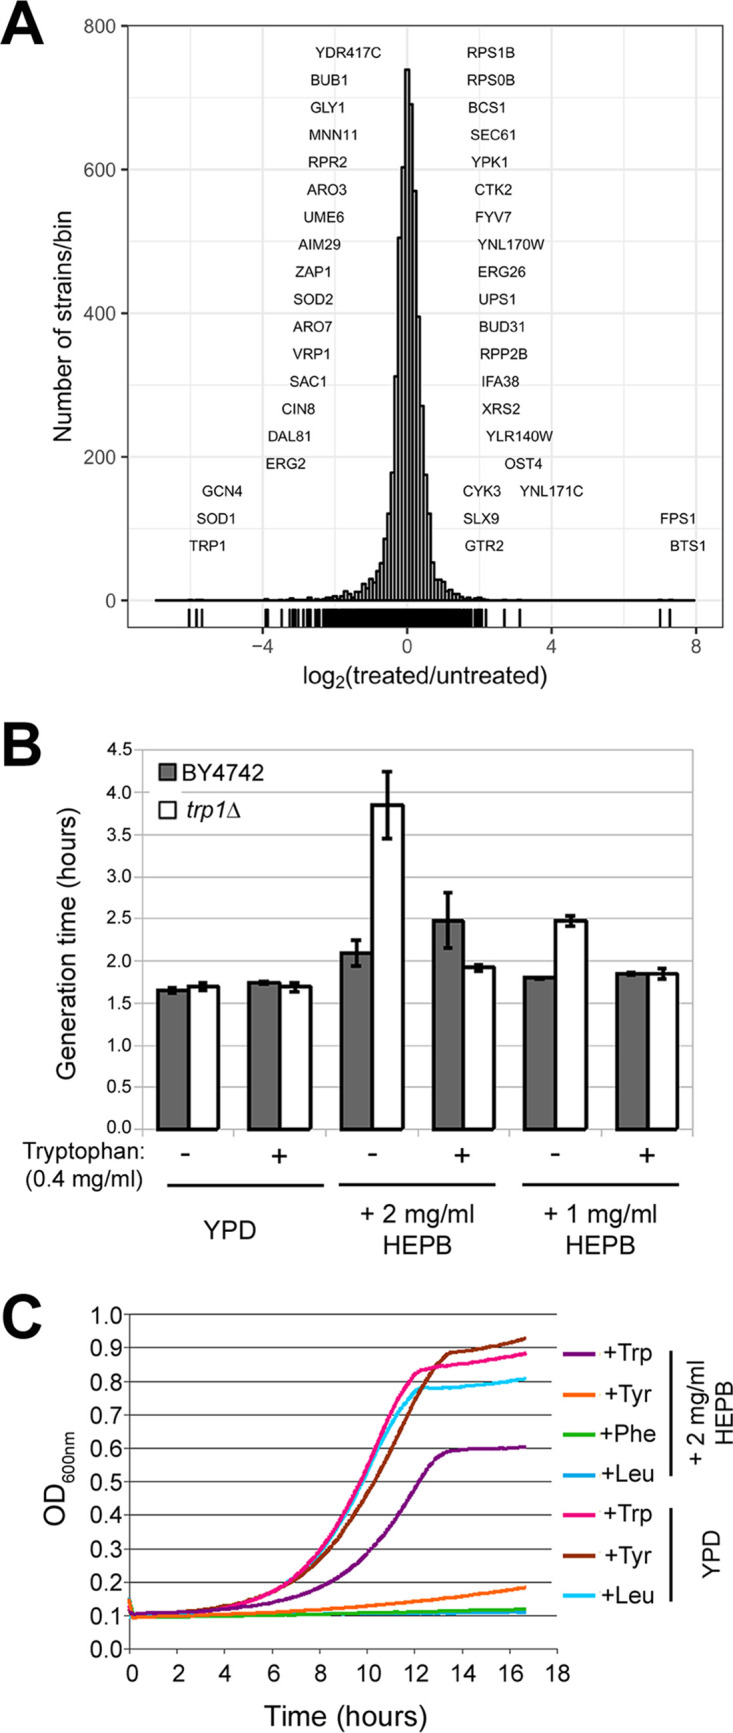
Phenotypic profiling in S. cerevisiae links HEPB mode of action to tryptophan availability. (A) Histogram depicting the relative abundance of each group of S. cerevisiae mutants (histogram bins) measured as the log2-transformed ratio of barcode signal intensity in HEPB-treated samples (n = 3) compared to untreated control sample (x axis). The number of strains per histogram bin are shown on the y axis. Mutants with significantly decreased abundance following HEPB treatment are shown on the left part of the histogram, whereas those with increased relative abundance are shown on the right part of the histogram. (B) Parental BY4742 (gray bar) and the trp1Δ mutant derivative (white bar) were grown in the absence (−) or presence (+) of 0.4 mg/ml tryptophan in YPD medium (YPD) supplemented (+2 mg/ml HEPB, +1 mg/ml HEPB) or not (YPD) with 2 mg/ml or 1 mg/ml HEPB. Generation times (in hours) of each strain under each condition are indicated on the y axis calculated as the mean of 3 independently grown cultures with error bars denoting standard deviations. (C) Growth curves of the trp1Δ mutant grown in YPD medium (YPD) or in YPD medium supplemented with 2 mg/ml HEPB (+2 mg/ml HEPB) are depicted in different colors depending on the identity of the amino acid being added to the growth medium. Turbidity (OD600, y axis) was recorded every 5 min as a function of time (hours, x axis) in a Tecan Sunrise device.
Chemical-genetic interaction profile of HEPB displays little overlap with that of TCS and MPB.
To evaluate the extent at which the trp1Δ mutant phenotype is specific to HEPB growth-inhibitory activity, we also performed fitness profiling of the whole set of S. cerevisiae mutant collection in the presence of TCS (15 and 20 μg/ml) and MPB (300 and 400 μg/ml, Table S2). We found that none of these two unrelated preservatives strongly affected the growth of the trp1Δ mutant (Fig. 5, bottom row). Similarly, growth of the gcn4Δ, cin8Δ, and sac1Δ mutants was not significantly altered by TCS or MPB treatments (Fig. 5). However, the dal81Δ and aro7Δ mutants were sensitive to MPB, suggesting a link between the mode of action of MPB and amino acid metabolism. On the other hand, sensitivity of the sod1Δ and sod2Δ mutants to HEPB and MPB is likely to be linked to induction of oxidative stress by both chemicals, clearly reflected in our transcript profiling data where activation of Cap1p-mediated pathway was observed (Fig. 2).
FIG 5.

Chemical-genetic interactions of TCS and MPB with S. cerevisiae mutants that are sensitive to HEPB. Fitness profiling matrix displaying the relative abundance of mutant strains sod2Δ, aro7Δ, vrp1Δ, sac1Δ, cin8Δ, dal81Δ, erg2Δ, gcn4Δ, sod1Δ, and trp1Δ following exposure to TCS (15 and 20 μg/ml), MPB (300 and 400 μg/ml), and HEPB (937 and 1,250 μg/ml). Fitness defect intensities (numerical values) are also displayed as colored squares, according to the color scale shown at the bottom of the panel. Negative values indicate decreased abundance of the corresponding mutant.
Taken together, our fitness profiling experiments in S. cerevisiae show that HEPB interferes specifically with aromatic amino acid availability, rendering cells that cannot synthesize tryptophan hypersensitive to its growth-inhibitory activity.
C. albicans trp1Δ/trp1Δ and gcn4Δ/gcn4Δ mutants are sensitive to HEPB treatment.
Our finding that deletion of TRP1 enhances the susceptibility of S. cerevisiae to HEPB treatment, compared to the parental BY4742 wild-type strain (Fig. 4B), fostered us to test whether a C. albicans trp1Δ/trp1Δ mutant displays a similar phenotype under the same growth conditions. We therefore exposed both C. albicans trp1Δ/trp1Δ and parental TRP1/TRP1 strains to 5 mg/ml HEPB in YPD medium and measured their generation time in the presence or absence of HEPB (Fig. 6A). In the absence of HEPB, both trp1Δ/trp1Δ and parental TRP1/TRP1 strains displayed similar growth rate (Fig. 6A, YPD). Exposure to HEPB increased generation time of the TRP1/TRP1 strain and further increased that of the trp1Δ/trp1Δ mutant (Fig. 6A, 5 mg/ml HEPB), phenocopying the S. cerevisiae trp1Δ mutant (Fig. 4B).
FIG 6.

C. albicans trp1Δ/trp1Δ and gcn4Δ/gcn4Δ mutants are sensitive to HEPB treatment. (A) Parental CAI4 (TRP1/TRP1, gray bar) and the trp1Δ/trp1Δ mutant derivative (white bar) were grown in YPD medium supplemented (5 mg/ml HEPB) or not (control) with 5 mg/ml HEPB. Generation time (in hours) of each strain under each condition are indicated on the y axis, calculated as the mean of values from 3 independently grown cultures with error bars denoting standard deviations. Asterisk, P < 0.05 based on a Welch’s t test comparing mean values of the trp1Δ/trp1Δ mutant to those of the parental strain TRP1/TRP1 in the presence of HEPB (5 mg/ml HEPB). (B) HEPB susceptibility of strains DAY286, gcn4Δ/gcn4Δ (gcn4−/−), and SC5314 was tested by spot assay on YPD plates supplemented (or not supplemented, left panel, control) with 12.5 mg/ml of HEPB (12.5 mg/ml HEPB, right panel). Plates were incubated at 30°C for 3 days.
Another S. cerevisiae mutant whose growth was significantly altered by HEPB treatment is the gcn4Δ strain (Fig. 4A). GCN4 encodes a key transcription factor that controls the amino acid biosynthesis pathway in S. cerevisiae and C. albicans (23, 26). We hypothesized that a C. albicans gcn4Δ/gcn4Δ mutant would be susceptible to HEPB treatment. We tested growth of both gcn4Δ/gcn4Δ mutant and parental GCN4/GCN4 strain, together with the SC5314 strain by spot assay on YPD medium in the presence or absence of HEPB (Fig. 6B). In the absence of HEPB, the three strains displayed similar growth pattern, albeit with a slight advantage for SC5314 (Fig. 6B, left panel). Addition of 12.5 mg/ml of HEPB significantly altered growth of the C. albicans gcn4Δ/gcn4Δ mutant, compared to that of strains DAY286 (parental) and SC5314.
Taken together, our results indicate that, like in S. cerevisiae, HEPB treatment interferes with amino acid biosynthesis in C. albicans.
DISCUSSION
We used complementary functional genomics approaches to propose a potential mechanism of action of a new preservative candidate with antifungal activity, HEPB. Genome-wide expression analyses provide insights into gene function or pathways and circuits activated upon applying environmental perturbations. When a chemical stress is exerted on cells, it induces transcriptional changes reflecting both general and specific responses of the organism to alteration of one or more biological pathways that are affected by treatment with the chemical. In our case, HEPB treatment led to a transcriptional signature reflective of a potent detoxification response controlled by the multidrug resistance regulator Tac1 (Fig. 2 and Table S1), which we propose as a general response to chemical treatment. This response does not translate into the acquisition of stable HEPB or antifungal resistance phenotypes (Table 2), reinforcing the notion that the Tac1 response pathway is a transient adaptation mechanism to the toxicity of HEPB. However, HEPB treatment generated an early, sustained, and more specific transcriptional response, reflected in the upregulation of many genes involved in amino acid biosynthesis (Fig. 2 and Table S1), suggesting that alteration of amino acid biosynthesis and/or availability is one of the mechanisms that could explain HEPB growth-inhibitory activity. Such transcriptional signatures can originate from the specific inhibition of the direct target of HEPB or could be part of a response that is tightly linked to the mode of action of HEPB. Based on previous investigations on the mode of action of antifungals, one could expect that inhibition of the function of a target would lead to increased expression of the genes that function in a common pathway with the target as a result of a compensatory transcriptional response due to reduced activity of the target (27–30). Our K-means analyses are in agreement with such expectations, as we clearly detect the enrichment of functional categories pertaining to amino acid biosynthesis and/or availability among genes that are upregulated, both early and late, following exposure to HEPB (Fig. 2B and C). A series of transcriptional profiles from cells treated with unrelated compounds, in our case TCS and MPB (Fig. 3), further delineated the extent of specificity of the C. albicans transcriptional response to HEPB treatment and allowed to discriminate, to some extent, the specific responses from the general ones, narrowing down the list of pathways that could be involved in HEPB’s mechanism of action.
Our transcriptional analyses could have been compared to a set of transcript profiling data of C. albicans gene deletion or gene overexpression strains, allowing to establish and refine chemical-gene associations and improve the inference of HEPB’s mode of action. One nice example reflecting this approach is the study by Hughes et al., in which gene expression profiles of yeast cells treated with both known and unknown drugs were compared with a compendium of transcript profiles from an array of yeast deletion mutants (31). The study particularly identified the mode of action of dyclonine, a topical anesthetic with antimicrobial properties (31). In our case, we directly focused on phenotypes rather than transcriptional signatures and used chemogenomic analyses of the S. cerevisiae haploid knockout collection (Fig. 4), since an equivalent collection in C. albicans is not yet available to the scientific community. Our genetic approach is still powerful, since it allows to map, on the nonessential genome scale, genes whose loss of function chemically interacts with HEPB. It also focuses on genes whose deletion strongly sensitizes cells to HEPB treatment, providing a complementary strategy to transcript profiling for the characterization of the mode of action of HEPB (32). Unlike the heterozygous S. cerevisiae deletion, which carries individual deletions of both essential and nonessential genes, our assay does not allow to identify the direct target of HEPB, which might be expected to have an essential role. However, it is relevant for the identification of subsets of genes and pathways that modulate HEPB sensitivity (i.e., displaying buffering interactions), which are required for growth in the presence of the chemical (32). It also can mimic a double-deletion mutant context, whereby one gene is deleted and the function of the second is altered through chemical inhibition by HEPB. We could have used the C. albicans GRACE (gene replacement and conditional expression) collection (33); however, it relies on tetracycline derivatives to turn off gene expression, which may chemically interfere with HEPB. In the event that HEPB does not directly target a protein, our phenotypic assay can still identify protein-encoding genes that are involved in the synthesis, import/trafficking, or metabolism of HEPB target(s). Clearly, complementary approaches to transcriptomics and chemogenomics are needed for the precise identification of the direct target(s) of HEPB.
One of the mechanisms that could potentially explain the requirement of tryptophan to rescue the severe growth defect of the S. cerevisiae trp1Δ mutant in the presence of HEPB may involve direct inhibition of one of the enzymes involved in tryptophan biosynthesis or alteration of the function of proteins involved in tryptophan transport into the cell. Our data argue in favor of a decrease in the pool of amino acids following HEPB treatment, as we detected the upregulation of many genes involved in amino acid biosynthesis as well as the activation of the amino acid starvation regulator GCN4 in our transcript profiling data (Fig. S1 and S2 and Table S1) (26). Furthermore, the gcn4Δ strain was among the most depleted mutants following treatment with HEPB (Fig. 4A), reflecting the need for an efficient response to amino acid starvation in HEPB-treated cells. In addition to trp1Δ, gcn4Δ, aro7Δ, aro3Δ, and gly1Δ (Fig. 4A), the list of S. cerevisiae mutants that are sensitive to HEPB included strains with deletions in PRS3, involved in the synthesis of phosphoribosyl pyrophosphate (PRPP, required for nucleotide, histidine, and tryptophan biosynthesis) (34), TAT1, encoding a low-affinity transporter for histidine and tryptophan (35), and TKL1, coding for a transketolase required for the synthesis of erythrose-4-phosphate, a precursor of the aromatic amino acids (36) (Table S2 and Fig. 7). The biosynthetic processes of the aromatic amino acids tryptophan, tyrosine, and phenylalanine are linked together by the shikimate pathway (37) (Fig. 7). Phosphoenolpyruvate and erythrose 4-phosphate, deriving from glycolysis and the pentose phosphate pathway, enter into a series of reactions involving the activity of the Aro1-4 enzymes, whose final product is chorismate, the common precursor for the synthesis of the other two main metabolites, prephenate (via Aro7) and anthranilate (via Trp2 and Trp3, Fig. 7). The first (prephenate) generates tyrosine and phenylalanine, and the last (anthranilate) produces tryptophan following a sequence of enzymatic reactions involving Trp4 (requires PRPP), Trp1, Trp3, and Trp5 (37) (Fig. 7). Almost all HEPB-sensitive mutants with a role in amino acid metabolism are deficient in key enzymes of the aromatic amino acid biosynthetic pathway described above (trp1Δ, aro7Δ, aro3Δ, prs3Δ, and tkl1Δ, Fig. 7), further reinforcing our hypothesis that HEPB exerts a potent perturbation of aromatic amino acid homeostasis and that tryptophan availability plays a key role in the HEPB growth-inhibitory effect.
FIG 7.

Simplified schematic representation of the aromatic amino acid biosynthetic pathway. A sequence of enzymatic reactions encoded by many ARO and TRP genes are crucial for the biosynthesis of aromatic amino acids. Specific steps from the pentose phosphate pathway (top box, left) and glycolysis (top box, right) generate erythrose-4-phosphate and phosphoenolpyruvate, which are processed by the products of ARO and TRP genes to generate tryptophan (whose chemical structure is shown at the bottom right), tyrosine, and phenylalanine. Tryptophan can also be taken up from the medium owing to the activity of a low-affinity permease encoded by TAT1 (gray oval). Genes with a role in amino acid biosynthesis whose deletion strongly sensitizes S. cerevisiae to HEPB treatment are colored in red.
Our comparative analyses indicate that HEPB’s mode of action is quite distinct from that of two commonly used preservatives, MPB and TCS (Fig. 1, 3, and 5). Still, our transcript profiling experiments detected partial overlapping responses in C. albicans cells exposed to HEPB and MPB (Fig. 3). Both chemicals elicited Tac1- and Cap1-mediated transcriptional signatures and induced the expression of a subset of genes involved in amino acid biosynthesis (Table S1). We also observed some correlations between the chemogenomic profiles of HEPB- and MPB-treated cells (Fig. 5 and Table S2), yet these two chemicals, which respectively have fungicidal and fungistatic activities on C. albicans (Fig. 1B), have distinct modes of action. Few studies have addressed the mechanisms through which MPB and TCS exert their antifungal activities. MPB was shown to perturb microbial membrane function (8), and its effect on microbial membranes was recently tested in two-dimensional lipid systems, called the Langmuir monolayers (38), mimicking Staphylococcus aureus, Pseudomonas aeruginosa, and C. albicans membranes. Although MPB was shown to be more active against fungi than against bacteria, the strongest destructive effect of MPB was observed on bacterial membranes (38), suggesting that MPB may act differently on C. albicans. Our transcriptomic analyses in C. albicans pointed to perturbation of carbohydrate metabolism and activation of filamentous growth following MPB treatment, whereas chemogenomics data did not clearly identify cellular processes that were significantly affected by MPB. Unexpectedly, TCS treatment sensitized yeast mutants linked to mitochondrial function (Table S2). In line with an alteration of mitochondrial activity, our transcriptomics data revealed that many genes involved in oxidation/reduction processes were upregulated upon TCS treatment (Table S1). It is possible that respiration is a major factor that allows cells to survive in the presence of TCS. The potential molecular basis of this phenomenon is not known; however, TCS was shown to inhibit FabI, an enoyl-acyl carrier protein reductase important for the synthesis of fatty acids in bacteria (7). Eukaryotes have two different fatty acid synthesis systems, one of which is mitochondrial, similar to the bacterial system, and essential for respiration (39). Our results together with the previous knowledge on the mechanism of action of TCS in E. coli (6, 7) may indicate that, in yeast, the preservative affects mitochondrial fatty acid synthesis, leading to respiratory failure.
MATERIALS AND METHODS
Strains, media, and chemicals.
C. albicans strains SC5314 (40), ATCC 10231 (41), CAI4 and CAI4t (trp1Δ/trp1Δ) (42), and DAY286 and CJN913 (gcn4Δ/gcn4Δ) (43), Candida glabrata strains BG2 (44) and CBS138 (45), and S. cerevisiae strains BY4741 and BY4742 (46) were used in this study. Strains were routinely grown at 30°C in YPD medium (1% yeast extract, 2% peptone, 2% glucose) or synthetic dextrose (SD) minimal medium (0.67% yeast nitrogen base without amino acids [Difco], 2% glucose) supplemented with 2% agar in case of growth on a solid medium. RPMI 1640 (Gibco, supplemented with 2% glucose, buffered with 0.165 M morpholinepropanesulfonic acid [MOPS], and adjusted to pH 7 with NaOH) or SD (buffered with 0.165 M MOPS and adjusted to pH 7 with NaOH) media were used for MIC90 determinations. Stock solutions of ethylzingerone (HEPB, 0.5 g/ml), triclosan (TCS, 1.0 g/ml), and methylparaben (MPB, 1.0 g/ml), all provided by L’Oréal, France, were prepared in dimethyl sulfoxide (or in ethanol, for fitness profiling experiments in S. cerevisiae).
Evaluation of the antifungal activities of HEPB, TCS, and MPB.
MIC assays were determined in flat-bottom microtiter plates according to the EUCAST method (47) with an inoculum of 1 × 10⁵ cells/ml using C. albicans strains SC5314 and ATCC 10231, C. glabrata strains BG2 and CBS138, and S. cerevisiae strains BY4741 and BY4742. MIC90 were determined in triplicate at 30°C in YPD, SD pH 5.4, and RPMI pH 7.0, as well as in RPMI pH 7.0 at 37°C. To determine killing curves of MPB, TCS, and HEPB, an overnight culture of C. albicans strain SC5314 was diluted to an optical density at 600 nm (OD600) of 0.05 and grown to an OD600 of 0.4 in YPD, and the culture was treated with various concentrations of each compound or with an equal volume of solvent. Cells were sampled after 0, 10, 30, and 60 min of exposure, washed, diluted 105 times, and plated on preservative-free YPD plates for CFU counting. Killing curves were performed in duplicate. CFU at time zero were normalized to 100% and CFU of other time points were calculated relative to CFU obtained at time zero.
Microarray experiments.
Gene expression analyses of the C. albicans laboratory strain SC5314 were performed by comparing planktonic cells with and without exposure to HEPB (0.4 × and 1.0 × MIC90), TCS (0. 1 × and 1.0 × MIC90), or MPB (0.4 × and 1.0 × MIC90). For each compound and concentration, an exponentially grown C. albicans culture in YPD medium at 30°C was exposed to the compound and samples were collected after 10, 30, and 60 min for transcript profiling. Total RNA was isolated using the RNeasy minikit (Qiagen, Courtaboeuf, France) according to the manufacturer’s instructions. The concentration, purity, and integrity of the isolated RNA were evaluated using a Nanodrop spectrophotometer (Thermo Fisher, Illkirch, France) and an Agilent 2100 Bioanalyzer (Agilent Technologies, Waldbronn, Germany). We used the microarray technology at the time the project was initiated and RNA samples were obtained (2010). cDNA synthesis, labeling, and hybridization on C. albicans microarrays (Agilent 026869) were performed as described in Zeidler et al. (48). Sample comparisons at 10, 30, and 60 min were performed using at least two biological replicates, and each biological replicate was subjected to technical replication with dye swaps.
Microarray data analysis.
Microarray scans were generated using a GenePix 4000A scanner and data were acquired using the GenePix 5 software. Data analysis was carried out using Arraypipe (49) and Genesis version 1.8.1 (50). Data were normalized using the LOESS (locally estimated scatterplot smoothing) method, and statistical analyses were conducted using Welch’s t tests. We used the August 2017 annotation from the Candida Genome Database (CGD) (51) and converted the orf19 nomenclature from Assembly 19 to the new Assembly 22 nomenclature (Table S1). Some oligonucleotides on the microarrays (Assembly 19) did not match any ORF in the current version of CGD (Assembly 22), as some genes have been removed from CGD or their coordinates modified. Data for these oligonucleotides were not analyzed further. The genes whose mRNA level changed by at least 2-fold with a P value <0.05 were considered significantly modulated. Microarray data have been deposited at ArrayExpress under accession number E-MTAB-7908. Normalized data are available in Table S1. Gene ontology analyses were performed using the GO term finder tool available at the Candida Genome Database, with P values calculated as described in Boyle et al. (52), and enrichment scores were calculated as the negative values of the log10-transformed P values (P value cutoff used was 0.05). K-means (10 clusters, 50 iterations, and 5 runs with 20 randomizations for testing variable dependence) and hierarchical (average linkage WPGMA [weighted pair group method with arithmetic mean]) clustering were performed using the Genesis software (50).
Confirmation of transcriptomics data by RT-qPCR analysis.
Strain SC5314 was grown three times independently to an OD600 of 0.8 in YPD medium at 30°C, before being exposed to 10 mg/ml of HEPB (1.0× MIC) for 10, 30, and 60 min. Twenty OD units were withdrawn at each time point for RNA extraction (for time point 0 min, samples were withdrawn prior to addition of HEPB to the growth medium). Total RNA was extracted using the RNeasy Mini kit (Qiagen) according to the manufacturer’s instructions. cDNA was synthetized from 1 μg of total RNA using the QuantiTect Reverse transcription kit (Qiagen). The qPCRs (20 μl) were made of 5 μl of cDNA (25 ng) combined with 1 μl of primer mix at 10 pmol/μl each (forward and reverse primers of the selected genes), 10 μl of 2× SsoAdvanced universal SYBR green supermix (Bio-Rad), and 4 μl of H2O. Reactions were processed in a Hard-Shell 96-well PCR plate (Bio-Rad) using a CFX96 real-time PCR instrument (Bio-Rad) with 1 cycle at 50°C for 2 min, 1 cycle at 95°C for 10 min, and 40 cycles at 95°C for 15 sec and 59°C for 1 min, followed by melting-curve generation to rule out amplification of unspecific products. Levels of relative gene expression (n-fold) for the HEPB-treated samples at time points 10, 30, and 60 min compared to time point 0 min of ARG1 (forward primer 5′-GTGAAGTTAGAGCCATCAGAGATCAA-3′ and reverse primer 5′-TGAACGAACGTATTCTCCTTCTGG-3′) (53), GCN4 (forward primer 5′-CCAGAAATGCAAAAGGCTTC-3′ and reverse primer 5′-GACTTTGGCTCCGTCCATAA-3′) (54), and LEU1 (forward primer 5′-GCTCCAAAGGGACAAGAATGGG-3′ and reverse primer 5′-GTTGCTGGGTCTGGGACACT-3′) (55) were calculated using the 2−ΔΔCT method (amplification of ACT1 serving as an endogenous control gene with forward primer 5′-TATGAAAGTTAAGATTATTGCTCCACCAGAAA-3′ and reverse primer 5′-GGAAAGTAGACAATGAAGCCAAGATAGAAC-3′) (56), as follows: ΔCT = CT(selected gene) − CT(ACT1 reference gene), calculated for each treatment time point, and ΔΔCT = ΔCT(HEPB-treated samples) − ΔCT(time point 0 min sample). Assays were performed using 3 biological replicates. A two-tailed Student’s t test was applied by comparing, for a given gene, the n-fold relative gene expression values between treatment time points (10, 30, and 60 min, Fig. S1). Statistical significance threshold was P < 0.05.
Antifungal susceptibility testing following exposure to HEPB.
This protocol was previously validated to evaluate antimicrobial susceptibility profile before and after exposure to an antimicrobial in “during use” conditions (57–59). Briefly, a test suspension of ∼107 C. albicans ATCC 10231 cells was prepared in 1 ml of tryptone sodium chloride (TSC, 1.0 g/liter tryptone, 8.5 g/liter NaCl) medium. This suspension (1 ml) was added to 9 ml of HEPB (diluted in H2O) at 1.25 times the required concentration (0.1% wt/vol) and incubated for 24 h at 20°C. Following exposure, C. albicans cells were filtered through a 0.2-μm filter and washed with 5 ml neutralizer (1.5% vol/vol Tween 80 and 3% wt/vol lecithin, Fisher Scientific), then with 5 ml TSC. The filter was placed in a bottle with 5 ml TSC and 5 g of glass beads, then vortexed for 1 min to recover survivors. Antifungal susceptibility testing was performed 3 times independently, using the colorimetric microdilution assay Sensititre YeastOne with Micafungin and Anidulafungin (YO10) system (ThermoFisher Scientific, UK) following the manufacturer’s recommendations. MIC values were determined for anidulafungin, amphotericin B, micafungin, caspofungin, 5-flucytosine, posaconazole, voriconazole, itraconazole, and fluconazole (Table 2). Susceptibility to HEPB was tested by determining MIC before and after 0.1% HEPB (wt/vol) exposure using the BS EN ISO: 20776-1 (2006) microdilution protocol. The highest HEPB concentration tested of 2% wt/vol corresponded to ∼3× the prospective in-use concentration in formulae. The MIC was taken as the lowest concentration of HEPB that showed no growth after 24 h of incubation at 25°C.
Fitness assay with a barcoded haploid S. cerevisiae knockout collection.
Fitness assays were performed with 4,885 S. cerevisiae haploid deletion mutants from the systematic deletion collection as described in Giaever et al. (background strain BY4741) (25). Mutants were grown individually in 96 deep-well plates at 30°C for 2 days in YPD medium, pooled, and aliquots were stored at −80°C. We did an initial growth test for S. cerevisiae in YPD medium at 30°C with 5 different concentrations of TCS, MPB, and HEPB, all solubilized in pure ethanol as stock solutions. Final concentrations used for the fitness assay were as follows: HEPB, 3.4 mM (700 mg/liter), MPB, 1.95 mM (300 mg/liter), and TCS, 51 μM (15 mg/liter). The pool of mutants was grown for 11 generations in the absence or presence of each preservative, and growth of individual strains in the different cultures was determined by amplifying, labeling, and hybridizing the barcodes on custom barcode microarrays (Agilent G2509F - AMADID N°026035) as described in detail in Malabat and Saveanu (60). Briefly, genomic DNA from the collected cells was extracted with phenol-chloroform by extensive vortexing in the presence of glass beads (425 to 600 nm size). Primers U1 and KU (Table S3) were used to amplify the upstream barcodes and primers KD and D1 (Table S3) to amplify the downstream barcodes. Twenty-five cycles of PCR with an annealing temperature of 50°C were used. The resulting PCR products were verified by electrophoresis on an agarose gel and used in a labeling PCR with the Cy3 or Cy5 5′-labeled oligonucleotides U2comp (Table S3) for the upstream tags and D2comp (Table S3) for the downstream tags and unlabeled U1 and D1 as a control. Only 15 cycles of amplification were used in the labeling step. The labeled PCR products were mixed and precipitated in the presence of linear acrylamide and of a mixture of complementary oligonucleotides (U1, D1, U2block, and D2block, Table S3) in 4-fold molar excess to avoid binding of the fluorescently labeled oligonucleotides to the microarray probes. Hybridization was performed using the DIG Easy Hyb buffer (Roche Applied Science) at 24°C, overnight, in a rotating Agilent hybridization chamber. The slides were washed in decreasing concentrations of SSPE buffer (10 mM potassium phosphate [pH 7.4], 150 mM NaCl, 0.5 mM EDTA, 0.05% [wt/vol] Triton X-100) down to 0.2× SSPE, dried, and treated immediately with the Agilent stabilization and drying solution to avoid ozone-induced degradation of the Cy5 fluorophore. Scanning was performed on a Genepix 4200AL scanner, and the images were analyzed using Axon Genepix Pro 7. We filtered the data according to our previous estimates of the reliability of the microarray signal. Filtered data were normalized using the LOESS algorithm (R package marray, Bioconductor) (61) separately for signals coming from upstream or downstream barcodes. The average of the values for the upstream barcode and the downstream barcode was calculated. The log2 of the ratio between the signal obtained for a given mutant growing with and without preservative was used as an estimate of the drug’s effect on the growth rate of the mutant. Data processing and statistical analyses were performed using R package (http://cran.r-project.org/). The complete data set of the fitness profiling data was deposited at Gene Expression Omnibus database under accession number GSE125353.
Spot and liquid growth assays.
Fitness assay data were validated using individually grown S. cerevisiae or C. albicans mutants in 96-well plates. Cells were grown three times independently with agitation in a Tecan Sunrise plate reader at 30°C in YPD medium, and optical densities at 600 nm were recorded every 5 to 10 min, followed by growth curve generation and calculation of doubling times as described previously (62). The S. cerevisiae (parental BY4742 and the trp1Δ mutant derivative) and C. albicans (parental CAI4 and the trp1Δ/trp1Δ mutant derivative CAI4t [42], kindly provided by Bernard Turcotte) strains were cultured in the absence or presence of 2 mg/ml and 5 mg/ml HEPB, respectively. Amino acids were added to the S. cerevisiae cultures at a final concentration of 2 mM. For spot assays, C. albicans strains DAY286, the gcn4Δ/gcn4Δ mutant derivative (43), and SC5314 were resuspended in water to an OD600 of 0.1. Tenfold serial dilutions of each strain were spotted onto YPD plates supplemented with 12.5 mg/ml of HEPB. The plates were incubated for 3 days at 30°C.
Data availability.
Microarray data have been deposited at ArrayExpress under accession number E-MTAB-7908. The complete data set of the fitness profiling data was deposited at Gene Expression Omnibus database under accession number GSE125353.
Supplementary Material
ACKNOWLEDGMENTS
The authors thank Bernard Turcotte and Aaron Mitchell for providing the C. albicans trp1Δ/trp1Δ and gcn4Δ/gcn4Δ mutants. We are indebted to Charlotte Tacheau for technical help in omics analyses, Patricio Guerreiro for funding assistance, Isabelle Castiel for scientific publication assistance, Gabriel Ahmad Khodr for draft reviewing, Émilie Bierque for technical assistance, and Alain Jacquier for helpful discussions.
This work has been supported by grants from L’Oréal (to C.D., C.S., and J.Y.M.), the French Government’s Investissements d’Avenir program (Laboratoire d’Excellence Integrative Biology of Emerging Infectious Diseases, ANR-10-LABX-62-IBEID to C.D.), and the Agence Nationale de la Recherche (ANR-08-JCJC-0019-01/GENO-GIM to C.S.). S.Z. is an Institut Pasteur International Network Affiliate Program Fellow.
This research was funded by L’Oréal, France. Scientists at L’Oréal, France, have been involved in validating the study design proposed by scientists at Institut Pasteur and Cardiff University, in discussing the results obtained by scientists at Institut Pasteur and Cardiff University, and in commenting on the manuscript prepared by scientists at Institut Pasteur and Cardiff University. Scientists at L’Oréal, France, are coauthors of the manuscript or acknowledged for their contributions.
Footnotes
Supplemental material is available online only.
REFERENCES
- 1.Chiu CH, Huang SH, Wang HM. 2015. A review: hair health, concerns of shampoo ingredients and scalp nourishing treatments. Curr Pharm Biotechnol 16:1045–1052. doi: 10.2174/1389201016666150817094447. [DOI] [PubMed] [Google Scholar]
- 2.Halla N, Fernandes IP, Heleno SA, Costa P, Boucherit-Otmani Z, Boucherit K, Rodrigues AE, Ferreira I, Barreiro MF. 2018. Cosmetics preservation: a review on present strategies. Molecules 23:1571. doi: 10.3390/molecules23071571. [DOI] [PMC free article] [PubMed] [Google Scholar]
- 3.Leyva Salas M, Mounier J, Valence F, Coton M, Thierry A, Coton E. 2017. Antifungal microbial agents for food biopreservation-a review. Microorganisms 5:37. doi: 10.3390/microorganisms5030037. [DOI] [PMC free article] [PubMed] [Google Scholar]
- 4.Yazar K, Johnsson S, Lind ML, Boman A, Liden C. 2011. Preservatives and fragrances in selected consumer-available cosmetics and detergents. Contact Dermat 64:265–272. doi: 10.1111/j.1600-0536.2010.01828.x. [DOI] [PubMed] [Google Scholar]
- 5.Weatherly LM, Gosse JA. 2017. Triclosan exposure, transformation, and human health effects. J Toxicol Environ Health B Crit Rev 20:447–469. doi: 10.1080/10937404.2017.1399306. [DOI] [PMC free article] [PubMed] [Google Scholar]
- 6.Levy CW, Roujeinikova A, Sedelnikova S, Baker PJ, Stuitje AR, Slabas AR, Rice DW, Rafferty JB. 1999. Molecular basis of triclosan activity. Nature 398:383–384. doi: 10.1038/18803. [DOI] [PubMed] [Google Scholar]
- 7.McMurry LM, Oethinger M, Levy SB. 1998. Triclosan targets lipid synthesis. Nature 394:531–532. doi: 10.1038/28970. [DOI] [PubMed] [Google Scholar]
- 8.Soni MG, Taylor SL, Greenberg NA, Burdock GA. 2002. Evaluation of the health aspects of methyl paraben: a review of the published literature. Food Chem Toxicol 40:1335–1373. doi: 10.1016/s0278-6915(02)00107-2. [DOI] [PubMed] [Google Scholar]
- 9.Fransway AF, Fransway PJ, Belsito DV, Warshaw EM, Sasseville D, Fowler JF, Jr, DeKoven JG, Pratt MD, Maibach HI, Taylor JS, Marks JG, Mathias CGT, DeLeo VA, Zirwas JM, Zug KA, Atwater AR, Silverberg J, Reeder MJ. 2019. Parabens. Dermatitis 30:3–31. doi: 10.1097/DER.0000000000000429. [DOI] [PubMed] [Google Scholar]
- 10.Sasseville D, Alfalah M, Lacroix JP. 2015. “Parabenoia” Debunked, or “Who’s Afraid of Parabens?”. Dermatitis 26:254–259. doi: 10.1097/DER.0000000000000147. [DOI] [PubMed] [Google Scholar]
- 11.Bernauer U, Scientific Committee of Consumer Safety - SCCS. 2017. Opinion of the Scientific Committee on Consumer Safety (SCCS) - final version of the opinion on ethylzingerone – ‘hydroxyethoxyphenyl butanone’ (HEPB) - cosmetics Europe no P98 - in cosmetic products. Regul Toxicol Pharmacol 88:330–331. doi: 10.1016/j.yrtph.2017.04.014. [DOI] [PubMed] [Google Scholar]
- 12.Bernauer U, Bodin L, Chaudhry Q, Coenraads P, Dusinska M, Ezendam J, Gaffet E, Galli CL, Granum BB, Panteri E, Rogiers V, Rousselle C, Stępnik M, Vanhaecke T, Wijnhoven S, Koutsodimou A, Simonnard A, Uter W. 2019. Opinion of the Scientific Committee On Consumer Safety (SCCS) - opinion on ethylzingerone – ‘hydroxyethoxyphenyl butanone’ (HEPB) - cosmetics Europe no P98 - CAS no 569646-79-3 - submission II (eye irritation). Regul Toxicol Pharmacol 107:104393. doi: 10.1016/j.yrtph.2019.05.018. [DOI] [PubMed] [Google Scholar]
- 13.Kundu JK, Na HK, Surh YJ. 2009. Ginger-derived phenolic substances with cancer preventive and therapeutic potential. Forum Nutr 61:182–192. doi: 10.1159/000212750. [DOI] [PubMed] [Google Scholar]
- 14.Kumar L, Chhibber S, Kumar R, Kumar M, Harjai K. 2015. Zingerone silences quorum sensing and attenuates virulence of Pseudomonas aeruginosa. Fitoterapia 102:84–95. doi: 10.1016/j.fitote.2015.02.002. [DOI] [PubMed] [Google Scholar]
- 15.Dao H, Lakhani P, Police A, Kallakunta V, Ajjarapu SS, Wu KW, Ponkshe P, Repka MA, Narasimha Murthy S. 2018. Microbial stability of pharmaceutical and cosmetic products. AAPS PharmSciTech 19:60–78. doi: 10.1208/s12249-017-0875-1. [DOI] [PubMed] [Google Scholar]
- 16.Mundy RD, Cormack B. 2009. Expression of Candida glabrata adhesins after exposure to chemical preservatives. J Infect Dis 199:1891–1898. doi: 10.1086/599120. [DOI] [PMC free article] [PubMed] [Google Scholar]
- 17.Znaidi S. 2015. Strategies for the identification of the mode-of-action of antifungal drug candidates., p 183–209. In Coste AT, Vendeputte P (ed), Antifungals: from Genomics to Resistance and the Development of Novel Agents. Caister Academic Press, Norfolk, UK. [Google Scholar]
- 18.Kashem SW, Kaplan DH. 2016. Skin immunity to Candida albicans. Trends Immunol 37:440–450. doi: 10.1016/j.it.2016.04.007. [DOI] [PMC free article] [PubMed] [Google Scholar]
- 19.Kuhbacher A, Burger-Kentischer A, Rupp S. 2017. Interaction of Candida Species with the Skin. Microorganisms 5:32. doi: 10.3390/microorganisms5020032. [DOI] [PMC free article] [PubMed] [Google Scholar]
- 20.Liu TT, Znaidi S, Barker KS, Xu L, Homayouni R, Saidane S, Morschhauser J, Nantel A, Raymond M, Rogers PD. 2007. Genome-wide expression and location analyses of the Candida albicans Tac1p regulon. Eukaryot Cell 6:2122–2138. doi: 10.1128/EC.00327-07. [DOI] [PMC free article] [PubMed] [Google Scholar]
- 21.Znaidi S, Barker KS, Weber S, Alarco AM, Liu TT, Boucher G, Rogers PD, Raymond M. 2009. Identification of the Candida albicans Cap1p regulon. Eukaryot Cell 8:806–820. doi: 10.1128/EC.00002-09. [DOI] [PMC free article] [PubMed] [Google Scholar]
- 22.Ljungdahl PO, Daignan-Fornier B. 2012. Regulation of amino acid, nucleotide, and phosphate metabolism in Saccharomyces cerevisiae. Genetics 190:885–929. doi: 10.1534/genetics.111.133306. [DOI] [PMC free article] [PubMed] [Google Scholar]
- 23.Tripathi G, Wiltshire C, Macaskill S, Tournu H, Budge S, Brown AJ. 2002. Gcn4 co-ordinates morphogenetic and metabolic responses to amino acid starvation in Candida albicans. EMBO J 21:5448–5456. doi: 10.1093/emboj/cdf507. [DOI] [PMC free article] [PubMed] [Google Scholar]
- 24.Fardeau V, Lelandais G, Oldfield A, Salin H, Lemoine S, Garcia M, Tanty V, Le Crom S, Jacq C, Devaux F. 2007. The central role of PDR1 in the foundation of yeast drug resistance. J Biol Chem 282:5063–5074. doi: 10.1074/jbc.M610197200. [DOI] [PubMed] [Google Scholar]
- 25.Giaever G, Chu AM, Ni L, Connelly C, Riles L, Véronneau S, Dow S, Lucau-Danila A, Anderson K, André B, Arkin AP, Astromoff A, El-Bakkoury M, Bangham R, Benito R, Brachat S, Campanaro S, Curtiss M, Davis K, Deutschbauer A, Entian K-D, Flaherty P, Foury F, Garfinkel DJ, Gerstein M, Gotte D, Güldener U, Hegemann JH, Hempel S, Herman Z, Jaramillo DF, Kelly DE, Kelly SL, Kötter P, LaBonte D, Lamb DC, Lan N, Liang H, Liao H, Liu L, Luo C, Lussier M, Mao R, Menard P, Ooi SL, Revuelta JL, Roberts CJ, Rose M, Ross-Macdonald P, Scherens B, et al. 2002. Functional profiling of the Saccharomyces cerevisiae genome. Nature 418:387–391. doi: 10.1038/nature00935. [DOI] [PubMed] [Google Scholar]
- 26.Hinnebusch AG. 2005. Translational regulation of GCN4 and the general amino acid control of yeast. Annu Rev Microbiol 59:407–450. doi: 10.1146/annurev.micro.59.031805.133833. [DOI] [PubMed] [Google Scholar]
- 27.Lee REB, Liu TT, Barker KS, Lee RE, Rogers PD. 2005. Genome-wide expression profiling of the response to ciclopirox olamine in Candida albicans. J Antimicrob Chemother 55:655–662. doi: 10.1093/jac/dki105. [DOI] [PubMed] [Google Scholar]
- 28.Liu TT, Lee REB, Barker KS, Lee RE, Wei L, Homayouni R, Rogers PD. 2005. Genome-wide expression profiling of the response to azole, polyene, echinocandin, and pyrimidine antifungal agents in Candida albicans. Antimicrob Agents Chemother 49:2226–2236. doi: 10.1128/AAC.49.6.2226-2236.2005. [DOI] [PMC free article] [PubMed] [Google Scholar]
- 29.Niewerth M, Kunze D, Seibold M, Schaller M, Korting HC, Hube B. 2003. Ciclopirox olamine treatment affects the expression pattern of Candida albicans genes encoding virulence factors, iron metabolism proteins, and drug resistance factors. Antimicrob Agents Chemother 47:1805–1817. doi: 10.1128/aac.47.6.1805-1817.2003. [DOI] [PMC free article] [PubMed] [Google Scholar]
- 30.Te Welscher YM, van Leeuwen MR, de Kruijff B, Dijksterhuis J, Breukink E. 2012. Polyene antibiotic that inhibits membrane transport proteins. Proc Natl Acad Sci U S A 109:11156–11159. doi: 10.1073/pnas.1203375109. [DOI] [PMC free article] [PubMed] [Google Scholar]
- 31.Hughes TR, Marton MJ, Jones AR, Roberts CJ, Stoughton R, Armour CD, Bennett HA, Coffey E, Dai H, He YD, Kidd MJ, King AM, Meyer MR, Slade D, Lum PY, Stepaniants SB, Shoemaker DD, Gachotte D, Chakraburtty K, Simon J, Bard M, Friend SH. 2000. Functional discovery via a compendium of expression profiles. Cell 102:109–126. doi: 10.1016/S0092-8674(00)00015-5. [DOI] [PubMed] [Google Scholar]
- 32.Giaever G, Nislow C. 2014. The yeast deletion collection: a decade of functional genomics. Genetics 197:451–465. doi: 10.1534/genetics.114.161620. [DOI] [PMC free article] [PubMed] [Google Scholar]
- 33.Roemer T, Jiang B, Davison J, Ketela T, Veillette K, Breton A, Tandia F, Linteau A, Sillaots S, Marta C, Martel N, Veronneau S, Lemieux S, Kauffman S, Becker J, Storms R, Boone C, Bussey H. 2003. Large-scale essential gene identification in Candida albicans and applications to antifungal drug discovery. Mol Microbiol 50:167–181. doi: 10.1046/j.1365-2958.2003.03697.x. [DOI] [PubMed] [Google Scholar]
- 34.Carter AT, Beiche F, Hove-Jensen B, Narbad A, Barker PJ, Schweizer LM, Schweizer M. 1997. PRS1 is a key member of the gene family encoding phosphoribosylpyrophosphate synthetase in Saccharomyces cerevisiae. Mol Gen Genet 254:148–156. doi: 10.1007/s004380050402. [DOI] [PubMed] [Google Scholar]
- 35.Schmidt A, Hall MN, Koller A. 1994. Two FK506 resistance-conferring genes in Saccharomyces cerevisiae, TAT1 and TAT2, encode amino acid permeases mediating tyrosine and tryptophan uptake. Mol Cell Biol 14:6597–6606. doi: 10.1128/mcb.14.10.6597. [DOI] [PMC free article] [PubMed] [Google Scholar]
- 36.Sundstrom M, Lindqvist Y, Schneider G, Hellman U, Ronne H. 1993. Yeast TKL1 gene encodes a transketolase that is required for efficient glycolysis and biosynthesis of aromatic amino acids. J Biol Chem 268:24346–24352. doi: 10.1016/S0021-9258(20)80532-8. [DOI] [PubMed] [Google Scholar]
- 37.Braus GH. 1991. Aromatic amino acid biosynthesis in the yeast Saccharomyces cerevisiae: a model system for the regulation of a eukaryotic biosynthetic pathway. Microbiol Rev 55:349–370. doi: 10.1128/MR.55.3.349-370.1991. [DOI] [PMC free article] [PubMed] [Google Scholar]
- 38.Flasiński M, Kowal S, Broniatowski M, Wydro P. 2018. Influence of parabens on bacteria and fungi cellular membranes: studies in model two-dimensional lipid systems. J Phys Chem B 122:2332–2340. doi: 10.1021/acs.jpcb.7b10152. [DOI] [PubMed] [Google Scholar]
- 39.Hiltunen JK, Schonauer MS, Autio KJ, Mittelmeier TM, Kastaniotis AJ, Dieckmann CL. 2009. Mitochondrial fatty acid synthesis type II: more than just fatty acids. J Biol Chem 284:9011–9015. doi: 10.1074/jbc.R800068200. [DOI] [PMC free article] [PubMed] [Google Scholar]
- 40.Gillum AM, Tsay EY, Kirsch DR. 1984. Isolation of the Candida albicans gene for orotidine-5'-phosphate decarboxylase by complementation of S. cerevisiae ura3 and E. coli pyrF mutations. Mol Gen Genet 198:179–182. doi: 10.1007/BF00328721. [DOI] [PubMed] [Google Scholar]
- 41.Lingappa BT, Prasad M, Lingappa Y, Hunt DF, Biemann K. 1969. Phenethyl alcohol and tryptophol: autoantibiotics produced by the fungus Candida albicans. Science 163:192–194. doi: 10.1126/science.163.3863.192. [DOI] [PubMed] [Google Scholar]
- 42.Lebel K, MacPherson S, Turcotte B. 2006. New tools for phenotypic analysis in Candida albicans: the WAR1 gene confers resistance to sorbate. Yeast 23:249–259. doi: 10.1002/yea.1346. [DOI] [PubMed] [Google Scholar]
- 43.Nobile CJ, Mitchell AP. 2009. Large-scale gene disruption using the UAU1 cassette. Methods MolBiol 499:175–194. [DOI] [PMC free article] [PubMed] [Google Scholar]
- 44.Cormack BP, Falkow S. 1999. Efficient homologous and illegitimate recombination in the opportunistic yeast pathogen Candida glabrata. Genetics 151:979–987. [DOI] [PMC free article] [PubMed] [Google Scholar]
- 45.Koszul R, Malpertuy A, Frangeul L, Bouchier C, Wincker P, Thierry A, Duthoy S, Ferris S, Hennequin C, Dujon B. 2003. The complete mitochondrial genome sequence of the pathogenic yeast Candida (Torulopsis) glabrata. FEBS Lett 534:39–48. doi: 10.1016/s0014-5793(02)03749-3. [DOI] [PubMed] [Google Scholar]
- 46.Brachmann CB, Davies A, Cost GJ, Caputo E, Li J, Hieter P, Boeke JD. 1998. Designer deletion strains derived from Saccharomyces cerevisiae S288C: a useful set of strains and plasmids for PCR-mediated gene disruption and other applications. Yeast 14:115–132. doi: 10.1002/(SICI)1097-0061(19980130)14:2<115::AID-YEA204>3.0.CO;2-2. [DOI] [PubMed] [Google Scholar]
- 47.Cuenca-Estrella M, Arendrup MC, Chryssanthou E, Dannaoui E, Lass-Florl C, Sandven P, Velegraki A, Rodriguez-Tudela JL. 2007. Multicentre determination of quality control strains and quality control ranges for antifungal susceptibility testing of yeasts and filamentous fungi using the methods of the antifungal susceptibility testing subcommittee of the European committee on antimicrobial susceptibility testing (AFST-EUCAST). Clin Microbiol Infect 13:1018–1022. doi: 10.1111/j.1469-0691.2007.01790.x. [DOI] [PubMed] [Google Scholar]
- 48.Zeidler U, Bougnoux ME, Lupan A, Helynck O, Doyen A, Garcia Z, Sertour N, Clavaud C, Munier-Lehmann H, Saveanu C, d’Enfert C. 2013. Synergy of the antibiotic colistin with echinocandin antifungals in Candida species. J Antimicrob Chemother 68:1285–1296. doi: 10.1093/jac/dks538. [DOI] [PubMed] [Google Scholar]
- 49.Hokamp K, Roche FM, Acab M, Rousseau ME, Kuo B, Goode D, Aeschliman D, Bryan J, Babiuk LA, Hancock RE, Brinkman FS. 2004. ArrayPipe: a flexible processing pipeline for microarray data. Nucleic Acids Res 32:W457–W459. doi: 10.1093/nar/gkh446. [DOI] [PMC free article] [PubMed] [Google Scholar]
- 50.Sturn A, Quackenbush J, Trajanoski Z. 2002. Genesis: cluster analysis of microarray data. Bioinformatics 18:207–208. doi: 10.1093/bioinformatics/18.1.207. [DOI] [PubMed] [Google Scholar]
- 51.Skrzypek MS, Binkley J, Binkley G, Miyasato SR, Simison M, Sherlock G. 2017. The Candida Genome Database (CGD): incorporation of Assembly 22, systematic identifiers and visualization of high throughput sequencing data. Nucleic Acids Res 45:D592–D596. doi: 10.1093/nar/gkw924. [DOI] [PMC free article] [PubMed] [Google Scholar]
- 52.Boyle EI, Weng S, Gollub J, Jin H, Botstein D, Cherry JM, Sherlock G. 2004. GO::TermFinder–open source software for accessing Gene Ontology information and finding significantly enriched Gene Ontology terms associated with a list of genes. Bioinformatics 20:3710–3715. doi: 10.1093/bioinformatics/bth456. [DOI] [PMC free article] [PubMed] [Google Scholar]
- 53.Nett JE, Lepak AJ, Marchillo K, Andes DR. 2009. Time course global gene expression analysis of an in vivo Candida biofilm. J Infect Dis 200:307–313. doi: 10.1086/599838. [DOI] [PMC free article] [PubMed] [Google Scholar]
- 54.Sundaram A, Grant CM. 2014. A single inhibitory upstream open reading frame (uORF) is sufficient to regulate Candida albicans GCN4 translation in response to amino acid starvation conditions. RNA 20:559–567. doi: 10.1261/rna.042267.113. [DOI] [PMC free article] [PubMed] [Google Scholar]
- 55.De Cremer K, De Brucker K, Staes I, Peeters A, Van den Driessche F, Coenye T, Cammue BP, Thevissen K. 2016. Stimulation of superoxide production increases fungicidal action of miconazole against Candida albicans biofilms. Sci Rep 6:27463. doi: 10.1038/srep27463. [DOI] [PMC free article] [PubMed] [Google Scholar]
- 56.Cabral V, Znaidi S, Walker LA, Martin-Yken H, Dague E, Legrand M, Lee K, Chauvel M, Firon A, Rossignol T, Richard ML, Munro CA, Bachellier-Bassi S, d’Enfert C. 2014. Targeted changes of the cell wall proteome influence Candida albicans ability to form single- and multi-strain biofilms. PLoS Pathog 10:e1004542. doi: 10.1371/journal.ppat.1004542. [DOI] [PMC free article] [PubMed] [Google Scholar]
- 57.Maillard JY, Bloomfield S, Coelho JR, Collier P, Cookson B, Fanning S, Hill A, Hartemann P, McBain AJ, Oggioni M, Sattar S, Schweizer HP, Threlfall J. 2013. Does microbicide use in consumer products promote antimicrobial resistance? A critical review and recommendations for a cohesive approach to risk assessment. Microb Drug Resist 19:344–354. doi: 10.1089/mdr.2013.0039. [DOI] [PubMed] [Google Scholar]
- 58.Knapp L, Amezquita A, McClure P, Stewart S, Maillard JY. 2015. Development of a protocol for predicting bacterial resistance to microbicides. Appl Environ Microbiol 81:2652–2659. doi: 10.1128/AEM.03843-14. [DOI] [PMC free article] [PubMed] [Google Scholar]
- 59.Wesgate R, Grasha P, Maillard JY. 2016. Use of a predictive protocol to measure the antimicrobial resistance risks associated with biocidal product usage. Am J Infect Control 44:458–464. doi: 10.1016/j.ajic.2015.11.009. [DOI] [PubMed] [Google Scholar]
- 60.Malabat C, Saveanu C. 2016. Identification of links between cellular pathways by genetic interaction mapping (GIM). Methods Mol Biol 1361:325–343. doi: 10.1007/978-1-4939-3079-1_18. [DOI] [PubMed] [Google Scholar]
- 61.Gentleman RC, Carey VJ, Bates DM, Bolstad B, Dettling M, Dudoit S, Ellis B, Gautier L, Ge Y, Gentry J, Hornik K, Hothorn T, Huber W, Iacus S, Irizarry R, Leisch F, Li C, Maechler M, Rossini AJ, Sawitzki G, Smith C, Smyth G, Tierney L, Yang JY, Zhang J. 2004. Bioconductor: open software development for computational biology and bioinformatics. Genome Biol 5:R80. doi: 10.1186/gb-2004-5-10-r80. [DOI] [PMC free article] [PubMed] [Google Scholar]
- 62.St Onge RP, Mani R, Oh J, Proctor M, Fung E, Davis RW, Nislow C, Roth FP, Giaever G. 2007. Systematic pathway analysis using high-resolution fitness profiling of combinatorial gene deletions. Nat Genet 39:199–206. doi: 10.1038/ng1948. [DOI] [PMC free article] [PubMed] [Google Scholar]
Associated Data
This section collects any data citations, data availability statements, or supplementary materials included in this article.
Supplementary Materials
Data Availability Statement
Microarray data have been deposited at ArrayExpress under accession number E-MTAB-7908. The complete data set of the fitness profiling data was deposited at Gene Expression Omnibus database under accession number GSE125353.