Abstract
Restenosis is one of the main adverse effects of the treatment of atherosclerosis through balloon angioplasty or stenting. During the intervention, the arterial wall is overstretched, causing a cascade of cellular events and subsequent neointima formation. This mechanical stimulus and its mechanobiological effects can be reproduced in biomechanical simulations. The aim of these models is to predict the long-term outcome of these procedures, to help increase the understanding of restenosis formation and to allow for in silico optimization of the treatment. We propose a predictive finite-element model of restenosis, using the homogenized constrained mixture modelling framework designed to model growth and remodelling in soft tissues. We compare the results with clinical observations in human coronary arteries and experimental findings in non-human primate models. We also explore the model’s clinical relevance by testing its response to different balloon loads and to the use of drug-eluting balloons. The comparison of the results with experimental data shows the relevance of the model. We show its ability to predict both inward and outward remodelling as observed in vivo and we show the importance of an improved understanding of restenosis formation from a biomechanical point of view.
Keywords: restenosis, balloon angioplasty, finite-element modelling, homogenized constrained mixture theory, vascular remodelling
1. Introduction
Endovascular treatment is a widespread approach to treat coronary and peripheral artery disease, commonly caused by atherosclerosis. Balloon angioplasty widens the partially blocked vessel. Afterwards, when necessary, a stent is placed in the affected region to avoid elastic recoil of the vessel. Despite advantages, such as the high success rate immediately after the procedure and its minimally invasive nature, the long-term outcomes are more problematic.
Restenosis, or the re-narrowing of the treated vessel, either within the stent or following angioplasty, is caused by an inflammatory response due to overstretching of the arterial wall and endothelial denudation. Arterial smooth muscle cells (SMCs) in the media dedifferentiate into their synthetic phenotype, while becoming more proliferative and migratory, causing a significant thickening of the intima, called neointimal hyperplasia [1]. Reported restenosis rates range from less than 5% up to 50% in the first year, depending on the artery treated and the nature of the treatment [2]. The different treatment approaches include percutaneous transluminal angioplasty or the use of bare metal stents, drug-eluting stents or drug-eluting balloons. Drug-eluting stents show improved results [2,3]. Also the effectiveness of the use of drug-coated balloons has been shown, targeting a decreased cell proliferation, for example, in the treatment of femoropopliteal occlusive disease [4]. Further risk factors for restenosis include patient features, such as haematological indices [5], diabetes [6] and the complexity and size of the lesion [7].
Restenosis is initiated by mechanical damage after mechanical overloading. Therefore, biomechanical modelling is an important tool in the improved understanding of the formation of restenosis and to optimize surgical procedures. A predictive model can relate the mechanical stimulus on the arterial wall during treatment to the tissue damage and consequent long-term restenosis. A number of predictive models for restenosis have been developed. The most basic model contains a single mathematical equation, defining the number of SMCs over time [8].
Tahir et al. [9] used the complex automata approach by Caiazzo et al. [10], and later improved their model by adding more complex biological phenomena [11–13]. The logistic growth predicted during in-stent restenosis results from a complex interaction between multiple single-scale models, predicting inner elastic lamina rupture based on the hoop stress after stent deployment, blood flow through lattice Boltzmann modelling and SMC growth with an agent-based model. Boyle et al. [14] also combined multiple modelling approaches by iterating between a finite-element model predicting wall stress and an agent-based model predicting SMC growth.
Most finite-element models related to angioplasty and stenting only predict acute outcomes, and, more specifically, the damage inflicted on the arterial wall [15–17]. More recently, finite-element modelling has also been directed to the long-term development of restenosis. Fereidoonnezhad et al. [18] presented a kinematic growth model, where the overall growth of the wall is based on a certain overloading level, and a subsequent mass increase after balloon angioplasty, inspired by Schwartz et al. [8]. He et al. [19] use a similar approach, but include tissue damage in the form of a Mullins effect and include balloon, stent and plaque geometries in their idealized model. Escuer et al. [20] present a two-dimensional axisymmetric finite-element model of tissue growth after stent implantation, taking into account multiple aspects of an inflammation reaction mechanism.
Although the latter model is a more biofidelic approach to capturing the mechanobiological phenomena, all these models still lack the advantages of the constrained mixture modelling framework for growth and remodelling of soft tissue [21]. It allows for a more reliable representation of arterial biomechanics, since every constituent in the material has a specific rest length and can grow and remodel independently. To benefit from this increased biofidelity, along with the relatively low computational cost of kinematic growth models [22], a hybrid approach was presented and used, known as the homogenized constrained mixture model [23–25].
This approach will be used in the present study to predict restenosis after balloon angioplasty. The feasibility of combining existing growth and remodelling laws with the homogenized constrained mixture model will be explored, as well as the clinical relevance and the ability to match existing long-term measurements of restenosis development in coronary [26] and iliac [27] arteries.
2. Methods
2.1. Homogenized constrained mixture model
2.1.1. Elastic deformation gradient
In this study, arterial tissue is modelled as a constrained mixture of multiple constituents that behave as hyperelastic materials. We consider SMCs, as well as extracellular matrix, consisting of collagen fibre families and nearly incompressible elastin. According to the homogenized constrained mixture model, the elastic deformation gradient of constituent j is [23,24]
| 2.1 |
F is the deformation gradient of the mixture as a whole with respect to a reference configuration, usually chosen as the in vivo mechanobiologically homeostatic configuration. In this configuration, F = I and the constituents experience an elastic deformation equal to their deposition stretch, defined as Gelas and Gcoll,i for elastin and collagen fibre family i, respectively.
Fg is the inelastic growth deformation tensor for all constituents due to the deposition of new material without causing stress, and is the inelastic remodelling deformation gradient of constituent j due to the constant deposition of material at a different stretch state than the extant material. During growth and remodelling, these deformation gradients evolve as explained further in §§2.1.4 and 2.1.5.
2.1.2. Strain energy function
The total strain energy function per unit reference volume is written as
| 2.2 |
where ρelas and ρsmc are the respective mass densities with respect to the reference volume of elastin and SMCs and ρcoll,i of collagen fibre family i. Welas, Wsmc and Wcoll,i are the corresponding strain energies. Volume changes of elastin are also captured in Welas. The isochoric mechanical behaviour of elastin is defined as a neo-Hookean function and the behaviour of collagen is defined with a Fung-like exponential formulation, while the mechanical contribution of the SMCs is neglected. Therefore,
| 2.3 |
where C10, D, k1 and k2 are material parameters, and is the first invariant of the right Cauchy–Green deformation tensor related to the isochoric part of the elastic deformation gradient of elastin ,
| 2.4 |
with J the determinant of the deformation gradient of the mixture F. is a pseudo-invariant of the right Cauchy–Green tensor related to the elastic deformation gradient of collagen fibre family i aligned with Mi upon deposition. represents the square of the elastic stretch felt by the fibre. We write
| 2.5 |
Note that we use the full invariant instead of the isochoric invariant to account for realistic anisotropic behaviour in compressible deformations [28]. The two symmetrical fibre families in the circumferential—axial plane form an angle α with the circumferential direction, such that, in a cylindrical coordinate system,
| 2.6 |
2.1.3. Cauchy stress
The Cauchy stress of constituent j is
| 2.7 |
with
| 2.8 |
Therefore, with and ,
| 2.9 |
with
| 2.10 |
The total Cauchy stress of the mixture is
| 2.11 |
2.1.4. Growth
During growth the mass densities change over time. In case every constituent grows in the same direction along unit vector ag, at time t, Fg may be written as [24]
| 2.12 |
where ρtot(t) is the total mass density that can evolve through time. In the case of anisotropic growth in the wall thickness direction, in a cylindrical coordinate system
| 2.13 |
Note that, at t = 0, in the homeostatic reference configuration Fg reduces to the identity tensor.
In the case where the constituents grow in different directions, the reader is referred to Braeu et al. [24] for an alternative expression of Fg.
2.1.5. Remodelling
Ignoring migration, the rate of mass density change of constituent j can be decomposed into a rate of deposition and degradation as
| 2.14 |
From equations (12) and (15) in Cyron et al. [23], it follows that for constituent j at time t
| 2.15 |
is the time derivative of the remodelling deformation gradient and can in theory be obtained by solving the set of equations in equation (2.15). Note that, for clarity, the time dependence is not explicitly stated in the following equations. is the stress of the material at deposition rotated to the current material orientation,
| 2.16 |
knowing that J(0) = 1. The rotation tensor to the current orientation is obtained from the polar decomposition F = RU.
In the case of elastin, is always zero because elastin is not produced in mature arterial walls. Therefore, from equation (2.15), is a constant tensor, initialized with to satisfy .
The mechanical contribution of SMCs is neglected, such that equation (2.15) only needs to be solved for collagen. However, the tensor is often singular. For example, in the case of dispersed fibres, equation (2.15) yields a set of five independent equations to obtain five components of . The remaining components can be obtained for example by assuming incompressibility of the deformation and symmetry of the tensor.
In the present case, however, fibres are simplified as non-dispersed one-dimensional structures, such that only one independent equation remains. Therefore, a unique unknown , the rate of , is considered, and [23–25]
| 2.17 |
By computing the time derivative of and multiplying it with its inverse, we obtain
| 2.18 |
From equation (2.9) in index notation,
| 2.19 |
with
| 2.20 |
By projecting equation (2.15) onto the current fibre direction , i.e. performing a double contraction with mi ⊗ mi, and remembering that , we obtain the following expression for :
| 2.21 |
where
| 2.22 |
gcoll,i is the deposition stretch of collagen and its inverse is equal to the remodelling stretch at homeostasis. Therefore, and
| 2.23 |
2.2. Restenosis model
In order to obtain a complete model for restenosis, compatible with the homogenized constrained mixture approach, equation (2.14) must be made explicit for the different constituents. A model for the prediction of restenosis is presented, inspired by an existing model by Boyle et al. [14] and adapted to fit in this modelling framework. Note that we also present three additional restenosis models in appendix A.1, which are inspired by different sources, in order to assess the added value of the current approach.
Boyle et al. [14] take into account a number of agents related to growth and remodelling during restenosis and present a set of differential equations to quantify their respective presence over time. Adapted to the present modelling approach, we get
| 2.24 |
where e, m, g, d and ϕ are dimensionless entities that represent the density of extracellular matrix, matrix degrading factor, growth stimulus, damage and SMC phenotype, respectively, and kdeg, ke, km, dg, kg, kd and psmc are parameters defining the remodelling rates. d0 denotes a certain level of damage, as explained below. Two main changes are made with respect to Boyle et al. [14]. First, the production of extracellular matrix, modelled with the second term in the equation for , now assumes that extracellular matrix is produced depending on the amount of active SMCs ϕρsmc, with ϕ denoting the fraction of active synthetic SMCs. Second, the proliferation function of SMCs is based on the probability for proliferation in Boyle et al. [14], where the SMC density was not explicitly used as a variable owing to their agent-based modelling approach.
In the homeostatic state, as initial conditions, the extracellular matrix is fully intact, i.e. e(0) = 1, while m, g, d and ϕ are initially zero. The whole remodelling process is initiated by a damage parameter d0, depending on the von Mises stress σvm calculated from the total Cauchy stress tensor σtot,
| 2.25 |
with τ a negative stress-like parameter and σfl and σft the failure stress and fatigue strength, respectively. The latter is defined as a threshold below which no damage is accumulated.
In the present model, e is translated to the integrity of collagen, such that at all times t ρcoll,i(t) = e(t)ρcoll,i(0). Therefore,
| 2.26 |
where the term ρcoll,i/Tcoll,i denotes the normal turnover of collagen and the parameter Tcoll,i is related to the half life time of collagen by a factor log 2.
Elastin is the main other part of the extracellular matrix. It is assumed to degrade along with collagen. It can however not be produced, such that
| 2.27 |
The parameter values for kdeg, ke, km, dg, kg, kd, psmc, σft, σfl and τ are estimated such that the outcomes approximately match the clinical data presented by Nobuyoshi et al. [26]. The parameters kdeg, km, dg, kg and kd were introduced by Boyle et al. [14] and their values are defined per time unit. All original parameter values are multiplied by 9/11 in order to obtain time-scaled results where the peak proliferation time is closer to 52 days.
2.3. Finite-element model
In all presented simulations, the geometry of an artery is approximated by a quarter cylinder in the finite-element software Abaqus/Standard 2017. A mesh convergence study indicates the need for 12 elements through the thickness of the wall with the use of full integration hybrid hexahedral elements (C3D8H). Details of the mesh convergence study are given in appendix B. Symmetry boundary conditions are applied at the axial and circumferential cutting planes.
An overview of the main steps of the simulation is shown in figure 1. In the first part of the simulation, the in vivo homeostatic configuration is determined by applying a prestressing algorithm [29,30], resulting in the elastin deposition stretch tensor Gelas, in which the axial component is fixed. Also the collagen deposition stretch gcoll,i is fixed. These deposition stretches ensure mechanical equilibrium in the reference geometry that is loaded with the in vivo pressure P = 12 kPa, corresponding to a typical value of mean arterial pressure [31]. In the second part of the simulation, balloon angioplasty is simulated by applying a higher pressure PBA = 40 kPa to the inner surface of the artery. Then, growth and remodelling is initiated by means of the restenosis model presented in §2.2. Thereafter, the homeostatic pressure level is restored, while further growth and remodelling are simulated during 378 days.
Figure 1.
Steps of the restenosis prediction simulation. Step 1: mechanobiological homeostatic state of the artery. Step 2: inflation to balloon load and initiation of growth. Step 3: release of balloon load. Step 4: 378 days of growth.
The model is implemented in a UMAT subroutine in Abaqus/Standard 2017. Every time step is considered to last 1 day. The remodelling stretches in equation (2.21), the constituent densities and the agents in equation (2.24) are updated every time step through a forward Euler integration scheme.
2.3.1. Coronary artery
The restenosis model is run on a model of a human coronary artery with an in vivo inner radius of 1 mm [26] and a wall thickness of 0.84 mm. The outcome is compared with clinical data of the mean inner radius over time measured in 91 patients [26] in order to estimate the growth and remodelling parameters. The same outcomes are extracted from the three additional restenosis models, presented in appendix A.2.
The model is also used to predict different outcomes at different balloon loads PBA. The possibility of adapting the model to predict restenosis with the use of a drug-eluting balloon is explored as well. The eluted drug inhibits the proliferation of the SMCs. This is integrated in the model by changing (2.24)_5 into
| 2.28 |
where , such that the change to a more synthetic and proliferative phenotype of the SMCs, based on the amount of extracellular matrix, is reduced. This way, the proliferation of these cells is reduced, as targeted by the antiproliferative drugs paclitaxel or sirolimus, for example [32,33].
Table 1 gives an overview of all used parameter values. Values are either estimated based on the clinical data [26] or adopted directly from the literature.
Table 1.
Overview of the parameter values used for the simulations of balloon angioplasty and restenosis of coronary arteries.
| generala | ||
| C10 | 0.233 MPa | |
| D | 0.002 MPa−1 | |
| k1 | 0.0182 MPa | |
| k2 | 32.0 | |
| α | 1.00 rad | |
| ρelas(0) | 0.17 | |
| ρcoll,i(0) | 0.34 | |
| ρsmc(0) | 0.15 | |
| 1.044 | [34] | |
| gcoll,i | 1.05 | |
| Tcoll,i | 101.0 days | [24] |
| restenosis modelb | ||
| kdeg | 0.4 day−1 · 9/11 | [14] |
| ke | 0.0545 day−1 | |
| km | 0.04 day−1 · 9/11 | [14] |
| dg | 0.011 day−1 · 9/11 | [14] |
| kg | 0.04 day−1 · 9/11 | [14] |
| kd | 0.2 day−1 · 9/11 | [14] |
| psmc | 12.7 day−1 | |
| σft | 0.090 MPa | |
| σfl | 0.680 MPa | |
| τ | −0.50 MPa |
2.3.2. Iliac artery
The restenosis model is also tested on a human common iliac artery. A finite-element model is built with an in vivo inner radius of 5 mm and a wall thickness of 1.3 mm. The outcome is compared with experimental measurements in the iliac arteries of cynomolgus monkeys obtained by Geary et al. [27], who present a non-human primate model of restenosis. They report mean values of relative lumen area and external elastic lamina area at four time points after balloon angioplasty in four to six animals. These values are extracted and translated to values for the inner and outer rradii over time.
A number of parameter values are changed with respect to table 1, in order to obtain a more satisfactory match with the different observed time lines of remodelling. The parameters that are different with respect to §2.3.1 are given in table 2.
Table 2.
Overview of the parameter values different from table 1 used for the simulations of balloon angioplasty and restenosis of the iliac artery. Note that all parameters introduced by Boyle et al. [14] are scaled by 18/11 to match experimental data.
3. Results
3.1. Coronary artery
Figure 2 shows the evolution over time of the predicted inner and outer radii of the coronary artery after balloon angioplasty, compared with clinical observations of the inner radius [26]. Similar results for the three additional models of restenosis are given in appendix A.3.
Figure 2.
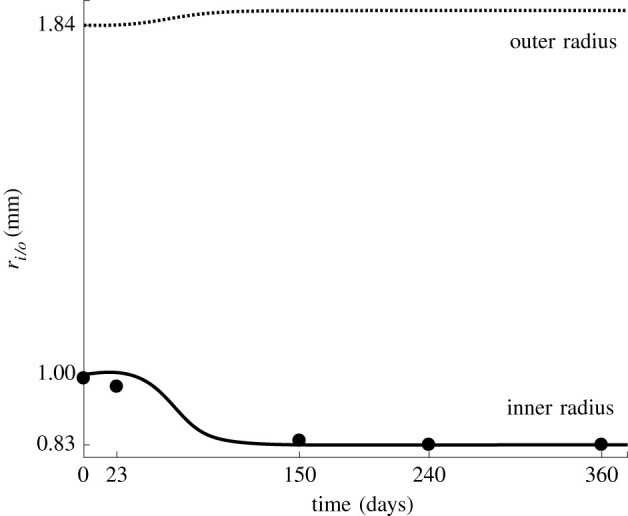
The inner radius (solid line and filled dots) and outer radius (dotted line) of the coronary artery through time. The lines represent the predicted radii, while the dots represent the clinical data as the mean value of measurements in 91 patients [26].
The sensitivity of the restenosis model to the applied balloon load is shown in figure 3, where the evolution of restenosis is shown after the application of five different balloon loads, indicated by the corresponding applied balloon pressure and resulting radial expansion. Note that, for the highest load level, the curvature change from convex to concave around 72 days is due to a slightly underdamped evolution of the SMC density, compared with an overdamped course in the lower load cases. This indicates that the dynamical system becomes less stable and more oscillatory at higher balloon loads.
Figure 3.
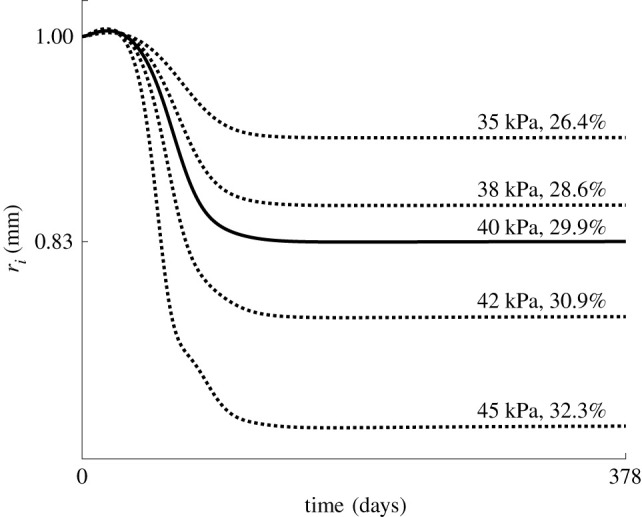
Evolution of the inner radius predicted at five different balloon loads, indicated with the applied pressure and resulting percentage increase in the radius.
The parameter d0 that initializes damage during balloon angioplasty (see equation (2.25)) is shown in figure 4 through the wall thickness for the highest and lowest tested balloon load. From the figure, it is clear that the lowest load only triggers remodelling in the two innermost elements of the wall and the highest load in four. Note that d0 is only non-zero during the application of the balloon load and is therefore only used as a trigger to initialize the tissue remodelling.
Figure 4.
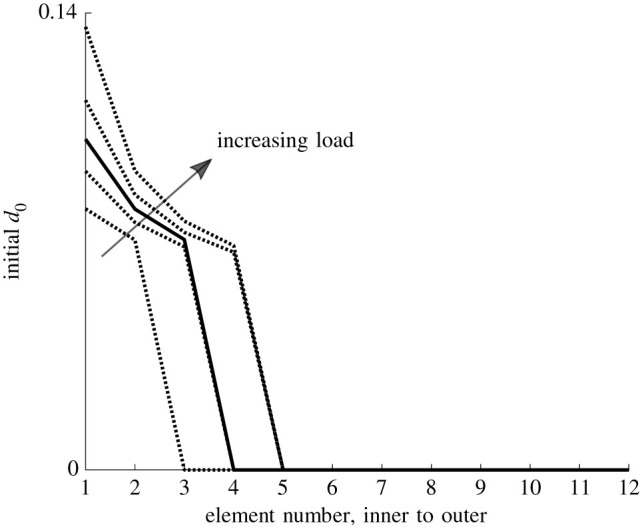
d0 during balloon inflation through the thickness of the wall. The different curves correspond to the different balloon loads as indicated in figure 3.
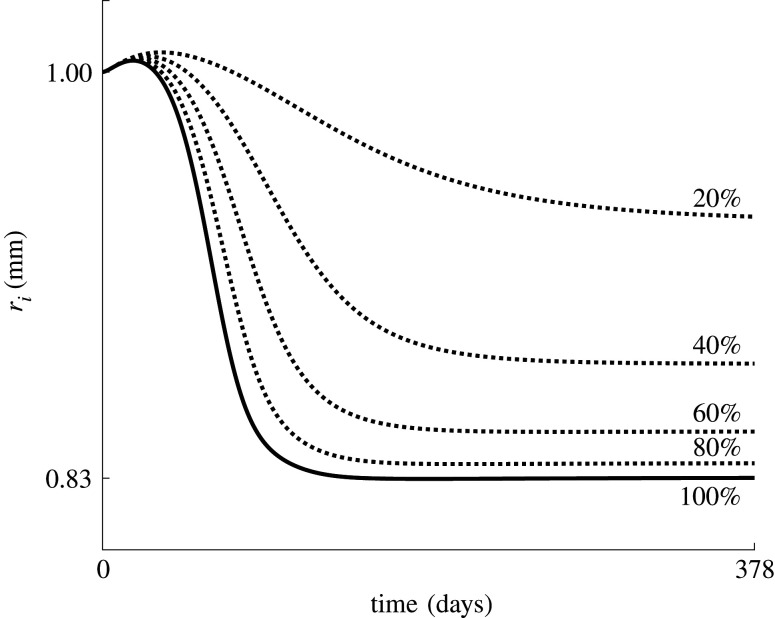
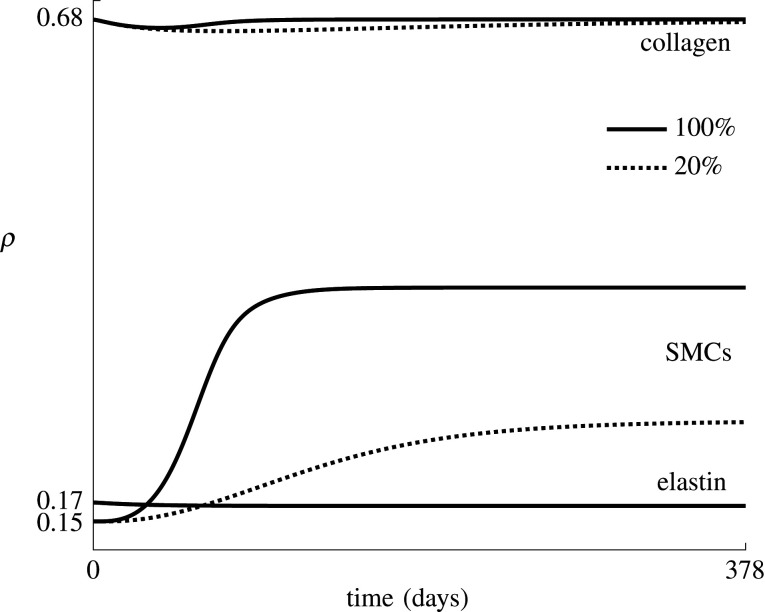
Figure 5 shows the predicted effect of the use of drug-eluting balloons, ranked based on the value of and the percentage of phenotype switch inhibition, defined as the ratio of and kd. The evolution of the densities of elastin, collagen and SMCs, ρelas, and ρsmc, is shown in figure 6 for and . Note that the two fibre families are fully symmetric and experience the same remodelling in this ideal axisymmetric geometry, such that throughout restenosis ρcoll,1 = ρcoll,2. The figure shows a clear reduction in SMC proliferation for a lower value of , also resulting in a slower restoration of the collagen density, since collagen is produced by the SMCs.
Figure 5.
Evolution of the inner radius predicted at five different levels of phenotype switch inhibition. The indicated percentages correspond to the ratio between and kd, with kd ≈ 0.16 day−1.
Figure 6.
Average collagen, elastin and SMC densities over time for a model with and without phenotype switch inhibition. The indicated percentages correspond to the ratio between and kd, with kd ≈ 0.16 day−1.
3.2. Iliac artery
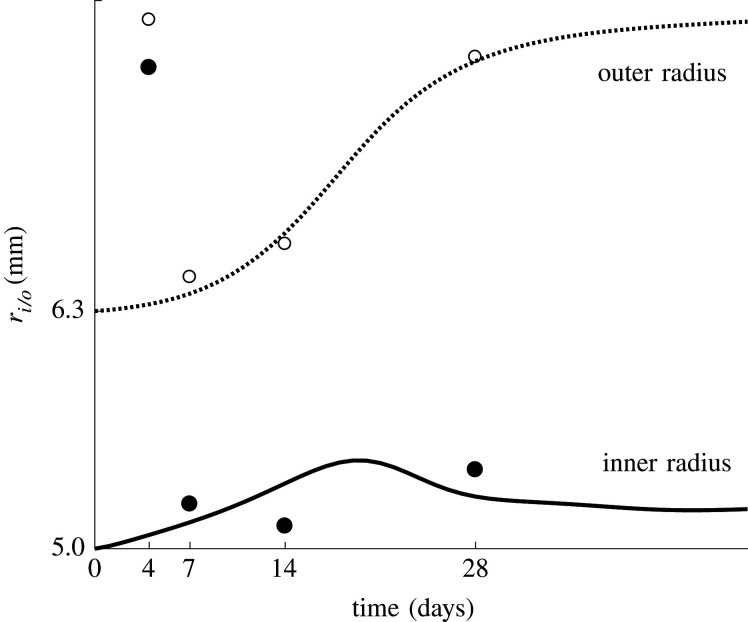
Figure 7 gives an overview of the predicted inner and outer radius evolution of the iliac artery during restenosis. The results are compared with reported average data by Geary et al. [27]. There is a clear correspondence between the model and experiment, except for the very high experimentally observed radii at 4 days after the intervention, which are not predicted accurately.
Figure 7.
The inner radius (solid line and filled dots) and outer radius (dotted line and open dots) of the iliac artery through time. The lines represent the predicted radii, while the dots represent the experimental data as the mean value of measurements in four to six animals [27].
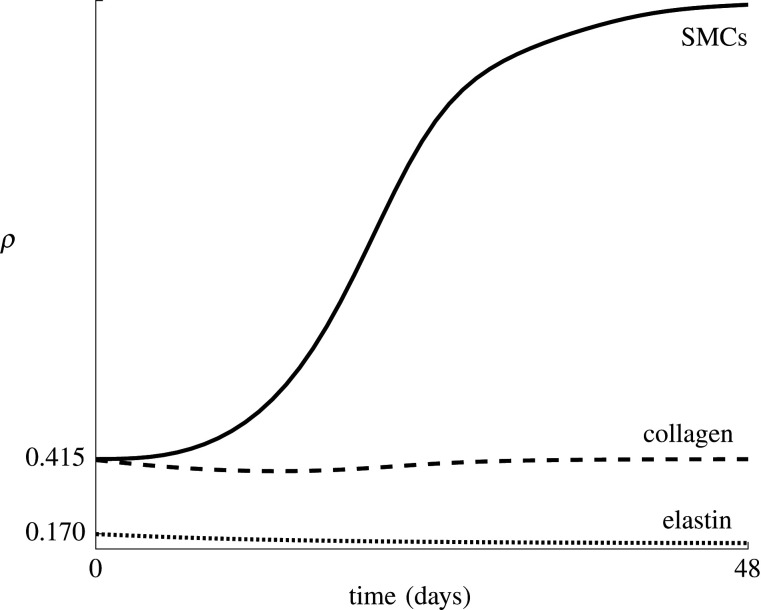
Figure 8 shows the elastin, collagen and SMC densities, ρelas, and ρsmc, over time. There is a higher loss of extracellular matrix, compared with figure 6, to allow for a greater increase in the outer radius, while the subsequent SMC growth causes the inner radius to remain more or less constant and the outer radius to increase further.
Figure 8.
Average collagen, elastin and SMC densities over time predicted after balloon angioplasty of the iliac artery.
4. Discussion
The aim of this study is to develop a remodelling model for the prediction of restenosis, combining features of existing predictive models with the advantages of finite-element modelling and the use of the homogenized constrained mixture theory. The presented model is based on an agent-based model [14] and adapted in order to represent the number of SMCs as an evolving mass density, as required by the present modelling framework.
This previous modelling approach [14], combining a finite-element model to predict wall stress and an agent-based model to predict SMC growth, has shown its merits in predicting restenosis. However, the present approach, in which the homogenized constrained mixture theory is integrated in a finite-element model, allows for a more direct interaction between the tissue mechanics and growth and remodelling phenomena. Growth and remodelling are initiated by a damage stimulus, which depends on the von Mises—Cauchy stress during and after angioplasty. This stimulates an SMC phenotype switch, the production of growth and matrix degrading factors, the production of collagen and SMC proliferation.
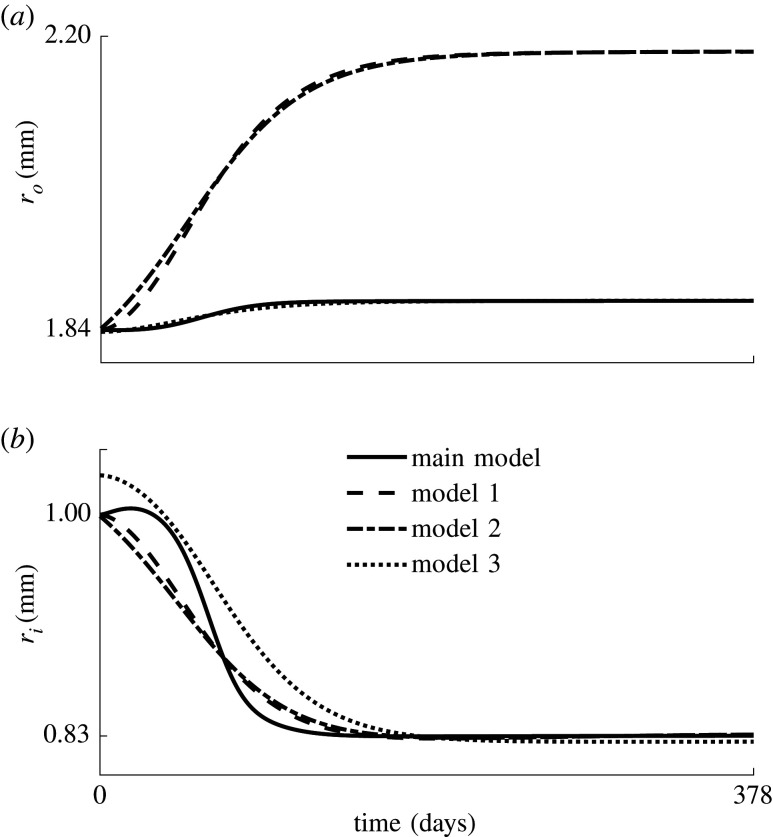
In appendix A.1, the implementations of three more predictive models of restenosis in combination with the constrained mixture theory are presented; these are inspired by Schwartz et al. [8], Tahir et al. [9] and Fereidoonnezhad et al. [18], respectively. This is done in order to assess the added value of a detailed description of biological effects, compared with the three more phenomenological models. As shown in figure 9, all models predict a similar progression of inner radius over time in the coronary artery, and match clinical findings [26] shown in figure 2. However, we assume that the three additional models presented in appendix A.1 show a limited potential of clinical relevance. On the one hand, the evolutions of the SMC density in models 1 and 2 are independent of the mechanical stimulus, making it impossible to optimize the balloon load in future studies. On the other hand, model 3 is dependent on the mechanical stimulus, but it is indirectly based on Schwartz et al. [8], who simply presented an equation for the number of SMCs over time specifically corresponding to the clinical data [26] and shown in figure 2. Therefore, a match with this data is inevitable. However, there is limited evidence that this phenomenological model allows other forms of remodelling to occur after balloon angioplasty.
Figure 9.
Evolution of the (a) outer and (b) inner radius, ri and ro, of the coronary artery after balloon angioplasty, predicted by the three additional restenosis models and the model presented in §2.2 (solid line).
For example, oversizing of the balloon negatively impacts vessel wall remodelling [36]. Moreover, more than 50 per cent of the neointima formed after balloon angioplasty may be collagenous [37]. Some studies, for example Geary et al. [27], also show important positive remodelling of the tissue, counteracting the negative effects of neointima formation. Therefore, it is relevant to also consider growth and remodelling of the extracellular matrix instead of focusing on SMC growth only.
The main presented model gives a detailed description of the biological processes during restenosis. Despite the drawback of the high number of parameters, it has a clearer potential for clinical applicability than the phenomenological approaches. For example, during preoperative planning optimization may be performed in order to obtain a sufficiently high balloon load to partly damage the plaque, while optimizing the long-term outcomes by limiting the applied stress. To investigate this, the predictive model is further used to predict the outcomes of different balloon loads. The outcomes are shown in figure 3. To the best of our knowledge, no experimental data on long-term restenosis evolution exist that depend on the balloon load. This information is required to improve our model’s sensitivity to the mechanical stimulus. Note that the different balloon loads in figure 3 are indicated with the pressure applied directly on the inner surface of the wall. This pressure does not correspond to the inflation pressure of the balloon since at its nominal diameter the balloon takes up most of the tension owing to its high stiffness. Only a part of the tension is transferred to the arterial wall. Therefore, a percentage of radius increase is indicated as well in order to allow for a better comparison with clinical practice, knowing that the size of the balloon usually matches the healthy diameter of the artery, such that the stretch is mainly determined by the extent of the plaque.
The clinical applicability is further explored through a modification of the model to grasp the effects of the use of drug-eluting balloons. The results are shown in figure 5. The action of the drug is simplified since the proposed model is not detailed enough to take into account the effects of dedicated cellular signalling pathways and molecular actions. More detailed experimental or clinical data are required to make a clear assessment of this approach and to determine whether more detailed processes should be included in the model.
Geary et al. [27] show that both inward and outward wall remodelling can occur in the iliac artery of cynomolgus monkeys. Therefore, the reliability of the model is also shown when comparing figure 7 with figure 2, since it shows that both kinds of remodelling can be predicted by the model by adjusting the parameters for extracellular matrix loss and SMC growth. The predicted outward remodelling in the iliac model is initially due to the loss of collagen and elastin. However, the outer radius keeps increasing after stabilization of these respective densities owing to the continuous update of collagen stretch, which is impossible to predict with a kinematic growth model as used in previously developed finite-element models of restenosis [18,19,38]. This is the main advantage associated with the use of the constrained mixture model. On the other hand, disadvantages are related to the mathematical complexity compared with the kinematic growth theory and the increased difficulty of accounting for migration with respect to agent-based models.
Although we show a potential for clinical relevance through the predicted outcomes of different surgical interventions and the consequent possibility to optimize treatment, a few improvements are required. First, the data obtained by Geary et al. [27] and presented in figure 7 show a substantial initial increase of radius followed by a rapid reduction. This effect, possibly due to plaque and media fracture, followed by SMC contraction [27], is not captured well in the presented model. Integration of the mechanical contribution of contractile SMCs and the plaque geometry, along with a better understanding of all chemical, biological and mechanobiological processes after a balloon injury, will increase the model’s reliability.
It would also be beneficial to consider a multi-layered model of the artery instead of a homogeneous material, allowing for a clearer distinction between load-bearing medial SMCs and intimal SMCs whose mechanical contribution in vivo is likely to be negligible. This hypothesis is based on the fact that the long-term decrease in lumen size after angioplasty is mostly caused by the deposition of new material, and less because of contraction. This is supported, for example, by fig. 4 in Geary et al. [27], where the outer radius might remain constant or increase, but does not decrease over time.
Apart from the homogeneity of the wall, assumptions are also made about the mechanical properties of the tissue. The tissue is considered to behave as a hyperelastic material. The mechanical properties of elastin are defined with a neo-Hookean model, and collagen is modelled with an exponential stress–strain law, since Schriefl et al. [39] show a near-linear behaviour of elastin and strain stiffening behaviour of collagen during mechanical testing of selectively enzymatically degraded tissue. As stated by Humphrey [40], during mechanical testing, arterial tissue displays a Mullins-like softening behaviour. However, this effect disappears after a number of so-called preconditioning cycles. Therefore, the assumption of fully elastic behaviour in homeostatic cyclic loading conditions seems reasonable. Non-elastic softening effects beyond these conditions are taken into account in the form of extracellular matrix damage during balloon inflation. In accordance with Boyle et al. [14], this damage, used as a trigger for remodelling, is based on the von Mises stress in the arterial wall during balloon angioplasty. However, owing to the composite nature of arterial tissue, considering constituent-specific damage based on the individual constituent’s strain energy might be more realistic, for example as done by He et al. [17].
Figures 3 and 4 show a very high, and probably unrealistic, sensitivity of the model to the mechanical stimulus. This also causes a big difference in SMC proliferation at the inner and outer side of the wall, while in reality the SMC accumulation at the inner wall is probably due to cell migration and less to stress differences over the wall. Considering this migration, along with diffusion of all agents, as done by Escuer et al. [20], and considering the eluted drug as an extra agent in the model, would also considerably improve the model’s reliability, but would require an improved understanding of the biological effects.
This improved understanding can be acquired by the design of dedicated experimental set-ups, which are also necessary to obtain more reliable parameter values. Indeed, as mentioned earlier, another limitation of this study is related to the high number of parameters, as is obvious from table 1. However, most parameters have a physical meaning owing to the biologically inspired nature of the model, as opposed to more phenomenological approaches, enabling parameter values to be obtained experimentally. Comparing table 1 with table 2 shows that the parameters are currently rather sensitive to the data they are fitted to. Therefore, the availability of larger experimental datasets would help to identify possible inconsistencies between the model and the data in order to further improve the proposed equations’ reliability.
5. Conclusion
In summary, we present a predictive computational model of restenosis, composed of a finite-element model of balloon angioplasty on the arterial wall. The consequent growth and remodelling of the tissue is modelled with a homogenized constrained mixture approach, allowing a direct connection between mechanical quantities and SMC growth. A predictive model of SMC growth is presented and the outcomes are compared with clinical data from human coronary arteries [26]. We also further investigate the clinical relevance of the detailed biologically inspired approach by testing the resulting restenosis rate at different balloon loads and by tuning a parameter for SMC phenotype switch to predict the outcome of the use of drug-eluting balloons. Finally, the model is also applied to a finite-element model of the iliac artery and the outcomes are compared with experimental data in cynomolgus monkeys [27]. The model outcomes show great similarities to experimental data and show that both inward and outward remodelling can be predicted. However, a better understanding and mathematical description of chemical, biological and mechanobiological processes will further improve the clinical relevance of the presented model.
Appendix A
Three additional models for the prediction of restenosis are integrated in the above-mentioned modelling framework. These three models are inspired by existing models in the literature and adapted to fit in the homogenized constrained mixture model, as explained below. The outcomes are compared with the model presented in §2.2.
A.1. Additional restenosis models
A.1.1. Model 1
The first model is inspired by Schwartz et al. [8]. The change of SMC density over time is
| A1 |
where β1 and ω1 are two growth parameters. Explicitly, at time t the SMC density is
| A2 |
Schwartz et al. [8] do not mention extracellular matrix growth. Therefore, elastin is assumed not to degrade or be produced and collagen is subjected to continuous turnover, where the production and degradation are always in equilibrium. Therefore,
| A3 |
The maximal and steady-state SMC density is obtained from equation (A2) as
| A4 |
and the corresponding time tm at which the growth rate is maximal is obtained from
| A5 |
The parameters β1 and ω1 are determined in order to obtain tm ≈ 52 days and a that yields results corresponding to the clinical data [26].
A.1.2. Model 2
From the results of their predictive agent-based model, Tahir et al. [9] found a logistic course for the number of SMCs over time. Therefore, in the second presented model, we write
| A6 |
where r defines the rate of growth and is the maximal and steady-state SMC density. Explicitly,
| A7 |
There is again no mention of extracellular matrix growth, such that equation (A3) still holds.
The maximal rate of growth occurs at
| A8 |
The parameters r and are obtained using the same criteria as in §A.1.1.
A.1.3. Model 3
Fereidoonnezhad et al. [18] present a kinematic growth model, where the growth function of the wall is based on the model by Schwartz et al. [8], but is also dependent on the loading history of the tissue. This model is adapted to the homogenized constrained mixture modelling approach as follows. We define
| A9 |
where β2 and ω2 are parameters and 〈D − Dth 〉 is zero when the damage D is smaller than the damage threshold Dth. D is dependent on the maximal isochoric energy , defined by the highest value of in the loading history. Therefore,
| A10 |
with damage parameters r1 and m1. Assuming that D is related to the damage of collagen and elastin, ρcoll,i(t) = (1 − D)ρcoll,i(0) and ρelas(t) = (1 − D)ρelas(0). Taking into account that and therefore D can only increase, it approximately influences and as
| A11 |
where Δt represents the length of a time step.
The parameter values of Dth and r1 are obtained from Fereidoonezhad et al. [18] and m1 is determined in order to obtain a realistic value of D. Since equation (A9) is equivalent to equation (A1) up to a scaling factor 〈D − Dth 〉, we choose ω2 = ω1 and β2 is determined to fit the clinical data [26].
A.2. Finite-element model
The three additional models of restenosis are integrated in the finite-element model of the coronary artery (see §2.3.1) and the results are compared with those obtained with the restenosis model presented in §2.2. The used material parameters, obtained as explained in §A.1, are given in table 3.
Table 3.
Overview of the parameter values of the three additional restenosis models.
A.3. Results
Figure 9b shows the evolution of the inner radius of the coronary artery after balloon angioplasty with respect to the number of days after angioplasty for the four models. Note that the extracellular matrix damage in the additional model 3 occurs immediately during balloon angioplasty, such that the inner radius at day 0 is increased, while in the original model (solid line) the damage build-up is more gradual. Figure 9a also shows the outer radius evolution.
Figure 10a gives an overview of the average SMC density over time, while figure 10b shows the corresponding normalized time derivative, indicating that the maximal SMC growth occurs at around 52 days for all four models. Figure 10a shows that models 1 and 2 require approximately twice the amount of SMCs to yield the same inner radius. These two models are independent of the mechanical state of the material, such that all elements through the wall thickness grow equally, and that there is as much inward as outward growth. On the other hand, in model 3 and the original model (full line), the inner elements grow more than the outer elements because they experience greater stress and strain energy during the balloon inflation. Therefore, the limited increase in the outer radius observed in figure 9a is mainly due to the loss of extracellular matrix, and less to outward growth.
Figure 10.
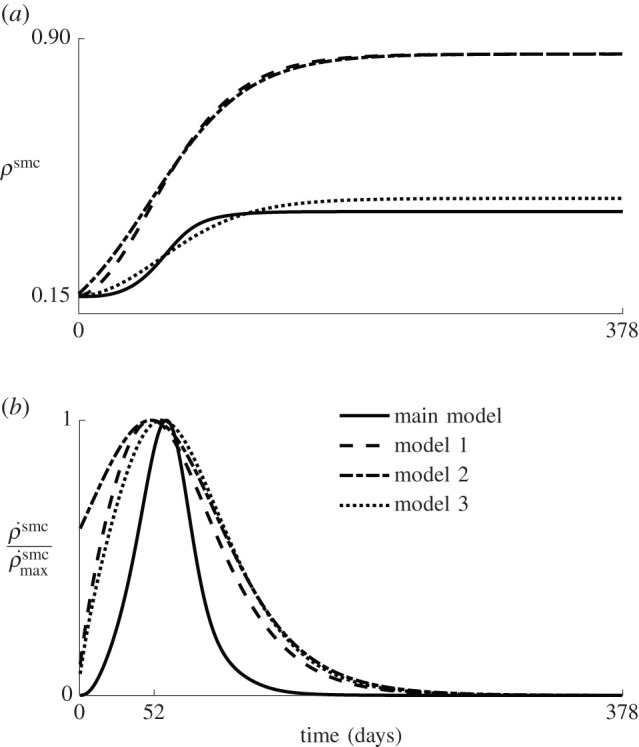
(a) Average SMC density over time for the three additional restenosis models and the model presented in §2.2 (solid line). (b) Time derivative of the average SMC density, normalized with its maximum.
Appendix B
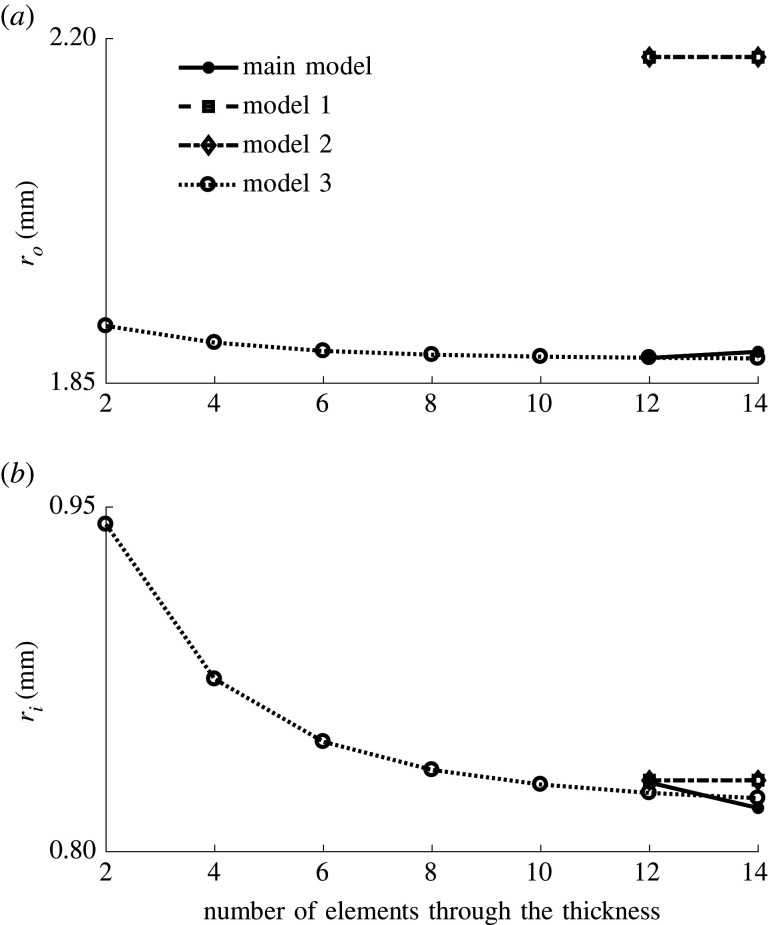
A mesh convergence study is conducted with model 3 and the coronary artery geometry described in §2.3.1. As in all simulations, full integration hybrid hexahedral elements (C3D8H) are used in Abaqus/Standard 2017. The coarsest mesh has two elements through the wall thickness, after which the mesh is continuously refined. For each simulation with a different mesh size, the final inner and outer radii after 378 days of remodelling are extracted and used as convergence criteria. The inner radius varies more for the different mesh sizes, but is considered to converge at 12 elements through the thickness, with a relative radius difference of 0.27% between the results of the meshes with 12 and 14 elements. After that, the convergence is also verified for the three remaining models, where only the meshes with 12 and 14 elements through the thickness are used. The biggest difference in results between these two mesh sizes is found for the main model explained in §2.2, with a relative difference of 1.34% for the inner radius and 0.33% for the outer radius. This error is still deemed small enough to consider the mesh to be converged. An overview of these results is shown in figure 11.
Figure 11.
Overview of the mesh convergence results. Every mesh size is tested for model 3, while only the two finest meshes are tested for the three remaining models. The mesh size is defined by the number of elements through the thickness of the wall. (a) Final outer radius after remodelling. (b) Final inner radius after remodelling.
Data accessibility
All Abaqus input files and user subroutines used to obtain the presented results are publicly available at https://bme-soft-tissue.pages.gitlab.kuleuven.be/restenosis/.
Authors' contributions
L.M. and A.-S.C. implemented and ran the model and analysed the results; L.M., I.F. and N.F. participated in the design of the study; I.F. and N.F. supervised the study; L.M. drafted the manuscript; A.-S.C., I.F. and N.F. critically revised the manuscript. All authors gave final approval for publication and agree to be held accountable for the work performed herein.
Competing interests
We declare we have no competing interests.
Funding
The authors are grateful to the Research Foundation-Flanders (FWO) for the funding of this project through a doctoral fellowship granted to L.M. (11A6519N) and through a research project grant to N.F. and I.F. (G088020N).
References
- 1.Chaabane C, Otsuka F, Virmani R, Bochaton-Piallat ML. 2013. Biological responses in stented arteries. Cardiovasc. Res. 99, 353-363. ( 10.1093/cvr/cvt115) [DOI] [PubMed] [Google Scholar]
- 2.Lindquist J, Schramm K. 2018. Drug-eluting balloons and drug-eluting stents in the treatment of peripheral vascular disease. Semin. Intervent. Radiol. 35, 443-452. ( 10.1055/s-0038-1676360) [DOI] [PMC free article] [PubMed] [Google Scholar]
- 3.Abdullah K, Bou Dargham B, Steinbrecher M, Sun B, Huiqiang Z, Khalili H, Brilakis ES, Banerjee S. 2018. Drug-eluting stents for treatment of peripheral artery disease. Am. J. Cardiovasc. Drugs 18, 175-180. ( 10.1007/s40256-018-0265-4) [DOI] [PubMed] [Google Scholar]
- 4.Caradu C, Lakhlifi E, Colacchio EC, Midy D, Bérard X, Poirier M, Ducasse E. 2019. Systematic review and updated meta-analysis of the use of drug-coated balloon angioplasty versus plain old balloon angioplasty for femoropopliteal arterial disease. J. Vasc. Surg. 70, 981-995.e10. ( 10.1016/j.jvs.2019.01.080) [DOI] [PubMed] [Google Scholar]
- 5.Wang Z, Liu C, Fang H. 2019. Blood cell parameters and predicting coronary in-stent restenosis. Angiology 70, 711-718. ( 10.1177/0003319719830495) [DOI] [PubMed] [Google Scholar]
- 6.Pleva L, Kukla P, Hlinomaz O. 2018. Treatment of coronary in-stent restenosis: a systematic review. J. Geriatr. Cardiol. 15, 173-184. ( 10.11909/j.issn.1671-5411.2018.02.007) [DOI] [PMC free article] [PubMed] [Google Scholar]
- 7.Piraino D, Cimino G, Buccheri D, Dendramis G, Andolina G, Cortese B. 2017. Recurrent in-stent restenosis, certainty of its origin, uncertainty about treatment. Int. J. Cardiol. 230, 91-96. ( 10.1016/j.ijcard.2016.12.073) [DOI] [PubMed] [Google Scholar]
- 8.Schwartz RS, Chu A, Edwards WD, Srivatsa SS, Simari RD, Isner JM, Holmes DR. 1996. A proliferation analysis of arterial neointimal hyperplasia: lessons for antiproliferative restenosis therapies. Int. J. Cardiol. 53, 71-80. ( 10.1016/0167-5273(95)02499-9) [DOI] [PubMed] [Google Scholar]
- 9.Tahir H, Hoekstra AG, Lorenz E, Lawford PV, Rodney Hose D, Gunn J, Evans DJ. 2011. Multi-scale simulations of the dynamics of in-stent restenosis: impact of stent deployment and design. Interface Focus 1, 365-373. ( 10.1098/rsfs.2010.0024) [DOI] [PMC free article] [PubMed] [Google Scholar]
- 10.Caiazzo A et al. 2011. A complex automata approach for in-stent restenosis: two-dimensional multiscale modelling and simulations. J. Comput. Sci. 2, 9-17. ( 10.1016/j.jocs.2010.09.002) [DOI] [Google Scholar]
- 11.Tahir H, Bona-Casas C, Hoekstra AG. 2013. Modelling the effect of a functional endothelium on the development of in-stent restenosis. PLoS ONE 8, e66138. ( 10.1371/journal.pone.0066138) [DOI] [PMC free article] [PubMed] [Google Scholar]
- 12.Tahir H, Bona-Casas C, Narracott AJ, Iqbal J, Gunn J, Lawford P, Hoekstra AG. 2014. Endothelial repair process and its relevance to longitudinal neointimal tissue patterns: comparing histology with in silico modelling. J. R. Soc. Interface 11, 20140022. ( 10.1098/rsif.2014.0022) [DOI] [PMC free article] [PubMed] [Google Scholar]
- 13.Tahir H, Niculescu I, Bona-Casas C, Merks RM, Hoekstra AG. 2015. An in silico study on the role of smooth muscle cell migration in neointimal formation after coronary stenting. J. R. Soc. Interface 12, 20150358. ( 10.1098/rsif.2015.0358) [DOI] [PMC free article] [PubMed] [Google Scholar]
- 14.Boyle CJ, Lennon AB, Prendergast PJ. 2011. In silico prediction of the mechanobiological response of arterial tissue: application to angioplasty and stenting. J. Biomech. Eng. 133, 081001. ( 10.1115/1.4004492) [DOI] [PubMed] [Google Scholar]
- 15.Balzani D, Schröder J, Gross D. 2006. Simulation of discontinuous damage incorporating residual stresses in circumferentially overstretched atherosclerotic arteries. Acta Biomater. 2, 609-618. ( 10.1016/j.actbio.2006.06.005) [DOI] [PubMed] [Google Scholar]
- 16.Conway C, McGarry JP, McHugh PE. 2014. Modelling of atherosclerotic plaque for use in a computational test-bed for stent angioplasty. Ann. Biomed. Eng. 42, 2425-2439. ( 10.1007/s10439-014-1107-4) [DOI] [PubMed] [Google Scholar]
- 17.He R, Zhao LG, Silberschmidt VV, Liu Y, Vogt F. 2020. Finite element evaluation of artery damage in deployment of polymeric stent with pre- and post-dilation. Biomech. Model. Mechanobiol. 19, 47-60. ( 10.1007/s10237-019-01194-6) [DOI] [PMC free article] [PubMed] [Google Scholar]
- 18.Fereidoonnezhad B, Naghdabadi R, Sohrabpour S, Holzapfel GA. 2017. A mechanobiological model for damage-induced growth in arterial tissue with application to in-stent restenosis. J. Mech. Phys. Solids 101, 311-327. ( 10.1016/j.jmps.2017.01.016) [DOI] [Google Scholar]
- 19.He R, Zhao L, Silberschmidt VV, Liu Y. 2020. Mechanistic evaluation of long-term in-stent restenosis based on models of tissue damage and growth. Biomech. Model. Mechanobiol. 19, 1425-1446. ( 10.1007/s10237-019-01279-2) [DOI] [PMC free article] [PubMed] [Google Scholar]
- 20.Escuer J, Martínez MA, McGinty S, Peña E. 2019. Mathematical modelling of the restenosis process after stent implantation. J. R. Soc. Interface 16, 20190313. ( 10.1098/rsif.2019.0313) [DOI] [PMC free article] [PubMed] [Google Scholar]
- 21.Humphrey JD, Rajagopal KR. 2002. A constrained mixture model for growth and remodelling of soft tissues. Math. Model. Methods Appl. Sci. 12, 407-430. ( 10.1142/S0218202502001714) [DOI] [Google Scholar]
- 22.Rodriguez EK, Hoger A, McCulloch AD. 1994. Stress-dependent finite growth in soft elastic tissues. J. Biomech. 27, 455-467. ( 10.1016/0021-9290(94)90021-3) [DOI] [PubMed] [Google Scholar]
- 23.Cyron CJ, Aydin RC, Humphrey JD. 2016. A homogenized constrained mixture (and mechanical analog) model for growth and remodeling of soft tissue. Biomech. Model. Mechanobiol. 15, 1389-1403. ( 10.1007/s10237-016-0770-9) [DOI] [PMC free article] [PubMed] [Google Scholar]
- 24.Braeu FA, Seitz A, Aydin RC, Cyron CJ. 2017. Homogenized constrained mixture models for anisotropic volumetric growth and remodeling. Biomech. Model. Mechanobiol. 16, 889-906. ( 10.1007/s10237-016-0859-1) [DOI] [PubMed] [Google Scholar]
- 25.Mousavi SJ, Farzaneh S, Avril S. 2019. Patient-specific predictions of aneurysm growth and remodeling in the ascending thoracic aorta using the homogenized constrained mixture model. Biomech. Model. Mechanobiol. 18, 1895-1913. ( 10.1007/s10237-019-01184-8) [DOI] [PubMed] [Google Scholar]
- 26.Nobuyoshi M, Kimura T, Nosaka H, Mioka S, Ueno K, Yokoi H, Hamasaki N, Horiuchi H, Ohishi H. 1988. Restenosis after successful percutaneous transluminal coronary angioplasty: serial angiographic follow-up of 229 patients. J. Am. Coll. Cardiol. 12, 616-623. ( 10.1016/S0735-1097(88)80046-9) [DOI] [PubMed] [Google Scholar]
- 27.Geary RL, Williams JK, Golden D, Brown DG, Benjamin ME, Adams MR. 1996. Time course of cellular proliferation, intimal hyperplasia, and remodeling following angioplasty in monkeys with established atherosclerosis: a nonhuman primate model of restenosis. Arterioscler. Thromb. Vasc. Biol. 16, 34-43. ( 10.1161/01.ATV.16.1.34) [DOI] [PubMed] [Google Scholar]
- 28.Nolan DR, Gower AL, Destrade M, Ogden RW, McGarry JP. 2014. A robust anisotropic hyperelastic formulation for the modelling of soft tissue. J. Mech. Behav. Biomed. Mater. 39, 48-60. ( 10.1016/j.jmbbm.2014.06.016) [DOI] [PubMed] [Google Scholar]
- 29.Famaey N, Vastmans J, Fehervary H, Maes L, Vanderveken E, Rega F, Mousavi SJ, Avril S. 2018. Numerical simulation of arterial remodeling in pulmonary autografts. Z. Angew. Math. Mech. 98, 2239-2257. ( 10.1002/zamm.201700351) [DOI] [Google Scholar]
- 30.Maes L, Fehervary H, Vastmans J, Mousavi S, Avril S, Famaey N. 2019. Constrained mixture modeling affects material parameter identification from planar biaxial tests. J. Mech. Behav. Biomed. Mater. 95, 124-135. ( 10.1016/j.jmbbm.2019.03.029) [DOI] [PubMed] [Google Scholar]
- 31.Franklin SS, Gustin W IV, Wong ND, Larson MG, Weber MA, Kannel WB, Levy D. 1997. Hemodynamic patterns of age-related changes in blood pressure: the Framingham heart study. Circulation 96, 308-315. ( 10.1161/01.CIR.96.1.308) [DOI] [PubMed] [Google Scholar]
- 32.Marx SO, Marks AR. 2001. Bench to bedside: the development of rapamycin and its application to stent restenosis. Circulation 104, 852-855. ( 10.1161/01.CIR.104.8.852) [DOI] [PubMed] [Google Scholar]
- 33.Parry TJ, Brosius R, Thyagarajan R, Carter D, Argentieri D, Falotico R, Siekierka J. 2005. Drug-eluting stents: sirolimus and paclitaxel differentially affect cultured cells and injured arteries. Eur. J. Pharmacol. 524, 19-29. ( 10.1016/j.ejphar.2005.09.042) [DOI] [PubMed] [Google Scholar]
- 34.Holzapfel GA, Sommer G, Gasser CT, Regitnig P. 2005. Determination of layer-specific mechanical properties of human coronary arteries with nonatherosclerotic intimal thickening and related constitutive modeling. Am. J. Physiol. Heart Circ. Physiol. 289, H2048-H2058. ( 10.1152/ajpheart.00934.2004) [DOI] [PubMed] [Google Scholar]
- 35.Schulze-Bauer CA, Mörth C, Holzapfel GA. 2003. Passive biaxial mechanical response of aged human iliac arteries. J. Biomech. Eng. 125, 395-406. ( 10.1115/1.1574331) [DOI] [PubMed] [Google Scholar]
- 36.Mitsutake Y, Reifart J, Pyun WB, Lyons JK, Deuse T, Schrepfer S, Ikeno F. 2017. Differences in vascular response between balloon overstretch and stent overexpansion in nonatherosclerotic porcine coronary arteries. Comp. Med. 67, 350-355. [PMC free article] [PubMed] [Google Scholar]
- 37.Leigh Perkins LE. 2010. Preclinical models of restenosis and their application in the evaluation of drug-eluting stent systems. Vet. Pathol. 47, 58-76. ( 10.1177/0300985809352978) [DOI] [PubMed] [Google Scholar]
- 38.Cheng J, Zhang LT. 2019. Simulation of vessel tissue remodeling with residual stress: an application to in-stent restenosis. Int. J. Smart Nano Mater. 10, 11-27. ( 10.1080/19475411.2018.1529002) [DOI] [Google Scholar]
- 39.Schriefl AJ, Schmidt T, Balzani D, Sommer G, Holzapfel GA. 2015. Selective enzymatic removal of elastin and collagen from human abdominal aortas: uniaxial mechanical response and constitutive modeling. Acta Biomater. 17, 125-136. ( 10.1016/j.actbio.2015.01.003) [DOI] [PubMed] [Google Scholar]
- 40.Humphrey JD. 2002. Cardiovascular solid mechanics. New York, NY: Springer. [Google Scholar]
Associated Data
This section collects any data citations, data availability statements, or supplementary materials included in this article.
Data Availability Statement
All Abaqus input files and user subroutines used to obtain the presented results are publicly available at https://bme-soft-tissue.pages.gitlab.kuleuven.be/restenosis/.


