

Abstract
Motivation
Efficient and accurate alignment of DNA/RNA sequence reads to each other or to a reference genome/transcriptome is an important problem in genomic analysis. Nanopore sequencing has emerged as a major sequencing technology and many long-read aligners have been designed for aligning nanopore reads. However, the high error rate makes accurate and efficient alignment difficult. Utilizing the noise and error characteristics inherent in the sequencing process properly can play a vital role in constructing a robust aligner. In this article, we design QAlign, a pre-processor that can be used with any long-read aligner for aligning long reads to a genome/transcriptome or to other long reads. The key idea in QAlign is to convert the nucleotide reads into discretized current levels that capture the error modes of the nanopore sequencer before running it through a sequence aligner.
Results
We show that QAlign is able to improve alignment rates from around up to with nanopore reads when aligning to the genome. We also show that QAlign improves the average overlap quality by and in three real datasets for read-to-read alignment. Read-to-transcriptome alignment rates are improved from % to and % to in two real datasets.
Availability and implementation
Supplementary information
Supplementary data are available at Bioinformatics online.
1 Introduction
In genomic data analysis, aligning DNA/RNA-seq reads to a genome/transcriptome is a key primitive, that precedes many downstream tasks, including genome/transcriptome assembly (Haas et al., 2013; Pevzner et al., 2001) and variant calling (DePristo et al., 2011; Li, 2011; Mao et al., 2017). Getting accurate read alignment is difficult especially in repetitive regions of the genome, due to the short length of the reads obtained via high throughput sequencing. Emerging sequencing technologies, particularly, nanopore sequencing (Deamer et al., 2016; Mikheyev and Tin, 2014) offers a potential solution to this problem by providing long reads (with average read length 10-kb and the longest read sequenced so far >2 Mb) that can span these repetitive regions. However, these long reads are riddled with a high error rate, thus, making alignment of low accuracy (Križanović et al., 2018) and the downstream task difficult. For example, while nanopore sequencing has enabled fully automated assembly of some bacterial genomes, the assembly of human genome still produces many contigs that have to be scaffolded manually (Jain et al., 2018). Another important downstream task is structural variant calling, where long reads can play an important role. However, present structural variant calling algorithms have low precision and recall due to noise in the reads (Stancu et al., 2017). The assembly of long segmental duplications presents another important problem where long reads can bridge repeated regions but again becomes complicated due to read errors (Chaisson et al., 2017).
In this article, we propose a novel method for aligning nanopore reads that takes into account the particular structure of errors that is inherent in the nanopore sequencing process. In many of the long read aligners, the read errors are modeled using insertions, deletions and substitutions which happen at differing rates. However, in nanopore sequencing, many errors induced have structure, which is missed by viewing the errors as independent insertions, deletions and substitutions. In the nanopore sequencer, the current level depends on a Q-mer (a set of Q consecutive nucleotide bases which influence the current measurement in the nanopore). This is due to the physics of the nanopore sequencing, where a set of DNA base-pairs together influence the current output of the nanopore reader (Laszlo et al., 2014; Mao et al., 2018) (e.g. occupying the nanopore width). Therefore, the output current depends on a set of DNA base-pairs (Q-mer) influencing it. The current reading, which is used by a de novo base caller for decoding, therefore could cause structured errors, especially between Q-mers that have similar outputs. This confusability between different Q-mers, is captured by the so-called Q-mer map. InFigure 1b, the median current levels for various Q-mers are plotted and it is clear that there is significant overlap in the current levels observed when different Q-mers are passed through the nanopore. These overlaps are one source of structured errors in the sequencer and can be fundamental since they can be indistinguishable by any de novo sequencer.
Fig. 1.

(a) An example to illustrate the error-profile in nanopore base-called reads, and the ability of QAlign to perform accurate alignment despite of the errors (the edit distance used here is to demonstrate accuracy of the alignment, however, the nucleotide edit distance, which is used as a metric for read-to-genome and read-to-transcriptome alignment, is computed in the nucleotide domain for the quantized alignments as well). (b) Q-mer map for Nanopore R9.4 1D flow cell (for Q = 6). It represents the physics of nanopore. The median current value along with the standard deviation (as error bars) are plotted for every 6-mers in the Q-mer map for R9.4 1D nanopore flow cell. Note that the difference between the median current levels of any two consecutive Q-mers is very small. (c) An example showing the two different nucleotide sequences have similar current levels (therefore similar quantized sequences)
The novel alignment strategy that we propose takes into account the structure of the Q-mer map to perform better alignment. In Figure 1a, we give an example where a DNA sequence (GCATGACAGG) gets wrongly sequenced as a completely different sequence (CGGCAACCGA) due to this error mode of the nanopore sequencer. Ideally, we would like to maintain the list of ‘equivalent’ Q-mers that could have plausibly caused the observed current readings. However, this is infeasible as this would entail changing the de novo sequencing process itself to output either multiple possible reads, or give soft information about different possibilities. This is difficult, as sophisticated de novo sequencing have been developed using artificial neural networks, which have been optimized for read error-rate performance (Tran et al., 2017). Moreover, for a modular approach, we would not want to change the de novo sequencer for different downstream applications. Therefore, we take a different approach to resolve this problem, by using the de novo sequenced read as the input to our strategy. We then deterministically convert this de novo sequenced nucleotide read into a current value using the Q-mer median current level of the corresponding Q-mer (i.e. the Q-mer map as in Fig. 1b). We further quantize these resulting current values from continuous values into properly chosen discrete levels. This is illustrated in Figure 1c. In this work, we use 2–3 levels of discrete values for the quantization, which is determined based on the Q-mer map. Now, given this new discrete representation of the de novo reads, we develop the new alignment algorithm, whose workflow is illustrated in Figure 1a.
A natural question is why this should help, since we are processing the de novo reads which are erroneous, and we are not using any additional soft information, such as raw current values from the nanopore reads themselves. The basic insight is that the translation of the nucleotide reads to current levels enables grouping together reads that are confusable given the structure of the Q-mer map of the nanopore sequencer. For example, when we have two reads illustrated in Figure 1c, if the de novo sequencer has chosen one of the two equally likely sequences as the nucleotide read, it is clear that the alternate read, which has significant edit distance (in the nucleotide domain) is actually quite close when viewed from the lens of the Q-mer map, as captured by our quantized conversion process. Therefore, this process naturally groups together reads that could have been confused, and uses this as the input to our alignment algorithm, QAlign. Therefore, this reduces the effect of the errors by recognizing one structure in the error process. Note that QAlign builds an overlay layer on top of any alignment algorithm to align based on current levels implied by the reads instead of directly aligning the reads. Though we illustrate our ideas using the Minimap2 aligner (Li, 2018), this principle can be implemented with any other long-read aligner such as GMAP (Wu and Watanabe, 2005).
We show that QAlign gives rise to significant performance improvements across a variety of alignment tasks including read-to-genome, read-to-read and read-to-transcriptome alignment as well as different datasets spanning from R7 nanopore sequenced data (Supplementary Fig. S6) to R9.4 data.
QAlign shows significant improvement in read-to-genome alignment rates for datasets where Minimap2 alignment rate is low (improving up to around 90% for four real datasets). Furthermore, the alignments are also of higher quality: QAlign shows up to around 18% lower normalized edit distance than Minimap2 as well as longer alignments.
For read-to-read alignments, QAlign is able to align around 3.6% more overlaps between read pairs with a high overlap quality (refer to Section 2 for a description of the overlap quality) where Minimap2 is either unable to align the read overlaps or aligns with a low overlap quality. We show that a hybrid alignment strategy which combines QAlign and Minimap2 can improve the metric even further to around 4.6% (Supplementary Fig. S14).
For read-to-transcriptome alignments, our method achieves 90% alignment rate as opposed to 82.6% with mouse 2D reads and 75.4% as opposed to 51.6% with Human 1D reads. Furthermore, the alignments are also of higher quality: QAlign shows 13.27% lower normalized edit distance than Minimap2 as well as longer alignments for Human 1D data.
In this study, we focus on the improvement of long read (in particular the Nanopore long read) alignment. To the best of our knowledge, there is no existing aligner, specifically designed to handle the error modes introduced in nanopore sequencing. There is, however, some work on incorporating the nanopore current levels in downstream tasks including post-processing of assembly by Nanopolish (https://github.com/jts/nanopolish). Nanopolish has demonstrated that utilizing the current levels can reduce assembly errors. The major difference of our work with Nanopolish is the level at which the current-level information is taken into account. Since we take into account current-level information while performing alignment, we are able to get substantially more overlaps which can lead to potentially better assembly of contigs whereas Nanopolish is only able to correct fine errors.
2 Materials and methods
The QAlign strategy consists of two steps including the conversion of the nucleotide sequences to quantized (e.g. 2 levels or 3 levels) sequences in the first step. The next step is the alignment of the quantized sequences for various alignment tasks such as read-to-genome, read-to-read and read-to-transcriptome.
2.1 Quantization
The nucleotide sequences are inferred from the nanopore current signals by base-callers, therefore, using a Q-mer map to translate the base-called sequences to the current levels implicitly maintains all of the ‘equivalent’ base-called sequences that could be inferred from the observed current levels. These current levels can be quantized to an alphabet of finite size (Fig. 1a and c).
Mathematically, the quantization process is as follows. Let be the alphabet of nucleotide sequences. For a symbol , let be the Watson–Crick complement of x. A string over Σ is called a DNA sequence, where is the string length and the reverse complement of s is . Let p(s) be a list of all Q-mers (e.g. ) in the string s, sorted by their occurances. For example, and each Q-mer for . Now, we define as the Q-mer map [Q-mer map is determined by the chemistry of the nanopore flow cell, and is therefore dataset dependent, i.e. the Q-mer map for sequencing using R9 flow cell is different from Q-mer map for sequencing using R9.4.1 flow cell. The Q-mer maps used in this work are generated by Nanopolish (https://github.com/jts/nanopolish).], which is a deterministic function that translates each Q-mer to the (median) current level (Fig. 1b). Now, let be the sequence of the current levels, so that for . The current sequence C can be further quantized into by applying a thresholding function . The thresholding can be binary () or ternary () (Fig. 1c). We define as the reverse complementary of a quantized sequence w(s), so .
2.2 Alignment
We can now use the aligners (e.g. Minimap2) to align the quantized sequences. It is important to note that these aligners inherently performs the alignment of the query sequence (e.g. s1) to the reference sequence (e.g. s2) and also aligns the reverse complement () to the reference (s2). For the corresponding quantized sequences, aligners need to align the query sequence (e.g. w1) and its reverse complementary (e.g. ) explicitly to the reference (e.g. w2), to take care of the Q-mer map for both w1 and properly.
The performance of such an aligner can be evaluated by comparing the alignments of the nucleotide sequences s1 onto s2 to the alignments of their quantized sequences w1 onto w2 union with onto w2, respectively, using appropriate performance evaluation metrics.
Read-to-genome alignment. We apply QAlign to the task of read-to-genome alignment. Given a nucleotide read r and the reference nucleotide genome G, we first obtain rQ (the quantized template strand of the read, ) and (quantized reverse complement strand of the read, ) from r, and obtain GQ (quantized reference genome) from G. We next align rQ and respectively to GQ using Minimap2. Lastly, we aggregate the results from both the template and reverse complement outputs to determine the best alignment for each read.
Note that the quantized alignment procedure differs from the direct nucleotide alignment process in two ways. First, the nucleotide alignment does not require Minimap2 to additionally align to G explicitly. Second, the quantized alignment uses a different seed length (e.g. minimizer length k in Minimap2) to ensure that the computation time for quantized alignment is similar as nucleotide alignment (see Supplementary Table S1 for the details of computation time versus seed lengths).
We define several terms that are crucial for later performance analyis, mainly including well-aligned, normalized edit distance and normalized alignment length.
Consider in Figure 2a, Read 1 aligns at location i1 through j1 on the genome (we can get these locations from Minimap2 output). We say that the read is well-aligned, if at-least 90% of the read is aligned onto the genome (i.e. ), and has either the (approximate) normalized edit distance from Minimap2 (i.e. number of unmatched bases, normalized with read length, based on Minimap2 output) is less than a threshold value or the mapping quality from Minimap2 is high (greater than 20). The filtering for the well-aligned reads using this distance and mapping quality is incorporated to eliminate some spurious alignments from Minimap2. Note that the (approximate) normalized edit distance from Minimap2 is specific to nucleotide or quantized alignment. For example, for nucleotide sequences the value returned by Minimap2 is in nucleotide domain; the value returned by Minimap2 is in Q2 domain for the Q2 sequences. Therefore, different filtering threshold values are used—0.48 for nucleotide sequence, 0.25 for Q2 sequence and 0.35 for Q3 sequence (Supplementary Figs S18 and S19).
Fig. 2.
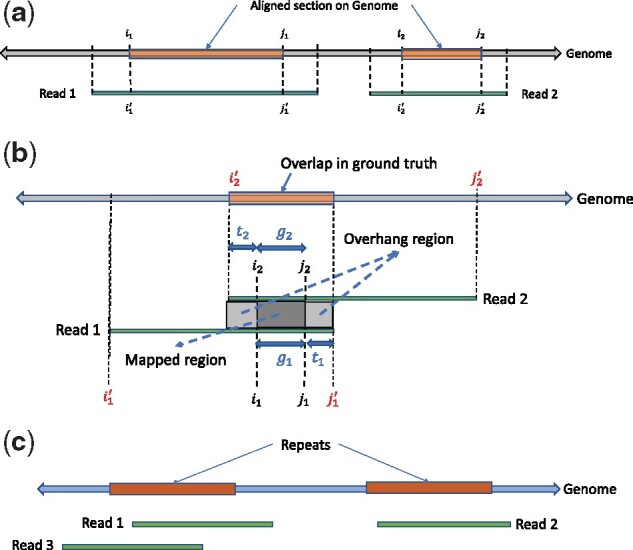
(a) An example of read-to-genome alignment. (b) An example of read-to-read alignment. (c) An example for head-to-tail alignments between reads
In order to compare the quality of the alignments at fine-grained level, we further define Normalized edit distance (This is different from approximate normalized edit distance from Minimap2 to filter for well-aligned reads.). The normalized edit distance for nucleotide alignment is and for quantized alignment is , where i1, j1 and are locations obtained from nucleotide and quantized alignment respectively. Similarly, we define Normalized edit distance of aligned read for nucleotide alignment as (Fig. 2a) and for the quantized alignment as . As evident from the definitions, these metrics for both nucleotide and quantized alignment are calculated all in nucleotide domain (unlike the approximate normalized edit distance from Minimap2, which is domain specific). Specifically, for quantized alignment, we leverage the information about the alignment location on genome (i.e. and ) to calculate the normalized edit distance between the nucleotide read and the corresponding aligned section on the nucleotide genome.
Another metric at fine-grained level is normalized alignment length, which is the ratio of the length of the section on genome where a read aligns to the length of the read. It is for nucleotide alignment, and for quantized alignment. A contiguous alignment tends to have this metric as 1.
We have been discussing the nanopore 1D reads for read-to-genome alignment so far. There are also 2D reads (e.g. r), which are the consensus calling using the 1D reads from both the template strand (e.g. rt) and the complement strand (e.g. rc). For the read-to-genome alignment algorithm of the 2D reads using QAlign, the experiment pipeline has been modified so that the error profile introduced in the sequencing of the 1D reads can be mitigated. Specifically, the quantized reads from both the template strand (e.g. ) and the complement strand (e.g. ) are aligned to the quantized genome (e.g. GQ) individually using Minimap2. The union of the two alignments (For example, alignment regions are [0, 2] and [1, 3], and union is [0, 3].) is considered as the output of the QAlign algorithm. In case there is no overlap in the alignments of the reads from the individual strands, both the genome sections are given as the output of the QAlign algorithm, as the 2D consensus read might align to either of these sections. Since QAlign yields the genome section as the union of the two alignments, it could be much larger (nearly twice) than the read length. Therefore, the genome section needs to be further refined by the local alignment of the 2D consensus read onto the section. The performance evaluation of QAlign is mainly based on the normalized edit distance between the 2D consensus read and the refined genome section (the results using this method for the 2D read alignment onto genome are discussed in Supplementary Figs S3 and S4).
Read-to-read alignment. We apply QAlign to read-to-read alignment as the second alignment task, which provides overlaps between reads that are typically necessary for genome assembly.
The alignments between the nucleotide reads r1 and r2 (or between the quantized reads and ) are obtained using Minimap2 as well. Similar to read-to-genome alignment, the quantized alignment not only aligns to , but also needs to align to . In addition, the quantized alignment uses a seed length (e.g. the minimizer length ‘k’ in Minimap2) different from nucleotide alignment so that the computation time in both nucleotide and quantized regimes is maintained to be similar (see Supplementary Table S2 for detailed analysis of computation time versus k).
For the algorithm evaluation purpose, we need to have the ground truth, which is unknown. One way to judge the quality is to compute the normalized edit distances of alignment overlaps. However, this is not only computationally expensive but also suffers from false alignments between reads from repeated regions. Instead, we leverage the read-to-genome alignments to build the ground truth for read-to-read alignment. Specifically, all of the reads are firstly aligned to the genome via both the nucleotide alignment and the quantized alignment. The reason behind performing the read-to-genome alignment in both the nucleotide and the quantized domain is to ensure that more read alignments are captured, as there can be some alignments that are captured/contiguous only in quantized alignments and vice-versa. For the experiments, we focus on a section of the genome G (say, ) to find all the reads aligning onto G1. Assume there are n1 and n2 number of reads aligned to G1 in nucleotide domain and in quantized domain, respectively, with normalized edit distance (in nucleotide domain for both methods) less than 0.48, which indicates the found alignment of the reads are better than the alignment of two random DNA sequences (see Supplementary Fig. S18). Now, we randomly choose n reads from a union of n1 and n2 reads such that , where dcov is the required coverage depth, N is the length of the genome section G1 (i.e. 1 000 000) and L is the average length of the reads.
To estimate the ground truth, consider the alignment of Read 1 (r1) and Read 2 (r2) onto the genome as shown in Figure 2b, where the alignment locations of the reads on the genome are and , respectively. We say that the reads are overlapping in the ground truth if there is an overlap (denoted as l) of at least 100 bases, where . For reads that have overlaps in both nucleotide and quantized alignment, denoted as and respectively, the larger one is chosen as .
Provided the ground truth, we can compute the Precision and Recall to make a comparison between the two methods. Precision is defined as the fraction of overlaps in the ground truth among the overlaps determined by the algorithm. Recall (also known as sensitivity) is the fraction of overlaps in the ground truth that are determined by the algorithm.
The read-to-read alignment will label two reads to have an overlap (different from the overlap used to find ground truth) if the length of the ‘Mapped Region’ is at least 90% of the ‘Mapped Region’ plus the ‘Overhang Region’ (Fig. 2b), i.e. and , or equivalently . For evaluation, we define another metric called the overlap quality (denoted as X) as where (Empirically d1 and d2 tend to be simply zero) the overlap quality measures how well the reads are aligned with respect to each other, compared to the alignment in ground truth. Ideally, it is desired to have the value of overlap quality close to 1. We also define the average overlap quality, which is the expected value of the overlap quality (i.e. ), or the area under the complementary CDF of X.
It is possible that two reads will be falsely aligned especially when they are from repetitive regions. To remedy this, we only consider head-to-tail alignment between reads. For example in Figure 2c, three reads Read 1, Read2 and Read 3 have been sequenced where Read 1 and Read 2 are from repetitive regions. Consequently after read-to-read alignment, there will be an overlap between Read 1 and Read 2 that can be filtered out since it is not a head-to-tail alignment. However, there will also be another false positive overlap between Read 3 and Read 2, which will not be removed as it satisfies the head-to-tail alignment condition. In order to further reduce the number of false positives of read-to-read alignments, the (approximate) normalized edit distance provided by Minimap2 is used for extra filtering (see Supplementary Fig. S18).
In addition to reduce false positives, the read-to-read alignment results can be further improved by implementing an Ensemble model, which is able to capture the best alignment (e.g. longer length of ‘Mapped Region’) from both methods of the nucleotide alignment and the quantized alignment, as well as to incorporate the alignments that are complementary in either method (see Supplementary Fig. S14).
Read-to-transcriptome alignment. Applying QAlign strategy to the third task of the RNA read-to-transcriptome alignment is analogous to the DNA read-to-genome alignment. This is not the spliced alignment of the reads to the genome; instead all of the RNA reads are aligned to the transcriptome. Since the ground truth is unknown for the alignments, we use normalized edit distance, and normalized alignment length as the evaluation metric.
3 Results
In this section, we demonstrate and discuss the results for (i) DNA Read-to-Genome alignment, (ii) DNA Read-to-Read alignment and (iii) RNA Read-to-Transcriptome alignment using QAlign and Minimap2.
3.1 Datasets
Datasets for DNA-seq alignments: We use five datasets for DNA read-to-genome and read-to-read alignment: (i) MinION sequencing of Klebsiella pneumoniae DNA using R9.4 1D flow cell (Wick et al., 2017), (ii) MinION sequencing of Escherichia coli DNA using R9 2D flow cell (http://lab.loman.net/2016/07/30/nanopore-r9-data-release/), (iii) MinION sequencing of E.coli DNA using R9.4 1D flow cell (https://www.ncbi.nlm.nih.gov/sra/SRX4387499[accn]), (iv) MinION sequencing of Human genome using R9.4.1 flow cell (De Coster et al., 2019) and (v) Simulated read data from GRCh38 chromosome 1 using Deep Simulator (Li et al., 2018) for benchmarking the performance of QAlign.
Datasets for RNA-seq alignments: The experiments are based on the RNA reads obtained by MinION sequencing of human cDNA using R9.4 1D flow cell (https://github.com/nanopore-wgs-consortium/NA12878), and MinION sequencing of mouse cDNA using R9.4 2D flow cell (Byrne et al., 2017) (SRA access No. SRR5286961).
Compared to DNA-seq datasets, RNA-seq datasets carried out using nanopore sequencing are relatively rare. We select these datasets because they have relatively complete reference transcriptome [e.g. for human there are 200 401 annotated transcripts (https://www.gencodegenes.org/human/release_27.html) and for mouse 46 415 annotated transcripts from UCSC Genome Browser (Haeussler et al., 2019)], and the corresponding Q-mer map models (https://github.com/jts/nanopolish/tree/master/etc/r9-models) are available for quantization.
3.2 DNA read-to-genome alignment
The alignment of DNA reads to the genome is a task with wide-ranging applications in sequencing experiments. It is a required step in variant calling pipelines (DePristo et al., 2011), in particular structural variant calling can benefit significantly from long reads offered by the nanopore sequencing platform (Stancu et al., 2017). It is also useful in calling variants in long segmental duplications (Chaisson et al., 2017), where long duplications necessitate long reads to resolve the repeat ambiguity. Another application for DNA read-to-genome alignment appears in reference matching—for example, in meta-genomics, in estimating which reference species is present in the sample.
The results are illustrated in the Figure 3 and Table 1. At a coarse level, the performance is measured by the fraction of the reads that have been well-aligned by the algorithm. A read is said to be well-aligned if at-least 90% of the read is aligned to genome and has either the (approximate) normalized edit distance from Minimap2 (i.e. number of unmatched bases, normalized with the read length) below a threshold value or the mapping quality from Minimap2 is high (see Section 2). QAlign is shown to significantly improve the fraction of well-aligned reads—in particular, in the K.pneumoniae R9.4 1D dataset, this metric improves to from . In the E.coli R9.4 1D dataset, it improves to from ; in the E.coli R9 2D dataset, the numerics improves to from and for the human R9.4.1 dataset, it improves to 87.95% from 85.70%. For the benchmark with the simulated data, the numerics improves to 84.35% from 69.04% (refer to Table 1).
Fig. 3.

Nanopore long DNA reads alignment onto Genome. (a) Comparison of normalized edit distance for K.pneumoniae R9.4 1D reads data. Smaller values for normalized edit distance is desirable as it represents better alignment. The slope of the regression line is <1, therefore, representing better alignments with Q2 than nucleotide alignments for same reads on average. (b) Comparison of normalized align-length on genome for K.pneumoniae R9.4 1D reads data. Normalized alignment length of 1 is desirable as it represents that entire read is aligned. Majority of the reads are above y = x line representing longer alignment length in Q2 than nucleotide alignment
Table 1.
Comparison for the percentage of well-aligned reads onto genome, and slope of the regression line (for normalized edit distance comparison plot of Q2 versus nucleotide alignments) with randomly sampled reads for each datasets
| Dataset (no. of sampled reads) | Method of alignment | Percentage well-aligned reads | Slope of regression line |
|---|---|---|---|
| K.pneumoniae R9.4 1D (1k) | Nucleotide | 79.4 | 0.8181 |
| Q2 | 88.70 | ||
| E.coli R9.4 1D (1k) | Nucleotide | 79.2 | 0.9584 |
| Q2 | 84.20 | ||
| E.coli R9 2D (1k) | Nucleotide | 82.6 | 0.9627 |
| Q2 | 91.8 | ||
| Human R9.4 1D (50k) | Nucleotide | 85.70 | 0.9696 |
| Q2 | 87.95 | ||
| Simulated human with deep simulator (Li et al., 2018) (10k) | Nucleotide | 69.04 | 0.8527 |
| Q2 | 84.35 |
Note: The slope of the regression line shows the average gain in the normalized edit distance.
The results in Figure 3a and b compare the quality of the alignments using Minimap2 and QAlign at a fine-grained level for the K.pneumoniae dataset (plots for other datasets are available in Supplementary Figs S1–S10).
Specifically, Figure 3a compares the normalized edit distance for QAlign and Minimap2. The normalized edit distance is the edit distance between the entire read and the aligned section on the genome normalized with the length of the read, in nucleotide domain for both nucleotide alignment and quantized alignment (Q2). In case of Q2, the information of the location of the alignment on the genome is leveraged from the alignment between the quantized read and the quantized genome first, and the edit distance is computed between the corresponding nucleotide read and the aligned section on the nucleotide genome (see Section 2 for details). Intuitively, the normalized edit distance gives a measure of how close the two sequences are. Therefore, the smaller the normalized edit distance, better is the alignment. In addition, the normalized edit distance for the reads that have normalized edit distance of aligned reads more than 0.48 is set to 1 (we noticed that the normalized edit distance between a pair of random DNA sequences is above 0.48, refer to Supplementary Fig. S18). Therefore, the figure represents only those alignments that are better than alignment of random DNA sequences.
To better visualize the results, we group alignments with different colors and marks for different conditions. The red circles in Figure 3a and b represent the reads that are well-aligned in both nucleotide and Q2 alignments and at nearly the same location on the genome. The blue cross represent well-aligned reads in both Q2 and nucleotide alignments but at different location on the genome or on a different chromosome. The black asterisks are the reads that are well-aligned in Q2 only, i.e. in nucleotide alignments, the alignment of these reads are either missing or does not satisfy the definition of the well-aligned reads. The green diamonds are the reads that are well-aligned in nucleotide alignments only. The pink square points are the reads that are not well-aligned in both Q2 and nucleotide alignments. For each read, there could be multiple alignments on the genome because of the repeats in the genome, but we consider the alignment that has the minimum edit distance amongst all of them for the evaluation in these plots.
Figure 3a shows that the normalized edit distance is overall smaller for Q2 alignments than nucleotide alignments. The better alignment in Q2 is also evident from the slope of the regression line in Figure 3a. It shows that on average Q2 alignments has 18.19% improvement in terms of the normalized edit distance than the nucleotide alignments.
The results for another fine-grained metric are shown in Figure 3b, which compares the normalized alignment length on genome in Q2 to the normalized alignment length on genome in nucleotide alignments. The normalized alignment length is the ratio of the length of the section on genome where a read aligns to the length of the read. There are 10.1% reads that are well-aligned in Q2 only (the black asterisks), and the normalized alignment length is close to 1 in Q2 but it is much less than 1 in nucleotide alignments, therefore representing several non-contiguous alignments in nucleotide domain that are captured in Q2. The normalized edit distance for such reads in Q2 is much less than the normalized edit distance for the same reads in nucleotide alignments. Similar results are observed across different datasets as evident from the slope of the regression line for normalized edit distance comparison between Q2 and nucleotide alignments shown in Table 1.
3.3 Read-to-read alignment
Alignment of genomic reads to other reads is a basic primitive useful in many settings. For example, this is a first step in many overlap-layout-consensus assemblers (Pevzner et al., 2001). A key challenge in read-to-read assembly is the increased error rate that the aligner has to deal with. For example, if two reads R1, R2 are sampled from the same region of the genome, each may be within edit-distance of the reference genome (assuming a error-rate), however, the edit distance between R1 and R2 can be up to leading to an effective doubling of the error-rate. Long-reads hold the promise of fully automated assembly but are currently feasible only when for bacterial genomes (Loman et al., 2015). For complex mammalian genomes, long repeats fragment assembly (Pevzner et al., 2004) and more accurate alignment can help alleviate this problem.
The results for read-to-read alignment are illustrated in the Figure 4a and b and Table 2. Table 2 summarizes the precision, recall and average overlap quality for different methods used (namely, nucleotide, Q2 and Q3) to find the alignments between the overlapping reads across different datasets. It is evident from the table that Q2 provides higher recall and average overlap quality than nucleotide alignments at the cost of a bit lower precision. Q3, on the other hand, shows better recall and average overlap quality than nucleotide alignments at similar precision.
Fig. 4.

Nanopore long DNA read-to-read alignment. (a) Comparison of overlap quality for K.pneumoniae R9.4 1D reads dataset (Q2 versus nucleotide). Overlap quality of 1 is desirable as it represents the alignment of the algorithm matched the alignment in the ground truth exactly. Therefore, slope of the regression line >1 represents better overlap quality of Q2 alignments than nucleotide alignments on average. (b) Complementary CDF of overlap quality for K.pneumoniae R9.4 1D reads dataset. Q2 curve is strictly above the curve for nucleotide, therefore, demonstrating better overlap quality for Q2. Area under the curve gives an average overlap quality which is higher for Q2
Table 2.
Comparison for precision, recall and average overlap quality for read-to-read alignment for four different datasets
| Dataset | Method of alignment | Precision (%) | Recall (%) | Avg. overlap quality |
|---|---|---|---|---|
| K.pneumoniae R9.4 1D | Nucleotide | 97.47 | 67.99 | 0.4908 |
| Q2 | 96.93 | 72.92 | 0.5360 | |
| Q3 | 97.49 | 69.52 | 0.5053 | |
| E.coli R9.4 1D | Nucleotide | 99.20 | 62.27 | 0.4688 |
| Q2 | 99.06 | 62.60 | 0.4803 | |
| Q3 | 99.23 | 63.87 | 0.4811 | |
| E.coli R9 2D | Nucleotide | 98.94 | 59.42 | 0.5339 |
| Q2 | 96.97 | 65.47 | 0.5914 | |
| Q3 | 98.99 | 62.46 | 0.5615 | |
| Simulated Human with Deep Simulator (Li et al., 2018) | Nucleotide | 75.72 | 41.91 | 0.3888 |
| Q2 | 75.34 | 53.10 | 0.5100 | |
| Q3 | 76.08 | 54.19 | 0.5174 |
Note: Average overlap quality is computed as the area under the complementary CDF curve of overlap quality.
For a fine-grained evaluation, Figure 4a shows overlap quality comparison for the quantized (Q2) alignments versus nucleotide alignments using the K.pneumoniae dataset. The blue circles in the figure represent the overlaps that are aligned [An overlap between a pair of reads is said to be aligned by the algorithm if the Mapped region by the algorithm is at least 90% of the Mapped region plus the Overhang region (refer to Section 2 for more details).] in both QAlign and Minimap2. The black asterisks (along the line ) represent the overlaps that are aligned only in Q2 and not aligned in nucleotide, whereas the green diamonds (along the line ) represent the overlaps that are aligned only in nucleotide and not aligned in Q2. In Figure 4a, the read overlaps that are aligned only in Q2 is , whereas the read overlaps that are aligned only in nucleotide is 2.3%. Therefore, QAlign demonstrates a net gain of 5.0% in terms of the number of reads aligned by the algorithm. For the read overlaps that are aligned in both Q2 and nucleotide, of the read overlaps have overlap quality more than 0.9 in QAlign but not in Minimap2 whereas the opposite holds true in only of the read overlaps. Thus QAlign gives a net performance improvement of over Minimap2. In addition to that, the slope of the regression line in the figure is 1.0089, therefore also illustrating better overlap quality with QAlign than Minimap2.
Figure 4b shows the fraction of reads which have overlap quality greater than x for the two aligners—the performance gain is seen to hold across a wide range of threshold values x. The area under the curve (which equals the average overlap quality) is computed for nucleotide, Q2 and Q3 alignments across all the datasets and is demonstrated in Table 2. The gain in the average overlap quality is observed using QAlign across all the datasets as evident from Figure 4b. Specifically, there is a gain of 9.2% in K.pneumoniae dataset, when we compute it as the ratio of the average overlap quality of Q2 to average overlap quality of nucleotide alignments. Similarly, there is a gain of 2.5, 10.8 and 31.2% in the average overlap quality for the E.coli R9.4 1D, E.coli R9 2D dataset and simulated human dataset, respectively.
3.4 Read-to-transcriptome alignment
RNA-seq is a popular sequencing technology with emerging applications including single-cell RNA-seq (Tang et al., 2009). While short high-throughput reads may suffice to assess rough gene expression estimates, isoform level analysis is better facilitated by long nanopore reads that can straddle several exons simultaneously (Deamer et al., 2016). Here, we perform the alignment of cDNA reads (complementary DNA reads extracted from reverse transcription of RNA) onto a reference transcriptome.
The results for read-to-transcriptome alignment are illustrated in Figure 5a and b and Table 3. At a coarse level, QAlign improves the fraction of the well-aligned reads significantly. For the Human R9.4 1D dataset, the metric improves to 75.40% from 51.60%, and for the Mouse R9.4 2D dataset, it improves to 90.00% from 82.60%, as shown in Table 3.
Fig. 5.

Nanopore long RNA read to transcriptome alignment. (a) Comparison of normalized edit distance for Human R9.4 1D dataset. A small normalized edit distance is desirable as it represents better alignment. The slope of the regression line is <1, therefore, representing better alignments with Q2 than nucleotide alignments for same reads. (b) Comparison of normalized alignment length of the aligned sections on the transcriptome for Human R9.4 1D dataset. Normalized alignment length of 1 is desirable as it represents that entire read is aligned. Majority of the reads are above y = x line, representing longer alignment length in Q2 than nucleotide alignment
Table 3.
Comparison for the percentage of well-aligned reads onto transcriptome, and slope of the regression line (for normalized edit distance comparison plot for Q2 versus nucleotide) for two different dataset for randomly sampled reads for each dataset
| Dataset (no. of sampled reads) | Method of alignment | Percentage well-aligned reads | Slope of the regression line |
|---|---|---|---|
| Human R9.4 1D (2k) | Nucleotide | 51.60 | 0.9125 |
| Q2 | 75.40 | ||
| Mouse R9.4 2D (2k) | Nucleotide | 82.60 | 0.8455 |
| Q2 | 90.00 |
At a fine-grained level, Figure 5a compares the normalized edit distance for Human R9.4 1D dataset. Note that the normalized edit distance is set to 1 for the reads that have normalized edit distance of aligned reads greater than 0.48. Therefore, the figure represents the alignments that are not ‘equivalent’ to the alignment of random nucleotide sequences. This figure clearly demonstrates the gain of quantized alignment. Specifically, Q2 is able to align 27.00% more reads with 8.75% better quality than nucleotide alignments (from the slope of the regression line; a similar trend of slope of regression line using Mouse R9.4 2D dataset is shown in Table 3). In Figure 5b, the lengths of aligned chunks are compared between nucleotide and Q2 domain. Most of the reads gets larger aligned chunks using Q2 quantization. Moreover, we observe a similar trend in the alignment using the Mouse R9.4 2D dataset as shown by the slope of the regression line in Table 3.
4 Discussion
QAlign is a pre-processor that can be used with any long read aligner for a nanopore sequencer. It can be used for aligning reads onto genome or as a long-read overlapper or for aligning RNA-seq reads onto transcriptome. QAlign provides alignments that outperforms other aligners that uses nucleotide sequences in terms of the accuracy of the alignment at the cost of a similar computation time.
The reason for this performance improvement is because it takes into account the underlying physics of the nanopore sequencer through its Q-mer mapping, which could be the pre-dominant cause of the error behavior in nanopore sequencing. We demonstrated how the structure of the Q-mer map can be used even with only nucleotide read outputs, and without access to the current-level output of the sequencer. In particular, QAlign converts the nucleotide reads to quantized current levels (of finite alphabet size) which are then aligned using any state-of-the-art aligner. This improvement in the alignment of the long nanopore reads can be useful in several downstream applications such as structural variant calling, assembly—where the QAlign can benefit in the discovery of SVs and read overlaps that are difficult to capture because of the high error rate of nanopore reads.
The current limitation of QAlign is that it works well when we have long contiguity in the alignments. Therefore, it does not perform as well in doing the spliced alignments of the RNA-seq reads onto genome while maintaining a similar computation time cost (as shown using empirical results in Supplementary Fig. S20). Part of ongoing extensions is to build a deep hybrid aligner which brings together the advantages of the nucleotide alignments and QAlign.
Author’s contributions
D.J., S.K. and S.D. conceived the original idea and developed the project. D.J. led the development of the software tool, and S.M. assisted in its open-source development. D.J. and S.M. performed the analysis on the various datasets. All the authors wrote the manuscript.
Funding
S.D. and D.J. were supported in part by National Science Foundation [1705077]. S.M. and S.K. were supported in part by National Institutes of Health [1R01HG008164] and National Science Foundation [1651236 and 1703403].
Conflict of Interest: none declared.
Supplementary Material
Contributor Information
Dhaivat Joshi, Electrical & Computer Engineering, University of California, Los Angeles, CA 90095, USA.
Shunfu Mao, Electrical & Computer Engineering, University of Washington, Seattle, WA 98195, USA.
Sreeram Kannan, Electrical & Computer Engineering, University of Washington, Seattle, WA 98195, USA.
Suhas Diggavi, Electrical & Computer Engineering, University of California, Los Angeles, CA 90095, USA.
References
- Byrne A. et al. (2017) Nanopore long-read RNAseq reveals widespread transcriptional variation among the surface receptors of individual B cells. Nat. Commun., 8, 1–11. [DOI] [PMC free article] [PubMed] [Google Scholar]
- Chaisson M.J. et al. (2017) Resolving multicopy duplications de novo using polyploid phasing. In International Conference on Research in Computational Molecular Biology, May 2017. Springer, pp. 117–133. [DOI] [PMC free article] [PubMed] [Google Scholar]
- De Coster W. et al. (2019) Structural variants identified by Oxford Nanopore PromethION sequencing of the human genome. Genome Res., 29, 1178–1187. [DOI] [PMC free article] [PubMed] [Google Scholar]
- Deamer D. et al. (2016) Three decades of nanopore sequencing. Nat. Biotechnol., 34, 518–524. [DOI] [PMC free article] [PubMed] [Google Scholar]
- DePristo M.A. et al. (2011) A framework for variation discovery and genotyping using next-generation DNA sequencing data. Nat. Genet., 43, 491–498. [DOI] [PMC free article] [PubMed] [Google Scholar]
- Haas B.J. et al. (2013) De novo transcript sequence reconstruction from RNA-seq using the trinity platform for reference generation and analysis. Nat. Protoc., 8, 1494–1512. [DOI] [PMC free article] [PubMed] [Google Scholar]
- Haeussler M. et al. (2019) The ucsc genome browser database: 2019 update. Nucleic Acids Res., 47, D853–D858. [DOI] [PMC free article] [PubMed] [Google Scholar]
- Jain M. et al. (2018) Nanopore sequencing and assembly of a human genome with ultra-long reads. Nat. Biotechnol., 36, 338–345. [DOI] [PMC free article] [PubMed] [Google Scholar]
- Križanović K. et al. (2018) Evaluation of tools for long read RNA-seq splice-aware alignment. Bioinformatics, 34, 748–754. [DOI] [PMC free article] [PubMed] [Google Scholar]
- Laszlo A.H. et al. (2014) Decoding long nanopore sequencing reads of natural DNA. Nat. Biotechnol., 32, 829–833. [DOI] [PMC free article] [PubMed] [Google Scholar]
- Li H. (2011) A statistical framework for SNP calling, mutation discovery, association mapping and population genetical parameter estimation from sequencing data. Bioinformatics, 27, 2987–2993. [DOI] [PMC free article] [PubMed] [Google Scholar]
- Li H. (2018) MiniMap2: pairwise alignment for nucleotide sequences. Bioinformatics, 34, 3094–3100. [DOI] [PMC free article] [PubMed] [Google Scholar]
- Li Y. et al. (2018) DeepSimulator: a deep simulator for nanopore sequencing. Bioinformatics, 34, 2899–2908. [DOI] [PMC free article] [PubMed] [Google Scholar]
- Loman N.J. et al. (2015) A complete bacterial genome assembled de novo using only nanopore sequencing data. Nat. Methods, 12, 733–735. [DOI] [PubMed] [Google Scholar]
- Mao S. et al. (2017) abSNP: RNA-seq SNP calling in repetitive regions via abundance estimation. In 17th International Workshop on Algorithms in Bioinformatics (WABI 2017), May 2017. Schloss Dagstuhl-Leibniz-Zentrum fuer Informatik. [Google Scholar]
- Mao W. et al. (2018) Models and information-theoretic bounds for nanopore sequencing. IEEE Trans. Inf. Theory, 64, 3216–3236. [Google Scholar]
- Mikheyev A.S., Tin M.M. (2014) A first look at the oxford nanopore minion sequencer. Mol. Ecol. Resources, 14, 1097–1102. [DOI] [PubMed] [Google Scholar]
- Pevzner P.A. et al. (2001) An eulerian path approach to DNA fragment assembly. Proc. Natl. Acad. Sci. USA, 98, 9748–9753. [DOI] [PMC free article] [PubMed] [Google Scholar]
- Pevzner P.A. et al. (2004) De novo repeat classification and fragment assembly. Genome Res., 14, 1786–1796. [DOI] [PMC free article] [PubMed] [Google Scholar]
- Stancu M.C. et al. (2017) Mapping and phasing of structural variation in patient genomes using nanopore sequencing. Nat. Commun., 8, 1–13. [DOI] [PMC free article] [PubMed] [Google Scholar]
- Tang F. et al. (2009) mrna-seq whole-transcriptome analysis of a single cell. Nat. Methods, 6, 377–382. [DOI] [PubMed] [Google Scholar]
- Tran N.H. et al. (2017) De novo peptide sequencing by deep learning. Proc. Natl. Acad. Sci. USA, 114, 8247–8252. [DOI] [PMC free article] [PubMed] [Google Scholar]
- Wick R.R. et al. (2017) Completing bacterial genome assemblies with multiplex minion sequencing. Microb. Genomics, 3. [DOI] [PMC free article] [PubMed] [Google Scholar]
- Wu T.D., Watanabe C.K. (2005) Gmap: a genomic mapping and alignment program for mrna and est sequences. Bioinformatics, 21, 1859–1875. [DOI] [PubMed] [Google Scholar]
Associated Data
This section collects any data citations, data availability statements, or supplementary materials included in this article.