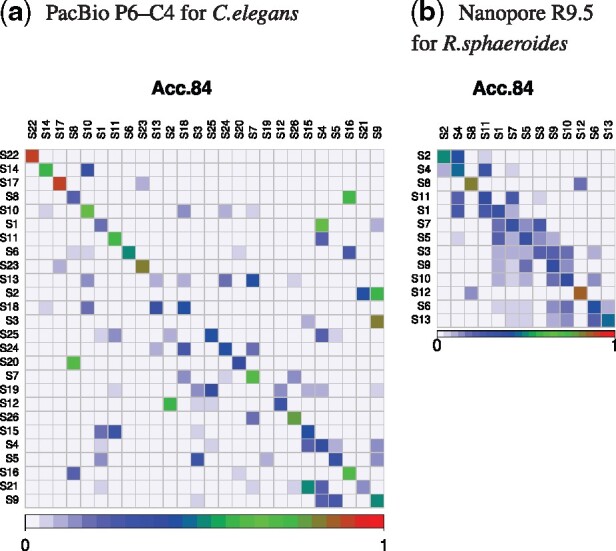
Fig. 5.

Transition probability matrixes of states of FIC-HMM. The vertical and horizontal axes represent states of FIC-HMM, which are sorted in order of increasing averaged quality score emitted by them. States on the vertical axis transition to ones on the horizontal axis. The sum of transition probabilities on each state of the vertical axis is 100%. These are matrixes of ‘Acc84’, a read group with an accuracy of 83.5–84.4%
