Abstract
Background
Effective soybean seed phenotyping demands large-scale accurate quantities of morphological parameters. The traditional manual acquisition of soybean seed morphological phenotype information is error-prone, and time-consuming, which is not feasible for large-scale collection. The segmentation of individual soybean seed is the prerequisite step for obtaining phenotypic traits such as seed length and seed width. Nevertheless, traditional image-based methods for obtaining high-throughput soybean seed phenotype are not robust and practical. Although deep learning-based algorithms can achieve accurate training and strong generalization capabilities, it requires a large amount of ground truth data which is often the limitation step.
Results
We showed a novel synthetic image generation and augmentation method based on domain randomization. We synthesized a plenty of labeled image dataset automatedly by our method to train instance segmentation network for high throughput soybean seeds segmentation. It can pronouncedly decrease the cost of manual annotation and facilitate the preparation of training dataset. And the convolutional neural network can be purely trained by our synthetic image dataset to achieve a good performance. In the process of training Mask R-CNN, we proposed a transfer learning method which can reduce the computing costs significantly by finetuning the pre-trained model weights. We demonstrated the robustness and generalization ability of our method by analyzing the result of synthetic test datasets with different resolution and the real-world soybean seeds test dataset.
Conclusion
The experimental results show that the proposed method realized the effective segmentation of individual soybean seed and the efficient calculation of the morphological parameters of each seed and it is practical to use this approach for high-throughput objects instance segmentation and high-throughput seeds phenotyping.
Keywords: Seed phenotyping, High throughput, Instance segmentation, Deep learning, Mask R-CNN
Background
The legume species soybean (Glycine max L.), ranking among the top five worldwide major crops [1], is one of the most important grain legumes. Also, it is an important source of vegetable oil and protein for human consumption [2]. Crop yield of soybean highly depends on three major aspects which are the number of pods per plant, the number of seeds per pod and the seed size [3]. The size of soybean seed, which is not only a very important appearance quality but also strongly associated with the commercial value [4], is an important agronomic trait that affects the quality and yield of soybean [5]. The seed morphological phenotypes, which include seed shape, seed length, seed width, seed height, seed circumference, seed surface area and seed volume and so on, are essential to reflect the growth and development, physiology, biochemistry and genetics of soybean [6]. Paying attention to the morphological traits of soybean seeds is a powerful indicator for improving crop yield. However, Effective soybean seed phenotyping requires large-scale accurate quantities of accurate morphological phenotype parameters. Thus, it is necessary to develop an automatic approach to acquire accurate soybean seeds morphological parameters information.
The traditional acquisition method of soybean seed morphological phenotype relies on manual approaches by measuring and evaluating the shape of the seed with a vernier caliper. Since the size of soybean seeds is small generally, the operation of manual measurements is labor-intensive, time-consuming and error prone extremely. Moreover, the phenotypic information of manual measurement is limited to the seed length, seed width, and seed height, and no more information can be measured, it is not applicable for large-scale collection of soybean seeds morphological phenotype information [6].
With the rapid development of imaging technology, it is possible to measure the morphological phenotype information of high throughput soybean seeds, however the seeds need to be sparsely placed without physical contact [6]. Traditional image-based researches on soybean seed phenotyping mainly include seed quality evaluation [5, 7–9], seed counting [10–12], etc. Also, image-based quantification of seed morphological phenotype information is widely used in rice grain [13], corn grain [14], etc. Widely used open-source image analysis software for seed morphological phenotype quantification include SmartGrain [15], ImageJ [16], CellProfiler [17], P-TRAP [18] and WinSeedle [19] and so on. These software are mainly based on classic but ordinary image processing techniques to separate individual seeds, such as morphological open operation [15], watershed algorithm [16, 17], and handcrafted feature based bespoke algorithm [19], etc. Some scholars also proposed a traditional image processing technology based method to extract high-throughput soybean seeds phenotype information automatically [6]. These software and methods mentioned above can realize the phenotype parameters measurement of high throughput seeds which are sparsely placed without overlap under consistent light condition to achieve an effective segmentation. When soybean seeds are densely sampled and physically contacted with each other or when the illumination condition of seeds is inconsistent, these seeds cannot be effectively segmented into individual seed to calculate each individual seed phenotype parameters, and these tailored image segmentation algorithms which are based on classic image processing technology are sensitive to the texture of object and illumination conditions [20]. Above all, traditional image processing methods show weak robustness and poor generalization ability. Instance segmentation network based on deep learning can achieves effective segmentation by learning the deep features of the images to solve above problems [21, 22].
Deep learning has gathered a wide attraction from scientific as well as industrial communities [23]. In the field of computer vision. Convolutional Neural Networks (CNN) are widely applied in various tasks, such as classification [24, 25], object detection [26, 27], semantic segmentation and instance segmentation [28, 29], which greatly improves the results while traditional image processing methods can’t achieve [30]. With the rapid development of massively parallel Graphics Processing Unit (GPU) computing technology and big data processing technology, the widespread success of deep leaning techniques has spawned a multitude of applications in computer vision-based plant phenotyping [22], including weed detection [31], crop disease diagnosis [25], fruit detection [32] and many other applications listed in recent reviews [33, 34].
Deep learning applied in quantitative image analysis has grown exponentially in the past few years. However, training an accurate deep learning model with strong generalization ability requires a large amount of labeled data which is one of the disadvantages of deep learning. Compared with relatively common tasks (ImageNet classification [35] and COCO detection [36]), the need of annotated data for specialized tasks in agricultural applications is even more pronounced [21, 37, 38]. Although many techniques aiming to decrease the cost of expert labeling cost (such as domain adaptation [39] or active learning [21]) without compromising performance have been widely used in plant phenotyping fields, the annotations of phenotyping dataset is still necessary for algorithms evaluation, and the labelling process is tedium, painful, labor-intensive and time-consuming. Especially in the phenotyping of high-throughput crop seeds, the annotation of crop seed instance segmentation dataset will be a tremendous challenge.
An improvement to reduce the cost of manual annotation is learning from synthetic images. Although the synthetic image dataset is not authentic compared with real-word dataset, the important advantages of synthetic image dataset is that ground truth annotations can be automatically obtained without manual labor. Furthermore, the synthetic image approach equips with the ability of creating almost unlimited amount of labeled training dataset. Synthetic data can represent changes in a variety of conditions, which is usually difficult to achieve through image augmentation techniques on real sense images. Kuznichov et al. [40] proposed a method to segment and count the leaves of Arabidopsis, avocado and banana, by using synthetic leaf texture located with different sizes and angles to simulate images obtained in real agricultural scenes. Toda et al. [41] proved that synthetic datasets, which rendered the combination and direction of seeds, was sufficient to train an instance segmentation network to segment the high throughput barley seeds from real-world images. Collectively, synthetic image datasets have a great potential in computer vision-based plant phenotyping research field.
Transfer learning, which exploits the related knowledge in source domain to help the learning of the target domain [42], is one of the effective approaches which can reduce the costs of manual annotation and computing cost on the target domain dataset. Bosilj et al. [31] studied the role of deep learning-based knowledge transfer for different various of crop, with the purpose of reducing the training time and manual annotation work required in new task. The author proved that transfer learning could be used between different crops and could reduce training time by up to 80%. Coulibaly et al. [43] proposed a method of using transfer learning and feature extraction to realize the identification of pearl millet mildew, and achieved 95% accuracy, 94.5% recall and 91.75% F1-score. Sakurai et al. [39] investigated the effectiveness of transfer learning in plant segmentation tasks. In summary, transfer learning has great potential in the field of plant phenotyping, which can not only reduce the cost of data annotation, but also reduce the training time on new tasks.
To efficiently tackle individual soybean seed quick segmentation for high-throughput soybean seeds phenotype data extraction at individual seed level, we propose a method based on Mask R-CNN and transfer learning. Since the deep learning-based instance segmentation requires a large amount of labeled data, and the number of soybean seeds in each image is abundant, the labeling process is destined to be labor-intensive and time-consuming. Hence, we instead train with synthetic soybean seeds images dataset which were prepared by our novel synthetic image generation and augmentation approach which can generate the origin image and labeled image pair synchronously. The approach presented herein is motivated by high throughput soybean seeds phenotyping task. This work built on pioneer research on Mask R-CNN network, retrained by our synthetic labeled image dataset.
The paper’s contributions:
A method was proposed for rapidly and automatically generating synthetic labeled high throughput soybean seeds image dataset.
A hybrid sim/real dataset was designed for training and evaluating high throughput soybean seeds instance segmentation methods transferring from simulation to reality robustly.
A synthetic image dataset based Mask R-CNN with transfer learning was adapted to perform high throughput soybean seeds instance segmentation.
Multi-group comparation experiments were designed to evaluate the sim-to-real generalization abilities of Mask R-CNN trained by our synthetic dataset.
Methods
Raw soybean seeds image acquisition
Soybean seeds used in this research were zhonghuang-30 and zhonghuang-42 which were supplied by Ministry of Agriculture and Rural Affairs Key Laboratory of Soybean Biology, the Institute of Crop Sciences, Chinese Academy of Agricultural Sciences. Zhonghuang-30 is an early-maturing variety of northern spring soybeans with a growth period of about 124 days. The plant height is about 64 cm. The number of main stem nodes is 15, and the effective branches are 1.1. Round leaves, purple flowers, brown hair, determinant growth habit. The grains are round, the seed coat is yellow, with a weak luster, brown hilum, and the weight of one hundred seeds is 18.1 g. Resistance to mosaic virus disease and gray spot disease. The fat content is 21.44% and the protein content is 39.53%. Zhonghuang-42 has an average growth period of 116 days. The plant height is about 71.1 cm, the effective branches are 0.9. The number of seeds per plant is 62.0. The grains are oval, the seed coat is yellow, with luster, light brown hilum and the weight of 100 seeds is 27.2 g. Oval leaves, purple flowers, gray hair, determinant growth habit. The average crude protein content is 45.08%, and the crude fat content is 19.23%. All the soybean seeds were threshed manually. The detail phenotypic descriptors of these varieties were summarized in Table 1. The single soybean seed upon the black-colored flannel was captured by the camera sensor of an iPhone 6 s plus (Apple) erected on a tripod with the image size of 3024 × 3024 at 72 dpi in three kind of illumination conditions as shown in Fig. 1. The working distance of camera sensor was fixed about 15 cm above the black-colored flannel background.
Table 1.
The detail phenotypic descriptors of zhonghuang-30 and zhonghuang-42 soybean seeds
| Soybean varieties | Seed shape | Seed coat color | Hilum color | 100 grain weight |
|---|---|---|---|---|
| Zhonghuang-30 | Round | Yellow | Brown | ~ 18.1 g |
| Zhonghuang-42 | Oval | Yellow | Light brown | ~ 27.2 g |
Fig. 1.

The soybean seed images were captured in three kind of illumination conditions. a outdoor scene in the daytime; b indoor scene in the daytime with fluorescent light; c indoor scene at night with fluorescent light
Software libraries and hardware
The processing unit was a Lenovo Y7000P laptop with an Intel Core i7-9750H@2.60 Hz CPU, 16 GB RAM, and single GPU (Geforce GTX1660 Ti, NVIDIA). The environment of deep-learning-related procedure included Integration Develop Environment (IDE) integrating Python 3.6, Keras (ver. 2.1.5), Tensorflow_GPU (ver. 1.13.1) OpenCV3 (ver. 3.4.2), which were operated in Windows 10 64bit. The synthetic image-related procedure was operated on the same environment (GPU was not involved in computation). The manually annotation of real-world soybean seeds image was operated on the same environment using LabelMe (ver. 3.16.5).
Synthetic image generation and augmentation
We randomly chose 200 soybean seeds for each cultivar (total of 400; 200 seeds for 2 cultivars), and each single soybean seed were placed above the black flannel and saved as an individual image file (total 400 seed images). These 400 seed images were used to create synthetic image datasets. The procedure of synthetic image generation was illustrated as following.
First, prepare a “background image pool (BIP)” and a “soybean seed image pool (SSIP)”. The BIP was prepared by capturing the actual black flannel background 10 times. The 10 background images were cropped at the fixed size of 256 × 256, 512 × 512, 1024 × 1024 randomly. The 10 different background images are different from each other as there are some dander of soybean seed on the black flannel. What needs to be pointed out is that the difference is not significant. And the SSIP was constituted by capturing a single soybean seed above the black flannel which made it convenient for the background subtraction.
Then, preprocess the image of the “soybean seed image pool”. Since the background was the black flannel, the classic threshold segmentation algorithm was opted to subtract the background. And it was cropped to get region of interest (RoI) as the soybean seed occupied a small area in the entire image, leaving a large blank space.
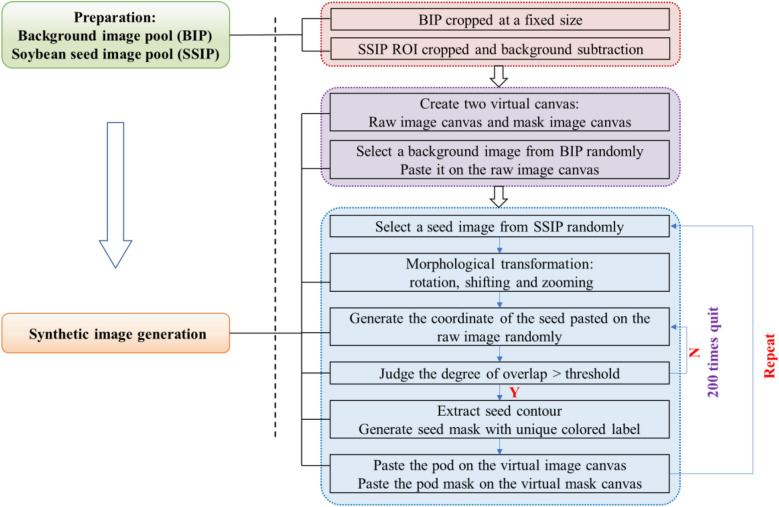
Last, synthesize high-throughput soybean seeds raw image and mask image pair. Firstly, select a background image from the BIP randomly and past it on the raw image canvas. Secondly, select a seed image randomly from the preprocessed SSIP and rotate and zoom the seed image randomly. Then, get the seed area and paste it on the coordinate of the raw image canvas. The coordinate was randomly determined but restricted by the canvas size and the minimum Euclidean distance between the new coordination and the coordinate of the soybean seeds pasted on the canvas before to adjust the degree of overlap. The detailed restriction of the coordinate was shown in the Formula 1. Thirdly, generating the corresponding mask image canvas by filling the seed area with different color selected from “Jet” colormap randomly and pasting the colored seed on the coordinate of the mask image canvas with black background. After the above three steps, one soybean seed was labeled in one color automatedly. Lastly, repeat above three steps until the coordinate can’t meet the minimum Eucliean distance requirments. Above all, a pair of synthetic high throughput soybean seeds raw image and mask image was generated which each single soybean seed in raw synthetic image was pasted on the corresponding position of mask image and was labeled in different color automatedly. Above all, the procedure of synthetic image datasets generation and augmentation method was shown in Fig. 2.
| 1 |
Fig. 2.
The procedure of one pair of synthetic images (raw image and mask image) generation and augmentation method
was the coordinate of the ith soybean seed pasted on the canvas; was the center point coordinate of the ith soybean seed pasted on the canvas; was the center point coordinate of the 1st ~ (i-1)th soybean seed pasted on the canvas.
| 2 |
Length was the sum of diagonal distance of the bounding box of two soybean seeds, ratio is man-made parameter which used to control the overlapping of two soybean seeds.
As illustrated in Formula (2), the minimum threshold is related to the size of each soybean seed, which is a variable. Thus, we can adjust the ratio parameter manually to control the overlapping to obtain our desired synthetic results. For example, if we want to generate heavily overlapped image, we can decrease the ratio, otherwise vice versa. In this paper, the ratio is set 0.3.
Real-world soybean seeds test dataset preparation
While we generated the synthetic soybean seeds test dataset by the method described in the previous section, a real-world soybean seeds test dataset was prepared consisting of 40 images by the following steps: (a) use a 100-seed board to select about 100 soybean seeds randomly one time; (b) tile these seeds upon the black-colored flannel randomly and make these seeds densely sampled (e.g., physically touching) to simulate the phenotypic investigation in the real scene; (c) capture 8 images (4 images for 2 cultivars) with the image size of 3024 × 3024 by the camera sensor of an iPhone 6 s plus (Apple) erected on a tripod with about 0.3 m working distance and 32 images (16 images for 2 cultivars) with the image size of 1920 × 1080 at 96 dpi by the RGB sensor of Kinect v2 (Microsoft, Redmond, WA, USA) erected on a tripod with about 0.75 m [20] working distance as shown in Fig. 3. The detail of real-world soybean seeds test dataset preparation was summarized in Table 2. Before manual annotation, the images were cropped according to the region of interest (RoI). The real-world soybean seeds images with the seeds heavily and physically touching, which were annotated by LabelMe [44] manually, were used as testing dataset for assessing the generalization ability of the model retrained by our synthetic datasets. The manual annotation results were explained in the later section.
Fig. 3.
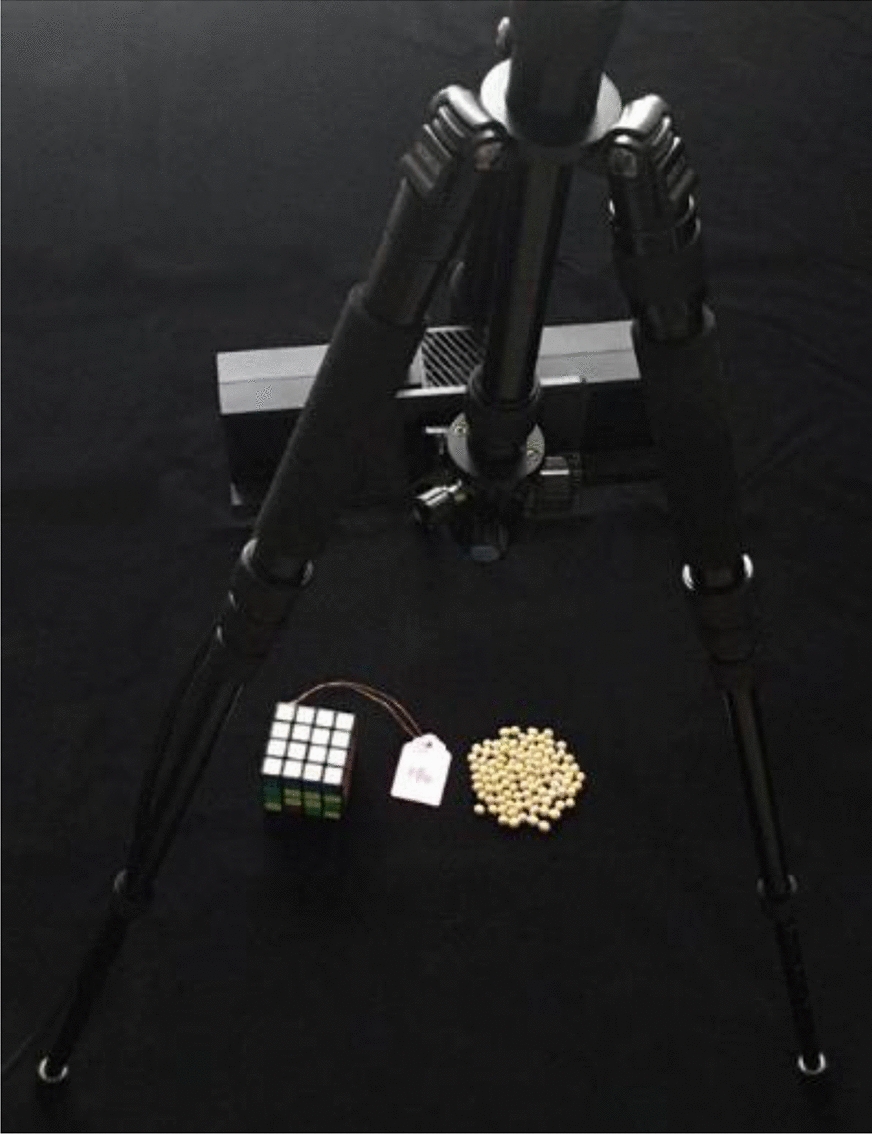
The acquisition scene setting of real-world high throughput soybean seeds
Table 2.
The detail information of our real-world soybean seeds test dataset
| Test image | Number of images | Image size | Seed counts | Sensor | Imaging distance |
|---|---|---|---|---|---|
| Test dataset_1 | 8 | 3024 × 3024 | ~ 100 | iPhone 6 s plus | ~ 0.3 m |
| Test dataset_2 | 32 | 1920 × 1080 | ~ 100 | Kinect v2 | ~ 0.75 m |
Model training
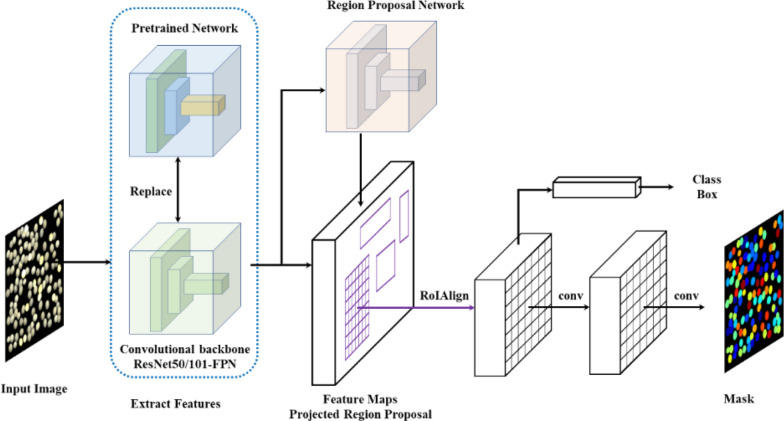
Mask R-CNN [45], consolidated by an object detection algorithm Faster R-CNN [46] and a semantic segmentation algorithm fully convolution network (FCN) [47] as shown in Fig. 4, is a sophisticated segmentation method, which can be trained by massive hand-labeled images datasets to segment specific categories of object. A Mask R-CNN implementation on the Keras/Tensroflow backend [48] was opt after experimenting with various implementation. Two feature extraction architectures (ResNet50/101-FPN [49] backbone) were evaluated. Left–right, up-down, rotation, brightness and Gaussian blur image augmentations were used herein to increase the diversity of dataset. The batch size was 2 when the image size was 256 × 256 and 512 × 512, and was 1 when the image size was 1024 × 1024. Since we focus on training the mask branch, the loss weight of the mask was set to 2.0, the other loss weights are set 1.0. A connection dropout probability of 0.5 was added to the fully connected layers to prevent from overfitting. Table 3 was the network configuration which was selected empirically after training and analyzing the test results.
Fig. 4.
Mask R-CNN with the pretrained network for high-throughput soybean seeds instance segmentation
Table 3.
Network parameters for high-throughput soybean seeds instance segmentation using Mask R-CNN
| Parameters | Values |
|---|---|
| Backbone layer | ResNet 50/101 |
| Head layer | Faster R-CNN |
| Input size | 256*256 / 512*512/1024*1024 |
| Anchor ratio | [0.5, 1, 2] |
| Learning rate | 0.001 |
| Epoch | 40 |
| RPN anchor scale | (8, 6, 32, 64-128) |
| Pre-processing | Mean-subtraction |
| Image resize mode | None |
| Augmentation | LR, UD, Rotation, Brightness, Gaussian Blur |
Before the model training, two pre-trained model weights based on MS-COCO dataset [36] and synthetic barley dataset [41], were introduced using transfer learning to solve the problem of high-throughput soybean seeds instance segmentation. Retraining on the basis of the pre-trained model was divided into two steps: (1) Only train the head layers which include the RPN, classifier and mask heads of the Mask R-CNN. And the weights of the heads are randomly initialized by default xavier initializer and zeros bias initializer. In order not to weaken the feature extraction ability of the backbone layer, we frozen all backbone layers and only trained the randomly initialized head layers for 20 epochs. (2) Fine-tune all layers. To better adapt on our new dataset, we fine-tuned all layers for 20 epochs after training the head layers. The reason why 20 epochs are considered will be illustrated in experiments and results section.
Model evaluation metrics
To evaluate the accuracy of high-throughput soybean seed instance segmentation model, two indicators included average precision (AP) and recall, used to evaluate in the original research [44], were also used herein.
The result of a model prediction is classified as true positive (TP), false positive (FP), true negative (TN), false negative (FN). The precision and recall are calculated by the following Formula 3:
| 3 |
Intersection over union (IoU) is a basic evaluation indicator and it measures the overlap of two regions, which is the ratio of the overlap of the two regions to the total area of the two (the overlap is only calculated once) as shown below:
| 4 |
To calculate the values of Recall, we use bounding boxes IoU. For each ground-truth bounding box, when the detected bounding box overlaps the ground-truth over the IoU threshold, we considered it was the correct detection, which was counted as TP, otherwise we considered it was the wrong detection (FP). And when the predicted bounding box with no ground-truth, we determined it was FN.
AP is defined as the area under the curves (AUC) of precision and recall using different confidence of the detected soybean seed. And it is evaluated at 10 different masks IoU threshold levels from 0.5 to 0.95 with the interval of 0.05. AP50 and AP75 are the prediction accuracy rates when the masks IoU threshold are 0.5 and 0.75, respectively. As AP75 requires correct matching with more precise masks, AP75 is more stringent than AP50. AP@ [0.5:0.95] is the average value of APs with all the masks IoU thresholds.
The definition and principles of the bounding boxes IoU and masks IoU were depicted in Fig. 5. And they were calculated by the following equation:
| 5 |
Fig. 5.
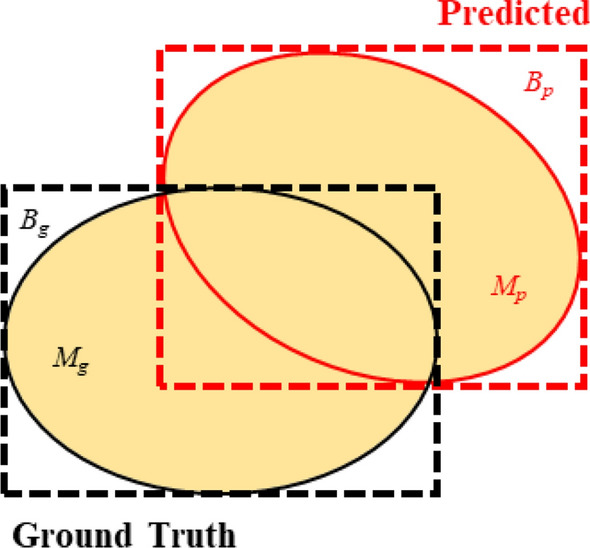
The definition and principles of the bounding boxes IoU and masks IoU. Where Bg is ground truth bounding boxes, Mg is the ground truth masks, Bp is the predicted bounding boxes, Mp is the predicted masks
Qualification of soybean seed morphology
After high-throughput soybean seeds were segmented into individual single seed, the seed morphology phenotype quantification was applied. We use the “measure.regionprops” module of the scikit-image library to calculate the morphological parameter of the seed, such as length and width.
The soybean seed shape traits are defined in the Fig. 6. In our study, as the high-throughput soybean seeds phenotype analysis was based on two-dimensional image, it was impossible to obtain the seed length, seed height and seed width of soybean seed from one image synchronously. Hence, we considered a hypothesis that average value of the seed height and seed width measured by a digital vernier caliper is the reference of seed width in our study.
Fig. 6.
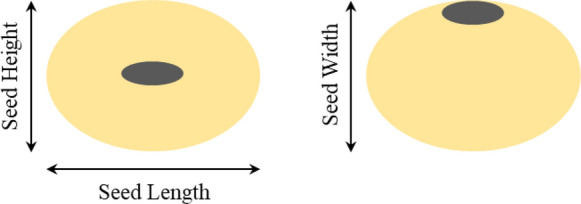
seed length, width and height of soybean seed
We select 100 soybean seeds for each cultivar with a 100-seed board randomly, and use a digital vernier caliper to measure each seed length height and width three times, and then calculate the average value as the seed shape phenotype data of this soybean seed.
Experiments and results
Preparation of soybean seeds dataset
We generated images with size of 256*256, 512*512, 1024*1024 respectively, and the soybean seeds were randomly located inside the canvas region by our procedure as shown in Fig. 7. We prepared a small training dataset and a large training dataset for each size of synthetic image to fine-tune the pretrained Mask R-CNN. The small training dataset constituted by 220 set of image pairs of synthetic soybean seeds images and its mask images, 200 of those images for training, 20 for validation. And 1100 set of image pairs constituted the large training dataset, 1000 for training, 100 for validation. We also prepared another new 200 set of image pairs for each image size as synthetic test dataset, and these synthetic images were not used in the model training or validation. The generation time was about 274, 487, 575 min respectively for all the datasets of each image size. The preparation of synthetic image datasets of soybean seeds was shown in Table 4.
Fig. 7.
Some examples of labeled synthetic images. The first row shows the synthetic raw images, and the second row shows the corresponding labeled mask images
Table 4.
The detail of three different image size of 256*256, 512*512, 1024*1024 datasets for training, validation and testing generated by our image synthetic method
| Image size | Seed count | Large dataset | Small dataset | Test dataset | Generation time/min |
|---|---|---|---|---|---|
| Train./Val. | Train./Val. | ||||
| 256*256 | 50–80 | 1000/100 | 200/20 | 200 | 274 |
| 512*512 | 80–100 | 1000/100 | 200/20 | 200 | 487 |
| 1024*1024 | 100–120 | 1000/100 | 200/20 | 200 | 575 |
In the preparation of the real-world soybean seeds test dataset, a sample image of real-world soybean seeds test dataset as shown in Fig. 8, the time of manual annotation process with LabelMe was about 60 min per image. Compared with the preparation of real-world soybean seeds test dataset, which had a plethora of soybean seeds per image and the labor-intensive annotation process of the test dataset was destined to be extremely tedious, our synthetic image generation and augmentation method can prepare plenty of labeled image dataset according to our experiments and can decrease the labor cost significantly. In addition, the real-world soybean seeds image dataset labeled by LabelMe with the contour of soybean seed was fitted by a polygon as shown in Fig. 8(b) which we tried our best to better fit the soybean seeds contours. From Fig. 8(c), we can obviously distinguish that the manually labeled real-world soybean seed image was not better than our synthetic labeled image, for the contours of soybean seeds fitted by polygons were not smooth resulting the instance masks of soybean seeds were not real.
Fig. 8.
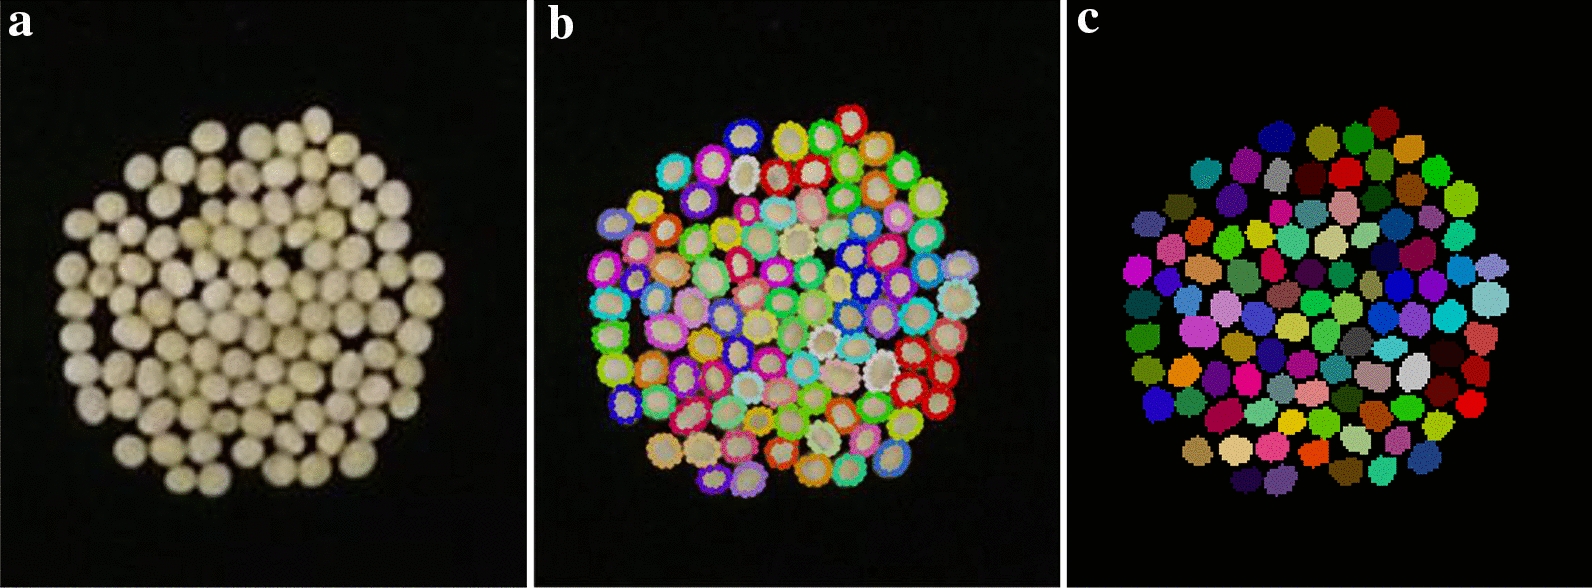
One labeled image data of real-world soybean seed test dataset. a raw image, b annotated by LabelMe, c Instance masks
Instance segmentation results of soybean seed
Before exhibiting the results of object detection and instance segmentation with Mask R-CNN, we used two unsupervised segmentation methods like contour detection methods and watershed algorithm on our real-world soybeans test dataset. However, both of them failed to segment the soybean seeds which were heavily overlapping. As illustrated in the second row of Fig. 9, we employed basic thresholding and contour extraction approach to identify the contour of soybean. The result showed that a group of soybean seeds are in one contour, and in fact those seeds are multiple, which was an inaccuracy segmentation. Comparing to thresholding and contour extraction method, watershed algorithm performed better as shown in the third row of Fig. 9, but it also failed to extract all objects when target objects overlap or touch densely with each other. Additionally, unsupervised method depends on empirical parameter, which is fussy to tune the parameters to obtain satisfying result, furthermore the parameter varies with different target object layout.
Fig. 9.
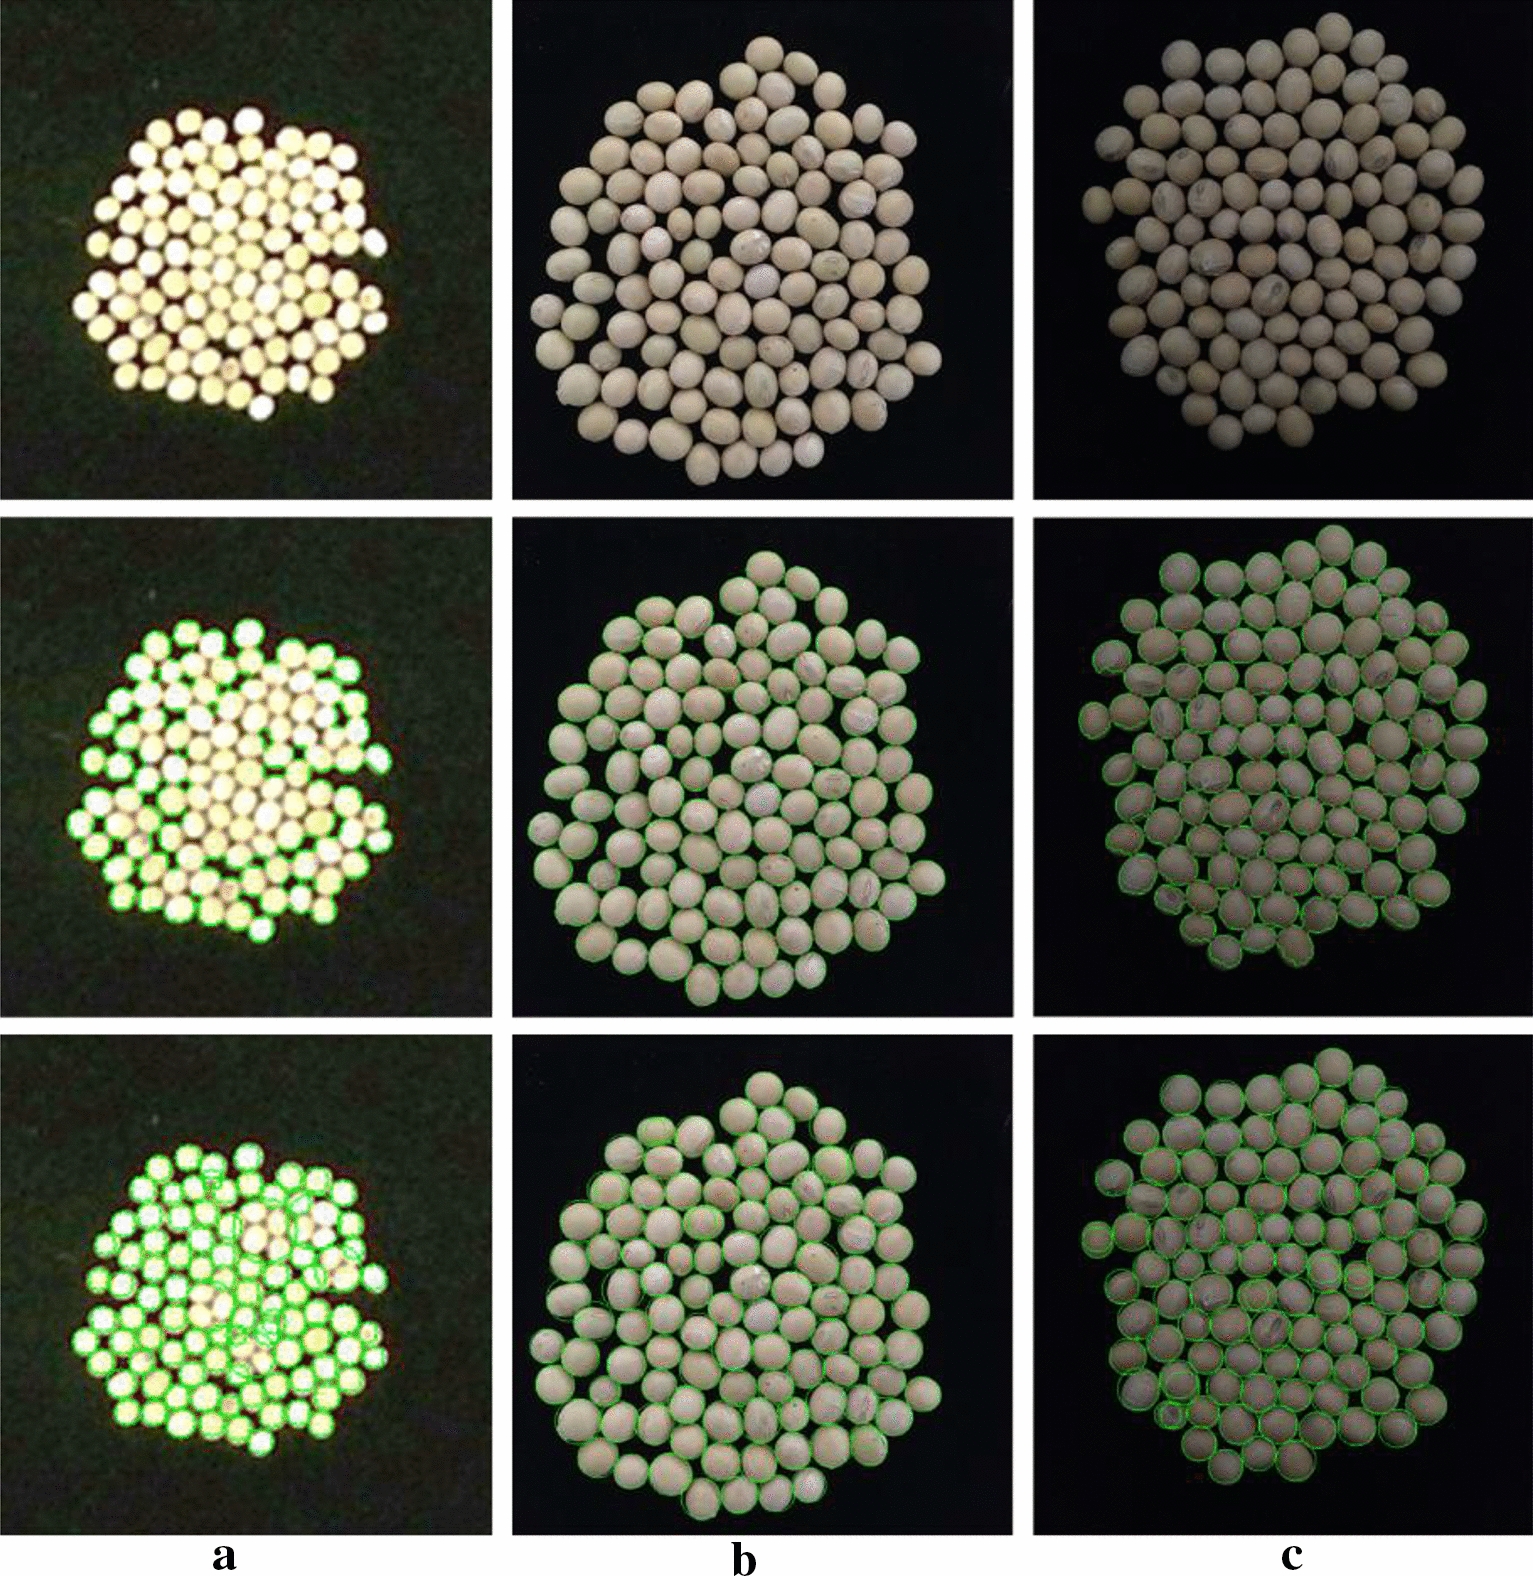
An example of the visual results using unsupervised segmentation methods on our real-world soybean seed images. a real-world soybean seeds test image captured by Kinect v2 outdoor, b real-world soybean seeds test image captured by iPhone 6 s plus at indoor scene in the daytime with fluorescent light, c real-world soybean seeds test image captured by iPhone 6 s plus at indoor scene at night with fluorescent light. The first row was the input soybean seeds test image, the second row was the results of the thresholding and contour extraction method, and the third row was the results of watershed algorithm
The visual results and the quantitative of evaluation metrics of object detection and instance segmentation with Mask R-CNN were illustrated herein. The output of the trained Mask R-CNN model was a set of classes, bounding boxes coordinates and masks images of soybean seed regions. One example of visualized results of synthetic soybean seeds test image and real-world soybean seeds test images in different illumination conditions with different imaging sensors was shown in Fig. 10, which showed that the soybean seeds were accurately located and segmented by the trained model regardless of their shape, size, location, illumination condition and resolution.
Fig. 10.
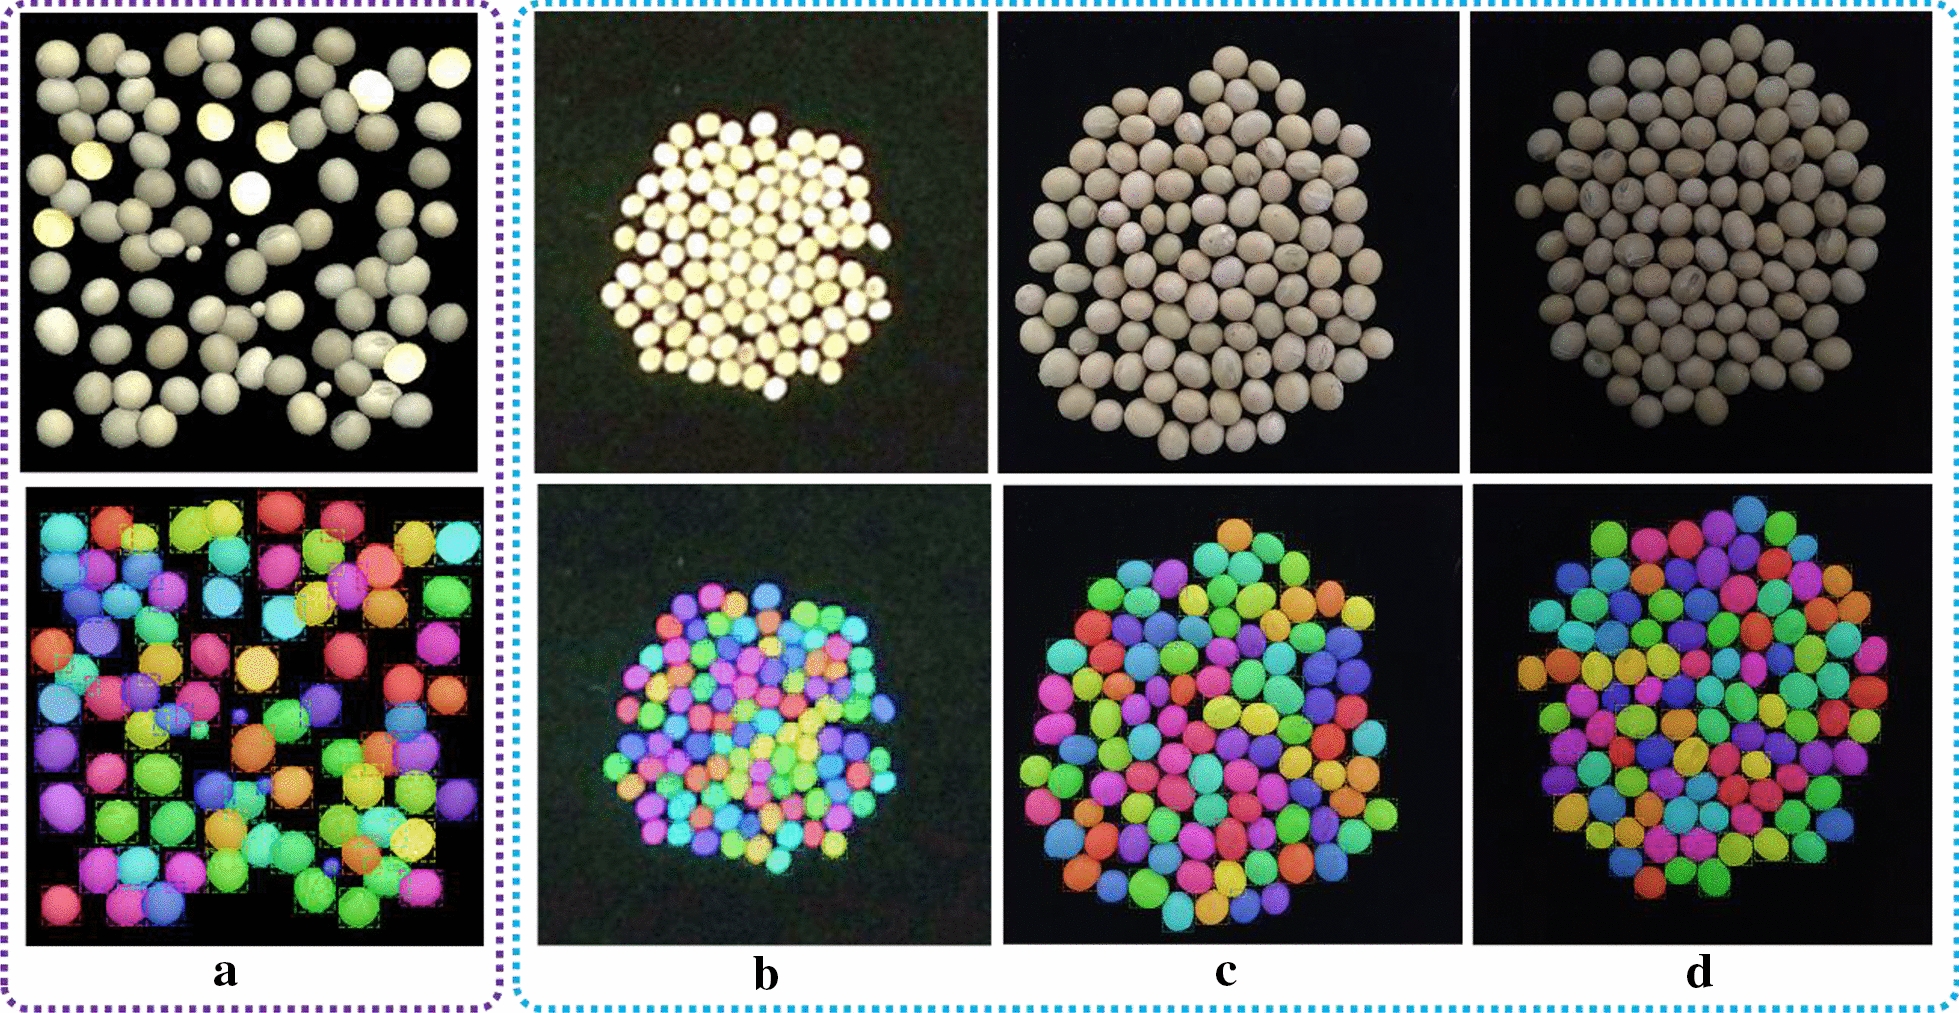
One example of visualized results of output of synthetic soybean seeds test image and real-world soybean seeds test image. a synthetic soybean seeds test image, b real-world soybean seeds test image captured by Kinect v2 outdoor, c real-world soybean seeds test image captured by iPhone 6 s plus at indoor scene in the daytime with fluorescent light, d real-world soybean seeds test image captured by iPhone 6 s plus at indoor scene at night with fluorescent light. The first row was the input soybean seeds test image, the second row was the results of our model output
Above, traditional unsupervised methods rely on texture features of object, and it is also sensitive to the layout of target objects and illumination, which bring about instability. Whereas machine learning-base method training a model by quantity of data, it solves the shortage of traditional methods in aspect of empirical based parameter tuning and instability.
The model was also evaluated by the test datasets which included synthetic image dataset with three kind of image size and real-world soybean seed image dataset. Tables 5 and 6 summarized the quantitation of evaluation metrics of the model retrained by our large dataset and small dataset of 256 × 256 px with COCO weights respectively. We can conclude that the ResNet101-FPN backbone layer can learn more features than ResNet50-FPN backbone layer particularly in small dataset. For a new instance segmentation task, comparing the real-world soybean seeds segmentation results, we came to the conclusion that the network with ResNet101-FPN trained by the large training dataset with 1000 images brought the best expected gains, then the performance from high to low was the network with ResNet101-FPN trained by the small training dataset, the network with ResNet50-FPN trained by the large training dataset, the network with ResNet50-FPN trained by the small training dataset.
Table 5.
The quantitation of evaluation metrics of the model retrained by the large dataset of 256 × 256 px with COCO weights
| Dataset | Large dataset in the image size of 256 × 256 | |||||||
|---|---|---|---|---|---|---|---|---|
| Pre-trained model | Pre-trained COCO weights [35] | |||||||
| Backbone layer | ResNet50-FPN | ResNet101-FPN | ||||||
| Test dataset | Synthetic | Real-world | Synthetic | Real-world | ||||
| 256 | 512 | 1024 | 256 | 512 | 1024 | |||
| Recall50 | 0.99 | 0.99 | 0.97 | 0.86 | 0.99 | 1.0 | 0.97 | 1.0 |
| AP50 | 0.99 | 0.99 | 0.98 | 0.83 | 0.99 | 1.0 | 0.98 | 1.0 |
| AP75 | 0.99 | 0.93 | 0.95 | 0.64 | 0.99 | 1.0 | 0.98 | 0.98 |
| AP@[0.5:0.95] | 0.78 | 0.68 | 0.65 | 0.50 | 0.90 | 0.85 | 0.82 | 0.72 |
Table 6.
The quantitative of evaluation metrics of the model retrained by small dataset of 256 × 256 image size with COCO weights
| Dataset | Small dataset in the image size of 256 × 256 | |||||||
|---|---|---|---|---|---|---|---|---|
| Pre-trained model | Pre-trained COCO weights [35] | |||||||
| Backbone layer | ResNet50-FPN | ResNet101-FPN | ||||||
| Test dataset | Synthetic | Real-world | Synthetic | Real-world | ||||
| 256 | 512 | 1024 | 256 | 512 | 1024 | |||
| Recall50 | 0.75 | 0.84 | 0.79 | 0.45 | 0.88 | 0.65 | 0.57 | 0.91 |
| AP50 | 0.76 | 0.85 | 0.82 | 0.54 | 0.92 | 0.65 | 0.62 | 0.91 |
| AP75 | 0.76 | 0.58 | 0.40 | 0.11 | 0.92 | 0.64 | 0.62 | 0.89 |
| AP@[0.5:0.95] | 0.67 | 0.51 | 0.43 | 0.22 | 0.80 | 0.50 | 0.47 | 0.66 |
Tables 7 and 8 summarized the quantitation of evaluation metrics of the model retrained by our large dataset and small dataset of 256 × 256 px with synthetic barley weights respectively. Same as retrained by COCO weights, the ResNet101-FPN backbone layer can learn more features than ResNet50-FPN backbone layer particularly in small dataset.
Table 7.
The quantitation of evaluation metrics of the model retrained by the large dataset of 256 × 256 px with synthetic barley weights
| Dataset | Large dataset in the image size of 256 × 256 | |||||||
|---|---|---|---|---|---|---|---|---|
| Pre-trained model | Pre-trained barley weights [40] | |||||||
| Backbone layer | ResNet50-FPN | ResNet101-FPN | ||||||
| Test dataset | Synthetic | Real-world | Synthetic | Real-world | ||||
| 256 | 512 | 1024 | 256 | 512 | 1024 | |||
| Recall50 | 0.99 | 0.98 | 0.93 | 0.98 | 0.99 | 1.0 | 0.97 | 1.0 |
| AP50 | 0.99 | 0.98 | 0.94 | 0.89 | 0.99 | 1.0 | 0.97 | 1.0 |
| AP75 | 0.97 | 0.97 | 0.82 | 0.56 | 0.99 | 1.0 | 0.97 | 0.97 |
| AP@[0.5:0.95] | 0.79 | 0.72 | 0.62 | 0.50 | 0.92 | 0.86 | 0.82 | 0.71 |
Table 8.
The quantitation of evaluation metrics of the model retrained by the small dataset of 256 × 256 px with synthetic barley weights
| Dataset | Small dataset in the image size of 256 × 256 | |||||||
|---|---|---|---|---|---|---|---|---|
| Pre-trained model | Pre-trained barley weights [40] | |||||||
| Backbone layer | ResNet50-FPN | ResNet101-FPN | ||||||
| Test dataset | Synthetic | Real-world | Synthetic | Real-world | ||||
| 256 | 512 | 1024 | 256 | 512 | 1024 | |||
| Recall50 | 0.30 | 0.05 | 0.10 | 0.02 | 0.99 | 1.0 | 0.88 | 1.0 |
| AP50 | 0.33 | 0.05 | 0.12 | 0.01 | 0.99 | 1.0 | 0.93 | 1.0 |
| AP75 | 0.32 | 0.04 | 0.06 | 0.00 | 0.99 | 1.0 | 0.93 | 0.99 |
| AP@[0.5:0.95] | 0.24 | 0.03 | 0.07 | 0.00 | 0.90 | 0.83 | 0.77 | 0.72 |
To compare the results of different pre-trained weights, we list a sample of comparative experiment retrained by our small training dataset of 256 × 256 image size by Mask R-CNN with ResNet101-FPN backbone as shown in Tables 6 and 8. The pre-trained weights included the COCO weights and the synthetic barley weights which was trained by a synthetic barley image dataset and similar to our high throughput soybean seeds instance segmentation task. Nevertheless, the generation ability of the synthetic barley model on our dataset was poor, where Recall50 = 0.016, AP@[0.5:0.95] = 0.055 on our synthetic soybean test dataset, and Recall50 = 0, AP@[0.5:0.95] = 0 on our real-world soybean test dataset. Comparing the results in Tables 5, 6 and 8, we found that finetune the synthetic barley weights with small training dataset can receive excellent results compared with COCO weights retrained by small training dataset and compared with COCO weights retrained by large training dataset. Thus, we can conclude that finetune a pre-trained model which was similar to our instance segmentation task with the small training dataset of 256 × 256 image size can achieve an excellent performance.
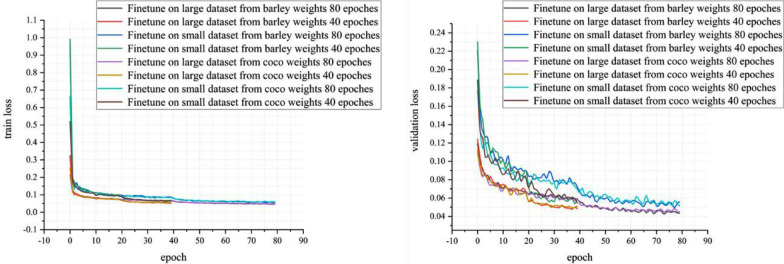
The training loss and validation loss curves of the model with backbone layer ResNet101-FPN finetuned by two different training strategies were shown in Fig. 11. The two different training strategies, one was 20 epochs of head layers and 20 epochs of whole model and the other was 40 epochs of head layers and 40 epochs of whole model. The training datasets included our synthetic lager training dataset and the synthetic small training dataset of 256 × 256 px and the pre-trained models included synthetic barley weights and COCO weights. By learning the validation loss curves for two stages of fine-tuning, we found that about 20 epochs in the first stage is the inflection point. Hence, 20 epochs in the first stage were considered. Same as the second stage.
Fig. 11.
Loss curves of several different instance segmentation model in training stage: a training loss curves, b validation loss curves, which the training datasets were our synthetic datasets of 256 × 256 px and the pre-trained models included synthetic barley weights and COCO weights
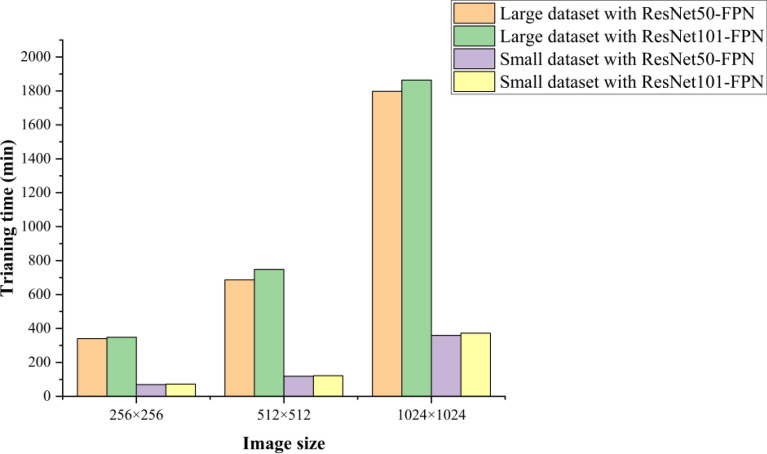
At last, we also compared the model retrained by different image size of 256 × 256, 512 × 512, 1024 × 1024, and we found that the improved performance was not pronounced with increasing the image size as the texture of soybean seeds was simple. In addition, the training time with large dataset and small dataset in different image size of 256 × 256, 512 × 512, 1024 × 1024 was summarized in Fig. 12. It showed that the training time increased as the image size increasing, and the training time of large datasets was significantly longer than that of small datasets. Hence, we can conclude that it wasn’t indispensable to prepare a higher resolution training image dataset for instance segmentation with Mask R-CNN in our study and the Mask R-CNN network retrained by large dataset based on pre-trained COCO weights can be replaced by a small dataset based on the pre-trained synthetic barley weights, which similar to our high throughput soybean seeds instance segmentation task, but performed poor on our datasets, where Recall50 = 0.016, AP@[0.5:0.95] = 0.055 on our synthetic soybean test dataset, and Recall50 = 0, AP@[0.5:0.95] = 0 on our real-world soybean test dataset.
Fig. 12.
The training time with large dataset and small dataset in the image size of 256 × 256, 512 × 512, 1024 × 1024
Accuracy of length, width of each soybean seed
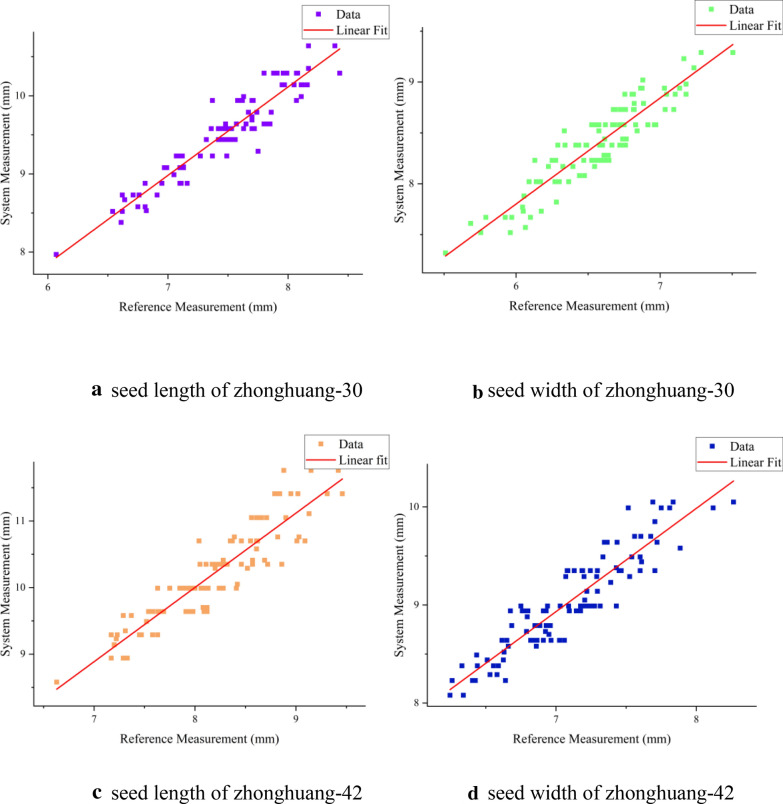
The results of soybean seed length and width measurement for zhonghuang-30 and zhonghuang-42 samples were shown in Fig. 13. The results showed that the system measurements, seed length (R2 = 89.26%) and width (R2 = 84.69%) of zhonghuang-30 and seed length (R2 = 88.11%) and width (R2 = 83.91%) of zhonghuang-42, had a fine linear relationship with the reference data. The average measurement error and the average relative error of the zhonghuang-30 and zhonghuang-42 were shown in Table 9.
Fig. 13.
Data distribution and fitting results of (a) seed length (b) seed width of zhonghuang-30 and (c) seed length (d) seed width of zhonghuang-42
Table 9.
The average measurement error and the average relative error of the zhonghuang-30 and zhonghuang-42
| Soybean varieties | Average measurement error | Variance of measurement error | Average relative error | Variance of relative error | ||||||
|---|---|---|---|---|---|---|---|---|---|---|
| Seed length/mm | Seed width/mm | Seed length | Seed width | Seed length/% | Seed width/% | Seed length | Seed width | |||
| Zhonghuang-30 | 2.04 | 1.82 | 0.04 | 0.03 | 27.4 | 27.9 | 6.63 | 8.33 | ||
| Zhonghuang-42 | 2.03 | 1.94 | 0.09 | 0.04 | 24.76 | 27.38 | 13.39 | 9.11 | ||
The reasons for the measurement errors were summarized as follows: (1) Errors were introduced by manual measurement. We need to manually take out one seed from the high-throughput soybean seeds in the corresponding position one by one and measure the seed length, width and height of the seed with a Vernier caliper, which was prone to error. (2) Errors were introduced by view angle of measurement. The view angle of manual measurement was not the view angle of camera, leading the manual measurement was inconsistent with the system measurement. The standard view angle of measuring seed length and seed width was shown in Fig. 14 (a). When the view angle looks like Fig. 14(b, c), the predicted seed width would greater than or less than the reference data which depended on the seed thickness. (3) Errors were introduced by our measurement approach. The bounding box-based instance segmentation method led to incomplete edges of the segmented instances, which in turn led to low accuracy of the obtained soybean seed morphological parameters. Pixel-based segmentation can be alternative to improve the performance of morphological parameter study [50]. And the soybean seeds were randomly orientated above the black flannel, however the bounding box of Mask R-CNN output didn’t consider the orientation of the segmented instances, which would also cause errors in the system measurement as shown in Fig. 14(d).
Fig. 14.

Examples of measurement errors which were introduced by different view angles and orientation of soybean seed
Conclusion
The major contribution and advantages of our method are: (1) proposed a novel synthetic image generation and augmentation method working for preparing plenty of labeled image dataset for instance segmentation automatically which can pronouncedly decrease the labor cost of manual annotation. (2) The proposed transfer learning method by finetune the pre-trained model weights can reduce the computing costs significantly. (3) The pipeline proposed in our research can be expanded to the other high-throughput objects instance segmentation and morphology measurement.
However, our approach has a few limitations. Firstly, the high-throughput soybean seeds phenotype analysis was based on two-dimensional image which lacked depth information, it was impossible to obtain the seed length, seed height and seed width of soybean seed from one view-point image synchronously. Secondly, the computing cost of training the instance segmentation model is relatively high which still need to be improved. Lastly, our synthetic image generation and augmentation method is limited to one class object which need to be extended to synthetize more than one class object for multi-class objects instance segmentation.
In the future research, we intend to further improve the segmentation precision by pixel-based segmentation method and decrease the computing cost for the instance segmentation of high-throughput soybean seeds which are physically touching densely. And other datasets types like RGB-D dataset which can acquire more phenotype information by just retraining the instance segmentation network is left to the future work.
Acknowledgements
Authors thank Beijing Shunyi Experiment Station of the Institute of Crop Sciences, Chinese Academy of Agricultural Sciences for the contribution in the threshed soybean seeds.
Authors' contributions
SY, LZ and MW conceived and designed the experiments; PH carried out the acquisition of soybean seed images and performed the implementation and analyzed the results of synthetic image dataset; TW and SS provided the threshed soybean seeds; SY performed the implementation and analyzed the results of high throughput soybean seeds instance segmentation; SY, wrote the manuscript; LZ and MW revised the manuscript; All authors read and approved the final manuscript.
Funding
This work was supported in part by National Natural Science Foundation of China (31971786), the China Agriculture Research System (CARS-04) and the National Key R&D Program of China (2017YFD0101400). All of the mentioned support is gratefully acknowledged. In addition, thanks for all the help of the teachers and students of the related universities.
Availability of data and materials
The datasets and materials will be provided on publication.
Declarations
Ethics approval and consent to participate
Not applicable for that section.
Consent for publication
Not applicable for that section.
Competing interests
The authors declare that they have no competing interests.
Footnotes
Publisher's Note
Springer Nature remains neutral with regard to jurisdictional claims in published maps and institutional affiliations.
Contributor Information
Lihua Zheng, Email: zhenglh@cau.edu.cn.
Minjuan Wang, Email: minjuan@cau.edu.cn.
References
- 1.Carther KFI, Ketehouli T, Ye N, et al. Comprehensive genomic analysis and expression profiling of diacylglycerol kinase (DGK) gene family in soybean (Glycine max) under Abiotic stresses. Int J Mol Sci. 2019;20(6):1361. doi: 10.3390/ijms20061361. [DOI] [PMC free article] [PubMed] [Google Scholar]
- 2.Shuai H, Meng Y, Luo X, et al. Exogenous auxin represses soybean seed germination through decreasing the gibberellin/abscisic acid (GA/ABA) ratio. Sci Rep. 2017;7(1):1–11. doi: 10.1038/s41598-017-13093-w. [DOI] [PMC free article] [PubMed] [Google Scholar]
- 3.Fehr WR, Justin JR. Principles of cultivar development, vol. 2, crop species. Soil Sci. 1988;145(5):390. [Google Scholar]
- 4.Jiang S, An H, Luo J, et al. Comparative analysis of transcriptomes to identify genes associated with fruit size in the early stage of fruit development in Pyrus pyrifolia. Int J Mol Sci. 2018;19(8):2342. doi: 10.3390/ijms19082342. [DOI] [PMC free article] [PubMed] [Google Scholar]
- 5.Momin MA, Yamamoto K, Miyamoto M, et al. Machine vision based soybean quality evaluation. Comput Electron Agric. 2017;140:452–460. [Google Scholar]
- 6.Baek JH, Lee E, Kim N, et al. High throughput phenotyping for various traits on soybean seeds using image analysis. Sensors. 2020;20(1):248. doi: 10.3390/s20010248. [DOI] [PMC free article] [PubMed] [Google Scholar]
- 7.Kezhu T, Yuhua C, Weixian S, et al. Identification of diseases for soybean seeds by computer vision applying BP neural network. Int J Agric Biol Eng. 2014;7(3):43–50. [Google Scholar]
- 8.Liu D, Ning X, Li Z, et al. Discriminating and elimination of damaged soybean seeds based on image characteristics. J Stored Prod Res. 2015;60:67–74. [Google Scholar]
- 9.Rahman A, Cho BK. Assessment of seed quality using non-destructive measurement techniques: a review. Seed Sci Res. 2016;26(4):285–305. [Google Scholar]
- 10.Barbedo JGA. Counting clustered soybean seeds. 2012 12th International Conference on Computational Science and Its Applications. IEEE, 2012; pp. 142–145.
- 11.Li Y, Jia J, Zhang L, et al. Soybean seed counting based on pod image using two-column convolution neural network. IEEE Access. 2019;7:64177–64185. [Google Scholar]
- 12.Uzal LC, Grinblat GL, Namías R, et al. Seed-per-pod estimation for plant breeding using deep learning. Comput Electron Agric. 2018;150:196–204. [Google Scholar]
- 13.Kong Y, Fang S, Wu X, et al. Novel and automatic rice thickness extraction based on photogrammetry using rice edge features. Sensors. 2019;19(24):5561. doi: 10.3390/s19245561. [DOI] [PMC free article] [PubMed] [Google Scholar]
- 14.Quan L, Feng H, Lv Y, et al. Maize seedling detection under different growth stages and complex field environments based on an improved Faster R-CNN. Biosys Eng. 2019;184:1–23. [Google Scholar]
- 15.Tanabata T, Shibaya T, Hori K, et al. SmartGrain: high-throughput phenotyping software for measuring seed shape through image analysis. Plant Physiol. 2012;160(4):1871–1880. doi: 10.1104/pp.112.205120. [DOI] [PMC free article] [PubMed] [Google Scholar]
- 16.Igathinathane C, Pordesimo LO, Columbus EP, et al. Shape identification and particles size distribution from basic shape parameters using ImageJ. Comput Electron Agric. 2008;63(2):168–182. [Google Scholar]
- 17.Lamprecht MR, Sabatini DM, Carpenter AE. Cell ProfilerTM: free, versatile software for automated biological image analysis. Biotechniques. 2007;42(1):71–75. doi: 10.2144/000112257. [DOI] [PubMed] [Google Scholar]
- 18.Faroq ALT, Adam H, Dos Anjos A, et al. P-TRAP: a panicle trait phenotyping tool. BMC Plant Biol. 2013;13(1):122. doi: 10.1186/1471-2229-13-122. [DOI] [PMC free article] [PubMed] [Google Scholar]
- 19.Groves FE, Bourland FM. Estimating seed surface area of cottonseed. J Cotton Sci. 2010;14:74–81. [Google Scholar]
- 20.Yang S, Zheng L, Gao W, et al. An efficient processing approach for colored point cloud-based high-throughput seedling phenotyping. Remote Sens. 2020;12(10):1540. [Google Scholar]
- 21.Chandra AL, Desai SV, Balasubramanian VN, et al. Active learning with point supervision for cost-effective panicle detection in cereal crops. Plant Methods. 2020;16(1):1–16. doi: 10.1186/s13007-020-00575-8. [DOI] [PMC free article] [PubMed] [Google Scholar]
- 22.Pound M P, Atkinson J A, Wells D M, et al. Deep learning for multi-task plant phenotyping. Proceedings of the IEEE International Conference on Computer Vision Workshops. 2017. pp. 2055–2063.
- 23.LeCun Y, Bengio Y, Hinton G. Deep learning. Nature. 2015;521(7553):436–444. doi: 10.1038/nature14539. [DOI] [PubMed] [Google Scholar]
- 24.Lee SH, Chan CS, Mayo SJ, et al. How deep learning extracts and learns leaf features for plant classification. Pattern Recogn. 2017;71:1–13. [Google Scholar]
- 25.Toda Y, Okura F. How convolutional neural networks diagnose plant disease. Plant Phenomics. 2019;2019:9237136. doi: 10.34133/2019/9237136. [DOI] [PMC free article] [PubMed] [Google Scholar]
- 26.Liu L, Ouyang W, Wang X, et al. Deep learning for generic object detection: a survey. Int J Comput Vision. 2020;128(2):261–318. [Google Scholar]
- 27.Zou Z, Shi Z, Guo Y, et al. Object detection in 20 years: a survey. arXiv preprint arXiv:1905.05055,2019.
- 28.Chen H, Sun K, Tian Z, et al. BlendMask: Top-down meets bottom-up for instance segmentation. Proceedings of the IEEE/CVF Conference on Computer Vision and Pattern Recognition. 2020; pp. 8573–8581.
- 29.Kulikov V, Lempitsky V. Instance segmentation of biological images using harmonic embeddings. Proceedings of the IEEE/CVF Conference on Computer Vision and Pattern Recognition. 2020; pp. 3843–3851.
- 30.Sun J, Tárnok A, Su X. Deep learning-based single-cell optical image studies. Cytometry A. 2020;97(3):226–240. doi: 10.1002/cyto.a.23973. [DOI] [PubMed] [Google Scholar]
- 31.Bosilj P, Aptoula E, Duckett T, et al. Transfer learning between crop types for semantic segmentation of crops versus weeds in precision agriculture. J Field Robotics. 2020;37(1):7–19. [Google Scholar]
- 32.Nellithimaru AK, Kantor GA. ROLS: Robust Object-level SLAM for grape counting. Proceedings of the IEEE Conference on Computer Vision and Pattern Recognition Workshops. 2019. pp. 0–0.
- 33.Chandra AL, Desai SV, Guo W, et al. Computer vision with deep learning for plant phenotyping in agriculture: A survey. arXiv preprint arXiv:2006.11391,2020.
- 34.Kamilaris A, Prenafeta-Boldú FX. Deep learning in agriculture: a survey. Comput Electron Agric. 2018;147:70–90. [Google Scholar]
- 35.Deng J, Dong W, Socher R, et al. Imagenet: A large-scale hierarchical image database. 2009 IEEE conference on computer vision and pattern recognition. IEEE, 2009; pp. 248–255.
- 36.Lin T Y, Maire M, Belongie S, et al. Microsoft coco: common objects in context. European conference on computer vision. Springer, Cham, 2014; pp. 740–755.
- 37.Desai SV, Balasubramanian VN, Fukatsu T, et al. Automatic estimation of heading date of paddy rice using deep learning. Plant Methods. 2019;15(1):76. doi: 10.1186/s13007-019-0457-1. [DOI] [PMC free article] [PubMed] [Google Scholar]
- 38.Ghosal S, Zheng B, Chapman SC, et al. A weakly supervised deep learning framework for sorghum head detection and counting. Plant Phenomics. 2019;2019:1525874. doi: 10.34133/2019/1525874. [DOI] [PMC free article] [PubMed] [Google Scholar]
- 39.Sakurai S, Uchiyama H, Shimada A, et al. Two-step Transfer Learning for Semantic Plant Segmentation//ICPRAM. 2018: 332–339.
- 40.Kuznichov D, Zvirin A, Honen Y, et al. Data augmentation for leaf segmentation and counting tasks in Rosette plants. Proceedings of the IEEE Conference on Computer Vision and Pattern Recognition Workshops. 2019; pp. 1–15.
- 41.Toda Y, Okura F, Ito J, et al. Training instance segmentation neural network with synthetic datasets for crop seed phenotyping. Commun Biol. 2020;3(1):1–12. doi: 10.1038/s42003-020-0905-5. [DOI] [PMC free article] [PubMed] [Google Scholar]
- 42.Ma X, Chen Q, Yu Y, et al. A two-level transfer learning algorithm for evolutionary multitasking. Front Neurosci. 2019;13:1408. doi: 10.3389/fnins.2019.01408. [DOI] [PMC free article] [PubMed] [Google Scholar]
- 43.Coulibaly S, Kamsu-Foguem B, Kamissoko D, et al. Deep neural networks with transfer learning in millet crop images. Comput Ind. 2019;108:115–120. [Google Scholar]
- 44.Russell BC, Torralba A, Murphy KP, et al. LabelMe: a database and web-based tool for image annotation. Int J Comput Vision. 2008;77(1–3):157–173. [Google Scholar]
- 45.He K, Gkioxari G, Dollár P, et al. Mask r-cnn. Proceedings of the IEEE international conference on computer vision. 2017; pp. 2961–2969.
- 46.Ren S, He K, Girshick R, et al. Faster r-cnn: Towards real-time object detection with region proposal networks. Advances in neural information processing systems. 2015. pp. 91–99. [DOI] [PubMed]
- 47.Long J, Shelhamer E, Darrell T. Fully convolutional networks for semantic segmentation. Proceedings of the IEEE conference on computer vision and pattern recognition. 2015. pp. 3431–3440. [DOI] [PubMed]
- 48.Abdulla. W. Mask r-cnn for object detection and instance segmentation on keras and tensorflow. https://github.com/matterport/Mask_RCNN, 2017. 4
- 49.He K, Zhang X, Ren S, et al. Deep residual learning for image recognition. Proceedings of the IEEE conference on computer vision and pattern recognition. 2016; pp. 770–778.
- 50.Misra T, Arora A, Marwaha S, et al. SpikeSegNet-a deep learning approach utilizing encoder-decoder network with hourglass for spike segmentation and counting in wheat plant from visual imaging. Plant Methods. 2020;16(1):1–20. doi: 10.1186/s13007-020-00582-9. [DOI] [PMC free article] [PubMed] [Google Scholar]
Associated Data
This section collects any data citations, data availability statements, or supplementary materials included in this article.
Data Availability Statement
The datasets and materials will be provided on publication.


