

Abstract
In the peripheral nervous system, ligand-receptor interactions between cells and neurons shape sensory experience, including pain. We set out to identify the potential interactions between sensory neurons and peripheral cell types implicated in disease-associated pain. Using mouse and human RNA-sequencing datasets and computational analysis, we created interactome maps between dorsal root ganglion (DRG) sensory neurons and an array of normal cell types as well as colitis-associated glial cells, rheumatoid arthritis-associated synovial macrophages, and pancreatic tumor tissue. These maps revealed a common correlation between the abundance of heparin-binding EGF-like growth factor (HBEGF) in peripheral cells with that of its receptor EGFR (a member of the ErbB family of receptors) in DRG neurons. Subsequently, we confirmed that increased abundance of HBEGF enhanced nociception in mice, likely acting on DRG neurons through ErbB family receptors. Collectively, these interactomes highlight ligand-receptor interactions that may lead to treatments for disease-associated pain and, furthermore, reflect the complexity of cell-to-neuron signaling in chronic pain states.
Introduction
Nociceptive sensory neurons are responsible for detecting changes in the environment through specific receptors and then transmitting this signal to the central nervous system (CNS) by generation of action potentials (1). These nociceptors innervate almost every tissue in the body, playing a critical role in detecting injury and/or pathology to skin, joints, bones and visceral organs (2, 3). While nociceptor function is needed to navigate environments safely (4) and to recover after injury (5), these cells can also create misery when they become persistently active (6–8). Nociceptor hyperexcitability and spontaneous activity are key contributors to many chronic pain states driven by inflammation, arthritis, nerve injury, cancer or other pathologies (1, 2, 6–8). It is widely accepted that tissue injury is directly linked to changes in the activity of nociceptors that innervate that tissue (9). Relatively little is known about the factors that are released by cells within specific tissues and how these factors act on the nociceptors innervating the tissue. Our goal was to catalog this potential “interactome” because such a resource can suggest identification of new targets that could be manipulated to treat pain disorders.
RNA sequencing (RNA-seq) experiments have defined tissue-wide and cell-specific transcriptomes for much of the body in both mice (10–12) and humans (13, 14). Cell profiling experiments on normal and diseased tissues have identified key molecular players in an increasing number of disease processes (15), including disorders with a strong pain component (16, 17). However, these studies mostly focus on gene expression within a specific tissue or across cell types in a tissue and do not characterize how multiple tissues may interact to promote disease. This type of cross-tissue interaction is especially critical to pain. Nociceptors express a wide variety of receptors that allow them to detect ligands that are produced in the tissues they innervate (1–3). Tissue pathology frequently drives changes in gene expression resulting in de novo or enhanced expression of ligands (for example, cytokines and chemokines). Since many pathological tissue states produce enhanced nociception and pain (1, 5, 9), it is logical to assume that changes in ligand expression cause changes in signaling frequency or intensity through receptors expressed by nociceptors. These ligand-receptor interactions are candidates for drivers of pain states.
Here, we developed a computational framework that identified potential ligand-receptor mediated interactions on a genome-wide scale (interactome) between target tissues and sensory neurons using publicly available RNA-seq datasets. We first used this tool to identify potential interactions between nociceptors in mouse dorsal root ganglia (DRG) and other tissues or cell types. Then, we performed three case studies to demonstrate the utility of this tool for identifying potential drivers of pain states. First, we used single-cell RNA-seq (scRNA-seq) data from colon-innervating nociceptors in the mouse (17) to explore how these neurons might interact with normal and inflamed enteric glial cells (18). Second, we examined how human DRG (hDRG) neurons (14, 19) may interact with macrophages taken from the joints of people with rheumatoid arthritis (RA) (16). Finally, we assessed how pancreatic cancer (20) could drive ligand-receptor interactions with hDRG neurons, potentially providing new insight into tumor–neuron interactions in this notoriously painful disease. An intriguing theme emerging from these distinct interactomes is the prominence of corresponding ligands for the ErbB family of epidermal growth factor receptors (including EGFR) as possible mediators of interactions between diseased tissue and mouse and human nociceptors. This finding is consistent with recent preclinical and clinical findings suggesting efficacy of blocking ErbB family signaling for chronic pain (21–24). As RNA sequencing resources continue to proliferate, our tool can be used to mine for potential signaling pathways and pharmacological targets in a data-driven manner based on high-throughput assay analyses.
Results
Cell type-enriched interactomes for DRG nociceptors from 42 cell types in the Tabula Muris dataset
DRG neurons interact with nearly every tissue in the body and express an array of receptors that enable them to receive signals from distinct cell types within these tissues (2, 3). To map these potential ligand-receptor interactions, we curated a database of ligand and receptor pairs across the genome, based on the literature and curated bioinformatics databases (25–30). This led to the creation of a ligand-receptor pair interactome containing more than 3000 interactions.
We first sought to examine ligand-receptor interactions between different classes of mouse sensory neurons and a diverse array of peripheral cell types under normal conditions. To do this, we used mouse DRG (mDRG) scRNA-seq data (12) and scRNA-seq datasets from tissues innervated by the DRG using the Tabula Muris project (10). While many subtypes of sensory neurons have been identified (11, 12), for simplicity we clustered these into three well-identified neuronal subpopulations: peptidergic (PEP) nociceptors, non-peptidergic (NP) nociceptors and neurofilament-positive, large diameter, low-threshold mechanoreceptors (NF) (1–3). This predicted a broad interactome between 42 cell types found in 19 tissues, and PEP, NP and NF sensory neurons from the DRG, and established a ligand-receptor interaction map for sensory neurons and the tissues they innervate or interact with in the mouse (data file S1). We extracted the pairs of ligand-receptor interactions for each of these cell types where the receptor was expressed in at least one type of sensory neuron (PEP, NP, or NF) and looked for enriched pharmacology-relevant gene ontology (GO) terms using the Enrichr analysis tool (31, 32), focusing on the top five GO terms for biological process (large-scale “biological programs” accomplished by several coordinated molecular activities) and molecular function (molecule level activities performed by gene products, for instance) (Fig. 1). For the biological process GO terms found for ligand genes, the “extracellular matrix organization” term appeared in the top five for all but one cell-type, and was ranked as the top one in 37 of the 42 cell types. This likely occurred because among the 894 ligand genes we included in the interactome, many are secreted and 89 of them are among the 229 total genes classified under the biological process GO term “extracellular matrix organization”. This biases our dataset to show this particular GO term to be enriched. The GO terms of “positive regulation of cell proliferation”, “regulation of cell proliferation”, “positive regulation of cell motility”, and “positive regulation of cell migration” were also enriched in both non-immune cell types and macrophages. For terms that were enriched specifically in immune cells, “cytokine-mediated signaling pathway” was enriched in most of the immune cell-types, while “regulated exocytosis” and “cellular protein metabolic process” GO terms were specific to T cells and natural killer (NK) cells (Fig. 1). This shows that, for most cell types, extracellular matrix and cell adhesion ligands represent the most abundant ligand-receptor interaction between these peripheral cells and sensory neurons. The exception was immune cells, which our interactome predicts to primarily interact with sensory neurons through diffusible factors.
Figure 1: GO and interactome analysis of ligand and receptor gene expression reveals shared principles of cell-to-neuron signaling across tissues.
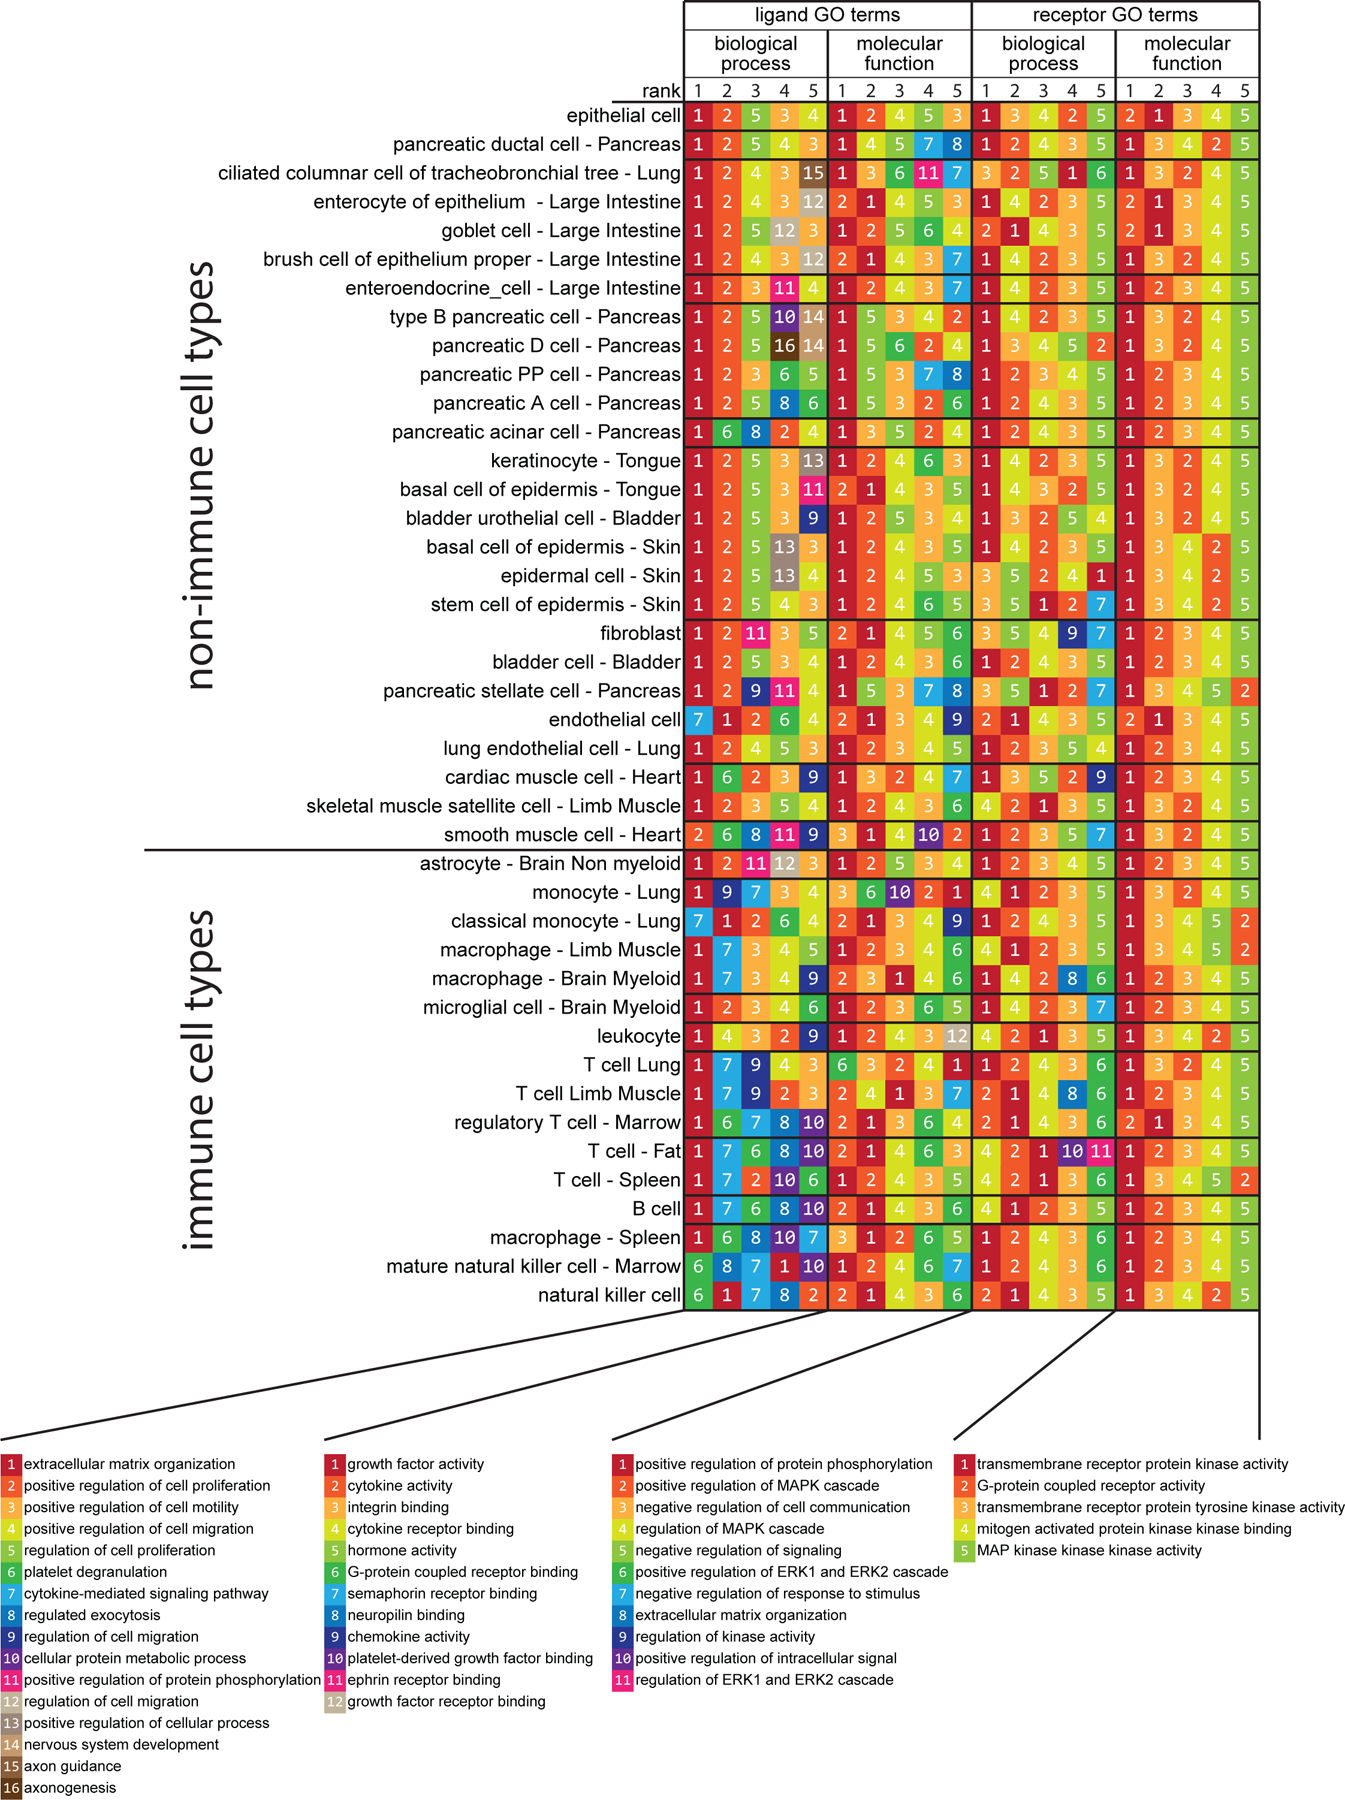
Interactome analysis was performed between all 42 peripheral cell types from the Tabula Muris project (10) and 3 types of sensory neurons (11, 12). Only interactions where ligands were detected in the corresponding cell-type and receptors were detected in at least one of the 3 sensory neuron types were included for the GO term enrichment analysis. For the interactions identified in each cell-type, the corresponding ligand and receptor genes were separately analyzed with Enrichr for their enriched GO terms in both biological process and molecular function. The results of this analysis are shown in four different groups of columns. The 5 columns of color- and number-coded boxes within each of these four groups of columns represent the top 5 enriched GO terms in that group, ranked from left to right. Cell types are listed as rows and ordered by the cell type and gene bi-clustering, as described in the Methods. N = 889 cells for NP-type DRG, 126 cells for NF-type DRG, and 565 cells for PEP-type DRG neurons; sample sizes for other cell types are provided in data file S7.
For receptor genes found in sensory neurons, the same five GO terms were enriched for molecular functions: “transmembrane receptor protein kinase activity”, “G protein-coupled receptor activity”, “transmembrane receptor protein tyrosine kinase activity”, “mitogen activated protein (MAP) kinase kinase binding”, “MAP kinase kinase kinase activity” (Fig. 1). The biological process GO terms were also consistent for sensory neuron receptors identified from this interactome. The same four GO terms were enriched for most of the cell-types: “positive regulation of protein phosphorylation”, “positive regulation of MAPK cascade”, “negative regulation of cell communication”, “regulation of MAPK cascade”. Two other GO terms, “negative regulation of signaling” and “positive regulation of ERK1 and ERK2 cascade” were enriched in non-immune cell-types and macrophages or T cells and NK cells, respectively. This highlights the key role that MAPK (mitogen-activated protein kinase) signaling plays in transducing signals from cells throughout the body to signaling within sensory neurons. Because MAPK signaling in nociceptors plays a critical role in the generation of pain states (33–36), this suggests that ligand-receptor interactions between nociceptors and most cell types found in the body could be capable of inducing hyperexcitability in nociceptors leading to persistent pain.
While the interactome described above shows commonalities between ligand-receptor interactions between sensory neurons and a variety of tissues and cells found in the mouse, it does not reveal cell type-specific interaction points that may play important roles in normal physiology and/or pathology. To find these more specific interactions in an unbiased fashion, we performed iterative hierarchical bi-clustering on cell-types and genes based on gene expression levels using scrattch.hicat analysis (37). This analysis revealed 18 classes of cell types (cell clusters A to R in Fig. 2A) and 25 gene co-expression modules expressed across subsets of those cell types (Fig. 2A). For each of these 25 gene modules, we then extracted all the ligand genes from our ligand-receptor database for each module and constructed an interactome with receptors expressed by different classes of mouse sensory neurons (data file S2). We focused on two module interactomes enriched in immune cell types for graphical representation: the macrophage and leukocyte enriched cluster, and the T cell- and NK cell-enriched cluster. We chose these based on the key role these immune cell types play in neuropathic pain models in male and/or female mice (38–43). The ligand-receptor interactomes emerging from this gene cluster enrichment analysis revealed distinct factors expressed by these immune cells that are known to play a role in neuropathic pain states. The macrophage and leukocyte cluster included Mmp9, Il1b and Osm gene products signaling to their cognate receptors expressed by mouse nociceptors (Fig. 2B). Macrophage recruitment by tumor necrosis factor alpha (TNF-α) induces matrix metalloproteinase MMP9 signaling which then promotes neuropathic pain after peripheral nerve injury (44). Cytokines IL1β and oncostatin M (OSM) have also been identified as important pain signaling molecules in previous studies in rodent pain models (45, 46) and in DRG samples from neuropathic pain patients (19). The T cell and NK cell cluster showed expression of many genes associated with the TNF-α superfamily, including Lta, Tnfsf14 and Tnfsf11, but also highlights the Ltbr gene which is paired with several of these T cell- and NK cell-expressed ligands (Fig. 2C). This analysis also identified a specific interaction between T-cells and sensory neurons driven by the action of interferon gamma (IFNγ) through its receptors (IFNGR1, IFNGR2) expressed on sensory neurons. IFNγ had previously been shown to enhance glutamate release in excitatory synapses in spinal cord and contributes to persistent pain (47). Collectively this previous work implicates these factors in persistent pain, but our analysis shows that these immune cells express these factors at baseline. This suggests that recruitment of these immune cells to the peripheral nerve may be a key factor in driving persistent pain rather than plasticity in the transcriptomes of these cell types. This notion is supported by recent studies in rodent models (40, 41, 43) and patient transcriptional profiling (19). This cell-type and gene module bi-clustering approach reveals potential ligand-receptor interactions for peripheral cell types with sensory neurons that can be further mined for identification of new pain targets.
Figure 2: Potential cell type-specific ligand-receptor interactions with sensory neurons.
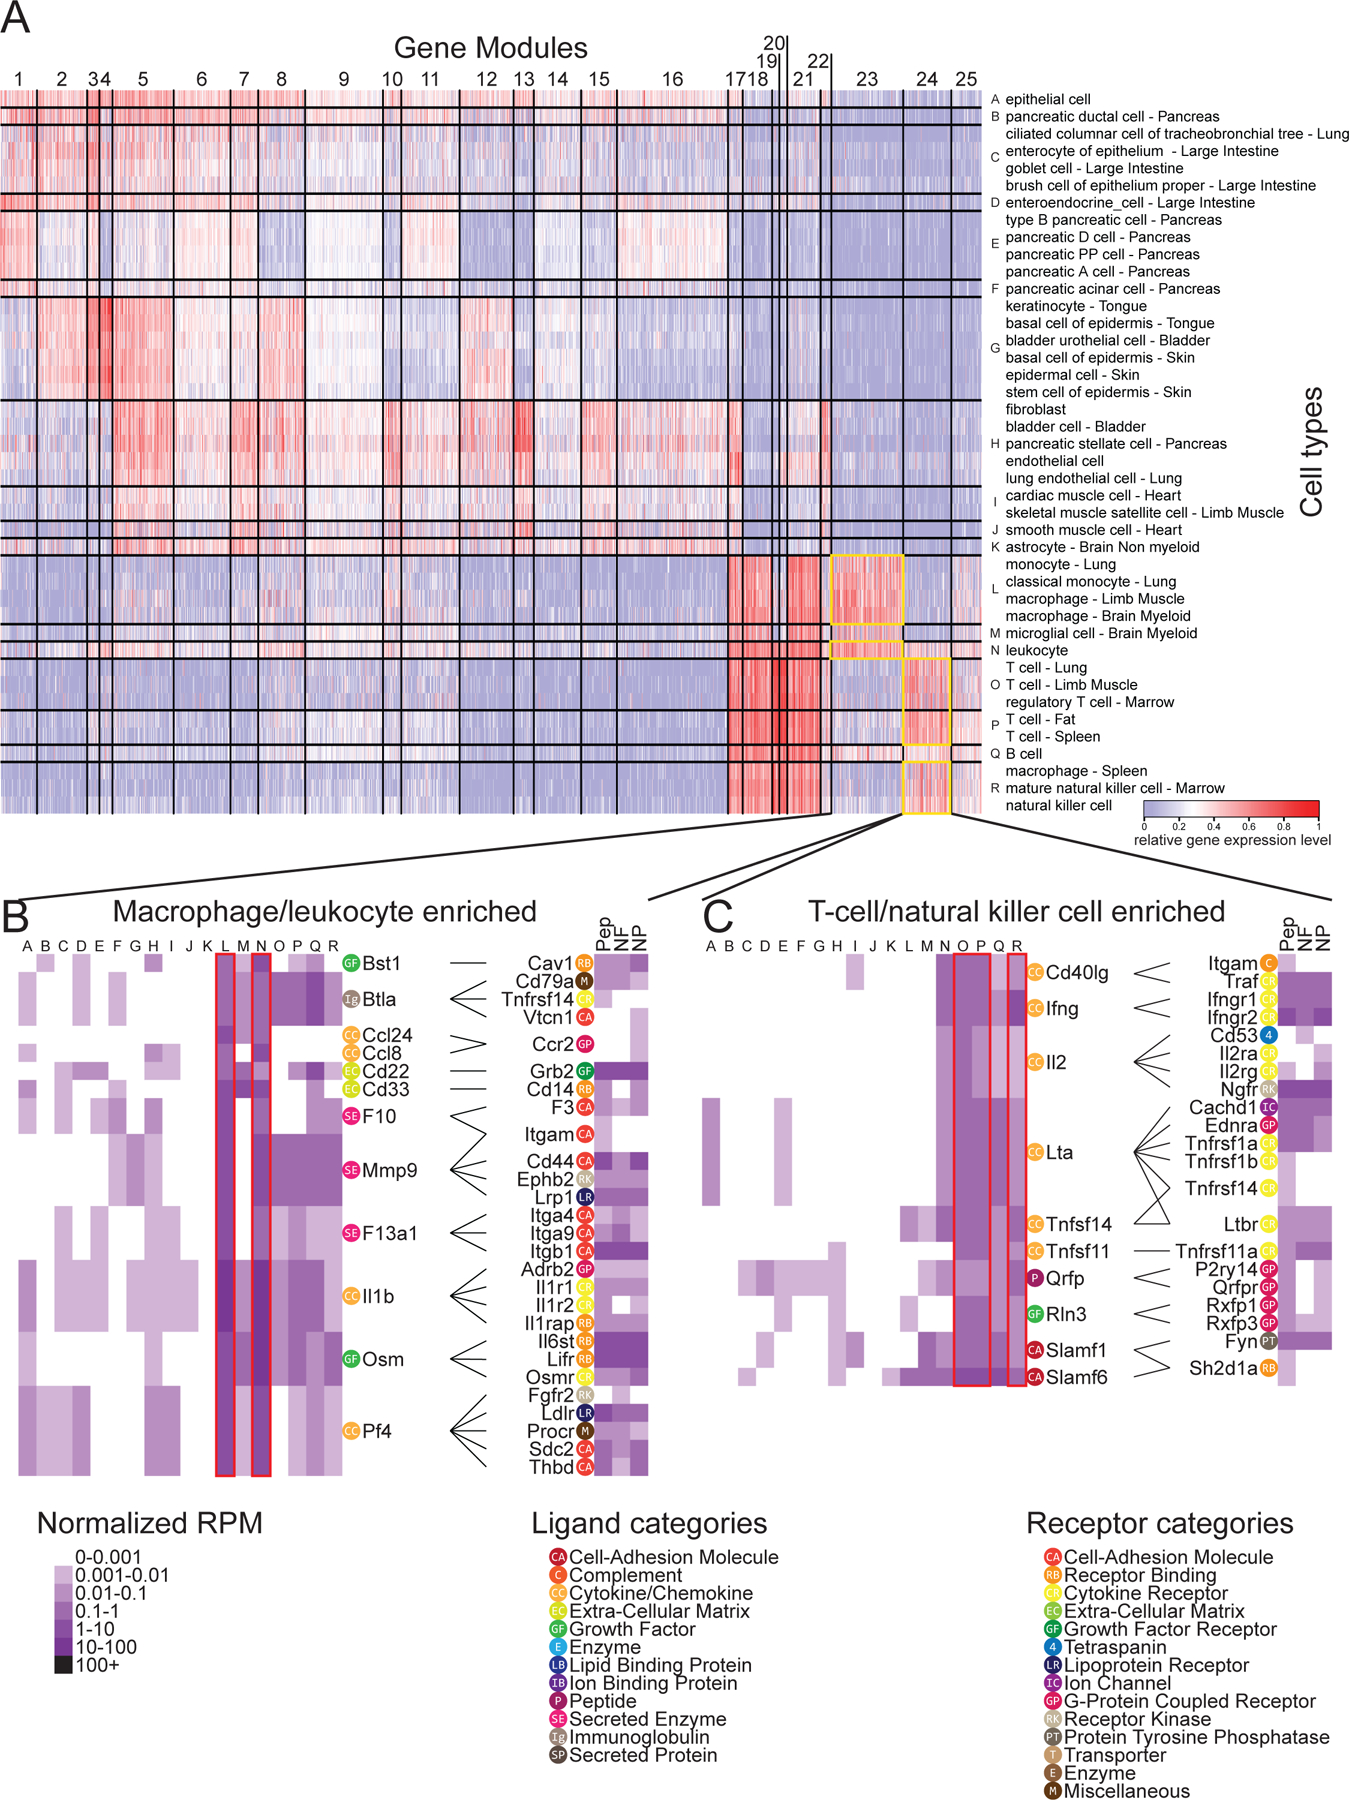
(A to C) Iterative hierarchical bi-clustering was performed on genes and cell-types from mouse scRNA-seq gene expression data in Tabula Muris (10) using Scrattch.hicat (37). The 42 cell-types grouped into eighteen cell-type modules and 25 gene modules [labelled “A” to “R” and 1 to 25 respectively in (A), and listed in data file S2] were identified, and corresponding gene expression was displayed as a heatmap. Two of these gene modules, numbers 23 and 24—ligand genes enriched in macrophages and leukocytes [cell-type modules L and N; (B)] or in T cells and natural killer cells [cell-type modules O, P and R; (C)], as outlined—are highlighted below, alongside DRG receptor expression heatmaps (12) and annotated with potential ligand-receptor interactomes. Gene categories as labeled are defined in the in-figure legend. For DRG neurons: N = 889 cells for NP, 126 cells for NF and 565 cells for PEP; sample sizes for other cell types provided in data file S7.
Ligand-receptor interactions among cell types within the mDRG are identified from the mousebrain.org dataset
The interactomes described above map ligand-receptor pairs between sensory neurons and many other cell types found in target tissues for these neurons. The DRG is composed of many different cell types besides sensory neurons, including Schwann cells and satellite glial cells. These glial cells are known to contribute to acute and chronic pain states (48–50) but how they interact with sensory neurons has not been characterized thoroughly. Moreover, how sensory neurons may interact with these cells through release of transmitter substances is almost completely unexplored. To examine ligand-receptor interactions that might occur within the DRG, we constructed ligand-receptor interactomes between NP, PEP and NF sensory neurons and satellite glial cells and Schwann cells. We did this with single cell RNA sequencing data from the mousebrain.org dataset (12). In our first analysis of this interactome, it was clear that “Cell Adhesion Molecule and Extracellular Matrix” (ECM) categories dominated the ligand-receptor interactions for these cell types (data file S3, figs. S1 and S2). This is not surprising, given the close proximity of these cells within the DRG and the obvious structural role that interactions between these cells play within the ganglion. The role of cell adhesion molecules and ECM molecules in chronic and neuropathic pain has been described in the literature (51, 52). However, because we wanted to focus on interactions driven by diffusible transmitter substances within the DRG, we chose to remove these two categories from this analysis of intercellular ligand-receptor signaling within the mDRG. These categories are included in subsequent analyses.
When examining which neuronal ligands potentially signal to satellite glia and/or Schwann cell expressed receptors, we made several interesting observations (Fig. 3). First, growth factor interactions were the dominant category of interactions when considering neuron to glial signaling, with 30 of the 133 interactions being between growth factors and their receptors. This is consistent with previous findings in the field (53–55). Second, we found indications of robust brain-derived neurotrophic factor (BDNF) signaling within the DRG. We noted that gene products of Bdnf, which was expressed by NP and PEP nociceptors, has potential interactions with satellite glia and Schwann cells through its traditional receptor tropomyosin/tyrosine receptor kinase B (TrkB, encoded by Ntrk2), as well as through discoidin domain-containing receptor 2 (DDR2, encoded by Ntrkr3r) and sortillin (encoded by Sort1). Finally, we found that calcitonin gene-related peptide (CGRP, encoded by Calca), a signature peptide of PEP nociceptors, had an interaction with the amylin receptor RAMP2 in DRG glia cells. While it is known that CGRP can signal through receptors containing the amylin subunit (56), there is no previous literature on CGRP signaling through this receptor in DRG glia.
Figure 3. Ligand-receptor interactions from neurons to glial cells within the DRG.
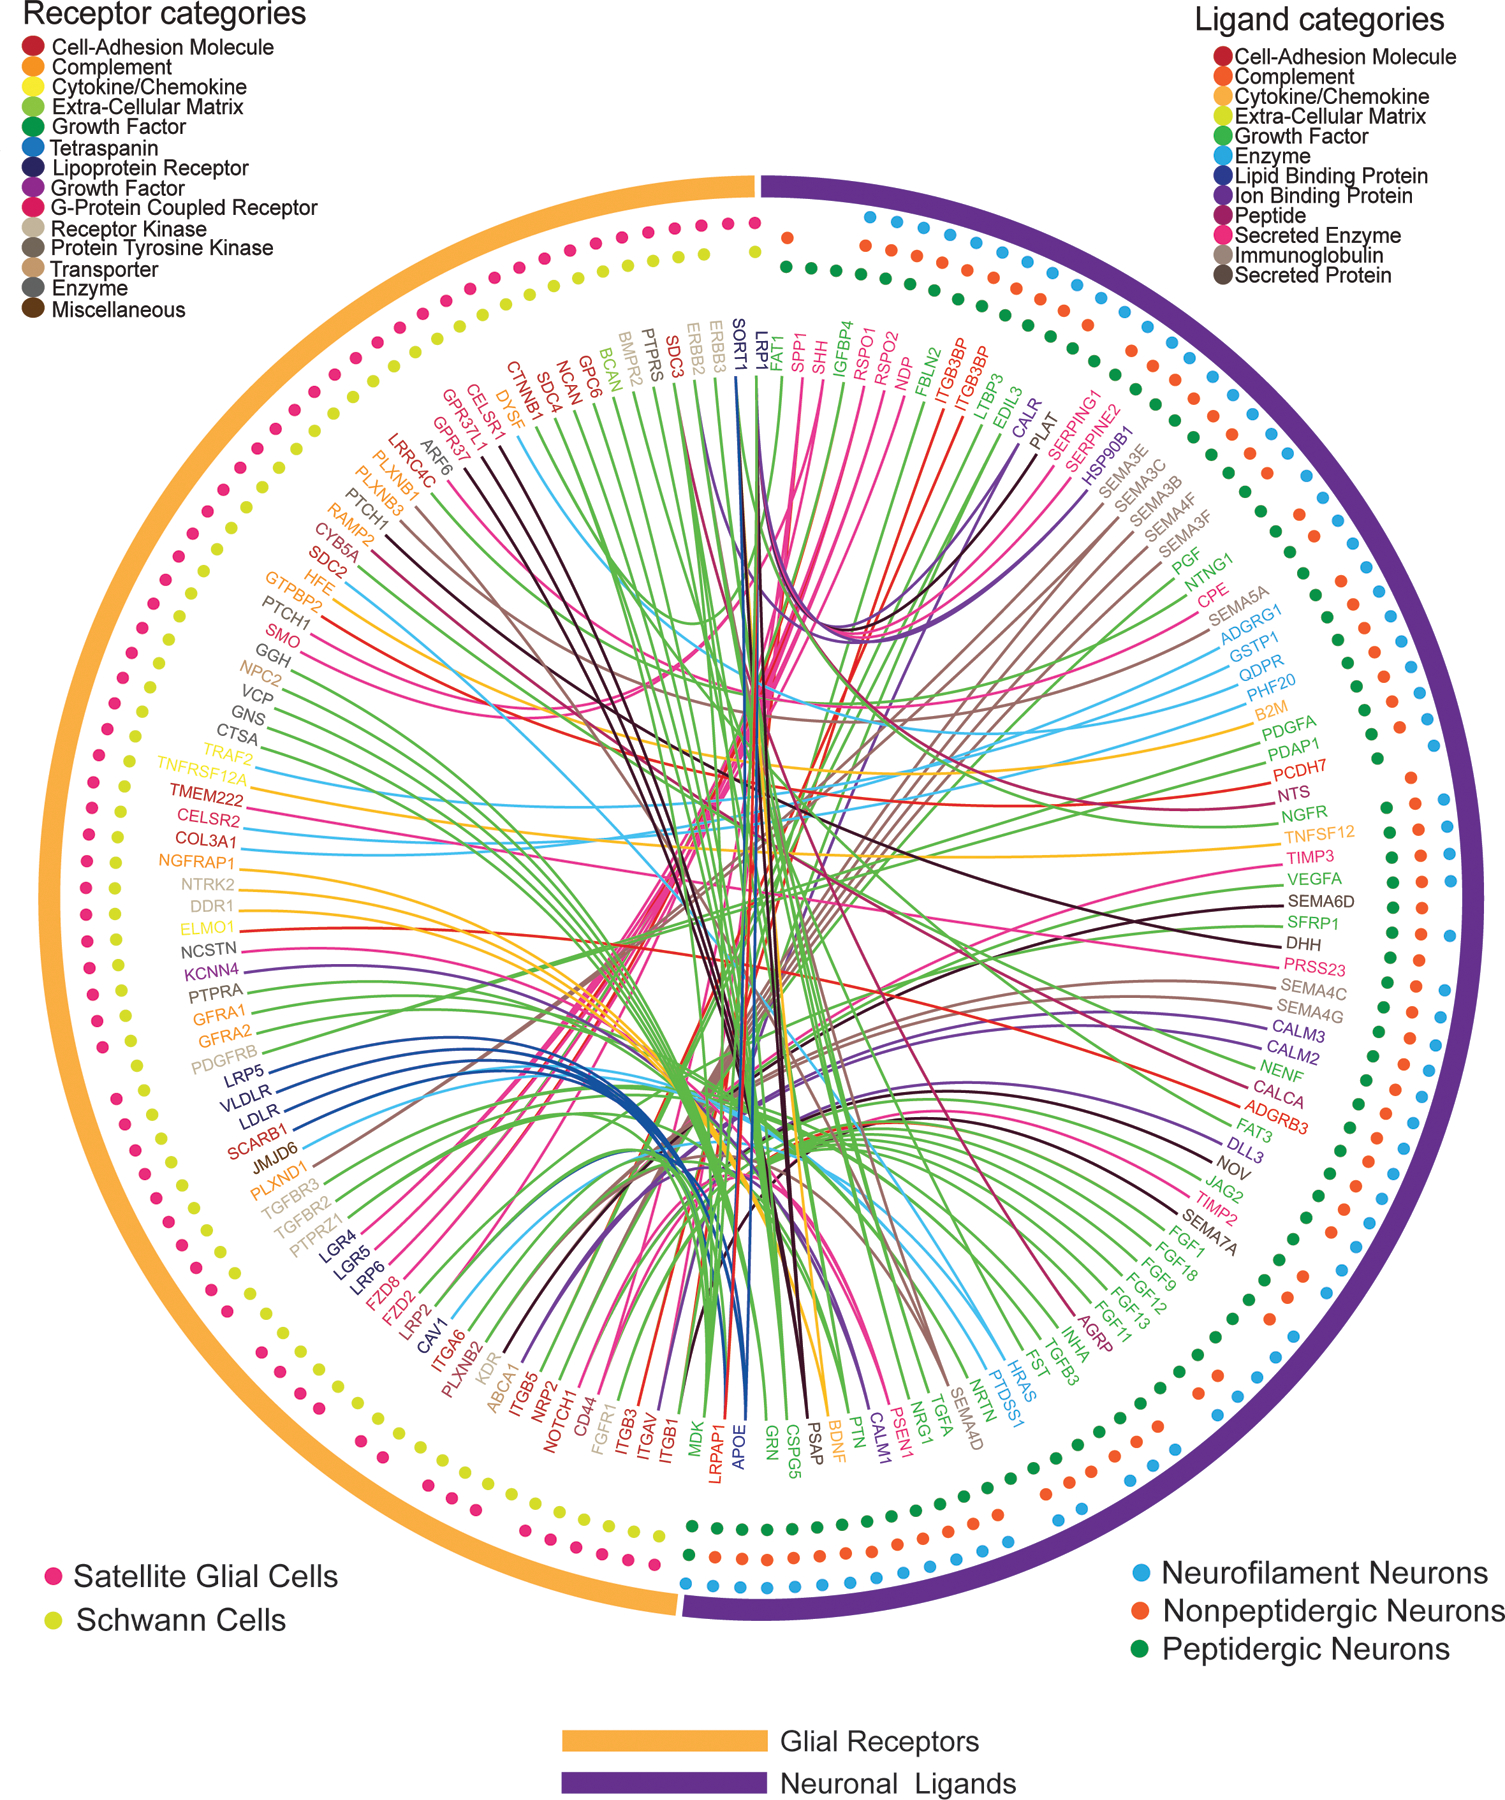
Interactome analysis was performed to identify potential signaling connections between ligands expressed by DRG neurons [PEP-type (n=565 cells), NP-type (n=889 cells) and NF-type (n=126 cells)] and the paired receptor expressed by DRG glial cells [satellite glia (n=681 cells) and Schwann cells (n=47 cells)] from the Zeisel et al. mouse scRNA-seq dataset (12). Outermost circles indicate the generic class of the cells expressing the corresponding ligand or receptor genes. The middle layer shows the specific cell type that the gene is detected in, with the dots color-coded for cell type. The inner layer contains gene names, color-coded for their corresponding ligand or receptor categories. Connections are marked as lines between ligand genes and receptor genes, color-coded for the neuron-expressed ligand gene category.
We then assessed DRG glial ligand signaling to neuronal receptors. This interactome was more diverse and revealed an increased number of these interactions. There were 133 neuronal ligands interactions with glial receptors; conversely, there were 199 glial ligand and neuronal receptor interactions. While the classes of ligands coming from glia did not fall into one main category, 56 of the 199 receptors for neurons were comprised of GPCRs, ion channels, or cytokine receptors (Fig. 4). A prominent ligand-receptor interaction emerging from this dataset was the broad expression of platelet derived growth factor family genes in satellite glial cells and Schwann cells, gene products of which signal to a single neuronal receptor whose gene (Pdgfrb) expression is enriched in the NP class of nociceptors. While PDGF is known to sensitize nociceptors leading to increased mechanical sensitivity (57, 58), little work has been done on PDGF signaling within the DRG, making this an attractive target for further exploration. When comparing these two sets of data, it is notable that there was an enormous variety in the interactions between glial ligands and neuronal receptors. Our data support previous findings in the literature regarding neuronal signaling in the DRG, while identifying potential new interactions which will need further investigation. In the mDRG, we find similar neuron – glia ligand-receptor interaction profiles for peptidergic (PEP) and nonpeptidergic (NP) nociceptors but several differences between non-nociceptive neurofilament neurons (NF) and nociceptors (Fig. 4). An example is Schwann cell- and satellite glial cell (SGC)-derived platelet-derived growth factor (PDGF) signaling to one of its receptors, PDGFRB, which was exclusively found in NP neurons.
Figure 4. Ligand-receptor interactions from glial cells to neurons within the DRG.
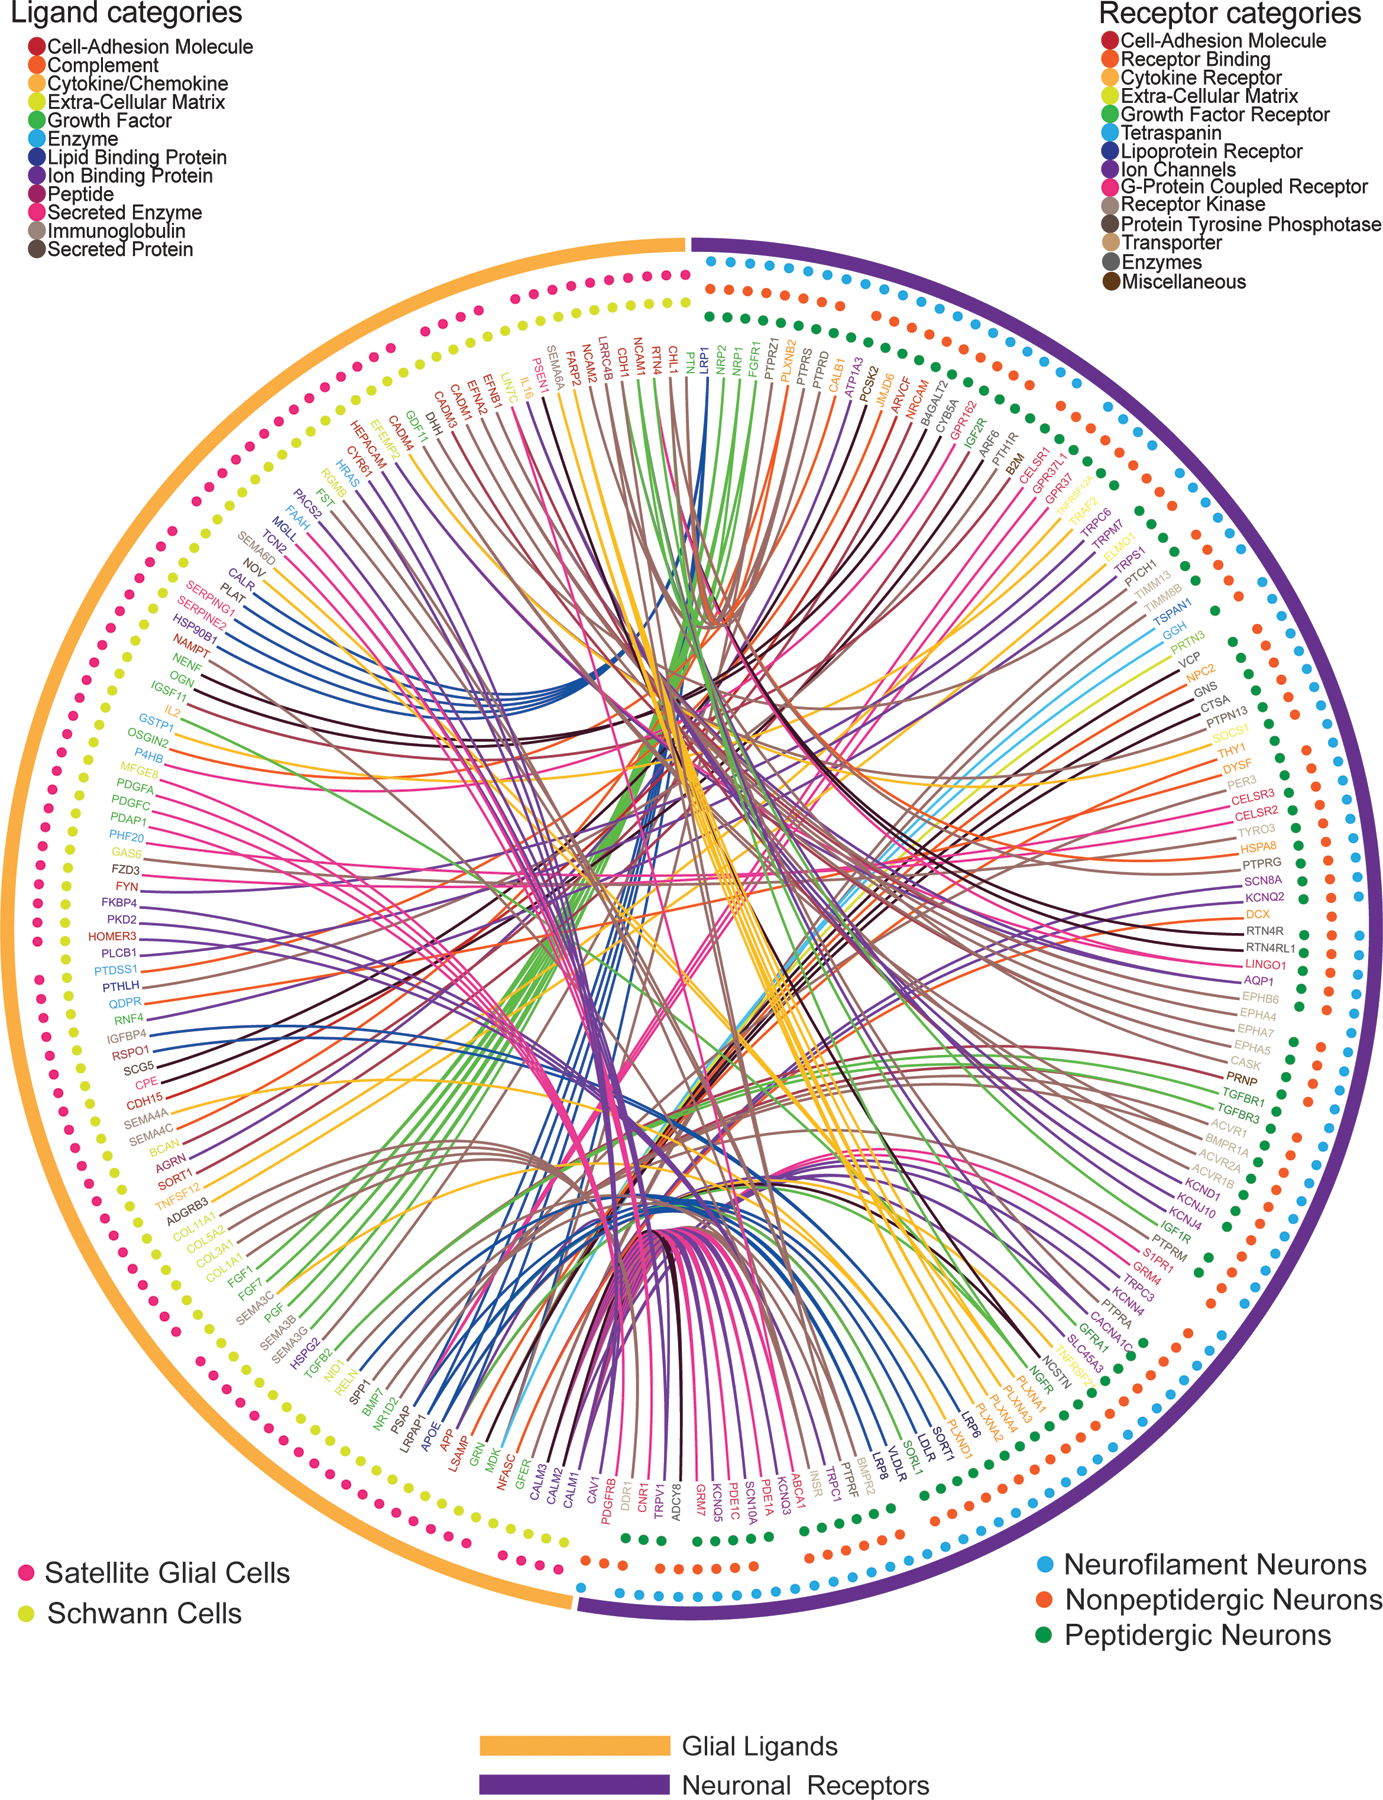
Interactome analysis was performed to identify potential signaling connections between ligands expressed by glial cells [satellite glia (n=681 cells) and Schwann cells (n=47 cells)] and the paired receptor expressed by DRG neurons [PEP-type (n=565 cells), NP-type (n=889 cells) and NF-type (n=126 cells)] from the Zeisel et al. mouse scRNA-seq dataset (12) . Outermost circles indicate the generic class of the cells expressing corresponding ligand or receptor genes. The middle layer shows the specific cell type that the gene is detected in, with the dots color-coded for cell type. The inner layer contains gene names, color-coded for the corresponding ligand or receptor categories. Connections are marked as lines between ligand genes and receptor genes, color-coded for the neuron-expressed receptor gene category.
An interactome between enteric glia and colon-innervating nociceptors defines gut-neuron interactions in a colitis model
Thus far, we have described interactomes between peripheral tissues and DRG neurons, as well as within the DRG, by using sequencing experiments from naïve mice. Certain ligand-receptor interactions may not exist in this state and may only be revealed during pathology where those interactions play a critical role in promoting disease. This principle is the basis of the use of most drugs that are used to treat disease. To explore how the ligand-receptor interactome of DRG sensory neurons changes in a disease state, we examined how colonic enteric glial cells react and communicate with retrogradely labelled and single cell sequenced sensory neurons innervating the colon (17) in the mouse 2,4-di-nitrobenzene sulfonic acid (DNBS) colitis model. We used an existing dataset of RiboTag RNA-seq of enteric glial cells in this colitis model (18), as this technique affords cellular specificity combined with an in vivo inflammatory disease model. A scRNA-seq dataset of retrogradely traced sensory neurons that innervate the colon was chosen because these cells make contact with enteric glia and are at least partially transcriptomically distinct from other DRG sensory neurons (17).
Transcriptomic changes in the DNBS-treated enteric glial dataset were evaluated first. Differential gene expression analysis was performed between vehicle and DNBS-treated groups to identify genes with substantial differences in abundance. This gene list was then intersected with our interactome analysis against retrogradely traced, mouse colonic sensory neuron scRNA-seq data. The original study identified seven cell-types from these retrogradely traced mouse colonic sensory neurons. These cell-types were defined by expression profiles (NP, PEP, NF) and they were further defined by their anatomical location (either thoracolumbar and lumbosacral DRG, or lumbosacral only) (17). We separated these into five cell-types that were found in both thoracolumbar and lumbosacral DRGs (hereafter and in the figure denoted as mixed populations; Fig. 5A), and two cell-types that were only found in lumbosacral DRG (pelvic populations; Fig. 5A). The interactome between differentially expressed ligands in DNBS-treated enteric glia and paired receptors enriched in one of these seven cell-types are presented (Fig. 5A and data file S4, sheet 1), with ligand-receptor pairs that did not show any DRG neuron enrichment for any of the seven cell types are shown in the supplement (data file S4, sheet 2). We found that for 17 out of 22 interactions where the receptor gene was enriched in the two pelvic specific cell-types, their ligand-pair gene expression was substantially decreased. In contrast, in 39 out of 64 interactions where the receptor gene was enriched in mixed DRG cell-types, their paired ligand gene expression was substantially increased. Under the premise that increased gene (and potentially protein) abundance leads to increased protein interactions, this shows that there is a potential difference in signaling between enteric glia and colonic sensory neurons wherein inflammation relatively specifically augments ligand-receptor interactions between mixed population afferents whereas there is a tendency of decrease in interactions between enteric glia and pelvic afferents (Fig. 5B).
Figure 5: Differential expression and interactome analysis of ligands in enteric glia and of receptors in colonic-projecting sensory neurons reveals potential drivers of visceral pain.
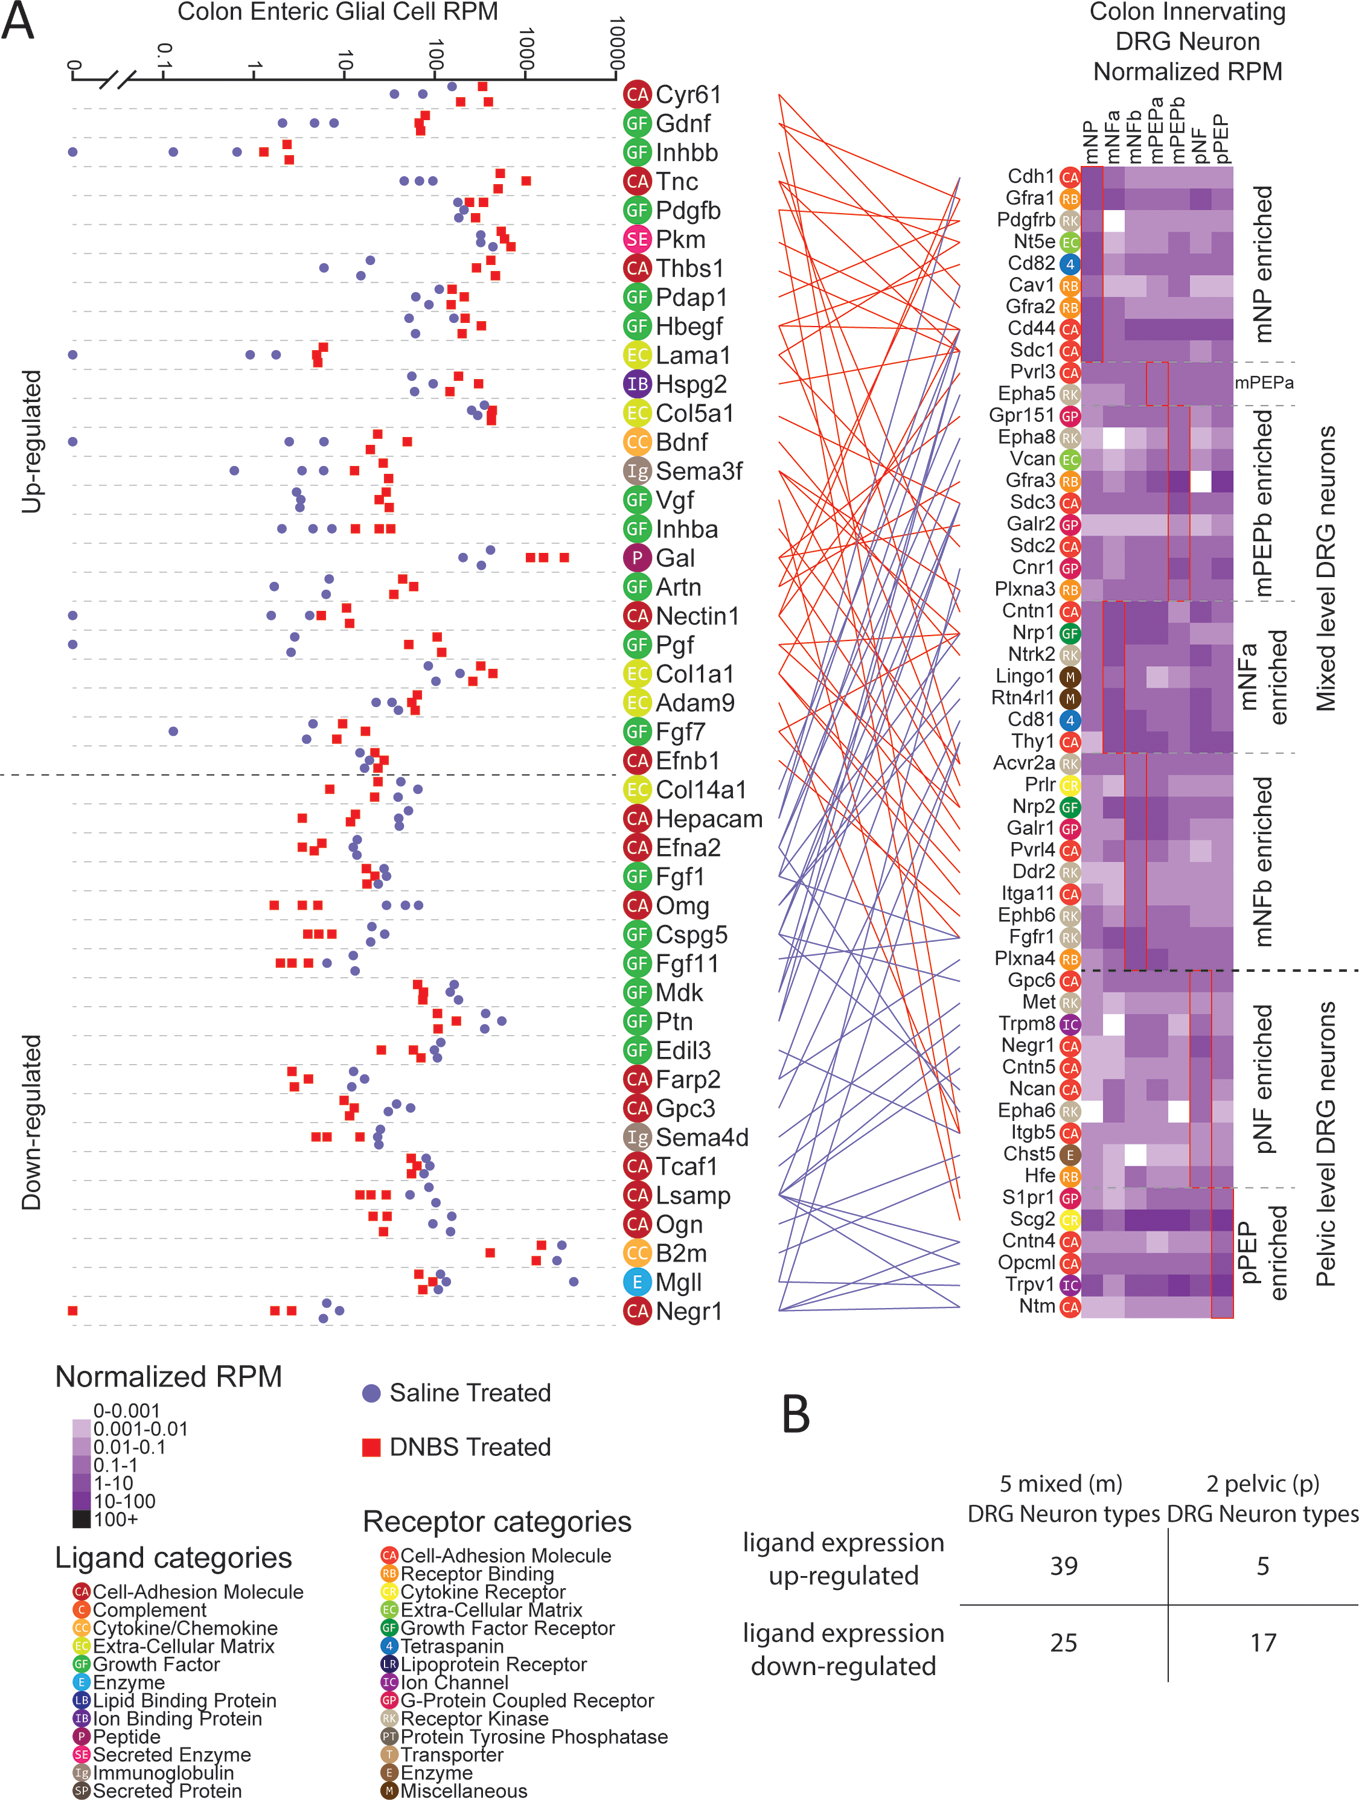
(A) Differential expression of ligand-encoding genes in RiboTag RNA-seq of enteric glial cells from mice treated with saline or DNBS (N = 3 each) (18), and gene expression of corresponding receptor-encoding genes in scRNA-seq of DRG sensory neurons (314 cells) (17), grouped by type as indicated. Ligand-receptor pairs between the enteric glia and colon-innervating neurons are connected between the plots, wherein red (above the dashed line in the plot, left) indicates ligand expression was increased in enteric glial cells after DNBS treatment, and blue indicates a decrease. Ligand and receptor genes are labelled with color-coded category labels, defined in the in-figure legend. Cell types prefixed with “p” denote populations primarily from lumbosacral (pelvic) DRG, while those prefixed with “m” denote populations sampled from a mixture of thoracolumbar and lumbosacral DRG. (B) Table enumerating the number of glia-expressed ligands—those that were upregulated and, separately, downregulated in DNBS-treated animals —that corresponded to receptors in the indicated grouped subtypes of DRG neurons.
Based on the premise that elevated gene abundances could cause robust protein interactions and may be important for pelvic pain disorders, we looked more closely at this part of the interactome. Among increased ligand genes that signaled to DRG neurons in the mixed population we found that Bdnf and Gdnf were prominent. BDNF signaling to TrkB is known to play an important role in pain plasticity where it has primarily been studied in the context of BDNF release from primary afferents in the spinal cord (59, 60), but has also been linked to inflammatory visceral pain disorders (61–63). Glial cell line-derived neurotrophic factor (GDNF), which was linked to Gfra1 and Gfra2 expression, was also found to be increased in relative gene abundance in DNBS-treated enteric glial cells. Other studies have indicated that GDNF upregulation in target tissues enhances nociception (64–66). ARTN (artemin), a ligand in the same family as GDNF, was also found to be increased in gene expression and linked with Gfra1 and Gfra3 expression. This demonstrates a coordinated increased expression of neurotrophins in enteric glia that are likely to signal through pelvic and lumbosacral mechanisms to promote visceral pain (61–67).
Disease-promoting macrophages from rheumatoid arthritis patients interact with hDRG through an EGFR-enriched pathway
The interactome analysis described above shows that we can identify ligand-receptor signaling pathways in a mouse model of visceral pain. However, discoveries made in mouse models are not always consistent with actual human disease states (68, 69). Therefore, we sought to assess whether this interactome approach could be used to identify novel targets in human disease states. This requires availability of human DRG sequencing data and sequencing data from target tissues or cells from patients with chronic pain diseases. We chose to investigate how macrophages from rheumatoid arthritis (RA) patient synovium might communicate with cell types in the human DRG, especially human sensory neurons.
A previously published scRNA-seq study of synovial tissue from RA and osteoarthritis (OA) patients identified 4 specific sub types of macrophages within the joints of patients with either of these diseases (16). A total of 12 RA patients (7 females and 5 males) and two OA patients (both male) were enrolled in the Kuo et al. study (16). To find macrophage-driven interactions with human DRG neurons that are potentially responsible for promoting pain in RA, we contrasted the RA-enriched macrophage cell types with the OA-enriched macrophage cell-types. Ligand genes that were highly expressed in the RA macrophages compared with the OA macrophages were selected, then filtered by whether their receptor genes were detected in human DRG RNA-seq data (14, 19), resulting in RA-enriched ligand-receptor pairs (Fig. 6). OA-enriched interactions—which includes pathways related to bone regeneration—are in the supplement (data file S5). Notably, of the 20 RA-enriched ligand-encoding genes, four of them—HBEGF, EREG, DCN, and HSP90AA1—encode proteins that signal through EGFR. This suggests that ErbB family receptors may play a key role in promoting persistent pain in RA patients. Increased expression of ErbB family-related ligands and receptors is seen in RA patients. For instance, ErbB family pathway changes are triggered by increased abundance of amphiregulin and epiregulin (EREG) in RA patients (70), while experiments in mice have shown the development of cytokine-induced arthritis can be suppressed with local blockade of these ligands in the joint (71). The importance of the ErbB family pathway in chronic pain has been previously noted in the literature, but not in the context of RA pain. For instance, EREG-mediated EGFR activation causes pain sensitization through PI3K-AKT-mTOR pathways in inflammatory pain models (23) and EGFR inhibition with gefitinib reduces opioid tolerance and hyperalgesia (72). Moreover, ErbB receptor family inhibitors have been used successfully for the treatment of neuropathic pain in patients (22, 24). RA treatment has been transformed by the use of TNF-α–targeting biologics, but chronic pain remains a persistent problem for RA patients (73, 74). With previous findings showing ErbB family inhibitors can be used to treat RA in mouse models (71, 75), we propose that inhibitors of the ErbB receptor family could potentially be repurposed to treat inflammation and RA pain at the same time.
Figure 6: DRG receptor-associated ligand expression in synovial joint macrophages identifies potential drivers of persistent pain in rheumatoid arthritis.
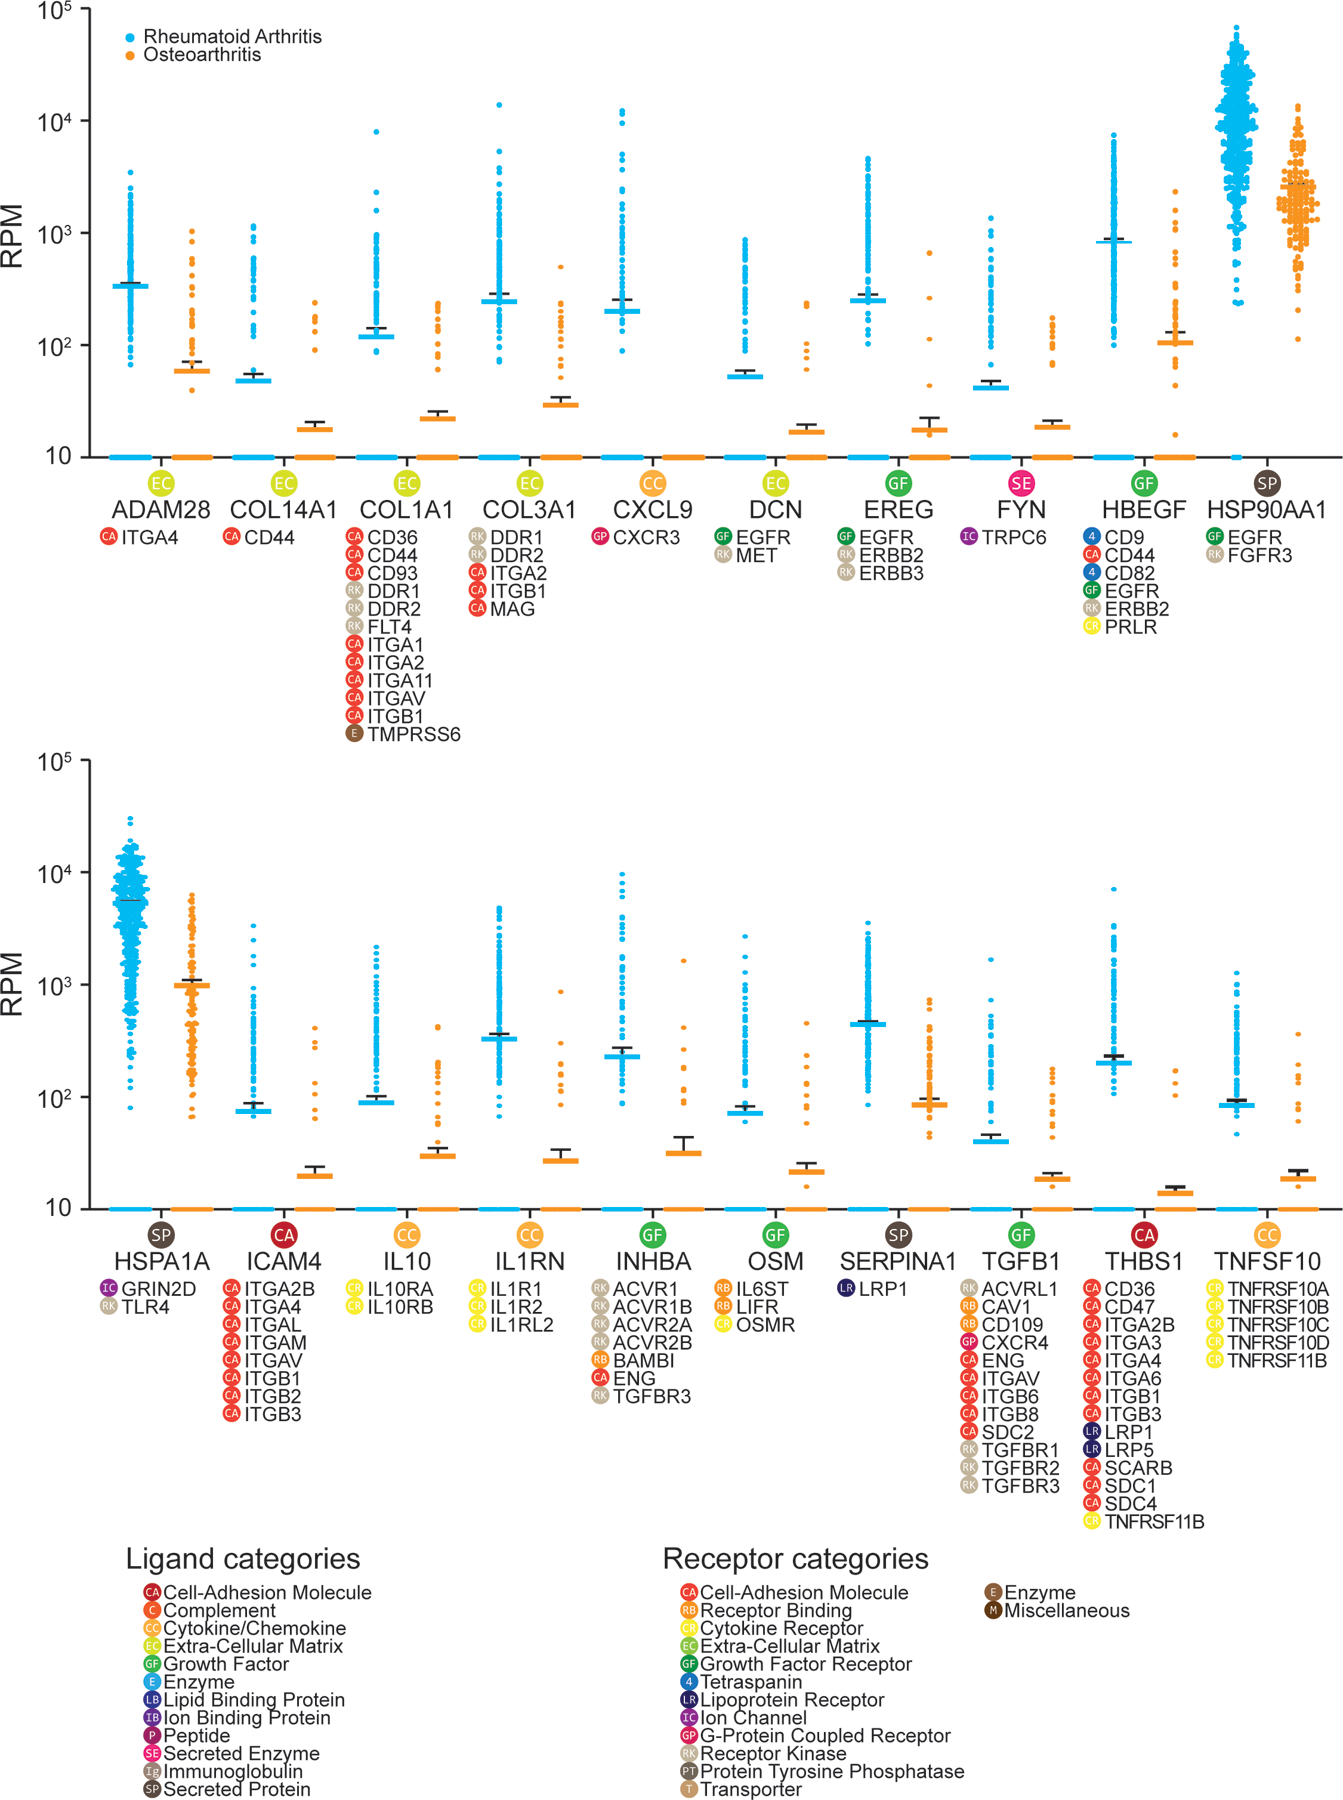
Differential expression of ligand-encoding genes in synovial macrophages isolated from RA patients (394 cells) and those isolated from OA patients (139 cells), based on human scRNA-seq data from Kuo et al. (16). Only ligand genes with higher expression level in RA macrophages compared with OA macrophages are shown. Gene expression level in reads per million (RPM) for each cell is shown (RA macrophages in blue; OA macrophages in orange) with the solid line as the mean and error bars representing SEM. Corresponding receptor genes detected in human DRG (N = 3 from individual organ donors) are noted under each ligand gene. Corresponding ligand or receptor categories are color-coded and labeled for each ligand or receptor gene as shown in the legend.
Pancreatic cancer cells suppress inhibitory and enhance excitatory signaling to human DRG neurons
Pancreatic cancer involves cancer driven mutational changes, and large-scale transcriptional reprogramming. It is often associated with severe pain, and many patients are resistant to pharmacological pain treatment of any kind, requiring neurolytic treatments (76, 77). A better understanding of how cells from pancreatic cancerous tissue signal to DRG neurons could lead to identification of therapies that can alleviate pancreatic cancer pain.
We utilized a bulk RNA-seq dataset of pancreatic cancer tissue where we could control for individual differences in transcriptomes by having matched cancer and non-cancer pancreatic samples from each of four patients (2 females and 2 males) in the TCGA database (20). These four patients had stage II tumors (one of them stage IIa, and the other 3 stage IIb). According to the definition of pancreatic cancer stages by the American Cancer Society, stage IIb pancreatic cancer has spread to no more than 3 nearby lymph nodes, and may be considered as unresectable by physicians (https://www.cancer.org/cancer/pancreatic-cancer/detection-diagnosis-staging/staging.html). Over 80% of these patients with unresectable pancreatic cancer experience pain (78, 79) . Ligands that systematically increased or decreased in abundance in cancer samples across all 4 patients were used for the interactome analysis. These interactions were then filtered by whether their receptor genes were detected in hDRG RNA-seq data (19). Among 41 ligand-receptor pairs identified (Figs. 7 and 8 and further detailed in data file S6), we noted that genes of certain mediators that are well-known pain suppressing ligands showed decreased expression in cancerous tissue compared with healthy tissue. These included the endogenous opioid ligand POMC and the anti-inflammatory cytokine IL10. On the other hand, the expression of many pain-promoting and/or inflammatory ligand-encoding genes was increased, including SHH, TGFA, TFF1. These findings suggest that a central problem in pancreatic cancer pain may be a loss of balance between pain-suppressing and pain-promoting signal transduction that is found within the normal pancreas. Notably, 4 of these 41 ligand-encoding genes—CEACAM1, FGF1, TFF1, TGFA—encode proteins known to signal through EGFR, suggesting (as above in RA) that the ErbB receptor family may play a role in driving pain in the context of pancreatic cancer. While the corresponding ligands of ErbB receptor family members have been previously studied in the context of cancer (where EGFR and ErbB2 are known targets), they have not been widely studied in the context of pain. Additionally, ErbB receptor family inhibitors have been shown to provide pain relief in previous cancer clinical trials (80). This may occur because of inhibition of tumor-to-nociceptor signaling or as tumor shrinkage decreases pressure on nearby nerves, like the celiac plexus.
Figure 7: DRG receptor-associated ligand expression in normal and malignant pancreatic tissue from humans, part I, reveals potential mediators of pancreatic cancer pain.
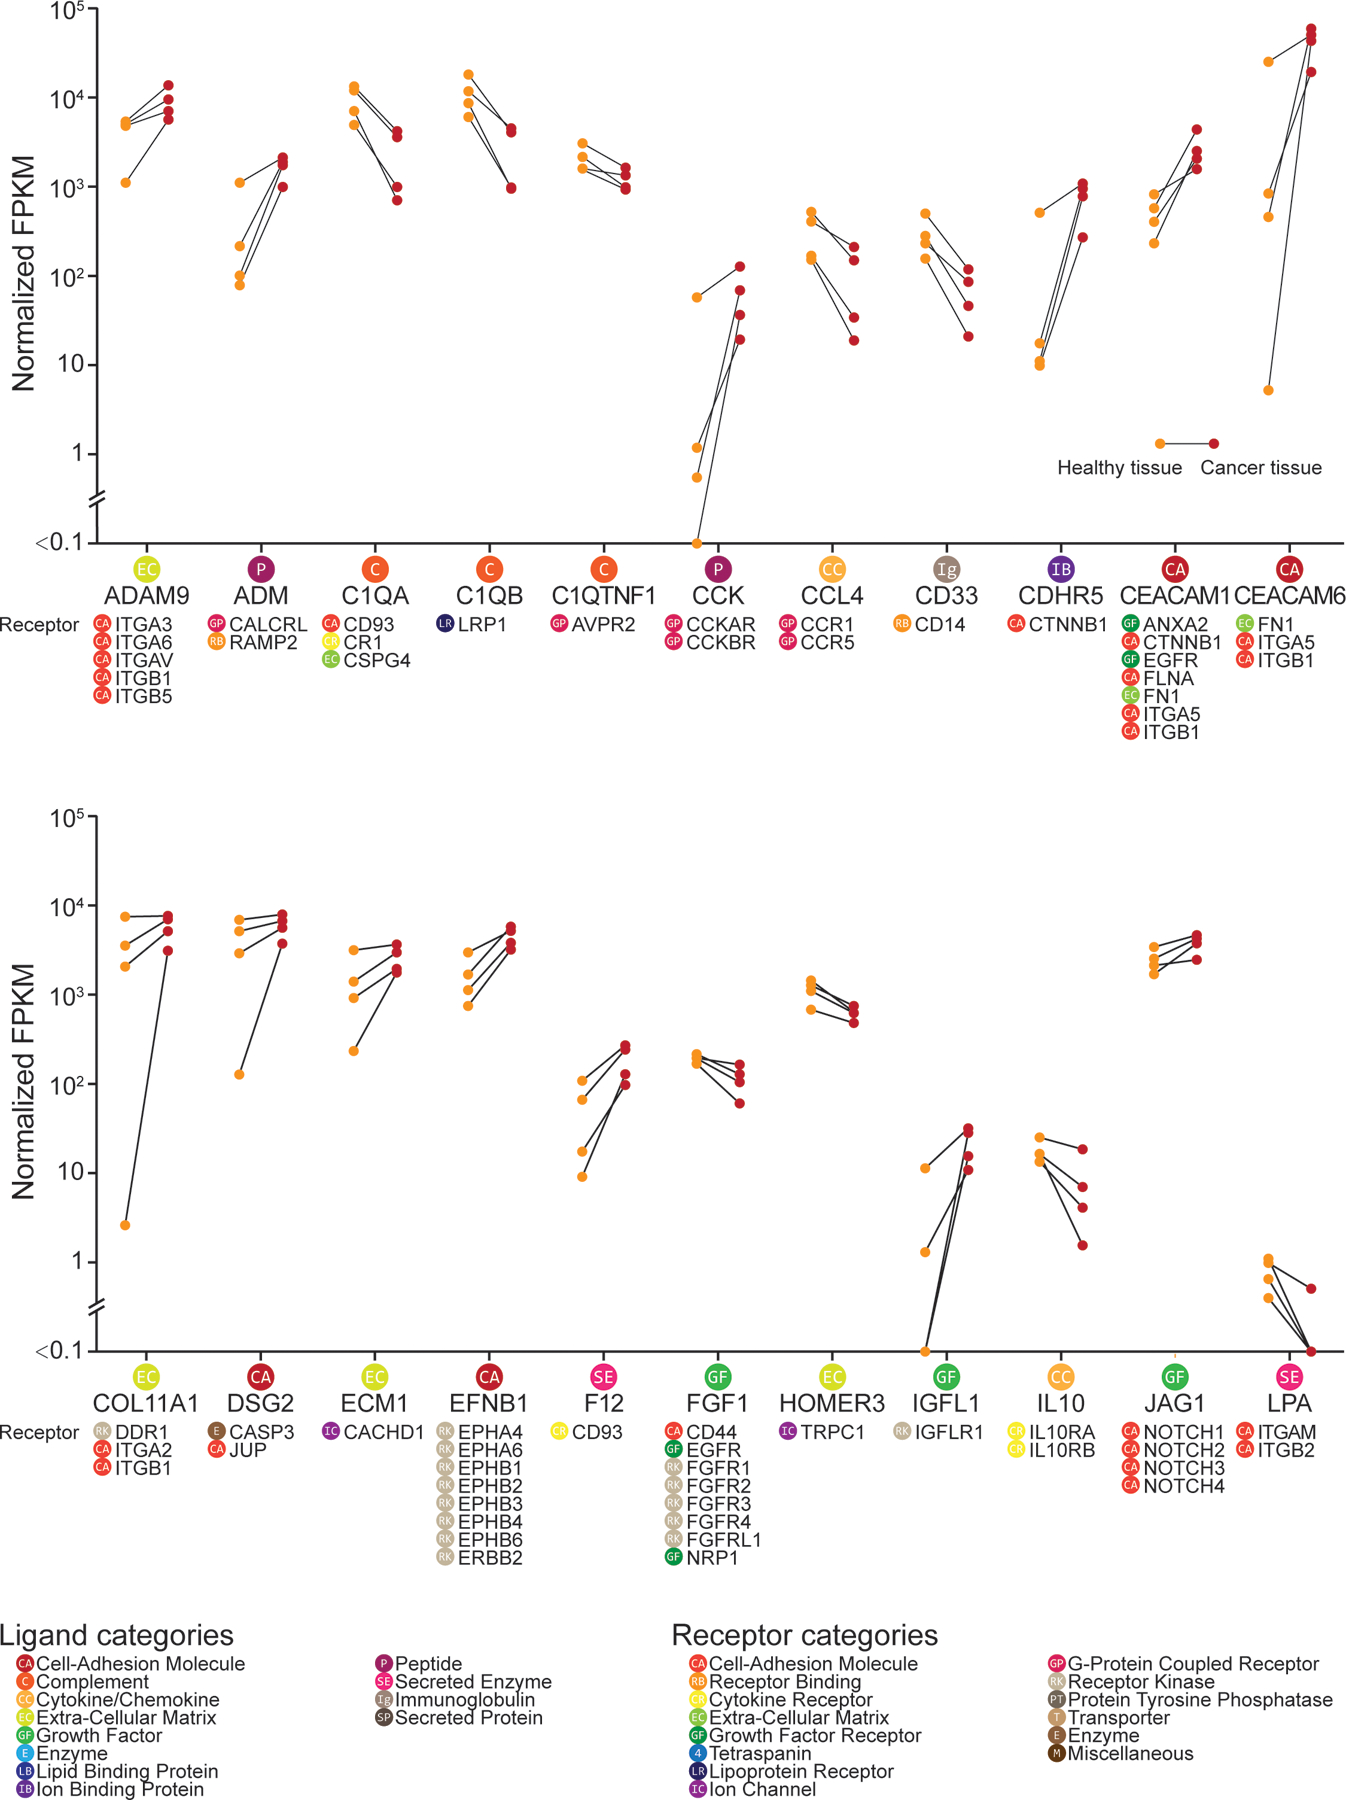
Differential expression of ligand-encoding genes between healthy and cancerous tissue from 4 individuals with pancreatic carcinoma, obtained from the TCGA bulk RNA-seq datasets (20) and presented in part, in alphabetical order. Only ligand genes with a corresponding receptor gene expressed in the human DRG dataset (N = 3 from individual organ donors) are shown. Gene expression level in fragments per kilobase million (FPKM) is shown (healthy tissue in orange; cancerous tissue in red) with the connected line marking the samples from the same patient. Corresponding receptor genes detected in human DRG are shown under each ligand gene. Corresponding ligand or receptor categories are color-coded and labeled for each ligand or receptor gene as shown in the legend.
Figure 8: DRG receptor-associated ligand expression in normal and malignant pancreatic tissue from humans, part II.
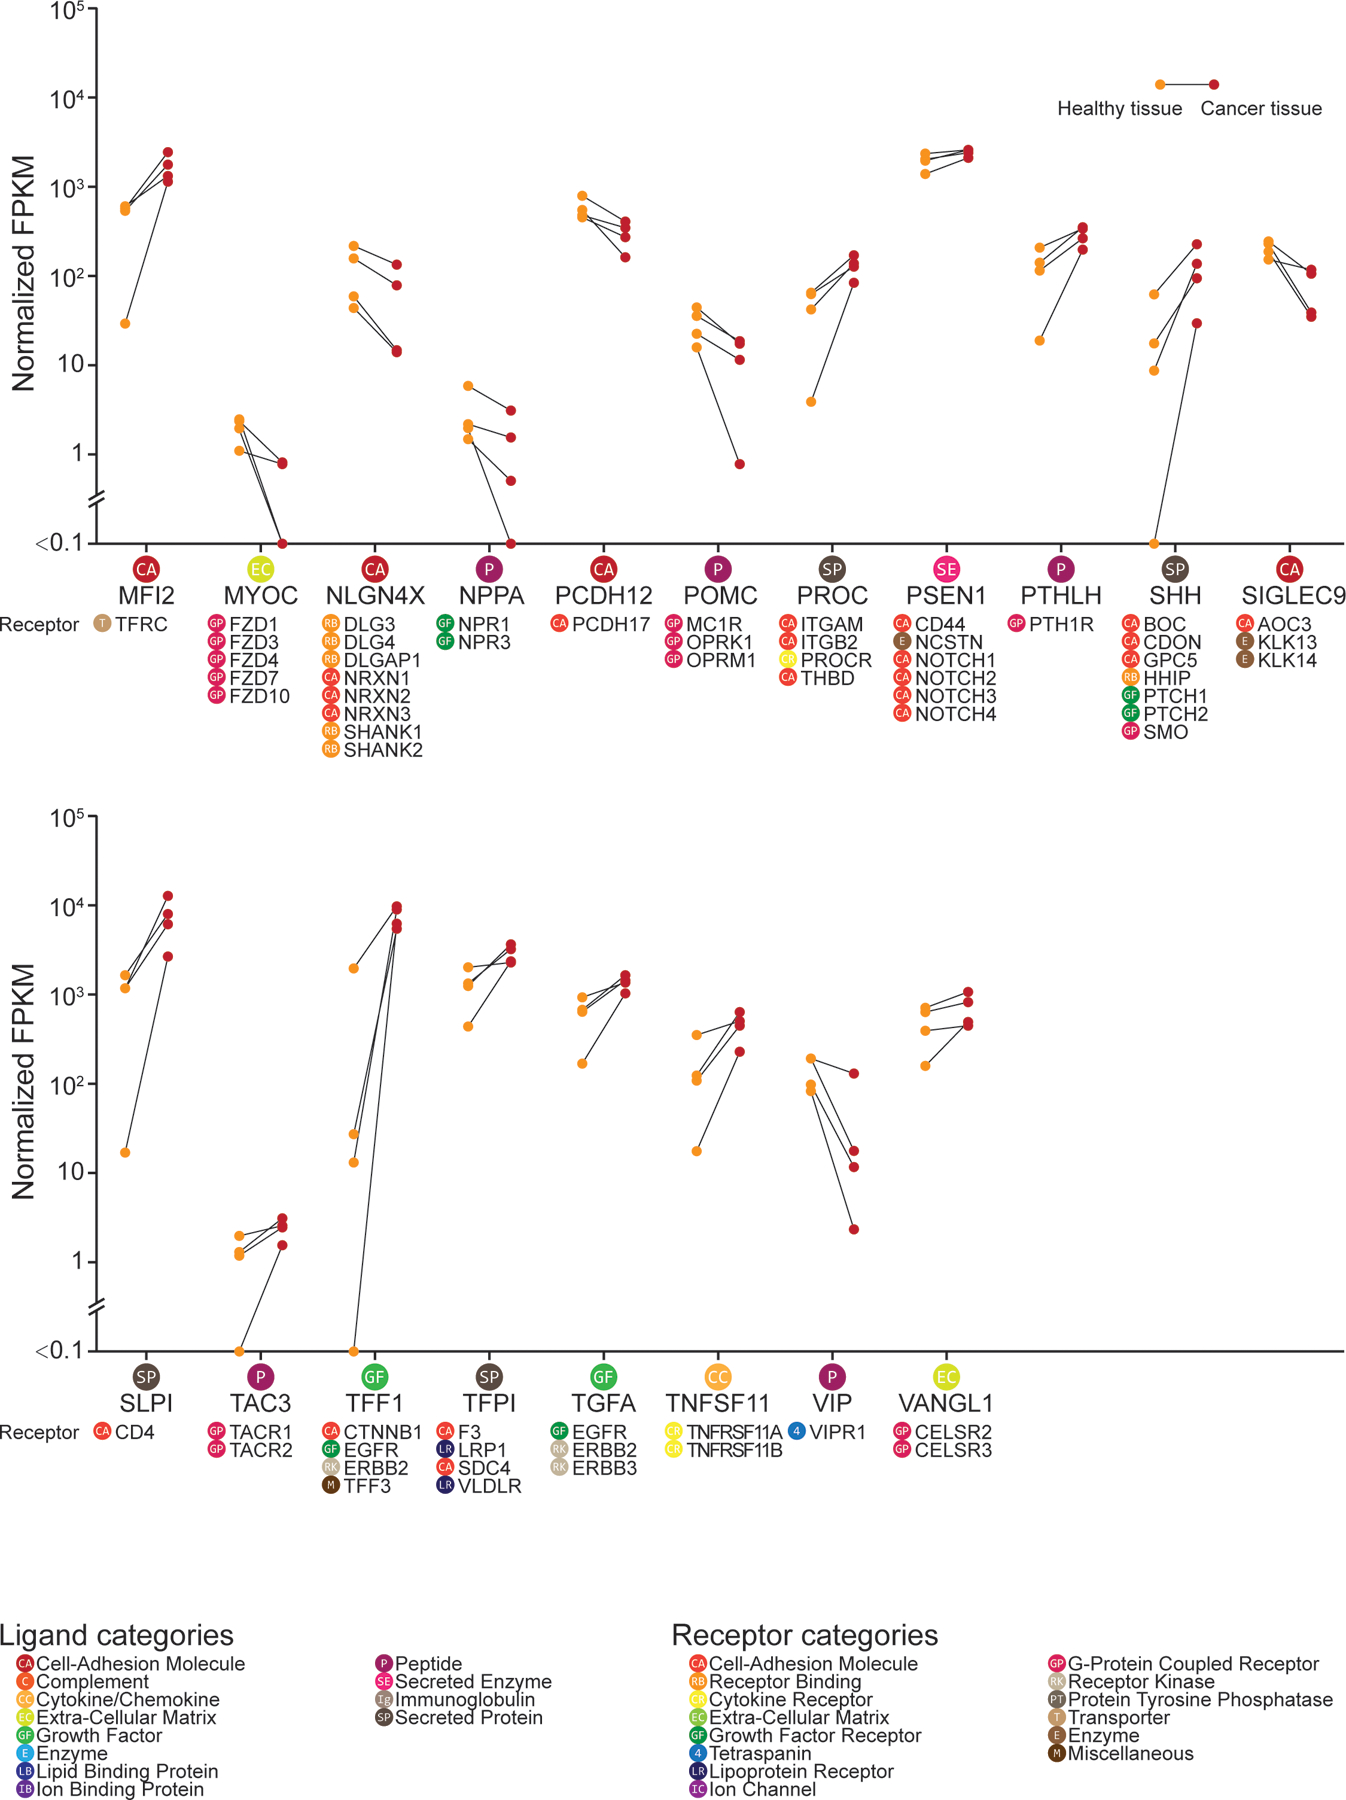
Additional data from the interactome analysis on normal and malignant pancreatic tissue with human DRG, performed and analyzed as described in Fig. 7, continued here in alphabetical order.
HBEGF stimulates mDRG neurons and causes pain in vivo
Our results suggest a potential role of ErbB receptor family in many types of pain, but the only corresponding ligand that has been confirmed to cause pain in vivo is epiregulin (23). To the best of our knowledge, HBEGF has never been assessed for pro-nociceptive actions, but our datasets suggest a possible role in several pain states. We applied HBEGF (10 ng/ml) to mDRG neurons from male and female mice and observed a Ca2+ signal in ~ 30% of neurons (Fig. 9, A and B). This effect was completely blocked by the ErbB family antagonist lapatinib (6 nM) (Fig. 9, C and D). Lapatinib blocks receptor kinase activity for both EGFR and ERBB2 (81). To examine the effect of HBEGF in peripheral tissues innervated by sensory nerve endings, we injected HBEGF (50 ng) into the paw of mice to test for mechanical sensitivity and grimacing. Male ICR and female C57BL/6 mice were used in order to test sex and strain differences. In male mice we observed mechanical hypersensitivity (Fig. 9E) and a trend toward increased grimacing (Fig. 9F). In female mice HBEGF also caused mechanical hypersensitivity (Fig. 9G) and grimacing at 1 hour after injection (Fig. 9H). Examining pooled data from male and female mice revealed a strong effect on mechanical hypersensitivity lasting for at least 24 hours (Fig. 9I) and a significant effect on grimacing at 1 hour after injection (Fig. 9J). Because responses were qualitatively similar between the two groups of mice, it is unlikely that there are major sex or strain differences in HBEGF responses in mice. We conclude that like epiregulin, HBEGF is an ErbB receptor family agonist that causes pain in vivo, likely through a direct action on ErbB2 receptors expressed by DRG nociceptors.
Figure 9: HBEGF excites mDRG neurons and causes pain in vivo.
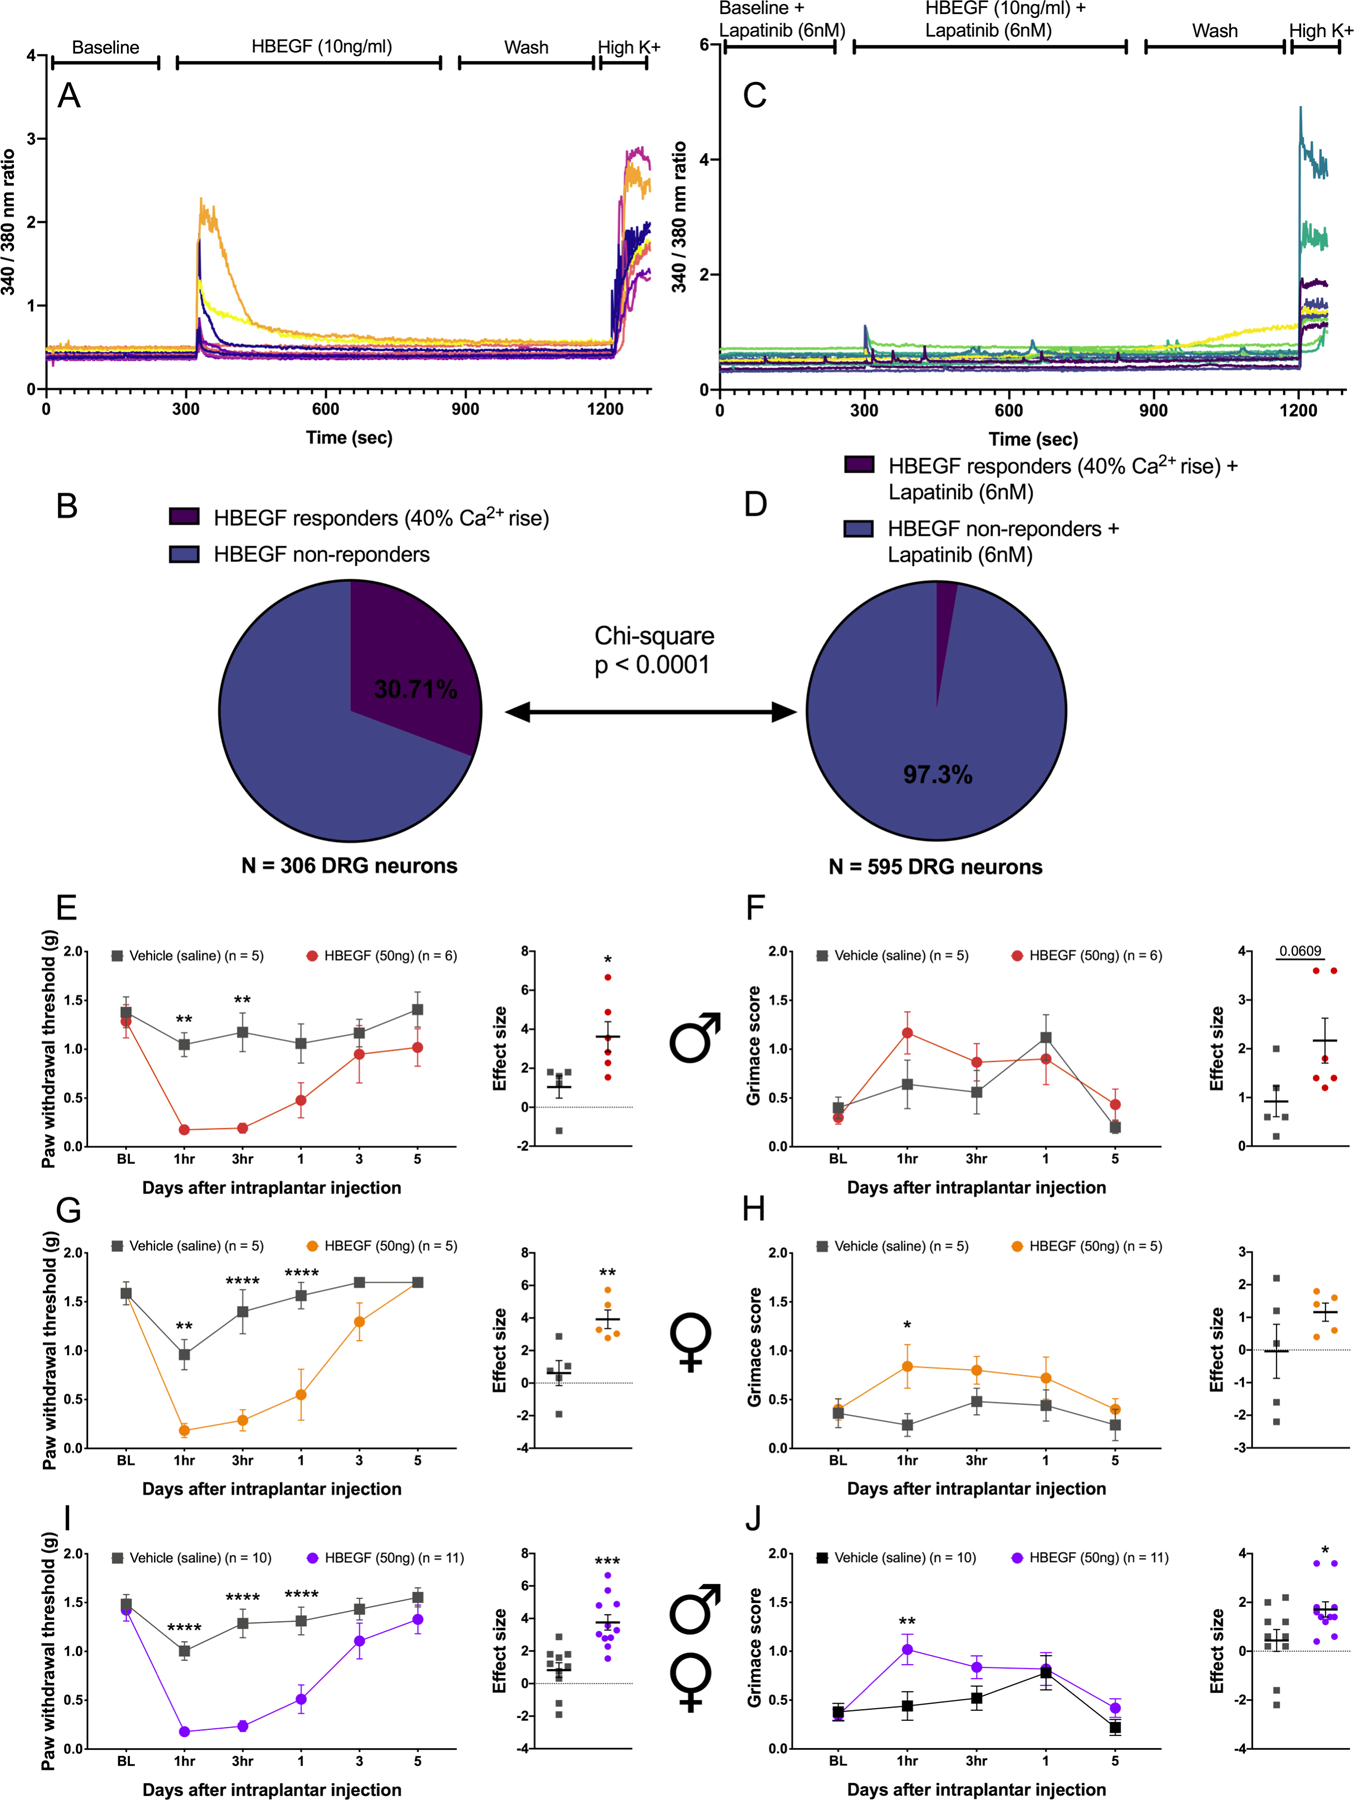
(A to D) Intracellular Ca2+ concentration in mouse male and female DRG neurons in response to HBEGF (A, analyzed in B) or HBEGF with the EGFR antagonist lapatinib (C, analyzed in D). N = 306 and 595 neurons, respectively. (E to J) Mechanical sensitivity to von Frey filaments, as inferred from paw withdrawal thresholds and grimacing, in male ICR mice (E and F) and female C57BL/6 mice (G and H) one hour after hindpaw injection with saline or 50 ng HBEGF. Pooled data for all male and female are displayed in (I and J). N = 5 to 11 mice each, as noted in the figure. * p <0.05, ** p<0.01, *** p<0.001 by two-way ANOVA with Bonferroni post test, or t-test for effect size. Sample sizes are shown in the figure. Horizontal bars or boxes represent the mean, and error bars represent SEM.
Discussion
We have created an interactome identification framework for the examination of how specific subtypes of cells in the body interact with sensory neurons that innervate the target tissues where these cells reside. This resource can be used to mine interactions between sensory neurons and many of the cell types found in the bodies of mice. Many of these ligand-receptor interactions are generic; however, a surprisingly large number of them show specificity. For instance, T cells and NK cells appear to use lymphotoxin alpha (Lta) to lymphotoxin beta receptor (Ltbr) as a unique mechanism to signal to nociceptors. Our work also elucidates how ligand-receptor interactions can potentially change in chronic pain disease states such as rheumatoid arthritis and pancreatic cancer. Our database and computational framework can be useful for identifying new targets for disease treatment (for example, HBEGF acting on ErbB receptors). We anticipate that continuing advances in sequencing techniques (82), such as spatial transcriptomics (83), and their application to human disease tissues will enable targeted therapeutic discoveries using this interactome framework.
One of the key findings emerging from our work is the complexity of the potential ligand-receptor interactions that are found in these interactomes. Pain is widely acknowledged to be a complex disease, but most pain therapeutic development focuses on a single factor, such as NGF or CGRP sequestering antibodies, or receptor or enzyme antagonists (84). Some of these approaches, for instance NGF (85) and CGRP (86) targeting, have been effective in the clinic. However, not all patients respond to these therapeutics and even when patients do respond, these therapies are not cures. Our work shows that chronic pain disease states are accompanied by complex changes in ligands produced in diseased tissues and that many of these ligands have considerable potential to have an action on the nociceptors that innervate that tissue. This likely means that multiple ligand-receptor interactions need to be simultaneously targeted to effectively treat chronic pain states. Of course, this is not a new concept, but our work starts to provide a toolkit to quantify these ligand-receptor interactions and design therapeutic strategies that have an increased chance of success. Continuing to develop transcriptomic maps of human tissues, at the bulk and single cell level, including in disease states, will ultimately be needed to achieve this goal. Such efforts are well underway and the technology to do such studies at the individual patient level are rapidly becoming available (82).
Another key finding is the degree to which ECM and cell adhesion molecules govern ligand-receptor interactions between peripheral cells and sensory neurons. These interactions dominated our ligand-receptor interactomes and many of these interactions have not been studied at all in the context of sensory neurobiology. Several studies in the past decade have pointed out the key role that ECM molecules play in the development of chronic pain states (51, 87, 88), but, again, these studies have only focused on a small number of the many interactions that were apparent in our interactomes. These ECM and adhesion molecule interactions may also play a critical role in recruitment and proliferation of immune cells to peripheral nerves and the DRG after nerve injury. Insofar as these neuro-immune interactions in the periphery are emerging as key players in nerve regeneration (41) and neuropathic pain (40, 89), gaining a better understanding of how this occurs will yield new insight into disease states. Therefore, this is almost certainly an area that is ripe for further exploration from the perspective of fundamental neurobiology knowledge and therapeutic target discovery.
A theme emerging from our interactomes built using sequencing data from human disease was the involvement of ErbB family receptors and their corresponding ligands. Previous studies have implicated the pathway associated with this family of receptors with chronic pain, but to our knowledge HBEGF has not been specifically studied in this context. Genetic associations studies link the ErbB family of receptors and the ligand epiregulin (encoded by the EREG gene) to chronic temporomandibular joint pain (23). Animal pain models suggest that ErbB family activation by epiregulin promotes inflammatory and neuropathic pain and that ErbB receptor family signaling is critical for pain promoting effects of opioids (23, 72). Finally, several clinical trials have been done with inhibitors that target ErbB family receptors for neuropathic pain and some of these have been positive (21, 22, 24). Our results point to a diversity of ligands specific to the ErbB family of receptors that are increased in abundance in painful tissues such as joints of people with RA and in pancreatic cancer. These ligands were distinct in these clinical cohorts and did not include epiregulin, whose ortholog is reported to be unique among ErbB receptor ligands in sensitizing nociceptors in mice (23). Some of them did include HBEGF, and we show here using mice that HBEGF can activate mDRG neurons in an ErbB receptor family-dependent fashion to cause pain in vivo. In mice, DRG neurons do not apparently express Egfr, but both peptidergic and non-peptidergic nociceptors express Erbb2 (12). HBEGF induced Ca2+ transients in mDRG neurons that were completely blocked by lapatinib, which inhibits both EGFR and ErbB2. It is very likely that pain promoting effects of HBEGF in mice are mediated by ErbB2. In human DRG, however, both EGFR and ERBB2 genes are expressed (14, 90), suggesting a potential species difference. Another consideration is that different ErbB family ligands have differential signaling bias when activating ErbB receptors in neurons, as shown by Martin and colleagues (23). It is likely necessary to study the effects of ErbB family ligands on human nociceptors as several published reports have demonstrated important differences between rodent and human nociceptors (19, 91–93). Nevertheless, our findings are promising from the perspective of broadening study of ErbB family receptor inhibitors for different chronic pain conditions. Our work highlights HBEGF, in addition to epiregulin, as EGFR agonists that may be involved in pathological pain.
There are some key limitations to our work. The first is that most of the interactomes presented are not precisely matched for the innervation of the target tissue. The exception is the colonic sensory neuron to enteric glia interactome. Future work will focus on building additional interactomes where the target cell types are matched to the subsets of nociceptors that specifically innervate those cells and, if possible, taken from samples with the same pathophysiological state. This will have important implications for more precise target identification. The second is that single-cell resolution is not yet available for the hDRG, so the human disease-based interactomes should be interpreted with some caution. Our bulk-sequencing data affords a broad view of possible interactions between target tissues and hDRG neurons, but single-cell sequencing on hDRG neurons would improve confidence in targets emerging from these types of experiments. A third limitation is in gaps in the ligand-receptor interactome. While we have made a concerted effort to include as many enzyme-derived small molecule interactions as we can in this database, it is not comprehensive. There are also many ligand-receptor interactions that are not yet known, and these are necessarily not part of our interactome. Therefore, while our work elucidates many aspects of ligand-receptor interactions that are potentially involved in driving painful disease states, it cannot be viewed as a comprehensive resource. Finally, while gene expression of ligands and receptors may predict signaling, post-transcriptional and post-translational regulation—as well as mRNA and protein transport or localization—can modulate the degree and viability of such protein interactions. For candidate signaling pathways, interventional studies need to be performed to validate the predicted interactome. Our mouse HBEGF study provides a roadmap in how such studies may be designed. Nonetheless, our findings create a resource that may be built upon with further validation work and rapid advances in sequencing and other technologies. From this, we envision new therapeutic targets specific to various chronic pain disorders may be identified.
Materials and Methods
Mouse RNA-seq resources
The Tabula Muris dataset (10) contains scRNA-seq data generated by two methods: Smart-seq2 sequencing of specific cells using a fluorescence-activated cell sorting (FACS) method, and a microfluidic emulsion method. The scRNA-seq data generated by the FACS method includes more tissue-types and greater sensitivity (higher number of genes detected per cell); therefore, we used that data for our analysis. From all cell types identified in the Tabula Muris dataset, we selected cells from tissues that are strongly innervated by DRG neurons and identified 42 component cell types likely to interact directly with DRG-derived nerve endings and used these in our analysis. Details of the tissues and cell types found in the Tabula Muris dataset, and which ones we chose for analysis in this work are located in data file S7.
scRNA-seq data from the mDRG (12) was used to generate the transcriptome profile of individual cell-types within DRG. Expression values and metadata for each subpopulation of component cells provided in databases (L5_All.agg.loom) created by the original publication was used in our analysis. Neurofilaments (NF1–3), non-peptidergic neurons (NP1–6), peptidergic neurons (PEP1–8), satellite glial cells (SATG1–2), and Schwann cells (SCHW) cell-types from DRG tissue were selected for analysis. These were further grouped as described in the results section.
Previously published RiboTag RNA-seq data of enteric glial cells from colon tissue was used (18). In this study, colonic inflammation was used to study how the active translatome of enteric glia changes with inflammation. The RiboTag procedure driven by Sox10-cre was used to generate enteric glia translatomes in vehicle treated and colonic inflammation conditions. In turn, this was used to generate the interactome between colonic sensory neurons (details below) and enteric glia. Raw sequencing data were provided by the authors of the original paper, and mapped to gencode vM16 mouse genome annotation (94) and quantified using STAR 2.6.1c (95, 96). Read counts per gene per sample were provided as output by STAR and suitably normalized and used in downstream analysis.
Previously published scRNA-seq of mDRG neurons retrogradely traced from colon (97) were used in the interactome analysis for colonic inflammation. Read counts per gene per cell, as well as cell-type labels (based on clustering) and gene marker information for cell-types were provided by the authors.
Human RNA-seq resources
Human DRG tissue samples, previously sequenced using bulk RNA-seq and analyzed by our laboratory (14, 19), were used for quantifying the transcriptome profile of hDRG. Normalized read counts per gene [as transcripts per million (TPMs)] reported in those papers were used in the analysis here.
We analyzed data from Kuo et al. (16), who obtained scRNA-seq data from 940 human synovial CD14+ cells, enriched in macrophages, isolated from patients with rheumatoid arthritis (RA) and osteoarthritis (OA), to build the RA- and OA-associated interactomes. The original scRNA-seq data provided as read counts per gene per cell in the original publication and clustering-based cell-type labels for each cell were used. Based on the Kuo et al. study (16), one cell cluster was enriched in RA samples when compared with OA samples (RA-enriched macrophages). Conversely, a second cluster was enriched in OA patients when compared to RA patients (OA-enriched macrophages). These two cell types were picked for the interactome analysis to compare macrophages from RA patients versus macrophages from OA patients.
Pancreatic cancer tissue bulk RNA-seq data was acquired from The Cancer Genome Atlas (TCGA) database (20). Samples from individuals that had matched healthy and cancerous pancreatic tissue were used for analysis in this paper. There was a total of four pairs of samples in TCGA pancreatic cancer database that fit the criteria and all pairs were used. TCGA database provides normalized read counts per gene (as FPKMs), which was used for downstream analysis.
Reference annotation for receptor and ligand pairs
Ramilowski et al. (25) identified 2557 pairs of ligand-receptor interactions that were used as the basis for generating the full database of ligand-receptor pairs used here. To curate a more complete list of ligand- and receptor-like interactions, we manually curated and incremented this database as follows: Additional genes whose products are ligands and receptors were identified from gene annotation databases, like the HUGO (28) and AMIGO (30) databases, as well as the literature. Their corresponding signaling interaction partners were identified from the literature and an existing database (27).
It is to be noted that not all ligand-receptor pair interactions are directly encoded in the genome so we added enzymes that are known to synthesize ligands to the ligand database and paired these with receptors for the synthesized ligand. Some interactions between proteins found at the surface of cells do not have a clear ligand-receptor relationship, for instance in some extracellular matrix and cell adhesion protein interactions. In these cases, if one of the pair was expressed in the DRG (transcriptionally), the corresponding gene was included in the receptor database, and its interacting protein partner’s gene name was included in the ligand database. The COMPARTMENT database (26) and literature was additionally used to filter out ligand-side proteins that are not known to be secreted or localized in the extracellular matrix.
Gene annotations for cell adhesion molecules (CAM), G protein-coupled receptor (GPCR), growth factor, ion channels, neuropeptides, nuclear receptors, and receptor kinases obtained from the literature, the human HUGO (28) and human and mouse AMIGO (30) databases, were used to additionally populate our database on top of the Ramilowski et al. (25) protein interaction lists. A total of 3098 pairs of ligand-receptor interactions are used in our interactome analysis (entire list shown in data file S8).
Gene relative abundance normalization
RNA-seq read counts per gene are typically normalized for gene length and whole-transcriptome coverage to quantify relative abundance of transcripts for each gene. We used several different normalization strategies based on the public availability of read counts and normalized data, and what was the most appropriate normalization in the context of the analysis. While there is some heterogeneity in normalization procedures across RNA-seq datasets we analyzed, within each dataset normalization was performed consistently using a single approach.
Gene abundances for the human pancreatic cancer samples in Fragments per Kilobase per Million Mapped Fragments (FPKM, obtained from the TCGA website), and RNA-seq data for human DRG samples in transcripts per million (TPM, obtained from the original paper) were used for downstream analysis. However, some of the RNA-seq datasets used in this paper were obtained as read counts per gene per sample (for bulk RNA-seq) or per cell (for scRNA-seq); thus, we normalized these using standard approaches (98). Since we did not explicitly compare expression levels across different genes, normalization by gene length was not performed as it does not influence our analysis. We calculated Reads per Million Mapped Reads (RPM) for bulk RNA-seq and for scRNA-seq datasets that had lower transcriptome coverage, upper decile normalized RPM (udRPM) were used to normalize sequencing depth while accounting for coverage differences across multiple samples in low sequencing depth situations (like scRNA-seq). RPM and udRPM of a gene were calculated with the following formulas:
where Rgene stands for the read counts for a specific gene, Σgene Rgene stands for the read count sum of all genes.
Interactome identification
Interactomes were predicted for ordered pairs of relevant tissues or cell types. Based on the biological context, we identified ligand-to-receptor signaling from one tissue or cell type to the other (unidirectional), or from each tissue or cell type to the other (bidirectional). The first step in building the interactome was to overlay ligand-encoding gene expression levels in all samples, cells in the tissue, or cell type wherein we investigate the upstream component of the signaling, and to similarly overlay the receptor-encoding gene expression levels in the tissue or cell type wherein we investigate the downstream component. Depending on the data available and the question being asked in each of our case studies, the interactions were then ranked based on ligand-side or receptor-side criteria (like degree of differential expression, specificity of expression in that tissue or cell type) and filtered out if the gene expression was not consistently detectable across biological replicates. Our approach uses gene expression levels as a surrogate for protein abundance levels, due to the difficulty of generating high-throughput, high signal-to-noise ratio protein abundance data.
Identification of cell-type restricted gene expression patterns in mouse scRNA-seq datasets
The Tabula Muris dataset was specifically analyzed to identify gene co-expression modules that were not expressed ubiquitously across all 42 relevant cell types in the database but restricted to a subset of them. To identify gene modules that were enriched in different cell-types, a cell and gene bi-clustering was performed on the udRPM per gene per cell-type matrix generated in the for the 42 cell types. The scrattch.hicat package from the Allen Institute (37) was used to generate clusters to identify gene modules.
The udRPM matrix was first multiplied by 1000 (to limit the effect of adding a smoothing factor), and 1 was added to each element of the matrix before it was log2-tranformed. Such a log-transformed matrix is an approximation of the qualitative expression patterns of different genes across all 42 cell types.
We performed hierarchical clustering through a top-down approach, identifying a total of 8189 genes that were generically expressed across all pre-identified cell types in the first round, which were labelled as ubiquitously expressed and set aside from the clustering. In the next round of clustering, another 5117 genes were identified to have low to no expression across all cell types and were excluded from the analysis. Distinct clusters of cell-types and gene modules were identified in the final round of clustering, and genes from these co-expression modules that were restricted in expression to a subset of the cell-types were used to characterize a “cell-type enriched” interactome. The parameters for each round of clustering are listed in data file S9.
Criteria for a gene to be considered detectable in a given cell type
Ligands and/or receptors were filtered in some of the interactomes for our case studies on the basis of whether reads were consistently detectable in biological replicates for one (or more) groups. Because scRNA-seq data usually have low sequencing depth per cell, trinarization scores were used to estimate if a gene is expressed in a particular cell type. Briefly, the trinarization score, described previously by Zeisel et al. (12), is a formulation of the posterior probability whether a gene is detected in a cell type. The parameters used here in the calculation of the trinarization score were: f = 0.05, α = 1.5, and β = 2. Genes with probability P > 0.95 were considered expressed.
Criteria for identifying differential expression of gene relative abundance
Additionally, ligand and receptor genes are ranked by degree of differential expression in interactomes of some of our case studies. While traditional statistical hypothesis testing is the norm for identifying differential expression, in experimental setups involving limited replication, differential expression analysis can be performed using related statistics like the Strictly Standardized Mean Difference or Bhattacharyya Distance, which take both between and within group variance into account when ranking genes by differential expression.
The strictly standardized mean difference (SSMD) (99, 100) was used to characterize the difference in means of two groups, controlled by within-group variability, and was used to estimate effect size between 2 different groups under comparison, using the following formula:
where in a particular gene, for two groups p and q, σ2 stands for the variance and μ stands for mean of the gene expression levels across libraries for each group in question (represented by a subscript).
The Bhattacharyya distance (90, 101) was used to calculate the similarity of the probability distributions of scRNA-seq data from 2 different conditions using the following formula. The related Bhattacharyya Coefficient (derived from the Bhattacharyya Distance DB) was used to calculate the amount of overlap in the area under the curve of the two sample distributions being compared:
In this formula D stands for distance, p and q stands for gene expression level across all cells in the first condition and second condition respectively, σ stands for standard deviation and μ stands for mean. Genes with a distance > 0.3 between 2 conditions of scRNA-seq were considered differentially expressed.
Interactome analysis methodological details for case studies
For analysis of the publicly available mouse scRNA-seq datasets, interactome analysis was performed between 42 cell types in tissues innervated by the DRG identified in the Tabula Muris dataset (10) and three broad classes of mDRG sensory neurons (top-level subpopulations of PEP, NP and NF neurons, obtained by merging all subcategories under them on the basis of hierarchical clustering) from the mDRG scRNA-seq study by Zeisel et al. (12). For each of the 42 Tabula Muris cell-types and the three mDRG subpopulations from mousebrain.org, individual cells in these subcategories were pooled and summed per-gene read counts were normalized to udRPM to obtain a single value for each gene’s relative expression in each cell type.
Additionally, based on the biclustering of genes and cell types of the Tabula Muris dataset, 25 co-expression modules were identified that showed restricted expression across 18 classes of cell types over the 42 constituent cell types in Tabula Muris. Interactome analysis was then performed for each of the 42 Tabula Maris cell types to each of the 3 mouse sensory neuronal cell types. Finally, interactomes were built using the set of genes present in the 25 gene co-expression modules having cell type restricted expression in Tabula Muris to the three sensory neuronal subpopulations.
Interactomes were then filtered by the receptor gene expression level in DRG sensory neurons. Ligand-receptor interactions with receptor expression level < 0.001 udRPM across all three types of sensory neurons (PEP, NF, and NP) were excluded from the results.
GO term analysis was performed on the ligand and receptor genes for the individual interactomes using Enrichr (31, 32) and the top 5 (ranked by adjusted p-value) GO terms for GO biological process and GO molecular function were collected and shown. Data sheets are presented in data file S1 and results are visualized in Fig. 1.
Bidirectional interactome between different cell types within the mDRG
scRNA-seq mouse neuronal and glial subpopulations in the DRG scRNA-seq data (12) were further pooled into five main groups on the basis of how similar their expression profiles were: Neurofilament (NF), non-peptidergic (NP), and peptidergic (PEP) sensory neurons, satellite glial cells (SATG), and Schwann cells (SCHW). The mean of the normalized expression values across the related subpopulations was used for the expression level of each merged group, and udRPMs were calculated. These were then used as the transcriptome profile of different cell types from the mDRG.
Interactome analysis on mDRG cell clusters was performed in two separate directions: ligands from neuronal cells (NF, NP, PEP) signaling to receptors on glial cells (SCHW, SATG), and vice versa. All identified ligand-receptor interactions were filtered by whether the ligands and receptors were both expressed at the mRNA level in at least one source cell type. The trinarization score was calculated to determine if a gene was to be considered expressed in a certain cell type (score > 0.95). Circle plots were generated to present these interactions using the Circos program (102) (Figs. 3 and 4), wherein each identified ligand and receptor interaction is represented on the plot. To better present how certain groups of ligands or receptors may interact with each other, the ligand-encoding and receptor-encoding genes on the circle plots were ordered by hierarchical bi-clustering (Euclidean distance, average distance between elements of two clusters used as representative distance between those clusters) of the ligand- and receptor-encoding genes based on their interactions with each other. Additionally, each gene was identified as expressed in NF, NP, PEP, SATG or SCHW, and marked as such on the plot.
Interactome between retrogradely traced colonic sensory neurons and enteric glial cells in a colitis model
For the transcriptome of retrogradely traced colonic sensory neurons (97), reads from all cells of the same cell-type were pooled together to generate the gene expression level per cell type (as RPM). The interactome was then generated between these seven cell-types and enteric glial cells after vehicle or DNBS treatment (18). Ligand-receptor interactions were filtered by the following criteria: ligand genes were required to be consistently expressed (> 0.01 RPM) in enteric glial cells across all replicates in at least one condition (vehicle- or DNBS-treated); ligand-encoding genes were considered to be altered by treatment when the ; and finally, receptor-encoding genes with trinarization score > 0.95. Putative interactions where the receptor genes were enriched in specific populations of colonic afferents are shown in Fig. 5. All ligand receptor interactions are provided in data file S4.
Interactome between macrophages enriched in human RA synovial tissue versus OA, and hDRG
The interactome was generated between RA- or OA-enriched macrophages (16), and human DRG (14). Predicted ligand-receptor interactions were filtered by the following criteria: (i) Ligand-encoding genes were required to be considered expressed in either RA-enriched macrophages or OA-enriched macrophages using the trinarization score > 0.95; (ii) Ligand-encoding genes were considered substantially differentially expressed between RA enriched macrophages and OA enriched macrophages, using Bhattacharyya distance > 0.3; and (iii) Receptor genes were required to be consistently expressed (> 0.1 TPM) in all 3 human DRG samples. Interactions where the ligand genes were highly expressed in RA enriched macrophages are presented in Fig. 6; the interactions with ligand-encoding genes highly expressed in OA-enriched macrophages are provided in sheets 1 and 2 of data file S5.
Interactome between human pancreatic cancer tissue and human DRG
The interactome was generated between four paired healthy and cancer tissue samples from pancreatic cancer patients (TCGA) and hDRG samples (14). Ligand-receptor interactions were filtered by the following criteria: (i) Ligand genes were considered significantly increased in pancreatic cancer samples vs healthy samples by statistical testing (paired Student’s t-test, p-value < 0.05), since the low sample size (four pairs) does not allow us to stringently perform multiple testing p-value correction, an additional criteria was imposed that direction of change in ligand gene abundance had to be consistent for all four pairs of samples; (ii) Receptor genes were required to be consistently expressed (> 0.1 TPM) in all three hDRG samples. All interactions that met the filtering criteria are presented in Figs. 7 and 8.
Animals
All animal protocols were approved by the University of Texas at Dallas Institutional Animal Care and Use Committee and were consistent with the NIH Guide. Mice were kept on a 12-hour light-dark cycle with food and water provided ad libitum. Both C57BL/6 and ICR mice were bred at The University of Texas at Dallas.
Experimental Reagents
Recombinant human HBEGF (259-HE) was purchased from R&D Systems and reconstituted to 50 μg/ml in 0.1% BSA. For hind paw injections, stock HBEGF was diluted in 0.9% saline to 5 ng/ul. Hind paw injections (10 μl) were done with a 30G needle (305106; BD Biosciences) and glass gastight syringe (80901; Hamilton Co.).
Behavioral methods
Male ICR mice and female C57BL/6 mice (7 to 9 weeks old) were used for behavioral experiments, and experimenters were blinded to treatment. Mice were habituated to acrylic (behavior boxes 11.4×7.6×7.6 cm) with a wire mesh bottom (1 cm2) prior to experiments. Hind paw mechanical withdrawal thresholds were determined using calibrated von Frey filaments (Stoelting Co.) and the up-down method (103). As a measure of spontaneous pain, mouse grimace scale (MGS) scores were determined by observation of facial action units as described by Langford et al. (104). Facial action unit intensity ratings were averaged to yield a MGS score for each mouse at each time point.
DRG cultures
The neuronal cultures used in the calcium imaging, DRG’s (Dorsal Root Ganglion) were dissected from adult male and female C57BL/6 mice and suspended in Hank’s Balanced Salt Solution without calcium or magnesium before culturing. The DRG’s were then enzymatically digested using collagenase A and collagenase D (each 1 mg/ml, from Roche) with papain (30 units/ml) for 20 min at 37°C. Following this ganglion were suspended and triturated in 1ml HBSS. The solution was passed through a 70μm cell strainer for the removal of debris. The cells were then resuspended in DMEM/F12/GlutaMAX (Gibco) culture media nourished with 10% fetal bovine serum (FBS; SH30088.03; Hyclone) and 1% penicillin/streptomycin (Pen-Strep; 15070-063; Gibco). Cells were plated on pre-coated poly-D-lysine dishes (P35GC-1.5-10-C; MatTek) which were additionally coated with laminin (L2020; Sigma). The plated cells were then kept undisturbed in an incubator for 2 hours to allow them to adhere. The cells were then supplemented with the same culture media as described above but with the addition of 10 ng/ml nerve growth factor (NGF; 01–125; Millipore) and 3 ug/ml 5-fluoro-2′-deoxyuridine + 7 ug/ml uridine (FRD+U; Sigma). Finally, the cells were kept in an incubator with 5% CO2 and maintained at 37 °C for 48 hours before use.
Ca2+ imaging
The cultures prepared and plated as described previously remained undisturbed in the incubator for 48 hours after plating. Cells were then loaded with 1 μg/μl Fura 2 AM (108964-32-5; Life Technologies) for 1 hour. In the case of the experiments performed with the Lapatinib (6nM, Tocris, 6811) the cells were incubated in the drug 30 mins before loading with Fura 2 AM. After the incubation period the Fura 2 AM solution was replaced with normal bath solution (135 mM NaCl, 5 mM KCl, 10 mM HEPES, 1 M CaCl2, 1 M MgCl2 and 2 M glucose, adjusted to pH 7.4 with N-methyl-glucamine, the osmolarity of 300±5 mOsm). After a 30-minute incubation in the bath, the cells were then treated with 10 ng/ml solution of HBEGF for 10 minutes (105). The recordings were done using an Olympus IX73 inverted microscope at 40X magnification and the MetaFluor Fluorescence Ratio Imaging Software. The cells that exhibited a 20% ratiometric change (340 nm/380 nm) in Ca2+ levels when subjected to KCl treatment were classified as neurons. From there, the neurons that exhibited a 40% ratiometric change in response to HBEGF treatment were considered as responsive.
Statistical analysis
Computational analysis was performed using Matlab and MS Excel, and plots were made using Matlab and Prism GraphPad. Identification of differentially expressed genes were performed using strictly standardized mean differences, and the Bhattacharyya distance. Presence or absence of gene expression in specific cell populations were estimated using the trinarization score, by estimating the posterior distribution using a beta prior on Bernoulli trials (outcome determined by whether or not a gene is detected in individual cells of the population). Details of RNA-seq quantification and testing are present in the associated methods section. Differences in time series for Ca2+ concentration were tested using the Chi-square test. For testing behavioral responses at different times, two-way ANOVA (for different times and treatment regimes) was performed, with Bonferroni post-test correction. Differences in effect size were tested using t-tests.
Supplementary Material
Data file S1: Ligand-receptor interactions in mDRG sensory neurons and each of the 42 cell types in mDRG-innervated tissues from Tabula Muris, along with gene ontology annotations.
Data file S2: Ligand-receptor interactions in mDRG sensory neurons and subsets of 42 cell types in mDRG-innervated tissues from Tabula Muris, for ligands with cell-type-restricted expression.
Data file S3: DRG-localized ligand-receptor interaction pairs between mDRG neurons and glial cells.
Data file S4: Ligand-receptor interactions in differentially expressed ligand genes in DNBS-treated enteric glia, and paired receptors in thoracolumbar or lumbosacral mDRG neurons.
Data file S5: Ligand-receptor interaction pairs in OA and RA macrophages and hDRG-expressed receptors.
Data file S6: Ligand-receptor interaction pairs in ligand genes differentially expressed in pancreatic tumors, and hDRG-expressed receptors.
Data file S7: Cell types and number of cells from Tabula Muris used for downstream analysis.
Data file S8: Complete ligand-receptor interaction database underlying the interactome prediction framework.
Data file S9: Parameters for hierarchical clustering of gene expression patterns in Tabula Muris cell types using scrattch.hicat.
Figure S1: A full interactome for ligand-receptor mediated interactions from neurons to glial cells within the mDRG.
Figure S2: A full interactome for ligand-receptor mediated interactions from glial cells to neurons within the mDRG.
Acknowledgements:
The authors would like to thank Drs. James Hockley and Ewan St. John Smith for help with the colonic single neuron sequencing data, Dr. Brian Gulbransen and lab for help with the enteric glia TRAP data and Dr. Zhenyu Xuan for clarifying TCGA metadata formats. We thank all the authors of the papers from which we used their sequencing data for their exemplary transparency in sharing the details of their work with us.
Funding:
NIH grants NS113457 (CP), NS065926 (TJP) and NS102161 (TJP).
Footnotes
Competing interests: AW, CP, GD, PRR and TJP are founders of Doloromics.
Data and materials availability: Meta-analysis for this project was performed on publicly available RNA-seq datasets, as cited; no new RNA-seq datasets were generated for this study. All other data needed to evaluate the conclusions in the paper are present in the paper or the Supplementary Materials. The authors have filed a patent on the interactome algorithm through the University of Texas at Dallas.
References and Notes
- 1.Basbaum AI, Bautista DM, Scherrer G, Julius D, Cellular and molecular mechanisms of pain. Cell 139, 267–284 (2009); published online EpubOct 16 ( 10.1016/j.cell.2009.09.028). [DOI] [PMC free article] [PubMed] [Google Scholar]
- 2.Woolf CJ, Ma Q, Nociceptors--noxious stimulus detectors. Neuron 55, 353–364 (2007); published online EpubAug 2 ( 10.1016/j.neuron.2007.07.016). [DOI] [PubMed] [Google Scholar]
- 3.Dubin AE, Patapoutian A, Nociceptors: the sensors of the pain pathway. J Clin Invest 120, 3760–3772 (2010); published online EpubNov ( 10.1172/JCI42843). [DOI] [PMC free article] [PubMed] [Google Scholar]
- 4.Bennett DL, Woods CG, Painful and painless channelopathies. Lancet Neurol 13, 587–599 (2014); published online EpubJun ( 10.1016/S1474-4422(14)70024-9). [DOI] [PubMed] [Google Scholar]
- 5.Walters ET, Adaptive mechanisms driving maladaptive pain: how chronic ongoing activity in primary nociceptors can enhance evolutionary fitness after severe injury. Philos Trans R Soc Lond B Biol Sci 374, 20190277 (2019); published online EpubNov 11 ( 10.1098/rstb.2019.0277). [DOI] [PMC free article] [PubMed] [Google Scholar]
- 6.Reichling DB, Levine JD, Critical role of nociceptor plasticity in chronic pain. Trends Neurosci 32, 611–618 (2009); published online EpubDec ( 10.1016/j.tins.2009.07.007). [DOI] [PMC free article] [PubMed] [Google Scholar]
- 7.Denk F, McMahon SB, Tracey I, Pain vulnerability: a neurobiological perspective. Nat Neurosci 17, 192–200 (2014); published online EpubFeb ( 10.1038/nn.3628). [DOI] [PubMed] [Google Scholar]
- 8.Price TJ, Inyang KE, Commonalities between pain and memory mechanisms and their meaning for understanding chronic pain. Prog Mol Biol Transl Sci 131, 409–434 (2015) 10.1016/bs.pmbts.2014.11.010). [DOI] [PMC free article] [PubMed] [Google Scholar]
- 9.Price TJ, Gold MS, From Mechanism to Cure: Renewing the Goal to Eliminate the Disease of Pain. Pain medicine 19, 1525–1549 (2018); published online EpubAug 1 ( 10.1093/pm/pnx108). [DOI] [PMC free article] [PubMed] [Google Scholar]
- 10.Schaum N, Karkanias J, Neff NF, May AP, Quake SR, Wyss-Coray T, Darmanis S, Batson J, Botvinnik O, Chen MB, Chen S, Green F, Jones RC, Maynard A, Penland L, Pisco AO, Sit RV, Stanley GM, Webber JT, Zanini F, Baghel AS, Bakerman I, Bansal I, Berdnik D, Bilen B, Brownfield D, Cain C, Cho M, Cirolia G, Conley SD, Demers A, Demir K, Morree A, Divita T, Bois H, Dulgeroff LBT, Ebadi H, Espinoza FH, Fish M, Gan Q, George BM, Gillich A, Genetiano G, Gu X, Gulati GS, Hang Y, Hosseinzadeh S, Huang A, Iram T, Isobe T, Ives F, Kao KS, Karnam G, Kershner AM, Kiss BM, Kong W, Kumar ME, Lam JY, Lee DP, Lee SE, Li G, Li Q, Liu L, Lo A, Lu WJ, Manjunath A, May KL, May OL, Mckay M, Metzger RJ, Mignardi M, Min D, Nabhan AN, Ng KM, Noh J, Patkar R, Peng WC, Puccinelli R, Sikandar SS, Sinha R, Szade K, Tan W, Tato C, Tellez K, Travaglini KJ, Tropini C, Waldburger L, Weele LJ, Wosczyna MN, Xiang J, Xue S, Youngyunpipatkul J, Zardeneta ME, Zhang F, Zhou L, Castro P, Croote D, DeRisi JL, Kuo CS, Lehallier B, Nguyen PK, Tan SY, Wang BM, Yousef H, Wyss-Coray T, Beachy PA, Chan CKF, Wang BM, Weinberg K, Wu SM, Yousef H, Barres BA, Chan CKF, Clarke MF, Huang KC, Kim SK, Krasnow MA, Nusse R, Rando TA, Sonnenburg J, Weissman IL, Wu SM, Consortium TM, Single-cell transcriptomics of 20 mouse organs creates a Tabula Muris. Nature 562, 367.-+ (2018); published online EpubOct 18 ( 10.1038/s41586-018-0590-4). [DOI] [PMC free article] [PubMed] [Google Scholar]
- 11.Usoskin D, Furlan A, Islam S, Abdo H, Lonnerberg P, Lou D, Hjerling-Leffler J, Haeggstrom J, Kharchenko O, Kharchenko PV, Linnarsson S, Ernfors P, Unbiased classification of sensory neuron types by large-scale single-cell RNA sequencing. Nat Neurosci 18, 145–153 (2015); published online EpubJan ( 10.1038/nn.3881). [DOI] [PubMed] [Google Scholar]
- 12.Zeisel A, Hochgerner H, Lonnerberg P, Johnsson A, Memic F, van der Zwan J, Haring M, Braun E, Borm LE, La Manno G, Codeluppi S, Furlan A, Lee K, Skene N, Harris KD, Hjerling-Leffler J, Arenas E, Ernfors P, Marklund U, Linnarsson S, Molecular Architecture of the Mouse Nervous System. Cell 174, 999–1014.e1022 (2018); published online EpubAug 9 ( 10.1016/j.cell.2018.06.021). [DOI] [PMC free article] [PubMed] [Google Scholar]
- 13.Mele M, Ferreira PG, Reverter F, DeLuca DS, Monlong J, Sammeth M, Young TR, Goldmann JM, Pervouchine DD, Sullivan TJ, Johnson R, Segre AV, Djebali S, Niarchou A, Consortium GT, Wright FA, Lappalainen T, Calvo M, Getz G, Dermitzakis ET, Ardlie KG, Guigo R, Human genomics. The human transcriptome across tissues and individuals. Science 348, 660–665 (2015); published online EpubMay 8 ( 10.1126/science.aaa0355). [DOI] [PMC free article] [PubMed] [Google Scholar]
- 14.Ray P, Torck A, Quigley L, Wangzhou A, Neiman M, Rao C, Lam T, Kim JY, Kim TH, Zhang MQ, Dussor G, Price TJ, Comparative transcriptome profiling of the human and mouse dorsal root ganglia: an RNA-seq-based resource for pain and sensory neuroscience research. Pain 159, 1325–1345 (2018); published online EpubJul ( 10.1097/j.pain.0000000000001217). [DOI] [PMC free article] [PubMed] [Google Scholar]
- 15.Roy AL, Conroy R, Smith J, Yao Y, Beckel-Mitchener AC, Anderson JM, Wilder EL, Accelerating a paradigm shift: The Common Fund Single Cell Analysis Program. Sci Adv 4, eaat8573 (2018); published online EpubAug ( 10.1126/sciadv.aat8573). [DOI] [PMC free article] [PubMed] [Google Scholar]
- 16.Kuo D, Ding J, Cohn IS, Zhang F, Wei K, Rao DA, Rozo C, Sokhi UK, Shanaj S, Oliver DJ, Echeverria AP, DiCarlo EF, Brenner MB, Bykerk VP, Goodman SM, Raychaudhuri S, Ratsch G, Ivashkiv LB, Donlin LT, HBEGF(+) macrophages in rheumatoid arthritis induce fibroblast invasiveness. Sci Transl Med 11, (2019); published online EpubMay 8 ( 10.1126/scitranslmed.aau8587). [DOI] [PMC free article] [PubMed] [Google Scholar]
- 17.Hockley JRF, Taylor TS, Callejo G, Wilbrey AL, Gutteridge A, Bach K, Winchester WJ, Bulmer DC, McMurray G, Smith ESJ, Single-cell RNAseq reveals seven classes of colonic sensory neuron. Gut, (2018); published online EpubFeb 26 ( 10.1136/gutjnl-2017-315631). [DOI] [PMC free article] [PubMed] [Google Scholar]
- 18.Delvalle NM, Dharshika C, Morales-Soto W, Fried DE, Gaudette L, Gulbransen BD, Communication Between Enteric Neurons, Glia, and Nociceptors Underlies the Effects of Tachykinins on Neuroinflammation. Cell Mol Gastroenterol Hepatol 6, 321–344 (2018) 10.1016/j.jcmgh.2018.05.009). [DOI] [PMC free article] [PubMed] [Google Scholar]
- 19.North RY, Li Y, Ray P, Rhines LD, Tatsui CE, Rao G, Johansson CA, Zhang H, Kim YH, Zhang B, Dussor G, Kim TH, Price TJ, Dougherty PM, Electrophysiological and transcriptomic correlates of neuropathic pain in human dorsal root ganglion neurons. Brain 142, 1215–1226 (2019); published online EpubMay 1 ( 10.1093/brain/awz063). [DOI] [PMC free article] [PubMed] [Google Scholar]
- 20.Tomczak K, Czerwinska P, Wiznerowicz M, The Cancer Genome Atlas (TCGA): an immeasurable source of knowledge. Contemp Oncol (Pozn) 19, A68–77 (2015) 10.5114/wo.2014.47136). [DOI] [PMC free article] [PubMed] [Google Scholar]
- 21.Kersten C, Cameron MG, Mjaland S, Epithelial growth factor receptor (EGFR)-inhibition for relief of neuropathic pain-A case series. Scand J Pain 4, 3–7 (2013); published online EpubJan 1 ( 10.1016/j.sjpain.2012.11.011). [DOI] [PubMed] [Google Scholar]
- 22.Kersten C, Cameron MG, Laird B, Mjaland S, Epidermal growth factor receptor-inhibition (EGFR-I) in the treatment of neuropathic pain. Br J Anaesth 115, 761–767 (2015); published online EpubNov ( 10.1093/bja/aev326). [DOI] [PubMed] [Google Scholar]
- 23.Martin LJ, Smith SB, Khoutorsky A, Magnussen CA, Samoshkin A, Sorge RE, Cho C, Yosefpour N, Sivaselvachandran S, Tohyama S, Cole T, Khuong TM, Mir E, Gibson DG, Wieskopf JS, Sotocinal SG, Austin JS, Meloto CB, Gitt JH, Gkogkas C, Sonenberg N, Greenspan JD, Fillingim RB, Ohrbach R, Slade GD, Knott C, Dubner R, Nackley AG, Ribeiro-da-Silva A, Neely GG, Maixner W, Zaykin DV, Mogil JS, Diatchenko L, Epiregulin and EGFR interactions are involved in pain processing. J Clin Invest 127, 3353–3366 (2017); published online EpubSep 01 ( 10.1172/JCI87406). [DOI] [PMC free article] [PubMed] [Google Scholar]
- 24.Kersten C, Cameron MG, Bailey AG, Fallon MT, Laird BJ, Paterson V, Mitchell R, Fleetwood-Walker SM, Daly F, Mjaland S, Relief of Neuropathic Pain Through Epidermal Growth Factor Receptor Inhibition: A Randomized Proof-of-Concept Trial. Pain medicine 20, 2495–2505 (2019); published online EpubDec 1 ( 10.1093/pm/pnz101). [DOI] [PubMed] [Google Scholar]
- 25.Ramilowski JA, Goldberg T, Harshbarger J, Kloppman E, Lizio M, Satagopam VP, Itoh M, Kawaji H, Carninci P, Rost B, Forrest ARR, A draft network of ligand-receptor-mediated multicellular signalling in human. Nature Communications 6, (2015); published online EpubJul (ARTN 7866 10.1038/ncomms8866). [DOI] [PMC free article] [PubMed] [Google Scholar]
- 26.Binder JX, Pletscher-Frankild S, Tsafou K, Stolte C, O’Donoghue SI, Schneider R, Jensen LJ, COMPARTMENTS: unification and visualization of protein subcellular localization evidence. Database-Oxford, (2014); published online EpubFeb 25 (ARTN bau012 10.1093/database/bau012). [DOI] [PMC free article] [PubMed] [Google Scholar]
- 27.Szklarczyk D, Gable AL, Lyon D, Junge A, Wyder S, Huerta-Cepas J, Simonovic M, Doncheva NT, Morris JH, Bork P, Jensen LJ, Mering CV, STRING v11: protein-protein association networks with increased coverage, supporting functional discovery in genome-wide experimental datasets. Nucleic Acids Res 47, D607–D613 (2019); published online EpubJan 8 ( 10.1093/nar/gky1131). [DOI] [PMC free article] [PubMed] [Google Scholar]
- 28.Yates B, Braschi B, Gray KA, Seal RL, Tweedie S, Bruford EA, Genenames.org: the HGNC and VGNC resources in 2017. Nucleic Acids Res 45, D619–D625 (2017); published online EpubJan 4 ( 10.1093/nar/gkw1033). [DOI] [PMC free article] [PubMed] [Google Scholar]
- 29.Braschi B, Denny P, Gray K, Jones T, Seal R, Tweedie S, Yates B, Bruford E, Genenames.org: the HGNC and VGNC resources in 2019. Nucleic Acids Res 47, D786–D792 (2019); published online EpubJan 8 ( 10.1093/nar/gky930). [DOI] [PMC free article] [PubMed] [Google Scholar]
- 30.Carbon S, Ireland A, Mungall CJ, Shu S, Marshall B, Lewis S, Ami GOH, Web Presence Working G, AmiGO: online access to ontology and annotation data. Bioinformatics 25, 288–289 (2009); published online EpubJan 15 ( 10.1093/bioinformatics/btn615). [DOI] [PMC free article] [PubMed] [Google Scholar]
- 31.Chen EY, Tan CM, Kou Y, Duan QN, Wang ZC, Meirelles GV, Clark NR, Ma’ayan A, Enrichr: interactive and collaborative HTML5 gene list enrichment analysis tool. Bmc Bioinformatics 14, (2013); published online EpubApr 15 (Artn 128 10.1186/1471-2105-14-128). [DOI] [PMC free article] [PubMed] [Google Scholar]
- 32.Kuleshov MV, Jones MR, Rouillard AD, Fernandez NF, Duan QN, Wang ZC, Koplev S, Jenkins SL, Jagodnik KM, Lachmann A, McDermott MG, Monteiro CD, Gundersen GW, Ma’ayan A, Enrichr: a comprehensive gene set enrichment analysis web server 2016 update. Nucleic Acids Res 44, W90–W97 (2016); published online EpubJul 8 ( 10.1093/nar/gkw377). [DOI] [PMC free article] [PubMed] [Google Scholar]
- 33.Ji RR, Gereau R. W. t., Malcangio M, Strichartz GR, MAP kinase and pain. Brain Res Rev 60, 135–148 (2009); published online EpubApr (S0165–0173(08)00149–5 [pii] 10.1016/j.brainresrev.2008.12.011). [DOI] [PMC free article] [PubMed] [Google Scholar]
- 34.Moy JK, Khoutorsky A, Asiedu MN, Black BJ, Kuhn JL, Barragan-Iglesias P, Megat S, Burton MD, Burgos-Vega CC, Melemedjian OK, Boitano S, Vagner J, Gkogkas CG, Pancrazio JJ, Mogil JS, Dussor G, Sonenberg N, Price TJ, The MNK-eIF4E Signaling Axis Contributes to Injury-Induced Nociceptive Plasticity and the Development of Chronic Pain. J Neurosci 37, 7481–7499 (2017); published online EpubAug 02 ( 10.1523/JNEUROSCI.0220-17.2017). [DOI] [PMC free article] [PubMed] [Google Scholar]
- 35.Dina OA, McCarter GC, de Coupade C, Levine JD, Role of the sensory neuron cytoskeleton in second messenger signaling for inflammatory pain. Neuron 39, 613–624 (2003); published online EpubAug 14 ( [DOI] [PubMed] [Google Scholar]
- 36.Zhuang ZY, Xu H, Clapham DE, Ji RR, Phosphatidylinositol 3-kinase activates ERK in primary sensory neurons and mediates inflammatory heat hyperalgesia through TRPV1 sensitization. J Neurosci 24, 8300–8309 (2004); published online EpubSep 22 ( 10.1523/JNEUROSCI.2893-04.2004 24/38/8300 [pii]). [DOI] [PMC free article] [PubMed] [Google Scholar]
- 37.Tasic B, Yao Z, Graybuck LT, Smith KA, Nguyen TN, Bertagnolli D, Goldy J, Garren E, Economo MN, Viswanathan S, Penn O, Bakken T, Menon V, Miller J, Fong O, Hirokawa KE, Lathia K, Rimorin C, Tieu M, Larsen R, Casper T, Barkan E, Kroll M, Parry S, Shapovalova NV, Hirschstein D, Pendergraft J, Sullivan HA, Kim TK, Szafer A, Dee N, Groblewski P, Wickersham I, Cetin A, Harris JA, Levi BP, Sunkin SM, Madisen L, Daigle TL, Looger L, Bernard A, Phillips J, Lein E, Hawrylycz M, Svoboda K, Jones AR, Koch C, Zeng H, Shared and distinct transcriptomic cell types across neocortical areas. Nature 563, 72–78 (2018); published online EpubNov ( 10.1038/s41586-018-0654-5). [DOI] [PMC free article] [PubMed] [Google Scholar]
- 38.Sorge RE, Mapplebeck JC, Rosen S, Beggs S, Taves S, Alexander JK, Martin LJ, Austin JS, Sotocinal SG, Chen D, Yang M, Shi XQ, Huang H, Pillon NJ, Bilan PJ, Tu Y, Klip A, Ji RR, Zhang J, Salter MW, Mogil JS, Different immune cells mediate mechanical pain hypersensitivity in male and female mice. Nat Neurosci 18, 1081–1083 (2015); published online EpubAug ( 10.1038/nn.4053). [DOI] [PMC free article] [PubMed] [Google Scholar]
- 39.Rosen SF, Ham B, Haichin M, Walters IC, Tohyama S, Sotocinal SG, Mogil JS, Increased pain sensitivity and decreased opioid analgesia in T-cell-deficient mice and implications for sex differences. Pain 160, 358–366 (2019); published online EpubFeb ( 10.1097/j.pain.0000000000001420). [DOI] [PubMed] [Google Scholar]
- 40.Yu X, Liu H, Hamel KA, Morvan MG, Yu S, Leff J, Guan Z, Braz JM, Basbaum AI, Dorsal root ganglion macrophages contribute to both the initiation and persistence of neuropathic pain. Nat Commun 11, 264 (2020); published online EpubJan 14 ( 10.1038/s41467-019-13839-2). [DOI] [PMC free article] [PubMed] [Google Scholar]
- 41.Davies AJ, Kim HW, Gonzalez-Cano R, Choi J, Back SK, Roh SE, Johnson E, Gabriac M, Kim MS, Lee J, Lee JE, Kim YS, Bae YC, Kim SJ, Lee KM, Na HS, Riva P, Latremoliere A, Rinaldi S, Ugolini S, Costigan M, Oh SB, Natural Killer Cells Degenerate Intact Sensory Afferents following Nerve Injury. Cell 176, 716–728 e718 (2019); published online EpubFeb 7 ( 10.1016/j.cell.2018.12.022). [DOI] [PMC free article] [PubMed] [Google Scholar]
- 42.Willemen HL, Eijkelkamp N, Garza Carbajal A, Wang H, Mack M, Zijlstra J, Heijnen CJ, Kavelaars A, Monocytes/Macrophages control resolution of transient inflammatory pain. J Pain 15, 496–506 (2014); published online EpubMay ( 10.1016/j.jpain.2014.01.491). [DOI] [PMC free article] [PubMed] [Google Scholar]
- 43.Krukowski K, Eijkelkamp N, Laumet G, Hack CE, Li Y, Dougherty PM, Heijnen CJ, Kavelaars A, CD8+ T Cells and Endogenous IL-10 Are Required for Resolution of Chemotherapy-Induced Neuropathic Pain. J Neurosci 36, 11074–11083 (2016); published online EpubOct 26 ( 10.1523/JNEUROSCI.3708-15.2016). [DOI] [PMC free article] [PubMed] [Google Scholar]
- 44.Shubayev VI, Angert M, Dolkas J, Campana WM, Palenscar K, Myers RR, TNFalpha-induced MMP-9 promotes macrophage recruitment into injured peripheral nerve. Mol Cell Neurosci 31, 407–415 (2006); published online EpubMar ( 10.1016/j.mcn.2005.10.011). [DOI] [PMC free article] [PubMed] [Google Scholar]
- 45.Sweitzer SM, Colburn RW, Rutkowski M, DeLeo JA, Acute peripheral inflammation induces moderate glial activation and spinal IL-1beta expression that correlates with pain behavior in the rat. Brain Res 829, 209–221 (1999); published online EpubMay 22 ( 10.1016/s0006-8993(99)01326-8). [DOI] [PubMed] [Google Scholar]
- 46.Garza Carbajal A, Ebersberger A, Thiel A, Ferrari L, Acuna J, Brosig S, Isensee J, Moeller K, Siobal M, Rose‐John S, Oncostatin M induces hyperalgesic priming and amplifies signaling of cAMP to ERK by RapGEF2 and PKA. Journal of Neurochemistry, (2020). [DOI] [PubMed] [Google Scholar]
- 47.Grace PM, Hutchinson MR, Maier SF, Watkins LR, Pathological pain and the neuroimmune interface. Nat Rev Immunol 14, 217–231 (2014); published online EpubApr ( 10.1038/nri3621). [DOI] [PMC free article] [PubMed] [Google Scholar]
- 48.Goncalves NP, Vaegter CB, Pallesen LT, Peripheral Glial Cells in the Development of Diabetic Neuropathy. Front Neurol 9, 268 (2018) 10.3389/fneur.2018.00268). [DOI] [PMC free article] [PubMed] [Google Scholar]
- 49.Lemes JBP, de Campos Lima T, Santos DO, Neves AF, de Oliveira FS, Parada CA, da Cruz Lotufo CM, Participation of satellite glial cells of the dorsal root ganglia in acute nociception. Neurosci Lett 676, 8–12 (2018); published online EpubMay 29 ( 10.1016/j.neulet.2018.04.003). [DOI] [PubMed] [Google Scholar]
- 50.Jager SE, Pallesen LT, Richner M, Harley P, Hore Z, McMahon S, Denk F, Vaegter CB, Changes in the transcriptional fingerprint of satellite glial cells following peripheral nerve injury. Glia, (2020); published online EpubFeb 11 ( 10.1002/glia.23785). [DOI] [PubMed] [Google Scholar]
- 51.Parisien M, Samoshkin A, Tansley SN, Piltonen MH, Martin LJ, El-Hachem N, Dagostino C, Allegri M, Mogil JS, Khoutorsky A, Diatchenko L, Genetic pathway analysis reveals a major role for extracellular matrix organization in inflammatory and neuropathic pain. Pain 160, 932–944 (2019); published online EpubApr ( 10.1097/j.pain.0000000000001471). [DOI] [PubMed] [Google Scholar]
- 52.Hucho T, Levine JD, Signaling pathways in sensitization: toward a nociceptor cell biology. Neuron 55, 365–376 (2007). [DOI] [PubMed] [Google Scholar]
- 53.Madiai F, Goettl VM, Hussain SR, Clairmont AR, Stephens RL Jr., Hackshaw KV, Anti-fibroblast growth factor-2 antibodies attenuate mechanical allodynia in a rat model of neuropathic pain. J Mol Neurosci 27, 315–324 (2005) 10.1385/JMN:27:3:315). [DOI] [PubMed] [Google Scholar]
- 54.Yamanaka H, Obata K, Kobayashi K, Dai Y, Fukuoka T, Noguchi K, Activation of fibroblast growth factor receptor by axotomy, through downstream p38 in dorsal root ganglion, contributes to neuropathic pain. Neuroscience 150, 202–211 (2007); published online EpubNov 30 ( 10.1016/j.neuroscience.2007.08.024). [DOI] [PubMed] [Google Scholar]
- 55.Furusho M, Dupree JL, Bryant M, Bansal R, Disruption of fibroblast growth factor receptor signaling in nonmyelinating Schwann cells causes sensory axonal neuropathy and impairment of thermal pain sensitivity. J Neurosci 29, 1608–1614 (2009); published online EpubFeb 11 ( 10.1523/JNEUROSCI.5615-08.2009). [DOI] [PMC free article] [PubMed] [Google Scholar]
- 56.Hay DL, Garelja ML, Poyner DR, Walker CS, Update on the pharmacology of calcitonin/CGRP family of peptides: IUPHAR Review 25. Br J Pharmacol 175, 3–17 (2018); published online EpubJan ( 10.1111/bph.14075). [DOI] [PMC free article] [PubMed] [Google Scholar]
- 57.Barkai O, Puig S, Lev S, Title B, Katz B, Eli-Berchoer L, Gutstein HB, Binshtok AM, Platelet-derived growth factor activates nociceptive neurons by inhibiting M-current and contributes to inflammatory pain. Pain 160, 1281–1296 (2019); published online EpubJun ( 10.1097/j.pain.0000000000001523). [DOI] [PMC free article] [PubMed] [Google Scholar]
- 58.Lopez-Bellido R, Puig S, Huang PJ, Tsai CR, Turner HN, Galko MJ, Gutstein HB, Growth Factor Signaling Regulates Mechanical Nociception in Flies and Vertebrates. J Neurosci 39, 6012–6030 (2019); published online EpubJul 24 ( 10.1523/JNEUROSCI.2950-18.2019). [DOI] [PMC free article] [PubMed] [Google Scholar]
- 59.Zhao J, Seereeram A, Nassar MA, Levato A, Pezet S, Hathaway G, Morenilla-Palao C, Stirling C, Fitzgerald M, McMahon SB, Rios M, Wood JN, Nociceptor-derived brain-derived neurotrophic factor regulates acute and inflammatory but not neuropathic pain. Mol Cell Neurosci 31, 539–548 (2006); published online EpubMar (S1044–7431(05)00292–7 [pii] 10.1016/j.mcn.2005.11.008). [DOI] [PubMed] [Google Scholar]
- 60.Sikandar S, Minett MS, Millet Q, Santana-Varela S, Lau J, Wood JN, Zhao J, Brain-derived neurotrophic factor derived from sensory neurons plays a critical role in chronic pain. Brain 141, 1028–1039 (2018); published online EpubApr 1 ( 10.1093/brain/awy009). [DOI] [PMC free article] [PubMed] [Google Scholar]
- 61.Wang P, Du C, Chen FX, Li CQ, Yu YB, Han T, Akhtar S, Zuo XL, Tan XD, Li YQ, BDNF contributes to IBS-like colonic hypersensitivity via activating the enteroglia-nerve unit. Sci Rep 6, 20320 (2016); published online EpubFeb 3 ( 10.1038/srep20320). [DOI] [PMC free article] [PubMed] [Google Scholar]
- 62.Yu YB, Zuo XL, Zhao QJ, Chen FX, Yang J, Dong YY, Wang P, Li YQ, Brain-derived neurotrophic factor contributes to abdominal pain in irritable bowel syndrome. Gut 61, 685–694 (2012); published online EpubMay ( 10.1136/gutjnl-2011-300265). [DOI] [PubMed] [Google Scholar]
- 63.Zhu ZW, Friess H, Wang L, Zimmermann A, Buchler MW, Brain-derived neurotrophic factor (BDNF) is upregulated and associated with pain in chronic pancreatitis. Dig Dis Sci 46, 1633–1639 (2001); published online EpubAug ( 10.1023/a:1010684916863). [DOI] [PubMed] [Google Scholar]
- 64.Albers KM, Woodbury CJ, Ritter AM, Davis BM, Koerber HR, Glial cell-line-derived neurotrophic factor expression in skin alters the mechanical sensitivity of cutaneous nociceptors. J Neurosci 26, 2981–2990 (2006); published online EpubMar 15 ( 10.1523/JNEUROSCI.4863-05.2006). [DOI] [PMC free article] [PubMed] [Google Scholar]
- 65.Malin SA, Molliver DC, Koerber HR, Cornuet P, Frye R, Albers KM, Davis BM, Glial cell line-derived neurotrophic factor family members sensitize nociceptors in vitro and produce thermal hyperalgesia in vivo. J Neurosci 26, 8588–8599 (2006); published online EpubAug 16 ( 10.1523/JNEUROSCI.1726-06.2006). [DOI] [PMC free article] [PubMed] [Google Scholar]
- 66.Queme LF, Weyler AA, Cohen ER, Hudgins RC, Jankowski MP, A dual role for peripheral GDNF signaling in nociception and cardiovascular reflexes in the mouse. Proc Natl Acad Sci U S A 117, 698–707 (2020); published online EpubJan 7 ( 10.1073/pnas.1910905116). [DOI] [PMC free article] [PubMed] [Google Scholar]
- 67.DeBerry JJ, Saloman JL, Dragoo BK, Albers KM, Davis BM, Artemin Immunotherapy Is Effective in Preventing and Reversing Cystitis-Induced Bladder Hyperalgesia via TRPA1 Regulation. J Pain 16, 628–636 (2015); published online EpubJul ( 10.1016/j.jpain.2015.03.014). [DOI] [PMC free article] [PubMed] [Google Scholar]
- 68.Bulmer DC, Grundy D, Achieving translation in models of visceral pain. Curr Opin Pharmacol 11, 575–581 (2011); published online EpubDec ( 10.1016/j.coph.2011.09.008). [DOI] [PubMed] [Google Scholar]
- 69.Klinck MP, Mogil JS, Moreau M, Lascelles BDX, Flecknell PA, Poitte T, Troncy E, Translational pain assessment: could natural animal models be the missing link? Pain 158, 1633–1646 (2017); published online EpubSep ( 10.1097/j.pain.0000000000000978). [DOI] [PubMed] [Google Scholar]
- 70.Yamane S, Ishida S, Hanamoto Y, Kumagai K.-i., Masuda R, Tanaka K, Shiobara N, Yamane N, Mori T, Juji T, Proinflammatory role of amphiregulin, an epidermal growth factor family member whose expression is augmented in rheumatoid arthritis patients. Journal of inflammation 5, 5 (2008). [DOI] [PMC free article] [PubMed] [Google Scholar]
- 71.Harada M, Kamimura D, Arima Y, Kohsaka H, Nakatsuji Y, Nishida M, Atsumi T, Meng J, Bando H, Singh R, Temporal expression of growth factors triggered by epiregulin regulates inflammation development. The Journal of Immunology 194, 1039–1046 (2015). [DOI] [PubMed] [Google Scholar]
- 72.Puig S, Donica CL, Gutstein HB, EGFR signaling causes morphine tolerance and mechanical sensitization in rats. eNeuro, (2020); published online EpubFeb 27 ( 10.1523/ENEURO.0460-18.2020). [DOI] [PMC free article] [PubMed] [Google Scholar]
- 73.Catrina AI, Svensson CI, Malmstrom V, Schett G, Klareskog L, Mechanisms leading from systemic autoimmunity to joint-specific disease in rheumatoid arthritis. Nature reviews. Rheumatology 13, 79–86 (2017); published online EpubFeb ( 10.1038/nrrheum.2016.200). [DOI] [PubMed] [Google Scholar]
- 74.Krock E, Jurczak A, Svensson CI, Pain pathogenesis in rheumatoid arthritis-what have we learned from animal models? Pain 159 Suppl 1, S98–S109 (2018); published online EpubSep ( 10.1097/j.pain.0000000000001333). [DOI] [PubMed] [Google Scholar]
- 75.Swanson CD, Akama-Garren EH, Stein EA, Petralia JD, Ruiz PJ, Edalati A, Lindstrom TM, Robinson WH, Inhibition of epidermal growth factor receptor tyrosine kinase ameliorates collagen-induced arthritis. The Journal of Immunology 188, 3513–3521 (2012). [DOI] [PMC free article] [PubMed] [Google Scholar]
- 76.Caraceni A, Portenoy RK, Pain management in patients with pancreatic carcinoma. Cancer 78, 639–653 (1996); published online EpubAug 1 ( 10.1002/(SICI)1097-0142(19960801)78:3<639::AID-CNCR45>3.0.CO;2-X). [DOI] [PubMed] [Google Scholar]
- 77.Drewes AM, Campbell CM, Ceyhan GO, Delhaye M, Garg PK, van Goor H, Laquente B, Morlion B, Olesen SS, Singh VK, Sjogren P, Szigethy E, Windsor JA, Salvetti MG, Talukdar R, Pain in pancreatic ductal adenocarcinoma: A multidisciplinary, International guideline for optimized management. Pancreatology : official journal of the International Association of Pancreatology 18, 446–457 (2018); published online EpubJun ( 10.1016/j.pan.2018.04.008). [DOI] [PubMed] [Google Scholar]
- 78.Kalser MH, Barkin J, Macintyre JM, Pancreatic cancer. Assessment of prognosis by clinical presentation. Cancer 56, 397–402 (1985). [DOI] [PubMed] [Google Scholar]
- 79.Krech RL, Walsh D, Symptoms of pancreatic cancer. Journal of pain and symptom management 6, 360–367 (1991). [DOI] [PubMed] [Google Scholar]
- 80.Bezjak A, Tu D, Seymour L, Clark G, Trajkovic A, Zukin M, Ayoub J, Lago S, de Albuquerque Ribeiro R, Gerogianni A, Cyjon A, Noble J, Laberge F, Chan RT, Fenton D, von Pawel J, Reck M, Shepherd FA, National BR Cancer Institute of Canada Clinical Trials Group Study, Symptom improvement in lung cancer patients treated with erlotinib: quality of life analysis of the National Cancer Institute of Canada Clinical Trials Group Study BR.21. J Clin Oncol 24, 3831–3837 (2006); published online EpubAug 20 ( 10.1200/JCO.2006.05.8073). [DOI] [PubMed] [Google Scholar]
- 81.Kim JW, Kim H-P, Im S-A, Kang S, Hur HS, Yoon Y-K, Oh D-Y, Kim JH, Lee DS, Kim T-Y, The growth inhibitory effect of lapatinib, a dual inhibitor of EGFR and HER2 tyrosine kinase, in gastric cancer cell lines. Cancer letters 272, 296–306 (2008). [DOI] [PubMed] [Google Scholar]
- 82.Stark R, Grzelak M, Hadfield J, RNA sequencing: the teenage years. Nat Rev Genet 20, 631–656 (2019); published online EpubNov ( 10.1038/s41576-019-0150-2). [DOI] [PubMed] [Google Scholar]
- 83.Lein E, Borm LE, Linnarsson S, The promise of spatial transcriptomics for neuroscience in the era of molecular cell typing. Science 358, 64–69 (2017); published online EpubOct 6 ( 10.1126/science.aan6827). [DOI] [PubMed] [Google Scholar]
- 84.Woodcock J, Witter J, Dionne RA, Stimulating the development of mechanism-based, individualized pain therapies. Nat Rev Drug Discov 6, 703–710 (2007); published online EpubSep ( 10.1038/nrd2335). [DOI] [PubMed] [Google Scholar]
- 85.Brown MT, Murphy FT, Radin DM, Davignon I, Smith MD, West CR, Tanezumab reduces osteoarthritic knee pain: results of a randomized, double-blind, placebo-controlled phase III trial. J Pain 13, 790–798 (2012); published online EpubAug ( 10.1016/j.jpain.2012.05.006). [DOI] [PubMed] [Google Scholar]
- 86.Sun H, Dodick DW, Silberstein S, Goadsby PJ, Reuter U, Ashina M, Saper J, Cady R, Chon Y, Dietrich J, Lenz R, Safety and efficacy of AMG 334 for prevention of episodic migraine: a randomised, double-blind, placebo-controlled, phase 2 trial. Lancet Neurol 15, 382–390 (2016); published online EpubApr ( 10.1016/S1474-4422(16)00019-3). [DOI] [PubMed] [Google Scholar]
- 87.Ji RR, Xu ZZ, Wang X, Lo EH, Matrix metalloprotease regulation of neuropathic pain. Trends Pharmacol Sci 30, 336–340 (2009); published online EpubJul ( 10.1016/j.tips.2009.04.002). [DOI] [PMC free article] [PubMed] [Google Scholar]
- 88.Reichling DB, Green PG, Levine JD, The fundamental unit of pain is the cell. Pain 154 Suppl 1, S2–9 (2013); published online EpubDec ( 10.1016/j.pain.2013.05.037). [DOI] [PMC free article] [PubMed] [Google Scholar]
- 89.Ji RR, Chamessian A, Zhang YQ, Pain regulation by non-neuronal cells and inflammation. Science 354, 572–577 (2016); published online EpubNov 04 ( 10.1126/science.aaf8924). [DOI] [PMC free article] [PubMed] [Google Scholar]
- 90.Wangzhou A, McIlvried LA, Paige C, Barragan-Iglesias P, Shiers S, Ahmad A, Guzman CA, Dussor G, Ray PR, Gereau IV RW, Pharmacological target-focused transcriptomic analysis of native versus cultured human and mouse dorsal root ganglia. Pain, (2020). [DOI] [PMC free article] [PubMed] [Google Scholar]
- 91.Davidson S, Golden JP, Copits BA, Ray PR, Vogt SK, Valtcheva MV, Schmidt RE, Ghetti A, Price TJ, Gereau R. W. t., Group II mGluRs suppress hyperexcitability in mouse and human nociceptors. Pain 157, 2081–2088 (2016); published online EpubSep ( 10.1097/j.pain.0000000000000621). [DOI] [PMC free article] [PubMed] [Google Scholar]
- 92.Rostock C, Schrenk-Siemens K, Pohle J, Siemens J, Human vs. Mouse Nociceptors - Similarities and Differences. Neuroscience 387, 13–27 (2018); published online EpubSep 1 ( 10.1016/j.neuroscience.2017.11.047). [DOI] [PMC free article] [PubMed] [Google Scholar]
- 93.Moy JK, Hartung JE, Duque MG, Friedman R, Nagarajan V, Loeza-Alcocer E, Koerber HR, Christoph T, Schroder W, Gold MS, Distribution of functional opioid receptors in human dorsal root ganglion neurons. Pain, (2020); published online EpubFeb 25 ( 10.1097/j.pain.0000000000001846). [DOI] [PMC free article] [PubMed] [Google Scholar]
- 94.Frankish A, Diekhans M, Ferreira AM, Johnson R, Jungreis I, Loveland J, Mudge JM, Sisu C, Wright J, Armstrong J, Barnes I, Berry A, Bignell A, Sala SC, Chrast J, Cunningham F, Di Domenico T, Donaldson S, Fiddes IT, Giron CG, Gonzalez JM, Grego T, Hardy M, Hourlier T, Hunt T, Izuogu OG, Lagarde J, Martin FJ, Martinez L, Mohanan S, Muir P, Navarro FCP, Parker A, Pei BK, Pozo F, Ruffier M, Schmitt BM, Stapleton E, Suner MM, Sycheva I, Uszczynska-Ratajczak B, Xu J, Yates A, Zerbino D, Zhang Y, Aken B, Choudhary JS, Gerstein M, Guigo R, Hubbard TJ, Kellis M, Paten B, Reymond A, Tress ML, Flicek P, GENCODE reference annotation for the human and mouse genomes. Nucleic Acids Res 47, D766–D773 (2019); published online EpubJan 8 ( 10.1093/nar/gky955). [DOI] [PMC free article] [PubMed] [Google Scholar]
- 95.Dobin A, Davis CA, Schlesinger F, Drenkow J, Zaleski C, Jha S, Batut P, Chaisson M, Gingeras TR, STAR: ultrafast universal RNA-seq aligner. Bioinformatics 29, 15–21 (2013); published online EpubJan 1 ( 10.1093/bioinformatics/bts635). [DOI] [PMC free article] [PubMed] [Google Scholar]
- 96.Dobin A, Gingeras TR, Optimizing RNA-Seq Mapping with STAR. Methods Mol Biol 1415, 245–262 (2016) 10.1007/978-1-4939-3572-7_13). [DOI] [PubMed] [Google Scholar]
- 97.Hockley JRF, Taylor TS, Callejo G, Wilbrey AL, Gutteridge A, Bach K, Winchester WJ, Bulmer DC, McMurray G, Smith ES, Single-cell RNAseq reveals seven classes of colonic sensory neuron. Gut 68, 633–644 (2019); published online EpubApr ( 10.1136/gutjnl-2017-315631). [DOI] [PMC free article] [PubMed] [Google Scholar]
- 98.Pachter L, Models for transcript quantification from RNA-Seq. arXiv preprint arXiv:1104.3889, (2011). [Google Scholar]
- 99.Zhang XD, Espeseth AS, Chung N, Holder DJ, Ferrer M, in American Statistical Association Proceedings. (2006), pp. 882–886. [Google Scholar]
- 100.Ray P, Kahn J, Wangzhou A, Tavares-Ferreira D, Akopian AN, Dussor G, Price TJ, Transcriptome analysis of the human tibial nerve identifies sexually dimorphic expression of genes involved in pain, inflammation and neuro-immunity. Frontiers in molecular neuroscience 12, 37 (2019). [DOI] [PMC free article] [PubMed] [Google Scholar]
- 101.Bhattacharyya A, On a measure of divergence between two statistical populations defined by their probability distributions. Bull. Calcutta Math. Soc 35, 99–109 (1943). [Google Scholar]
- 102.Krzywinski M, Schein J, Birol I, Connors J, Gascoyne R, Horsman D, Jones SJ, Marra MA, Circos: an information aesthetic for comparative genomics. Genome Res 19, 1639–1645 (2009); published online EpubSep ( 10.1101/gr.092759.109). [DOI] [PMC free article] [PubMed] [Google Scholar]
- 103.Chaplan SR, Bach FW, Pogrel JW, Chung JM, Yaksh TL, Quantitative assessment of tactile allodynia in the rat paw. J Neurosci Methods 53, 55–63 (1994); published online EpubJul ( [DOI] [PubMed] [Google Scholar]
- 104.Langford DJ, Bailey AL, Chanda ML, Clarke SE, Drummond TE, Echols S, Glick S, Ingrao J, Klassen-Ross T, Lacroix-Fralish ML, Matsumiya L, Sorge RE, Sotocinal SG, Tabaka JM, Wong D, van den Maagdenberg AM, Ferrari MD, Craig KD, Mogil JS, Coding of facial expressions of pain in the laboratory mouse. Nature methods 7, 447–449 (2010); published online EpubJun ( 10.1038/nmeth.1455). [DOI] [PubMed] [Google Scholar]
- 105.Sanders JM, Wampole ME, Thakur ML, Wickstrom E, Molecular determinants of epidermal growth factor binding: a molecular dynamics study. PLoS One 8, e54136 (2013) 10.1371/journal.pone.0054136). [DOI] [PMC free article] [PubMed] [Google Scholar]
Associated Data
This section collects any data citations, data availability statements, or supplementary materials included in this article.
Supplementary Materials
Data file S1: Ligand-receptor interactions in mDRG sensory neurons and each of the 42 cell types in mDRG-innervated tissues from Tabula Muris, along with gene ontology annotations.
Data file S2: Ligand-receptor interactions in mDRG sensory neurons and subsets of 42 cell types in mDRG-innervated tissues from Tabula Muris, for ligands with cell-type-restricted expression.
Data file S3: DRG-localized ligand-receptor interaction pairs between mDRG neurons and glial cells.
Data file S4: Ligand-receptor interactions in differentially expressed ligand genes in DNBS-treated enteric glia, and paired receptors in thoracolumbar or lumbosacral mDRG neurons.
Data file S5: Ligand-receptor interaction pairs in OA and RA macrophages and hDRG-expressed receptors.
Data file S6: Ligand-receptor interaction pairs in ligand genes differentially expressed in pancreatic tumors, and hDRG-expressed receptors.
Data file S7: Cell types and number of cells from Tabula Muris used for downstream analysis.
Data file S8: Complete ligand-receptor interaction database underlying the interactome prediction framework.
Data file S9: Parameters for hierarchical clustering of gene expression patterns in Tabula Muris cell types using scrattch.hicat.
Figure S1: A full interactome for ligand-receptor mediated interactions from neurons to glial cells within the mDRG.
Figure S2: A full interactome for ligand-receptor mediated interactions from glial cells to neurons within the mDRG.