Abstract
Protein aggregation is the hallmark of neurodegeneration but the molecular mechanisms underlying late-onset Alzheimer’s disease (AD) remain unclear. Here we integrated transcriptomic, proteomic and epigenomic analyses of post-mortem human brains to identify molecular pathways involved in AD. RNA-seq analysis revealed upregulation of transcription- and chromatin-related genes, including the histone acetyltransferases for H3K27ac and H3K9ac. An unbiased proteomic screening singled out H3K27ac and H3K9ac as main enrichments specific to AD. In turn, epigenomic profiling revealed gains of H3K27ac and H3K9ac linked to transcription, chromatin, and disease pathways in AD. Increasing genome-wide H3K27ac and H3K9ac in a fly model of AD exacerbated amyloid-β42-driven neurodegeneration. Together, these findings suggest that AD involves a reconfiguration of the epigenome, where H3K27ac and H3K9ac impact disease pathways by dysregulating transcription- and chromatin-gene feedback loops. The identification of this process highlights potential epigenetic strategies for early-stage disease treatment.
Introduction
Age-related neurodegeneration poses an economic and psychological burden to society, with an estimate of 50 million people affected worldwide (Alzheimer’s Disease International). Although there is strong association between age and neurodegeneration, the molecular mechanisms that predispose to, or drive disease during aging remain unclear. Late-onset Alzheimer’s disease (AD) is the most common form of dementia and is characterized by accumulation of intercellular β-amyloid plaques and intracellular neurofibrillary tangles, which correlate with neuronal death and loss of cognitive functions. The contribution of the genotype to neurodegeneration is complex, with genetic-risk variants partially accounting for AD risk1,2. Drugs targeting plaques have to date largely failed in clinical trials3, highlighting the need to identify pathways either upstream of plaque and tangle formation, or distinct mechanisms.
Epigenetic regulation is a critical player in aging of lower organisms4,5 and, because of its role in integrating environmental stimuli into the genome, represents a potential therapeutically tractable player in age-related diseases. Studies in mouse and fly models of neurodegeneration have identified epigenetic changes associated with disease pathology, including histone acetylation and methylation changes6–9. In the CK-p25 mouse, knock-down of the histone deacetylase 2 (HDAC2) restored normal gene expression and improved cognition10. Although treatment of mouse models with HDAC inhibitors (HDACi) has shown promising results7,11,12, the unspecific nature of HDACi could interfere with REST-mediated neuro-protective pathways requiring histone deacetylation13. While mouse models of neurodegeneration are useful to study molecular changes downstream of induction of plaque and tangles, well-designed studies of human postmortem brains can illuminate disease etiology.
The first large-scale studies of epigenetic changes associated with AD involved the study of CpG methylation, a transcriptionally repressive modification when at promoters14–16. While DNA methylation is a relatively stable mark, histone acetylation is more dynamically regulated and is directly involved in memory in model organisms7. We previously undertook a genome-wide analysis of histone-associated epigenetic changes in AD brains compared to the profile of normal aging17. This study, performed in lateral temporal lobe, uncovered genome-wide enrichment in normal aging of H4K16ac, and indicated loss of an age-related protective epigenetic pathway in AD17. Several recent studies have provided additional profiles of histone acetylation changes in AD-affected brains; these studies were performed in different brain regions and did not compare to a normal aging profile18,19.
Given the complexity of the aging and neurodegenerative processes, and their interrelation, here we launched a comprehensive multi-omics analysis of AD brains vs. old and younger control brains. These studies identify histone modifications associated with AD and reveal that H3K27ac and H3K9ac gains in AD impact disease pathways by dysregulating transcription- and chromatin-gene feedback loops.
Results
Transcriptomic analysis identifies upregulation of transcription- and chromatin-related genes in AD
To systematically identify the molecular mechanisms underlying AD, we analyzed previous RNA-seq data we generated from a high-quality set of AD (AD; n = 12; mean age = 68), cognitively healthy older (Old; n = 10; mean age = 68) and healthy younger (Younger; n = 8, mean age = 52) brains17 from the lateral temporal lobe, a region affected early in AD (Supplementary Tables 1–2). The dataset of healthy younger brains was included to discriminate changes related to aging from those specific to AD.
Frozen postmortem brains were rigorously selected based on criteria aiming to reduce confounding variables associated with the complex nature of human tissue studies. Brain samples were selected based on Braak and CERAD scores and clinically diagnosed AD (Methods section and Supplementary Table 1). None of the AD cases had other coincident neurodegenerative diseases and none of the Younger or Old samples had deposits consistent with other neuropathologies. Samples were further selected based on level of neuronal loss (cases with severe loss were excluded), postmortem interval (≤ 24 hr) and gender (mainly male subjects) (Methods section and Supplementary Table 1). Neuronal fractions were measured in each sample by immunofluorescence and flow cytometry for neuron-specific NeuN, revealing no significant differences between Old and AD (Immunofluorescence P = 0.30, two-sided Student’s t-test; flow cytometry P = 0.37, two-sided Student’s t-test)17.
By comparing gene expression between AD and Old, we identified 421 genes with significant upregulation in AD, while 434 had significant downregulation (q < 0.05) (Fig. 1a). Gene Ontology (GO) analysis of the upregulated genes using DAVID (v6.7)20 revealed “Regulation of transcription” as the top GO term in the Biological Process (BP) category (FDR < 10%) (Fig. 1b). In the top GO terms for genes downregulated there were categories related to cellular respiration and oxidation (Fig. 1c), which have been previously linked to AD21,22. Inspection of genes within the “regulation of transcription” term (n = 75) showed several transcription factors and chromatin structure-related genes (Fig. 1d). Transcription factors included zinc finger proteins such as ZNF568, involved in cell proliferation and maintenance of neural stem cells23 and ZBTB16, regulating cell-cycle progression24. Cell-cycle activation followed by apoptosis has previously been implicated in AD25,26. Other transcription factors included JDP2 and HIF3A, involved in apoptosis and adaptive response to low oxygen levels27–30.
Figure 1. Transcriptomic analysis identifies upregulation of transcription- and chromatin-related genes in AD.
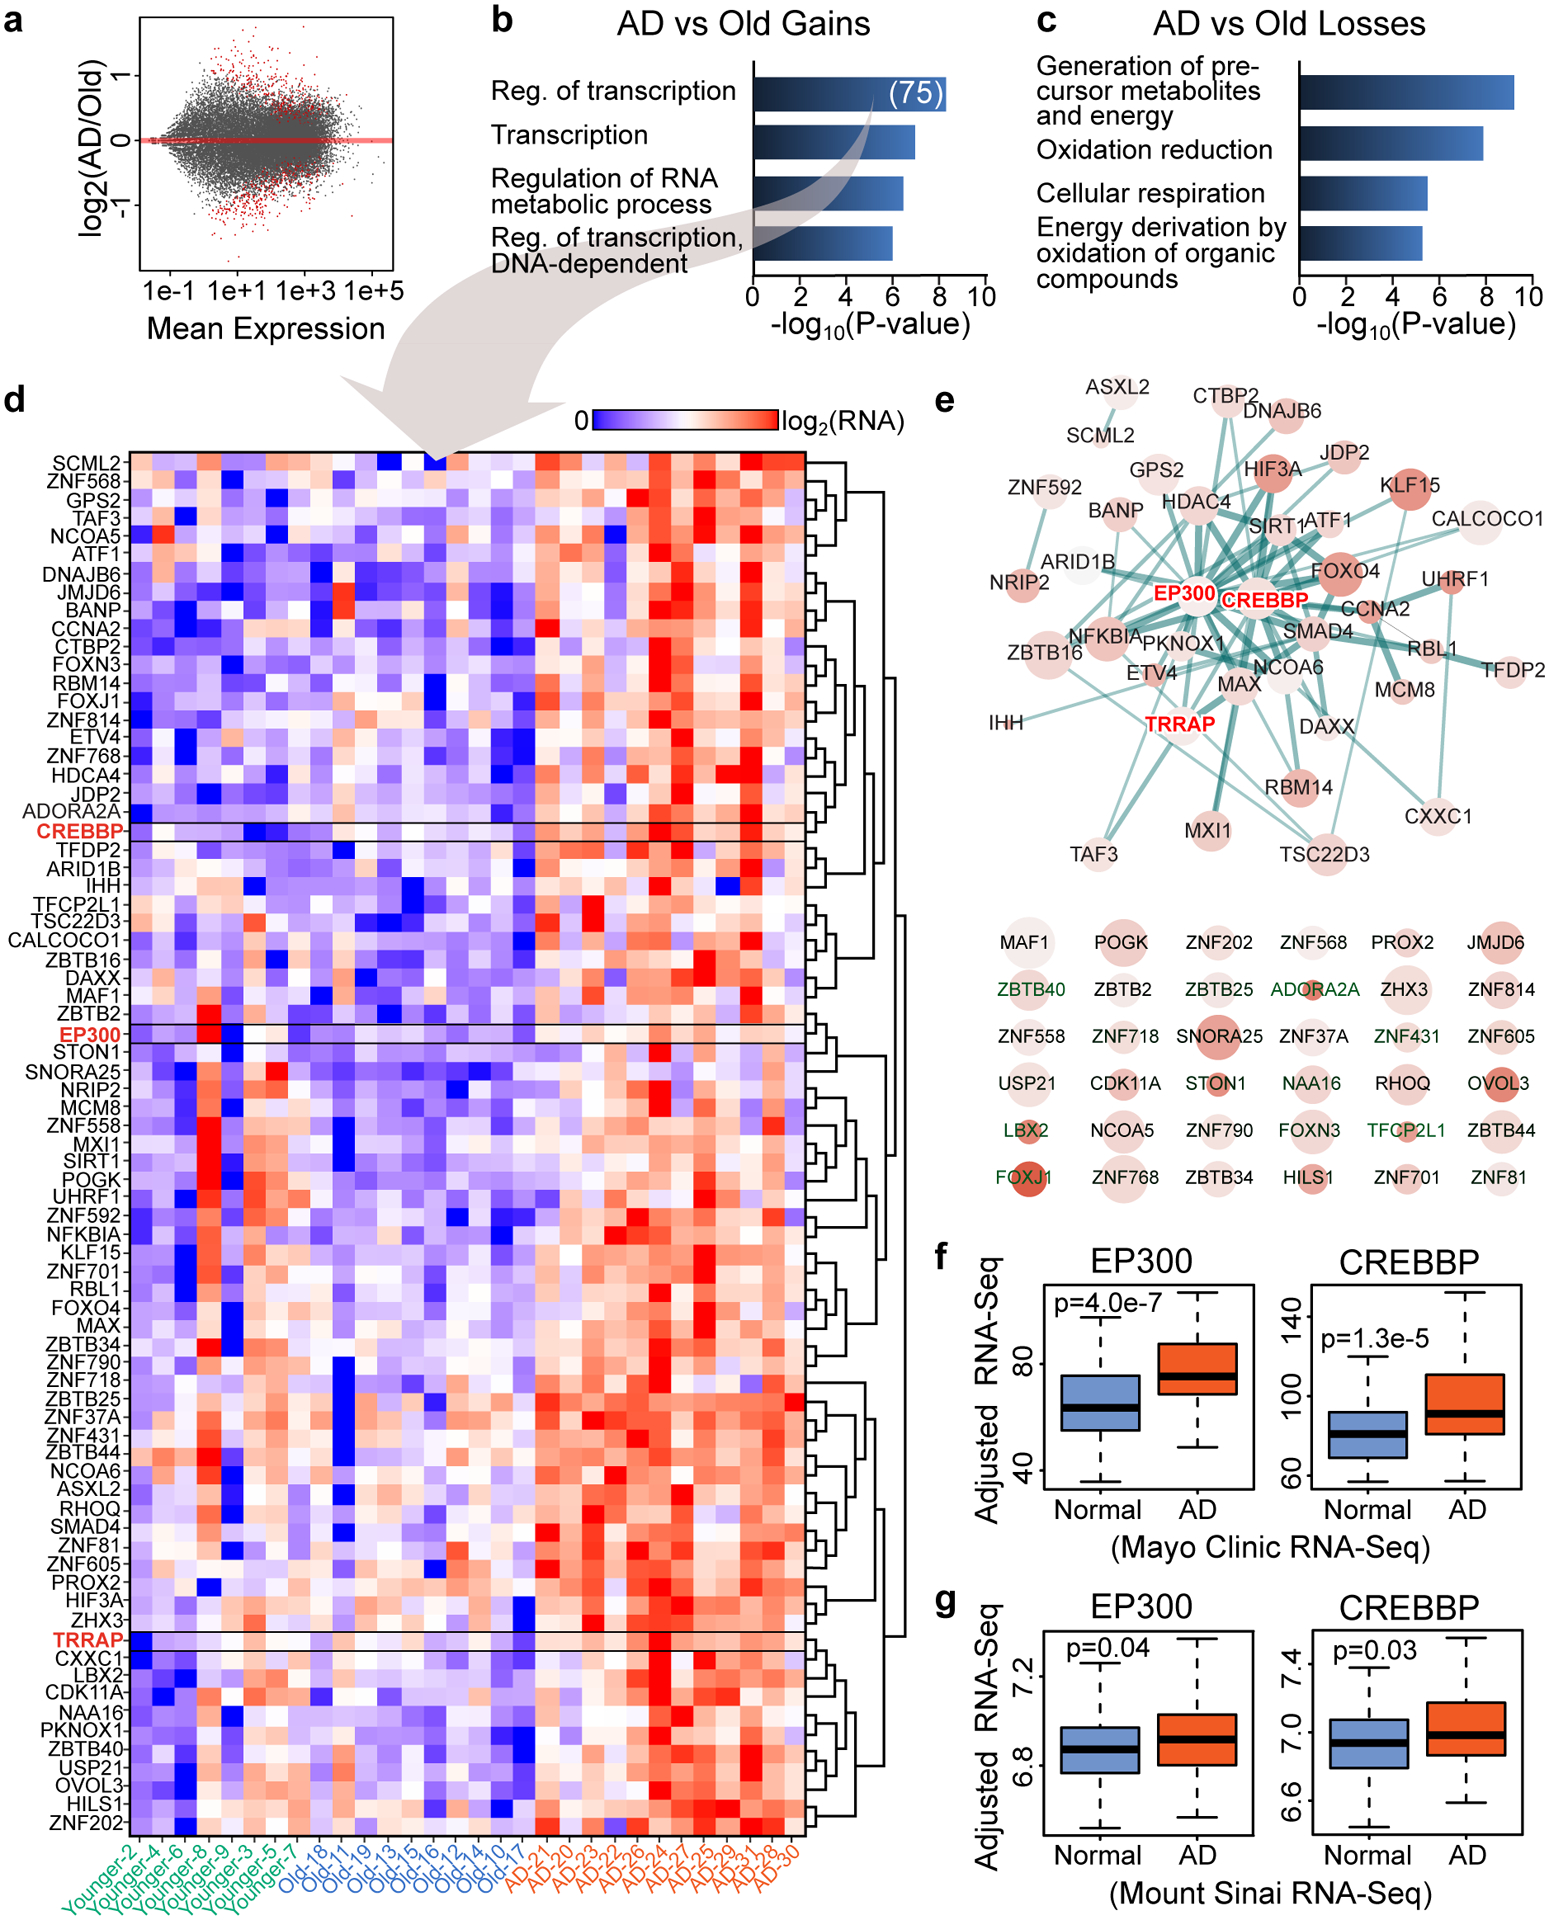
(a) Scatterplot showing gene expression changes vs. Mean expression in the AD vs. Old comparison. Red dots represent significant differentially expressed genes (q < 0.05, DESeq2). (b,c) Barplot showing top GO terms (Biological Process, DAVID, FDR < 10%, Yekutieli) for genes that are significantly (b) upregulated or (c) downregulated in AD vs. Old (q < 0.05, DESeq2). (D) Heatmap showing gene expression in Younger, Old and AD for genes that are in the GO term “Regulation of transcription” in panel b (N = 75). CREBBP, EP300 and TRRAP are highlighted in red. (e) STRING (v11) analysis for the 75 transcription- and chromatin-related genes (in panel d) revealing a protein interaction network of 35 gene products (top) with CREBBP and EP300 at the center of the network. Genes not involved in any interaction are also showed (bottom). The STRING network was visualized using Cytoscape (v3.6) where node size represents gene expression in AD, the color intensity represents gene expression changes in AD vs. Old and the thickness of the lines represents the strength of the STRING interaction. (f,g) Boxplots showing CREBBP and EP300 expression in two published RNA-seq data of control (Normal) and AD brains from (f) the Mayo Clinic (temporal cortex) (N = 203) from Allen et al.43 and (g) the Mount Sinai brain bank (Brodmann area 22 temporal cortex) (N = 160) from Wang et al.44. Boxplots show minimum, first quartile, median (center line), third quartile and maximum. P values (two-sided Wilcoxon rank-sum test) of the comparison between AD and Normal are reported in each panel.
Among the chromatin genes were those encoding histone acetyltransferases (HAT) such as CBP (CREBBP), p300 (EP300), and TRRAP (subunit of the SAGA/ATAC complex), HDACs such as SIRT1 and HDAC4, histone methyltransferases (CXXC31), and histone demethylases (JMJD6)32. HDAC4 levels were increased in mouse models of AD and in human AD brains33–35. miR-132–3p, which downregulates p300, is reduced in AD36, aligning with our results of increased EP300 expression. Comparison of the expression of the 75 transcription- and chromatin-related genes across Younger, Old and AD, revealed selective upregulation in AD with no change in Old vs. Younger (Fig. 1d).
STRING (v11) analysis37 of the 75 genes revealed an interaction network of 35 proteins, with p300 and CBP located at the center of the network (Fig. 1e top and Extended Data Fig. 1a). p300 and CBP have high homology and functional redundancy and are mutated in the intellectual disability disorder Rubinstein-Taybi38,39. Lysines 18 and 27 on the tail of histone H3 (H3K18 and H3K27) are substrates for CBP/p30040.
We also detected increased expression of TRRAP, that encodes a subunit of the SAGA/ATAC complexes that acetylate lysine 9 on H3 (H3K9ac)41,42. STRING analysis extended to all genes changing in AD vs. Old (q < 0.05) uncovered additional chromatin factors that interact with CBP/p300 and TRRAP (Extended Data Fig. 1b), thus indicating an even larger and dynamic network of chromatin dysregulation in AD.
Given the potential role of CBP/p300 and other chromatin genes in AD, we compared our data to two published large-scale RNA-seq studies from AD and control samples (temporal cortex) from the Mayo Clinic and the Mount Sinai brain banks43,44. Analysis of both datasets revealed the upregulation in AD of several transcription and chromatin genes identified in our dataset (Supplementary Note 1, Supplementary Fig.1 and Supplementary Table 3).
Given that changes in cell-type proportions across samples could confound our analyses, we further corrected the RNA-seq data for changes in neuronal fractions (Supplementary Note 2). This analysis confirmed and strengthened our observations of increased expression of transcription- and chromatin-related genes in AD (Supplementary Figs. 2–3). Similarly, analysis of the RNA-seq data with inclusion of ERCC spike-in controls, showed no global transcriptional changes between groups, and confirmed the same results (Supplementary Note 3, Supplementary Figs. 4–5 and Supplementary Table 4).
These transcriptomic analyses, by showing upregulation of transcription and chromatin genes in AD with confirmation in published datasets, indicate an increase of epigenomic plasticity in AD.
Proteomic analysis identifies increased levels of H3K27ac and H3K9ac in AD
Given the implications of increased expression of chromatin-related genes in AD, we performed a proteomic analysis to investigate changes at the chromatin level. We focused on analysis of histone posttranslational modifications (PTMs), as they are key determinants of transcriptional regulation. Histones were extracted from frozen tissue of Younger, Old and AD brains and were prepared for analysis on a Nano LC-MS/MS instrument using a bottom-up approach45 (Methods section and Fig. 2a). Histone PTMs of lysine acetylation and methylation were mapped on canonical histones and on the histone variant H3.3 (Extended Data Fig. 2 and Supplementary Table 5).
Figure 2. Mass spectrometry analysis identifies histone acetylation and methylation changes in aging and AD.
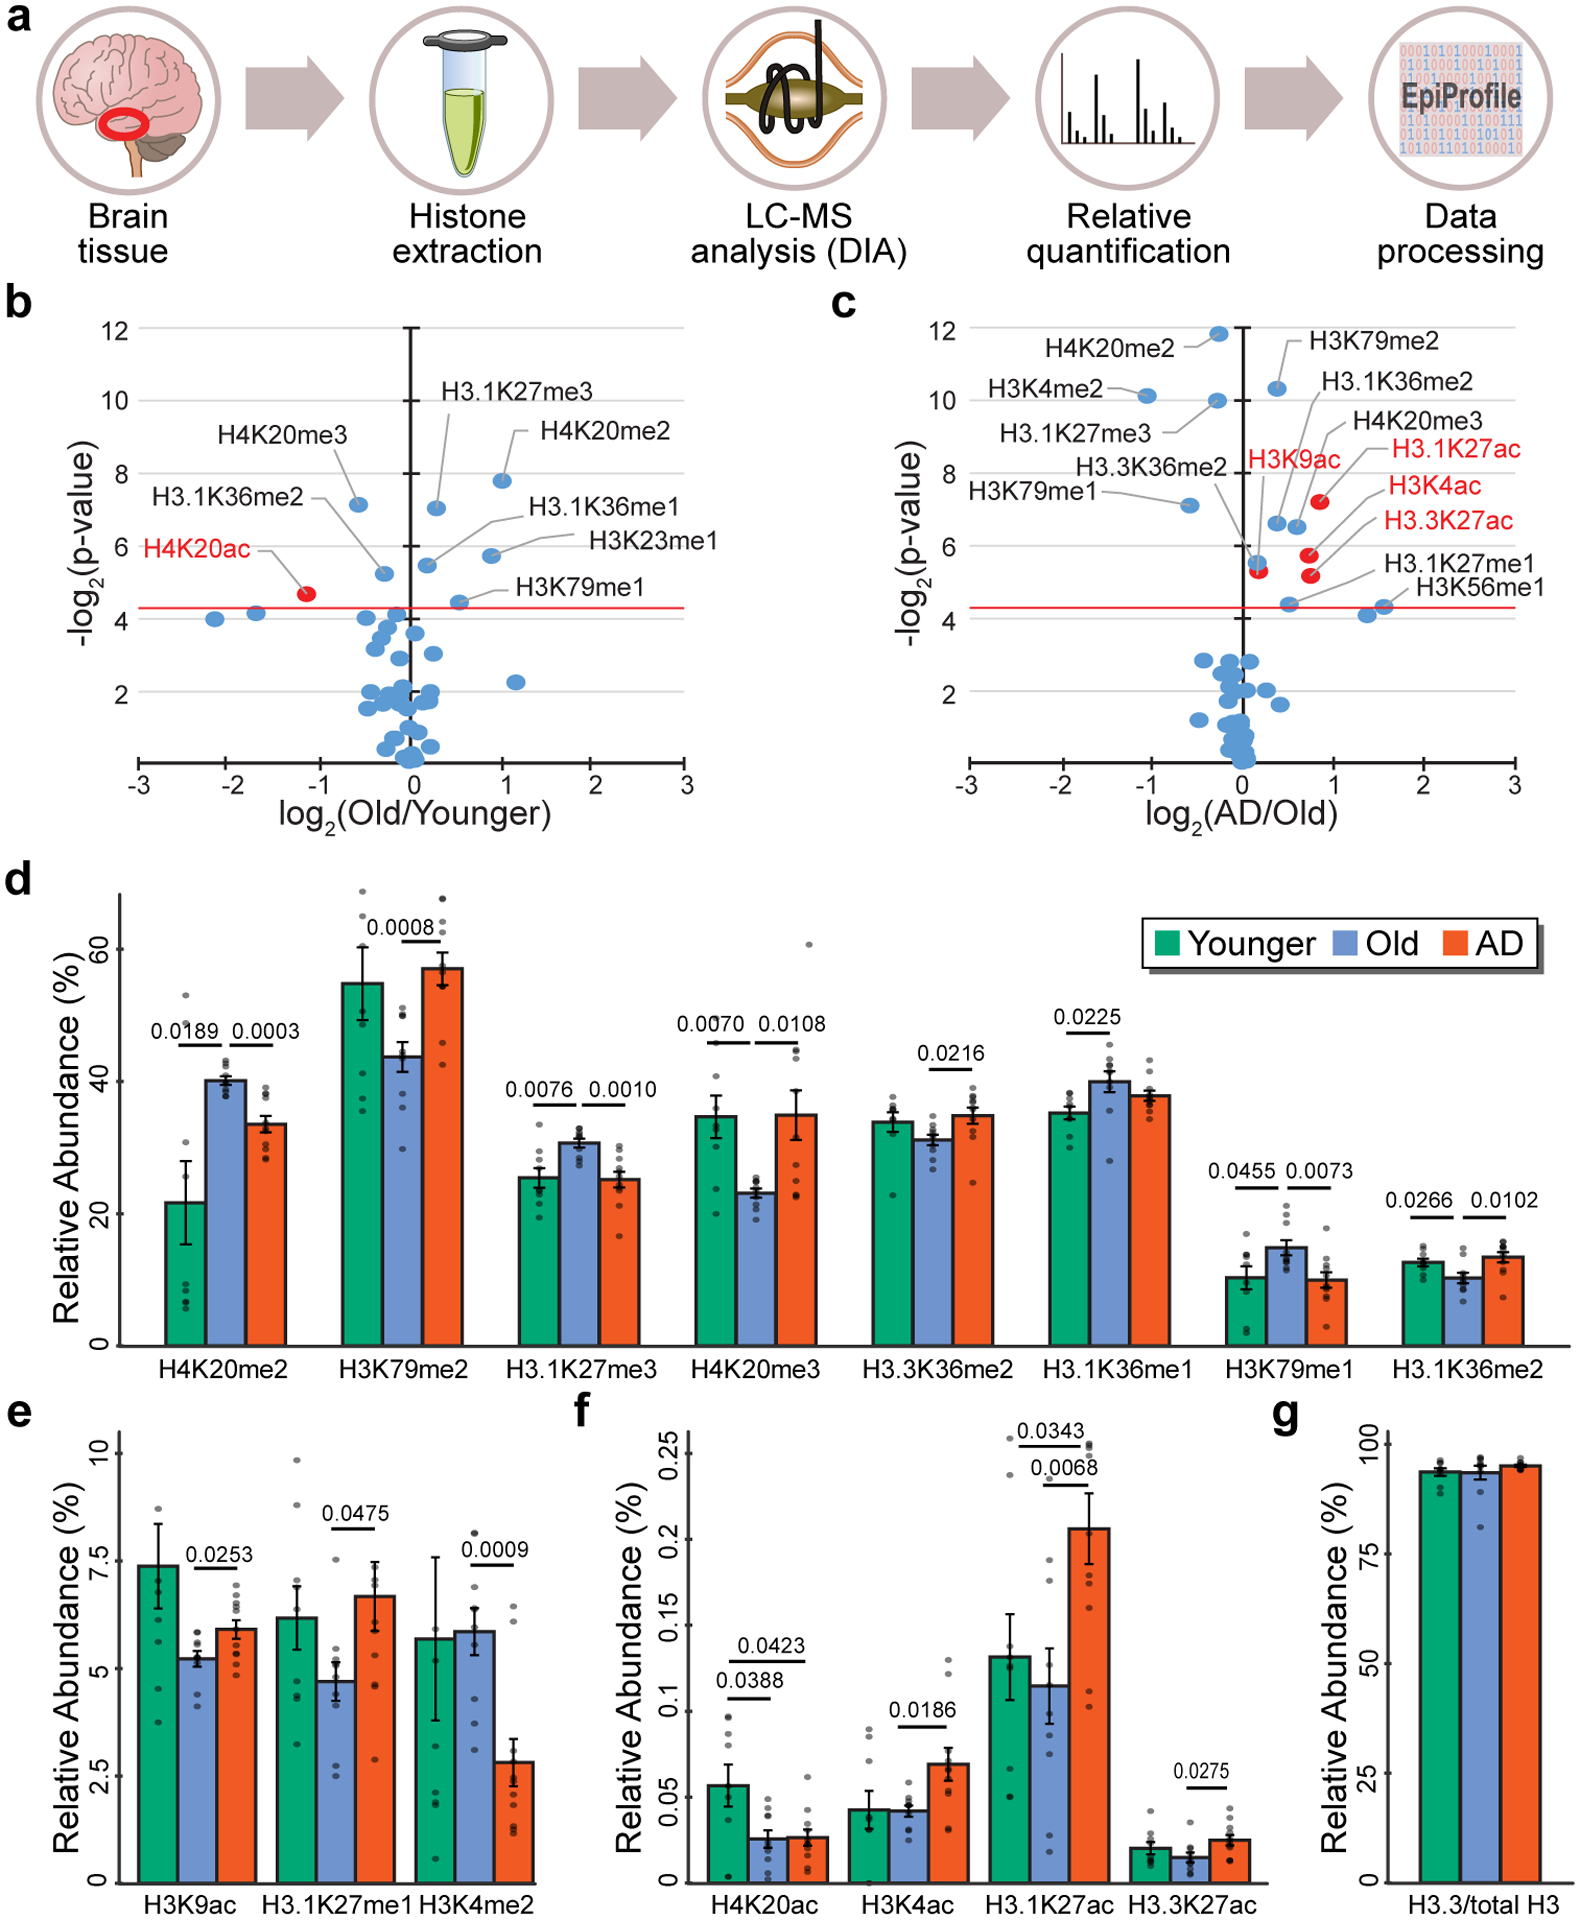
(a) Pipeline of the proteomic experiment showing histone extraction from frozen brain tissue, histone derivatization, run of histone peptides on a nano LC-MS/MS setup, and quantification of relative histone posttranslational modifications (PTM) using EpiProfile 2.0 in Young (N = 9), Old (N = 10) and AD (N = 11). (b,c) Volcano plot showing histone PTMs changes vs. P value in the (b) Old vs. Younger and (c) AD vs. Old comparisons. The red horizontal line represents threshold of statistical significance (two-sided Student’s t-test). Significant histone acetylation changes are highlighted in red. (d-f) Barplot showing relative histone PTMs in Younger, Old and AD for histone PTMs with statistically significant differences in Old vs. Younger or in AD vs. Old. P-values are reported for statistically significant differences (P < 0.05, two-sided Student’s t-test). (g) Barplot of H3.3 vs. total H3 in Younger, Old and AD. Differences are not significant (P < 0.05, two-sided Student’s t-test). Bars in panels d-g represent the mean ± SD.
The analysis of histone PTMs changes in aging (Old vs. Younger) revealed 5 histone PTMs with significant enrichment in Old, while 3 had significant depletion (P < 0.05, two-sided Student’s t-test) (Fig. 2b). These changes involved histone methylation at gene bodies (H3K36me1, H3K36me2, H3K79me1, H3K23me1) and promoters (H3K27me3 and H4K20me2 and H4K20me3), which are associated with activation or repression46–49. Among the acetylation changes, H4K20ac, which is involved in transcriptional repression50, was reduced in Old.
With disease (AD vs. Old), we found a higher number of histone PTM changes (n=14) (Fig. 2c) than in healthy aging (n = 8) (Fig. 2b), indicating a stronger effect of disease vs. aging processes. Physiological aging may be more heterogeneous across the population, with some individuals aging faster than others, while disease may produce more consistent molecular changes.
Both histone methylation and acetylation changes were detected comparing AD to Old (Fig. 2c). While histone methylation changes involved both gains or losses in methylation, acetylation changes exclusively involved gains (Fig. 2c), such as for H3K27ac (on canonical H3 and the H3.3 variant), H3K9ac and H3K4ac (P < 0.05, two-sided Student’s t-test) (Fig. 2c). Increased H3K9ac in AD has been shown to increase in a previous study13, consistent with these findings. H3K27ac and H3K9ac are transcription-activating PTMs that are enriched at promoters and enhancers51,52. H3K4ac is associated with both active transcription53 and heterochromatin formation54 – therefore its role in chromatin regulation is complex. Intriguingly, H3K27ac is deposited by CBP/p300, which is upregulated in AD (Fig. 1d), while H3K9ac and H3K4ac are deposited by GCN5, which together with TRRAP (upregulated in AD – Fig. 1d) is part of the SAGA/ATAC complexes. Comparison of histone PTM changes across Younger, Old and AD (Fig. 2d–f) underscored that several histone methylation sites changed in both aging and disease (Fig. 2d) (i.e. H4K20me2 and HK20me3), while the H3 acetyl marks gained in AD did not change significantly with age (Fig. 2e,f). Interestingly, H3.3 levels, a histone variant abundant in non-dividing cells55–57, remained stable across Younger, Old and AD (Fig. 2g).
Overall the proteomic analyses reveal discrete histone PTM changes in AD, and specifically uncover increased H3K27ac and H3K9ac. These results are consistent with increased expression of genes encoding CBP/p300 and TRRAP (Fig. 1), and suggest functional relevance for H3K27ac and H3K9ac-driven pathways in AD.
Dynamic epigenomic changes in AD, with H3K27ac and H3K9ac gains and H3K122ac losses
Given that the transcriptomic and proteomic analyses pointed to a specific role for H3K27ac and H3K9ac gains and their modifiers in AD, we performed ChIP-seq to investigate the dynamics of these PTMs. We included H3K122ac and H3K4me1 as additional marks of enhancers58,59, and profiled 5-hydroxy-methylcytosine (5hmC)60 which is highly abundant in the brain and is also enriched at enhancers61,62 (Supplementary Table 2). ChIP-seq peaks were called for individual histone PTMs in the Younger, Old and AD samples (MACS2; FDR < 1 × 10⁻²) by pooling reads across samples of the same study group (Supplementary Tables 6–7). Reads from individual patients were used to assess the statistical significance of peak enrichment differences between groups (Methods section). In order to further reduce potential confounding variables, such as those due to changes in cell-type proportions, the top 10% of peaks with highest Pearson’s correlation with sample neuron fraction were masked from the analysis (neuron fractions were measured by flow cytometry of NeuN-stained nuclei17). This step was included to improve the accuracy of the analysis despite having excluded cases with severe neuronal loss from the selection, as discussed above.
H3K27ac, H3K9ac and H3K122ac peaks were detected at both transcriptional start sites (TSS) (≤ 1 kb from TSS – low H3K4me1 and 5hmC) and enhancers (> 1 kb from TSS – high H3K4me1 and 5hmC) in Younger, Old and AD (Extended Data Fig. 3)51,52,59,63. H3K122ac peaks were enriched closer to the TSS (≤ 5 kb), while H3K27ac and H3K9ac peaks were enriched further away (> 5 kb from TSS) (Extended Data Fig. 4a). Peak overlap analysis showed that at least 35% of the three acetyl-peaks overlapped (Extended Data Fig. 9B), but that there were also acetyl-mark-specific peaks such as at enhancers (Extended Data Fig. 4b–d). Analysis of 5hmC enrichment revealed a positive linear correlation with peak acetylation at enhancers and gene expression at gene bodies (Supplementary Note 4 and Supplementary Fig. 6).
Analysis of histone acetyl PTM changes between AD and Old (on a per acetyl-mark-basis) (Fig. 3a–c), revealed a higher number of H3K27ac and H3K9ac peaks with significant gains in acetylation than losses in AD (Fig. 3d,e): 3.8K peaks with H3K27ac gains vs. 2.8K with losses in AD (Fig. 3d) and 3.2K peaks with H3K9ac gains vs. 1.9K losses in AD (P < 0.05, two-sided Wilcoxon rank-sum test) (Fig. 3e). In contrast, an opposite trend was detected for the H3K122ac changes, that is, a higher number of H3K122ac peaks with significant acetylation losses (5.5K) than gains (1.6K) in AD (P < 0.05, two-sided Wilcoxon rank-sum test) (Fig. 3f). The higher number of H3K27ac and H3K9ac peaks with acetylation gains in AD is consistent with the proteomic results of increased H3K27ac and H3K9ac in AD (Fig. 2). The preferential losses of H3K122ac in AD, not observed in the proteomic analysis, could represent redistribution of H3K122ac enrichment in the genome, without change in overall histone mark abundance.
Figure 3. H3K27ac and H3K9ac disease-specific gains and H3K122ac disease-specific losses in AD.
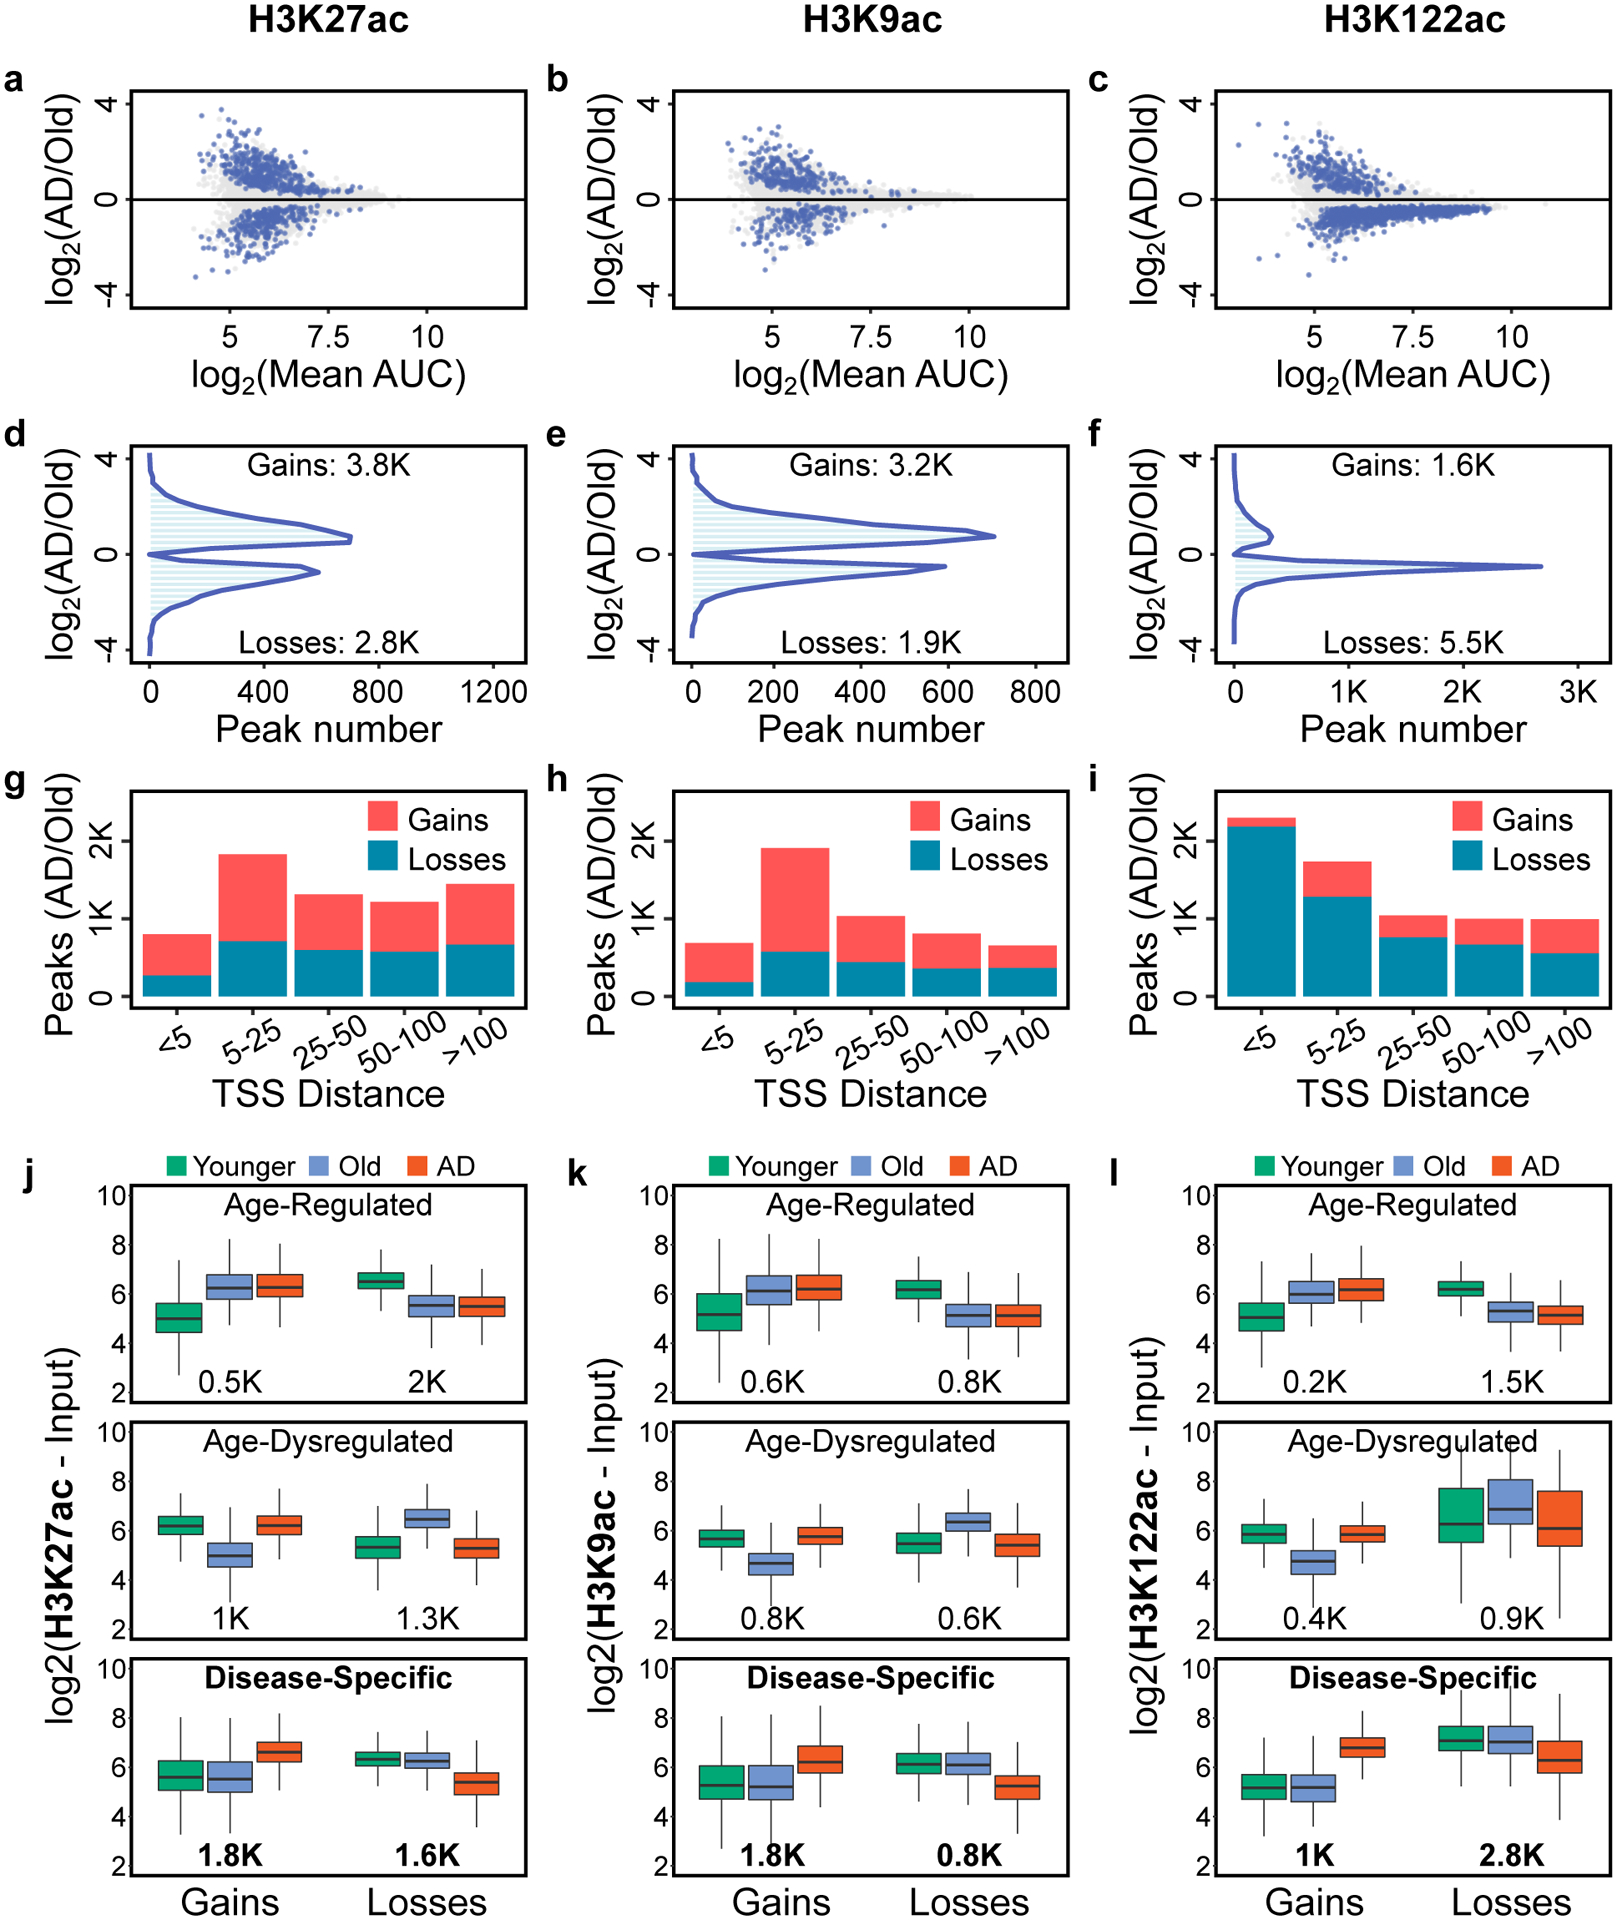
(a-c) Scatterplot showing peak fold-change vs. mean peak enrichment (measured as AUC, area under the curve) for (a) H3K27ac, (b) H3K9ac and (c) H3K122ac peaks in the AD vs. Old comparison. Blue dots represent peaks with significant changes (P < 0.05, two-sided Wilcoxon rank-sum test). For graphical representation, 10K randomly chosen points are shown in each panel. (d-f) Histogram showing peak fold-change vs. number of peaks with significant changes (blue dots in panels a-c) for (d) H3K27ac, (e) H3K9ac and (f) H3K122ac peaks in the AD vs. Old comparison (P < 0.05, two-sided Wilcoxon rank-sum test). (g-i) Stacked barplot showing number of (g) H3K27ac, (h) H3K9ac and (i) H3K122ac peaks with significant changes in AD vs. Old (P < 0.05, two-sided Wilcoxon rank-sum test) and their distance from the TSS (kb). (j-l) Boxplot showing (j) H3K27ac, (k) H3K9ac and (l) H3K122ac peak enrichment in Younger (N = 8–9), Old (N = 10) and AD (N = 9–11) (Supplementary Table 2), for peaks that belong to the six classes of changes identified in AD (Age-regulated gains or losses; Age-dysregulated gains or losses and Disease-specific gains or losses) (P < 0.05, 1-way ANOVA). The number of peaks in each class is reported below the boxplots. Disease-specific changes are the predominant class of changes for all three histone marks. Boxplots show minimum, first quartile, median (center line), third quartile and maximum.
Analysis of the distribution of peaks with acetylation changes relative to their distance from the closest TSS (Fig. 3g–i) showed that H3K27ac or H3K9ac changes were enriched > 5 kb from the TSS (Fig. 3g,h), while H3K122ac changes were enriched closer to TSS (≤ 5 kb) (Fig. 3i).
There was a significant positive linear correlation between gene expression and acetylation of the closest peak (on a per acetyl mark-basis) in both Old and AD (r = 0.40–0.43; P < 2.2 × 10⁻¹⁶) (Extended Data Fig. 5a–f). We also found a significant positive linear correlation between the amplitude of gene expression changes (q < 0.05, DESeq2) and corresponding H3K27ac (r = 0.16; P < 3.2 × 10⁻⁵) and H3K9ac (r = 0.13; P < 5.1 × 10⁻⁴) changes in AD vs. Old (Extended Data Fig. 5g–h). When considering the total acetylation level at each site (by summing H3K27ac, H3K9ac and H3K122ac enrichments), there was a higher correlation with gene expression than when considering individual acetyl marks (Extended Data Fig. 5j–l), suggesting that the three marks cooperate in regulating gene expression.
After detecting preferential H3K27ac and H3K9ac gains and preferential H3K122ac losses in AD, we investigated how these changes related to the normal aging profile. For each histone PTM, we cross-compared peak enrichment in Younger, Old and AD (a 3-way comparison), and classified the significant changes (P < 0.05, 1-way ANOVA) into three major classes: Age-regulated [gains or losses with aging (Old vs. Younger) but not in disease (AD vs. Old)]; Age-dysregulated (gains or losses with aging and in disease); and Disease-specific (gains or losses with disease but not in aging) (Fig. 3j–l). All three acetyl PTMs were preferentially enriched with disease-specific changes (peak numbers listed in Fig. 3j–l). Notably, H3K27ac and H3K9ac changes had predominant disease-specific gains (1.8K gains vs. 1.6K losses for H3K27ac, and 1.8K gains vs. 0.8K losses for H3K9ac) (Fig. 3j,k), whereas H3K122ac had predominant disease-specific losses (2.8K losses vs. 1K disease-specific gains) (Fig. 3l). Analysis of the H3K4me1 changes, revealed preferential disease-specific losses in AD (Supplementary Note 5, Supplementary Fig. 7). Furthermore, comparison of the three acetyl PTMs at sites with disease-specific changes for each modification revealed that they trended in the same direction of change (Extended Data Fig. 6a–f). H3K4me1, which is a mark of enhancers51, was also reduced at the sites with acetylation losses (Extended Data Fig. 6d–f). Decreased H3K4me1, in addition to acetylation, indicates a further and more profound remodeling of the losses vs. gains in AD. Notably, because the gains do not involve methylation changes, it implies that they may be amenable targets of epigenetic drugs.
Taken together, the 3-way analysis confirmed the trends observed by comparing AD vs. Old, and, importantly, identified changes specifically associated with disease.
H3K27ac and H3K9ac disease-specific gains associate with transcription, chromatin and disease pathways
Given the predominance of H3K27ac and H3K9ac disease-specific gains and H3K122ac disease-specific losses in AD, we investigated the functional pathways associated with these changes. Gene Ontology analysis (GO) using GREAT (v3.0.0)64 was used to consider genes within 100 kb from the disease-specific gains or losses, for distant regulatory elements such as enhancers. Genes associated with H3K27ac or H3K9ac disease-specific gains had top GO terms related to transcription (for H3K27ac) (Fig. 4a,d) and nuclei acid metabolic processes (for H3K9ac) (Fig. 4b,e) (FDR < 5%). Other top GO terms (for the H3K27ac) included “leukocyte differentiation” and “Wnt signaling pathway”, which are involved in neurodegeneration65–67 (Supplementary Table 8). Given that the RNA-seq analysis indicated a role for transcription and chromatin genes in AD (Fig. 1), it was remarkable that we found similar categories associated with H3K27ac and H3K9ac disease-specific gains.
Figure 4. H3K27ac and H3K9ac disease-specific gains are associated with epigenetic- and disease-related pathways in AD.
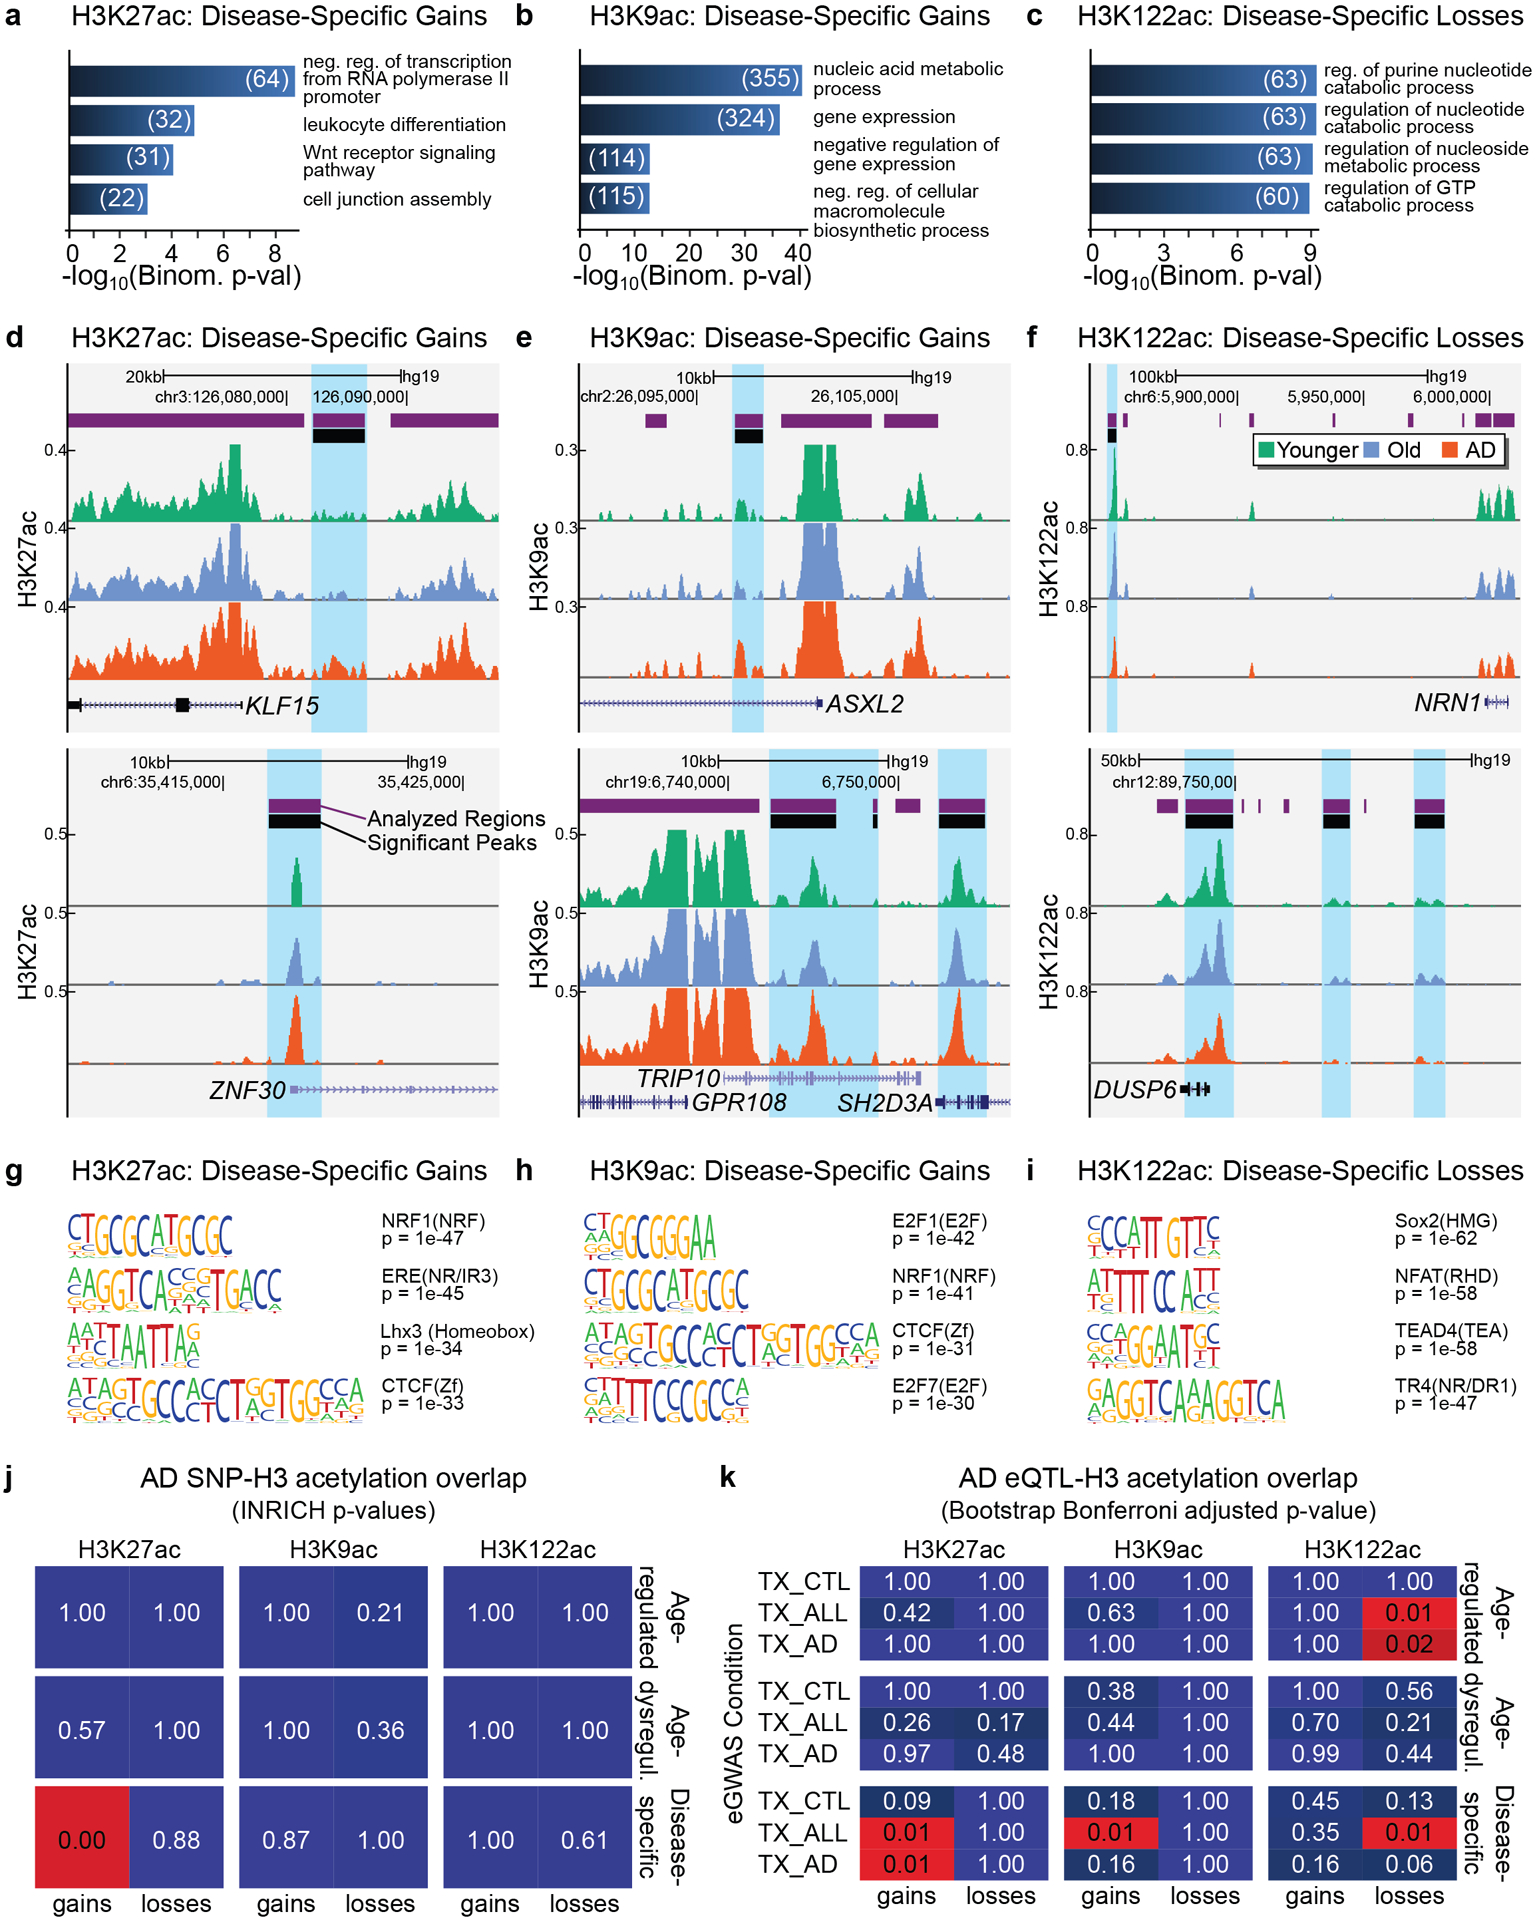
(a-c) Barplot showing top GO terms (Biological Processes; GREAT, FDR < 5% by both the binomial and the hypergeometric tests) for (a) H3K27ac disease-specific gains, (b) H3K9ac disease-specific gains and (c) H3K122ac disease-specific losses (n genes per term ≥ 20). The number of genes in each term is also reported. (d-f) UCSC ChIP-seq tracks showing examples of (d) H3K27ac disease-specific gains, (e) H3K9ac disease-specific gains and (f) H3K122ac disease-specific losses in AD. (g-i) Top DNA motifs (HOMER v4.6) for (g) H3K27ac disease-specific gains, (h) H3K9ac disease-specific gains, (i) H3K122ac disease-specific losses. Enrichment results are shown for known motifs (q < 0.05, Benjamini) (j) Heatmap showing the significance by INRICH (adjusted P values) of the association between AD-SNP regions and the six classes of H3K27ac, H3K9ac and H3K122ac changes. (k) Heatmap showing Bonferroni adjusted P values for sampling-based analysis for the overlap of each of the six classes of H3K27ac, H3K9ac and H3K122ac changes with temporal cortex (TX) eQTLs from Zou et al.87. eQTLs were split into those from AD cases (TX_AD), non-AD but with other neuropathologies (TX_CTL), and combined conditions (TX_ALL).
Inspection of histone acetylation at the 75 transcription- and chromatin-related genes upregulated in AD (from Fig. 1d) showed H3K9ac disease-specific gains at CREBBP (Extended Data Fig. 7a–c) but not at EP300 (Extended Data Fig. 7d–f). This suggests a potential positive feedback loop where H3K9ac gain at CREBBP increases CBP expression, thus promoting histone-acetylation in the AD epigenome. GO analysis of the H3K122ac disease-specific gains did not result in any significant functional category, suggesting no specific role in AD.
GO analysis of H3K122ac disease-specific losses revealed top terms related to purine/GTP catabolic processes (Fig. 4c), including the DUSP6 gene (Fig. 4f), whose protein levels are known to be reduced in AD68. Analysis of H3K27ac and H3K9ac disease-specific losses revealed top terms related to neuronal death and immunity (for H3K27ac) (Extended Data Fig. 8a,c), and synaptic transmission and cell-cell signaling (for H3K9ac) (Extended Data Fig. 8b,d) (Supplementary Table 8). GO analysis using DAVID (v6.7) confirmed the GREAT results including transcriptional regulation in the top terms for the H3K27ac and H3K9ac disease-specific gains (Extended Data Fig. 9 and Supplementary Table 9).
DNA motif enrichment analysis of sites with H3K27ac or H3K9ac disease-specific gains using HOMER (v4.6)69 revealed enrichment for the transcription factors NRF1 and CTCF (Fig. 4g,h). NRF1 regulates mitochondria genes, cell cycle, and DNA damage response70,71, while CTCF is a chromatin architecture and insulator factor72,73. Among other top DNA motifs for H3K9ac gains are E2F1, involved in cell-proliferation and apoptotic processes, and E2F7 (Fig. 4h), involved in cell-cycle progression and DNA damage response74–79. Cell-cycle reactivation coupled to apoptosis has been implicated in AD25 and thus remodeling of the epigenome with upregulation of chromatin genes could mediate this process. In contrast, analysis of the H3K122ac disease-specific losses revealed top motifs for transcription factors involved in neuronal processes, immune response and oxidative stress80–82 (Fig. 4i), indicating a different role of the H3K122ac losses in AD.
We compared our epigenomic results to published epigenomic studies of other brain regions affected by tau pathology15,18,19 (Supplementary Notes 6–7). These analyses revealed that H3K27ac and H3K9ac changes correspond to similar changes in other brain regions affected by AD (Supplementary Figs. 8–9) and identified histone acetyl changes that overlapped with CpG methylation associated with AD (Supplementary Tables 10–11). In contrast, epigenomic comparison with mouse models of AD showed modest overlap (Supplementary Note 8 and Supplementary Fig. 10).
These epigenomic analyses identified H3K27ac and H3K9ac disease-specific gains associated with both epigenetic- and disease-related pathways, supporting a role for aberrant epigenetic activation in AD.
H3K27ac disease-specific gains are enriched in AD SNPs and eQTLs
Genome-wide association studies (GWAS) of single-nucleotide polymorphisms (SNPs) have revealed over 20 loci linked to AD83,84. These SNPs may pinpoint regions involved in AD with which they are in linkage disequilibrium, or themselves could harbor regulatory elements participating in disease. We considered the overlap between the six classes of epigenetic changes identified by the 3-way analysis (Fig. 3j–l) and the AD-associated SNPs. We used a curated list of AD-associated SNPs (P < 1 × 10⁻⁵) from the IGAP meta-analysis study which passed two stages of clinical testing and involved > 74K subjects83. SNPs in linkage disequilibrium were merged using PLINK. INRICH analysis85 revealed a significant overlap between the AD SNPs and the H3K27ac disease-specific gains (P < 2 × 10⁻⁴) (Fig. 4j) (Supplementary Table 12). This result was confirmed when performing INRICH using data from the newest IGAP meta-analysis study84 (H3K27ac disease-specific gains P = 0.01) (Extended Data Fig. 10).
To further explore the relationship between epigenetic changes and genetic risk variants in AD, we considered the overlap with AD-associated expression quantitative trait loci (eQTLs). eQTLs are SNPs that correlate with gene expression and represent potential gene regulatory elements86. We used a highly powered dataset87 with ~400 subjects, containing eQTLs from temporal cortex of AD cases (TX_AD) (eQTL n = 85,359), eQTLs from non-AD cases (other types of dementia) (TX_CTL) (eQTL n = 156,134), and the two combined (TX_ALL) (eQTL n = 156,134). The imputation scheme of this dataset (HapMap2) allowed analysis of more SNPs for eQTL activity. By performing the overlap analysis, we found a significant enrichment of H3K27ac disease-specific gains for TX_AD and TX_ALL eQTLs (TX_AD P =1.08 × 10⁻²; TX_ALL P = P =1.08 × 10⁻²) and of H3K9ac disease-specific gains for TX_ALL eQTLs (P =1.08 × 10⁻²) (Fig. 4k). We also found a significant enrichment between H3K122ac disease-specific losses and TX_ALL eQTLs, as well as H3K122ac age-regulated losses and TX_AD and TX_ALL eQTLs (TX_AD P =2.16 × 10⁻²; TX_ALL P = P =1.08 × 10⁻²) (Fig. 4k and Supplementary Table 13). The enrichment of the acetyl peaks with both TX_AD and TX_ALL eQTLs suggests that they harbor regulatory elements involved in AD and more general neurodegenerative processes, while enrichment for TX_ALL implies involvement only with general neurodegenerative processes, but not AD specifically.
Overall, the enrichment of disease-specific changes, and particularly of H3K27ac disease-specific gains, with AD GWAS SNPs and eQTLs underscores their potential involvement in AD.
Increase of H3K27ac and H3K9ac promotes Aß42-induced neurodegeneration in vivo
These dynamic epigenetic changes in AD brains prompted us to examine functional interactions between H3K27ac and H3K9ac and AD-associated pathologies. We explored whether manipulating H3K27ac and H3K9ac levels in a Drosophila model could modulate amyloid-ß42 (Aß42) toxicity88. Because manipulation of CBP can lead to broad phenotypic effects due to numerous non-histone target substrates89,90, we instead manipulated individual histone residues and determined the effect of expression of the altered histones on Aß42 toxicity.
To manipulate histone PTM levels, we utilized Drosophila lines expressing histone H3.3 with either a lysine-to-methionine substitution at lysine 27 (H3.3K27M) or a lysine-to-methionine substitution at lysine 9 (H3.3K9M)91 (Supplementary Table 14). Expression of H3.3K27M globally reduces H3K27me3 and increases H3K27ac, while expression of H3K9M reduces H3K9me3 and increases H3K9ac91. Expression of H3.3K27M or H3.3K9M enhanced Aß42-induced eye degeneration (Fig. 5a,b), while expression of the mutant histones on their own, or wild-type H3.3 alone, had no significant effect on the eye (Supplementary Fig. 11). Given our focus on CBP, which modulates H3K27ac in Drosophila92, we expanded the analysis to additional substitutions: H3.3K27Q to mimic acetylation93, and H3.3K27A to change the lysine to a small non-polar amino acid which mimics absence of acetylation. We found that expression of H3.3K27Q exacerbated Aß42 eye toxicity consistent with our previous data, whereas H3.3K27A, as predicted, had no effect (Fig. 5a,b).
Figure 5. Increased H3K27 and H3K9 acetylation enhances Aβ42 toxicity in Drosophila.
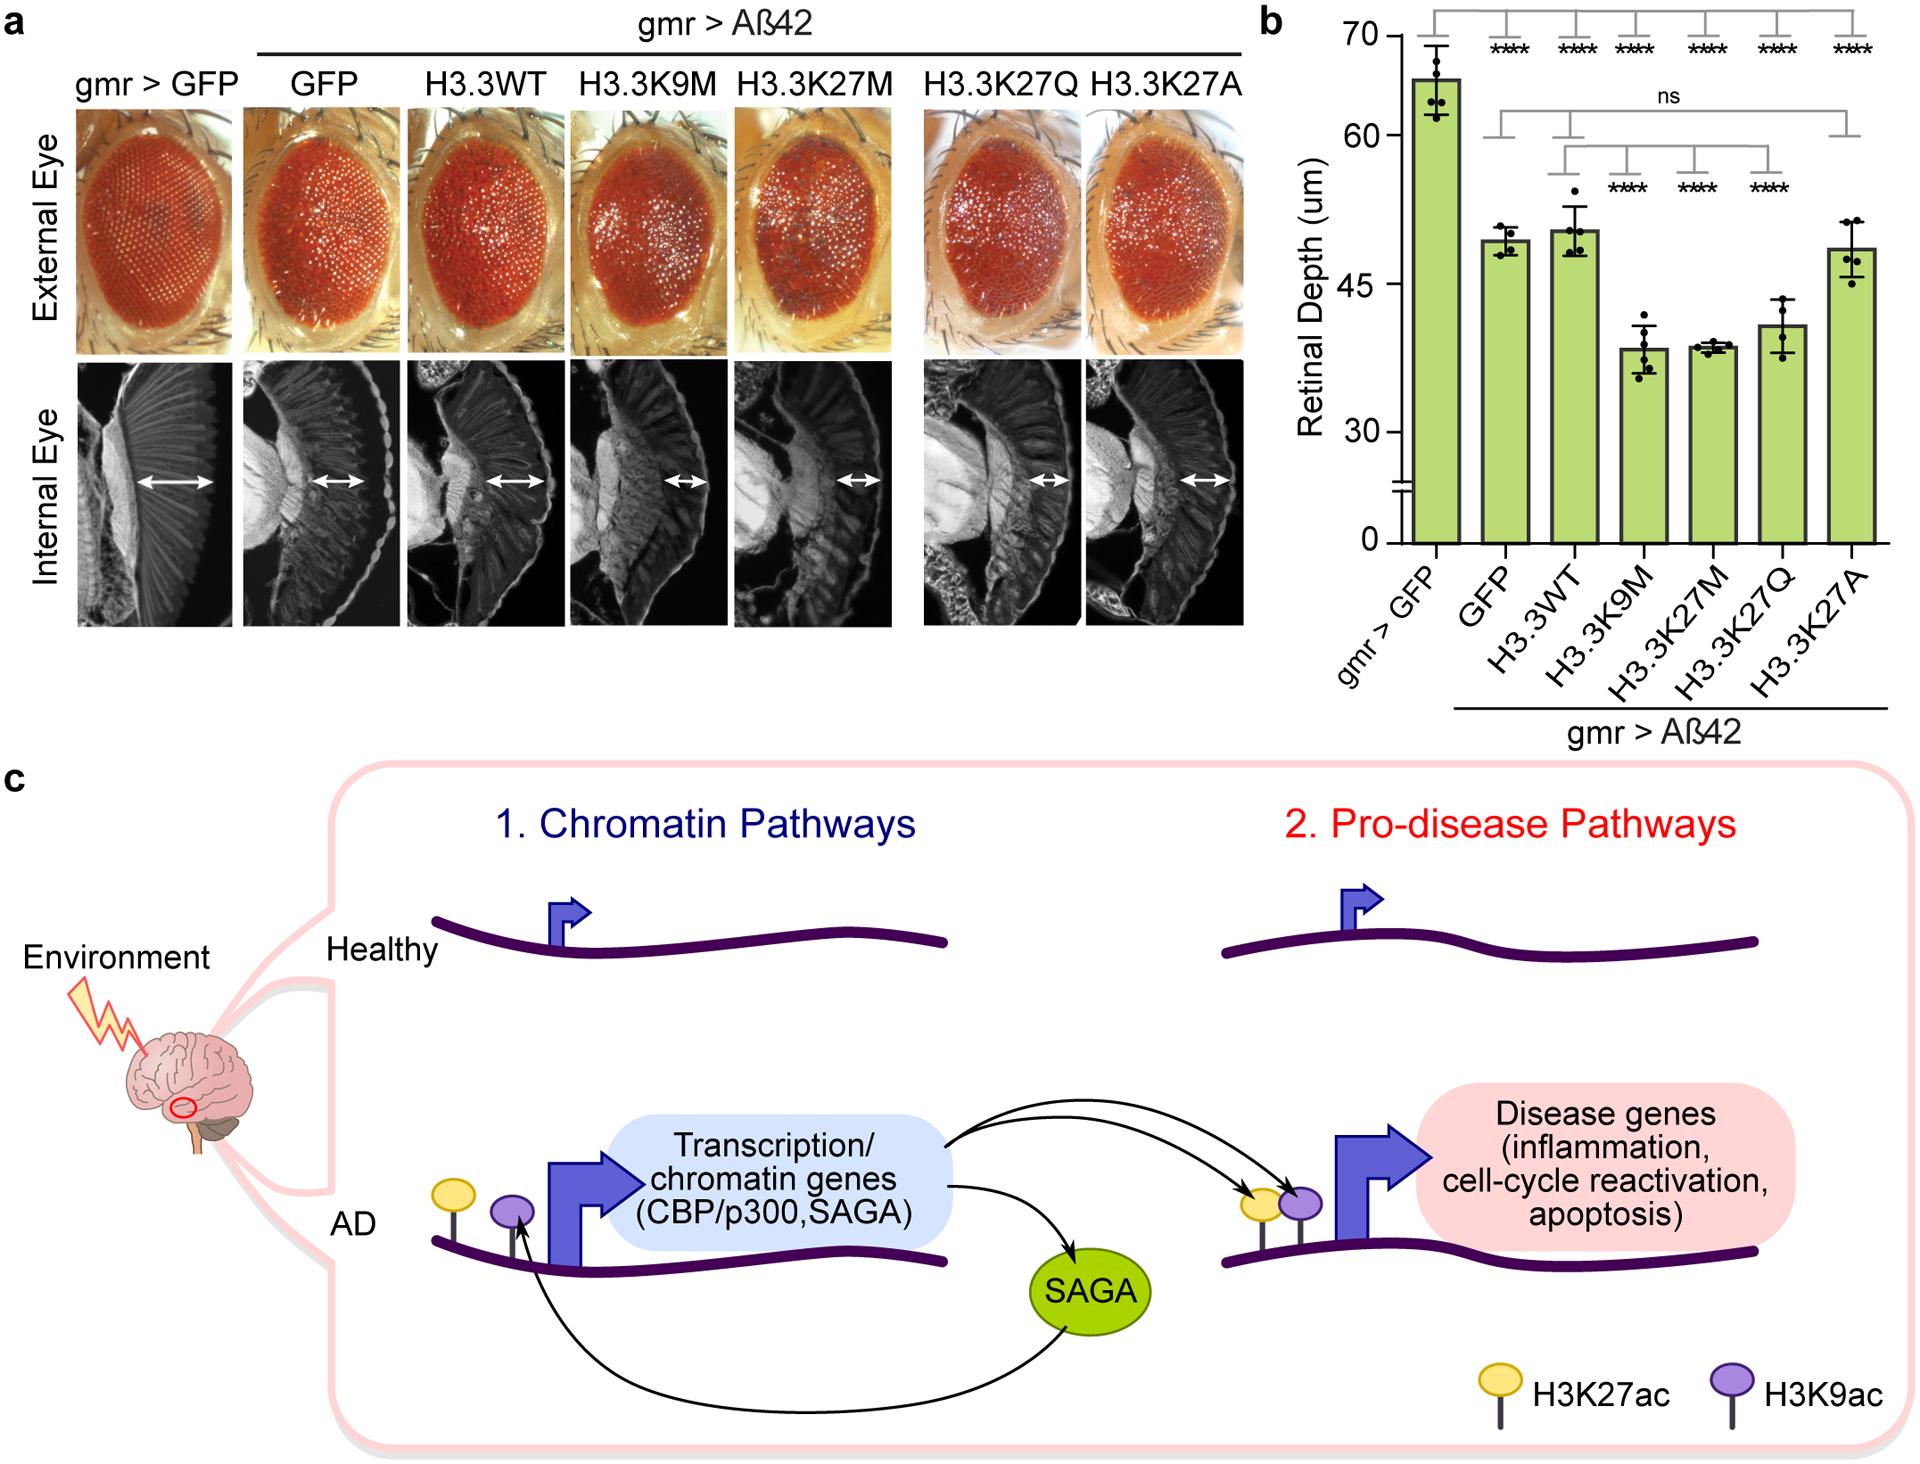
(a) Drosophila eye showing that histone mutants H3.3K9M (lysine (K) to methionine (M) mutation at residue 9), H3.3K27M (K to M mutation at residue 27) and H3.3K27Q (K to glutamine (Q) mutation at residue 27) independently enhance Aβ42 toxicity both in external (top) and internal eye tissue (bottom). Histone mutant H3.3K27A (K to alanine (A) mutation at residue 27) has no effect on Aβ42 toxicity. Expression of H3.3K27M and HK9M globally increase H3K27ac91, while H3.3K27Q mimics acetylation93, and H3.3K27A mimics absence of acetylation (Supplementary Table 14 for fly genotypes). (b) Barplot (with individual data points) represents mean ± SD of internal retinal depth in N = 4–6 individual animals per genotype (**** P < 0.0001, 1-way ANOVA (F (6, 28) = 83.24) with Tukey’s multiple comparisons test. Aß42+GFP vs: Aß42+H3.3WT (P = 0.9962); Aß42+H3.3K27A (P = 0.9987). Aß42+H3.3WT vs: Aß42+H3.3K9M (P = 2.3771 × 10⁻⁷); Aß42+H3.3K27M (P = 7.8390 × 10⁻⁷); Aß42+H3.3K27Q (P = 6.9131 × 10⁻⁵)). (c) Model of aberrant activation of chromatin and pro-disease pathways in AD. Increased H3K27ac and H3K9ac (by CBP/p300 and SAGA) drive activation of chromatin (left) and pro-disease pathways (right) in AD. Increased expression of transcription and chromatin genes (left), including CBP/p300 and TRAPP in the SAGA complex (left), may be upstream and reinforce activation of pro-disease pathways. H3K9ac at CREBBP (potentially by SAGA) leads to a positive feedback loop of sustained CBP expression and downstream histone acetylation in the AD epigenome. Environmental stressors may be upstream the activation of chromatin pathways.
These functional data of Aß42 toxicity worsened by increased H3K27ac and H3K9ac further indicate that gains in H3K27ac and H3K9ac are central players in AD.
Discussion
We report a combined multi-omic analysis of Alzheimer’s affected brains, which uncovered epigenomic alterations associated with AD.
Our transcriptomic analyses of Younger, Old and AD, revealed upregulation of transcription- and chromatin-related genes in AD, including the histone acetyl transferases CBP/p300 and TRAPP (component of the SAGA complex), which mediate H3K27ac and H3K9ac, respectively (Fig. 1). Studies of CBP in animal models point to CBP requirement for memory-related processes94–96. Studies of p300 in neurodegeneration models show that p300 acetylates tau and promotes its aggregation97, thus revealing a pro-disease role for p300, although uncoupled from its chromatin-related function. A proteomic analysis revealed striking increases of H3K27ac and H3K9ac in AD (Fig. 2). Genome-wide analyses of H3K27ac and H3K9ac together with H3K122ac, H3K4me1, revealed predominant H3K27ac and H3K9ac disease-specific gains in AD (Fig. 3) which were associated with functional categories related to transcription and chromatin genes (Fig. 4). Dysregulation of epigenetic pathways, also highlighted by the RNA-seq changes, may be upstream of activation of pro-disease pathways in AD (model in Fig. 5). H3K9ac disease-specific gains at CREBBP (probably by SAGA) indicated a potential positive feedback loop, promoting sustained CBP expression in AD and consequent H3K27ac. We underscore that previous AD studies did not identify aberrant epigenetic activation as a functional pathway in AD, likely because of the lack of comparison between the disease state and healthy brain aging18.
In contrast to these gains, analysis of H3K122ac, deposited by a different HAT98, revealed preferential disease-specific losses associated with different functional pathways. This comparison highlights the complexity of the AD epigenome, where different histone acetyl modifications drive different functional pathways. Our previous findings17 of H4K16ac protective pathways in AD, further highlights this scenario. As is the case with cancer, where a multistep process selects for inactivation of tumor suppressors followed by activation of oncogenes, it is possible that in AD, inactivation of protective pathways (such as H4K16ac-driven17) is followed by activation of pro-disease pathways (such as H3K27ac- and H3K9ac-driven). The dynamic trend of histone acetylation uncovered in AD suggests that the use of general HDACi might not be effective. Indeed, increases of H3K27ac and H3K9ac in a fly model of AD promoted Aß42-induced neurodegeneration (Fig. 5a) confirming a negative effect of increased acetylation. Enrichment of H3K27ac disease-specific gains for AD SNPs and eQTLs (Fig. 4j,k) further support a role for H3K27ac gains in AD.
Overall, these multi-omic analyses have identified H3K27ac and H3K9ac as potential epigenetic drivers of AD, which spur disease pathways through dysregulation of transcription and chromatin gene feedback loops. Importantly, these findings are confirmed when comparing our data to published datasets performed on other brain regions of AD18,19. Given the several pathways in which CBP and p300 are involved, approaches aiming to epigenetically inactivate pro-disease pathways and activate/reinforce protective pathways may be a promising therapeutic strategy for AD. Our findings provide mechanistic insights on AD progression and highlight alternative avenues for potential intervention.
Methods
Brain tissue samples
Postmortem human brain samples from lateral temporal lobe (Brodmann area 21 or 20) were obtained from the Center for Neurodegenerative Disease Research (CNDR) brain bank at the University of Pennsylvania (Penn). Informed consent for autopsy was obtained for all patients and it was approved by the Penn Institutional Review Board (Penn IRB). The CNDR autopsy brain bank protocols were exempted from full human research (research on tissue derived from an autopsy is not considered human research – see https://humansubjects.nih.gov/human-specimens-cell-lines-data). A detailed description of the brain bank standard operating procedures has been reviewed elsewhere99. A neuropathological diagnosis of AD was established based on the presence of plaques and tangles using the CERAD scores and Braak stages, respectively100,101. The CERAD plaque score assesses the burden of neuritic plaques (0 and A-C in order of increasing frequency) in the neocortex. The Braak staging is based on the progression of neurofibrillary tangles from the transentorhinal cortex (stage I) to widespread neocortical pathology including primary visual cortex (stage VI).
Selection of brain tissue samples
The brain tissue samples were selected based on the presence of plaques and neurofibrillary tangles using the CERAD scores and Braak stages, respectively100,101. All selected AD cases had high level of AD neuropathological changes (Braak = V/VI and CERAD = C; Supplementary Table 1). The Younger and Old control brains had no or minimal neuritic amyloid plaques (Braak = 0 or I/II) or neurofibrillary tangles (CERAD = 0). None of the AD cases had other coincident neurodegenerative diseases. Control subjects had no deposits consistent with a frontotemporal lobar degeneration or Lewy body related pathology diagnosis. Samples were also controlled for gender (mainly male subjects), neuronal loss (excluding cases with severe loss) and postmortem interval (≤ 24 hr). The neuronal loss was assessed through semi-quantitative measurements by hematoxylin and eosin (H&E) staining by board-certified neuropathologists of the CNDR. The H&E scoring for neuronal loss ranges from 0–3 where 0 signifies no neuronal loss and 3 is severe neuronal loss. Only cases with neuronal loss of 1 or 2 (mild or moderate) were included. In addition, neuron fractions were measured for each sample by flow cytometry of NeuN stained nuclei and used for ChIP-seq analysis.
RNA-seq analysis
RNA-seq data were previously generated and processed for the same brain samples (lateral temporal lobe) analyzed in this study17. Briefly, total RNA was isolated using the RNAeasy Mini kit (Qiagen) and treated with RNase-free DNase step (Qiagen). Ribosomal RNA was removed using the rRNA Depletion kit (NEB) and multiplexed RNA-seq libraries were generated using the NEBNext Ultra Directional RNA library Prep Kit for Illumina (NEB). Libraries were sequenced (75 bp, single-end) on a NextSeq 500 platform (Illumina) in accordance with the manufacturer’s protocol.
RNA-seq reads were aligned to the human reference genome (assembly GRCh37.75/hg19) using STAR with default parameters. FeatureCounts was used to generate a matrix of mapped fragments per RefSeq annotated gene. Analysis for differential gene expression between AD and Old was performed using DESeq2 R package with FDR < 0.05.
For correlation between ChIP-seq and RNA-seq data, DESeq2 normalized read count over each gene was normalized by per kb of gene length and then transformed to log2 (“log2[Count+1]”, where “Count” is the average read count of each study group). Acetyl peaks were then linked to the nearest annotated gene in the RefSeq database.
To account for changes in neuronal fractions, we fitted a linear regression model of neuronal fractions and used the residual as the normalized RefSeq read counts. Neuronal fractions were previously measured in individual samples by Flow Cytometry analysis of NeuN-stained nuclei17.
RNA-seq with ERCC spike-in controls
In order to control for potential transcriptional changes at the global level, RNA-seq was repeated with the addition of ERCC (External RNA Controls Consortium) spike-in controls (Thermo Fisher, #4456740) per manufacturer recommendation. Briefly, RNA isolated from the same amount of tissue was spiked with the ERCC Spike-In Mix (equal quantities) and subject to ribosomal RNA removal and sequencing library preparation, as above. Libraries were sequenced (75 bp, single-end) on a NextSeq 550 platform (Illumina) in accordance with the manufacturer’s protocol.
RNA-seq reads (including ERCC spike-in controls) were aligned to the human reference genome (assembly GRCh37.75/hg19 concatenated with the sequence of the ERCC transcripts) using STAR with default parameters. Only alignments with mapping score MAPQ of 10 and above were retained. Read counts for the ERCC spike-in transcripts were counted using samtools idxstat function. FeatureCounts was used to generate a matrix of mapped fragments per RefSeq annotated gene. RefSeq read counts were normalized with ERCC transcripts as the negative controls using RUVg R package102.
GSEA (version 4.0.3) analysis was performed using the genes upregulated or downregulated (q < 0.05) in AD vs. Old and the gene expression of the same genes in AD and Old after ERCC spike-in normalization, or after normalization for changes in neuronal fractions. Default metric for ranking genes with the signal-to-noise ratio and default weighted scoring scheme were used for this analysis.
String analysis
STRING (version 11)37 analysis was performed to identify possible interaction networks among the genes upregulated in AD. Threshold for confidence was set to medium. STRING networks were visualized with Cytoscape (version 3.6)103 where node size represents gene expression in AD, color intensity represents gene expression change of AD vs. Old and the thickness of lines represents the strength of the STRING interaction.
Comparison to published RNA-seq
RNA-seq data were downloaded from Synapse’s AMP-AD Knowledge Portal for the Mount Sinai Brain Bank (MSBB) (syn16795934, RNA-seq of tissue from Brodmann area 22, with expression values adjusted for sex, race, age, RIN #, post-mortem interval, exon rate, rRNA rate, and batch effects) and the Mayo Clinic (syn6126176, RNA-seq of tissue from temporal cortex, with CPM expression values as reported in TCX Gene Counts). MSBB patients were deemed to have AD with a neuropathology scoring of 2 or 3 while patients with a score of 1 were grouped as Controls per the clinical annotation provided by MSBB. Mayo Clinic patients were called AD or Control depending on the diagnosis given by the Mayo Clinic study (TCX covariates).
Decile plots were assessed by averaging gene expression scores from all patients across study groups and dividing the genes into 10 tiers by average expression in the published data sets. Box-and-whiskers were then assessed for this study’s RNA-seq data in the tiered genes. Heatmaps were created by standardizing expression values for all genes (z-scores); no patient or gene clustering was performed. Box-and-whisker plots for individual genes were created to show the distribution of expression scores between AD and control patients in the published data sets; significance was assessed using Mann-Whitney rank-sum tests.
Comparison to published microarray data
Table S1 from Blalock et al.104 was filtered for genes in the list of 75 chromatin genes upregulated in AD in our data. The resulting table gives the Pearson’s correlation coefficient of gene expression in laser-capture microdissected hippocampus from patients with varying degrees of AD pathology to two indexes for pathology severity, the MMSE and the NFT scores. Correlation coefficients (r) from the filtered table are presented in the column plot in Supplementary Fig. 1f.
Histone PTM preparation and analysis by mass spectrometry
Histone PTM preparation and analysis by mass spectrometry were performed as previously described105. Briefly, nuclei were isolated from 100 mg frozen brain tissue (lateral temporal lobe) and histones extracted with 0.2 M H2SO4 for 2 hr and precipitated with 33% trichloroacetic acid (TCA) overnight. The pellets, containing histone proteins, were dissolved in 30 μl 50 mM NH4HCO3 (pH 8.0). Two rounds of histone derivatization were performed by mixing the histone samples with propionic anhydride and acetonitrile (previously mixed in a ratio of 1:3 (v/v)) in the ratio of histone samples to mix of 1:4 (v/v) for 20 min at room temperature (RT). Histones were then digested with trypsin (trypsin to sample ratio 1:20) in 50 mM NH4HCO3 for 6 hours at RT. The derivatization procedure was repeated after digestion to derivatize peptide N-termini. Samples were desalted prior LC-MS analysis by using C18 Stage-tips.
Samples were run on a nanoLC-MS/MS setup. NanoLC was configured with a two-column system including a 100 μm ID × 2 cm trap column and a 75 μm ID × 25 cm analytical column mounted onto an Eksigent NanoLC-Ultra - 2D Plus. The HPLC gradient was as follows: 2% to 28% solvent B (A = 0.1% formic acid; B = 95% acetonitrile, 0.1% formic acid) over 45 min, from 28% to 80% solvent B in 5 minutes, 80% B for 10 minutes at a flow-rate of 300 nl/min. nLC was coupled to an Orbitrap Fusion Tribrid (Thermo Scientific). Data were acquired using a data-independent acquisition (DIA) method106. Specifically, a full scan MS spectrum (m/z 300−1,100) was acquired in the Orbitrap with a resolution of 120,000 (at 200 m/z) and an automatic gain control (AGC) target of 5 × 10⁵, or in the ion trap with an AGC target of 3×10⁴. MS/MS was performed with an AGC target of 3 × 10⁴ using an injection time limit of 30 or 60 msec. MS/MS was acquired using higher collision dissociation (HCD) with normalized collision energy of 27.
Data were analyzed using EpiProfile 2.045. EpiProfile extracts the ion chromatogram of the (un)modified histone peptides. The peptide relative ratio was calculated using the total area under the extracted ion chromatograms of all peptides with the same amino acid sequence (including all of its modified forms) as 100%. For isobaric peptides, the relative ratio of two isobaric forms was estimated by averaging the ratio for each fragment ion with different mass between the two species. Statistical regulation of histone marks was assessed by using a t-test (heteroscedastic, 2-tails). Statistical significance was assessed when P < 0.05.
ChIP-seq
ChIP-seq was performed as previously described17. Briefly, nuclei were isolated from 200 mg frozen brain tissue (lateral temporal lobe) by dounce homogenization in nuclei isolation buffer (50 mM Tris-HCl at pH 7.5, 25 mM KCl, 5 mM MgCl2, 0.25 M sucrose and freshly added protease inhibitors and sodium butyrate) followed by ultracentrifugation on a 1.8 M sucrose cushion. Nuclei pellets were resuspended and crosslinked in 1% formaldehyde for 10 min at RT, quenched with 125 mM glycine for 5 min and washed twice in cold PBS. 2 × 10⁶ nuclei were lysed in nuclei lysis buffer (10 mM Tris-HCl at pH 8.0, 100 mM NaCl, 1 mM EDTA, 0.5 mM EGTA, 0.1% Na-deoxycholate, 0.5% N-lauroylsarcosine and freshly added protease inhibitors and sodium butyrate and) and chromatin was sheared using a Covaris S220 sonicator to a final ~250 bp. Equal aliquots of sonicated chromatin were used per immunoprecipitation (IP) reaction with either 3 μl H3K27ac antibody (Abcam, #4729), or 5 μl H3K9ac antibody (Active Motif, #39137), or 3 μl H3K122ac antibody (Abcam, #33309), or 4 μl H3K4me1 antibody (Abcam, #8895) preconjugated to Protein G Dynabeads (Life Technologies). 10% of each IP was used for the Inputs. ChIP reactions were incubated overnight at 4°C followed by ChIP washes and DNA was eluted in elution buffer (1% SDS, 50 mM Tris-HCl pH 8, 10 mM EDTA) at 65°C. Eluted DNA from ChIP and Input samples was reverse crosslinked and purified using PCR columns (Qiagen). Five ng of ChIP and Input DNA was used to generate ChIP-seq libraries using the NEBNext Ultra DNA library prep kit for Illumina (New England Biolabs, NEB). Libraries were multiplexed using NEBNext Multiplex Oligos for Illumina (dual index primers) and sequenced (75 bp; single-end) on a NextSeq 500 platform (Illumina) in accordance with the manufacturer’s protocol.
ChIP-seq analysis
ChIP-seq analysis was performed as in Nativio et al.17 with modifications. Briefly, demultiplexed ChIP-seq tags (~20 million reads/sample per histone mark) were aligned to the human reference genome (assembly NCBI37/hg19) using Bowtie v1.1.1107 allowing up to two mismatches per sequencing tag (parameters -m 1 --best). Reads mapped to mitochondria or ENCODE blacklist regions were removed from the analysis. There were no statistically significant differences in sequencing coverage across the three study groups (H3K9ac P = 0.3; H3K27ac P = 0.84; H3K122ac P = 0.82; H3K4me1 P = 0.94; 1-way ANOVA). Peaks were detected for each histone acetyl mark and in each sample using MACS2 (broad parameters; FDR < 1 × 10⁻²) with treatment-matched Input tags as control, as well as in each study group (Younger, Old and AD) by pooling reads of samples belonging to the same group. Peaks detected in the three study groups were filtered for peaks that were called in at least one sample. Comparison of histone acetyl enrichment across the three study groups was done using The MTL method108. Briefly, MTLs were generated for each histone mark by merging peaks with 1 bp overlap across Younger, Old and AD. ChIP-seq signal in the MTL (unit: RPKM) was quantified for each individual sample using the Bwtool package (“bwtool summary”). In order to reduce the confounding variables due to changes in neuronal fractions across the samples, the top 10% MTLs with highest Pearson correlation with sample neuron fraction were masked from the analysis (neuron fractions for these samples were measured in our previous study17). In order to cross-compare the different histone acetyl marks, masked MTLs for each H3K27ac, H3K9ac and H3K122ac mark were merged into a union set of acetylation sites (called “multiMTL”), and ChIP-seq signal for each histone mark and each individual patient was evaluated for these multiMTL sites (signal is only accounted for over each histone mark’s own MTLs). ChIP-seq signal over multiMTL sites was log2 transformed for downstream analysis (“log2[RPKM+1]”). Statistical significance of differential enrichments was assessed by performing a Wilcoxon rank-sum test (two-sided) for pairwise comparisons between study groups or 1-way ANOVA for a comparison of all three study groups.
Genome browser tracks
Generation and visualization of ChIP-seq tracks was conducted as follows. For each individual sample and the three study groups (Younger, Old and AD; pooled reads of samples from the same group), tag pileup profiles (bedgraph files) were generated during MACS2 peak calling process to visualize signal per million reads (RPM). Treatment-matched input signal was subtracted from the pileup profiles using MACS2 (“bdgcmp”). Finally, bigWig files were generated using UCSC toolkit (“bedGraphToBigWig”) and uploaded on the UCSC Genome Browser.
Functional analysis
Gene Ontology (GO) analysis of genes differentially expressed between AD and Old (q < 0.05, DESeq2) was performed using DAVID (Database for Annotation, Visualization and Integrated Discovery; version 6.7)20. Significant GO terms (FDR < 10%) are reported for the Biological Process (BP) category. Functional analysis of genes targeted by H3K27ac, H3K9ac or H3K122ac peak changes (P < 0.05, 1-way ANOVA) was performed using GREAT (Genomic Regions Enrichment of Annotations Tool; version 3.0.0)64 and DAVID (version 6.7)20. For GREAT analysis, the “single nearest gene” rule was used to associate peaks to RefSeq genes (≤ 100 kb). Biological Process (BP) terms are reported and filtered by level of significance (FDR < 5%), by both the binomial test over genomic regions and the hypergeometric test over genes) and binomial fold enrichment (≥ 2). For DAVID analysis, each peak was linked to its nearest RefSeq gene, and genes with peaks at ≤ 100 kb were used for the analysis. Significant terms (FDR < 10%) for BP, Cellular Component (CC) and Molecular Function (MF) categories are reported in Supplementary Table 9. Statistical significance in DAVID is assessed with a modified Fisher’s exact test (EASE) and FDR correction by the Yekutieli procedure. FDR < 10% represents the threshold of significance in DAVID. Whole genome was used as background for these analyses.
Graphical representation
Scatter plots and boxplots of ChIP-seq data were visualized using R package ggplot2 (version 3.3.1). Metaplots and signal heatmaps centered around peaks were generated using Deeptools (“computeMatrix” and “plotHeatmap”, version 2.5.7).
DNA motif enrichment analysis
DNA motif analysis of sequences underneath the H3K27ac, or H3K9ac or H3K122ac peaks with acetylation changes (P < 0.05, 1-way ANOVA) was performed using HOMER (Hypergeometric Optimization of Motif EnRichment, version 4.6)69, with default parameters and DNA motif scanning windows equal to the size of each individual peak. Background regions of the same size and number were chosen for all peaks by sampling randomly from 10-kb windows in which at least two differentially enriched peaks could be found.
5hmC-Seal library construction
Nano-hmC-Seal was performed as previously described in Han et al.60. Briefly, 100 ng genomic DNA were fragmented in Tagmentation buffer at 55°C. Fragmented DNA was purified by Zymo DNA Clean and Concentration Kit. Then, the selective 5hmC chemical labeling was performed in glucosylation buffer (50 mM HEPES buffer pH 8.0, 25 mM MgCl2) containing above fragmented DNA, βGT, N3-UDP-Glc, and incubated at 37°C for 2 hr. After DNA purification in ddH2O, DBCO-PEG4-Biotin (Click Chemistry Tools) was added and incubated at 37°C for 2 hr. The biotin labeled DNA was pulled down by C1 Streptavidin beads (Life Technologies) for 15 min at room temperature. Next, the captured DNA fragments were subjected to PCR amplification using Nextera DNA sample preparation kit. The resulting amplified product was purified by 1.0X AMPure XP beads. Input library was made by direct PCR from fragmented DNA directly without labeling and pull-down. The libraries were quantified by a Qubit fluorometer (Life Technologies) and sequenced on a NextSeq 500 platform (Illumina) in accordance with the manufacturer’s protocol.
5hmC-Seal data analysis
Raw sequencing reads were first trimmed by Trim Galore! (v0.4.4, https://www.bioinformatics.babraham.ac.uk/projects/trim_galore/) to remove adapter sequences and poor-quality nucleotides. High-quality reads were then mapped to hg19 reference genome by Bowtie v1.1.1 with uniquely mapped reads retained for the following analyses. PCR duplicates were removed by Samtools, and normalization were performed by Deeptools. Reads of samples from the same study group were pooled for 5hmC track visualization. For comparison of 5hmC with RNA-seq, FPKM values for 5hmC over each RefSeq gene were computed using FeatureCounts, and correlation plots with corresponding gene RNA-seq expression levels were plotted in R. For comparison of 5hmC with ChIP-seq data, metaplot of 5hmC signal over ChIP-seq peaks identified across the Younger, Old and AD samples (distinguishing TSS vs. enhancer sites) were plotted using Deeptools as described above.
Comparison to published human ChIP-seq data
For comparison of our ChIP-seq data with published human entorhinal cortex H3K27ac ChIP-seq data, published H3K27ac ChIP-seq track files for AD and Control groups were downloaded from the UCSC Genome Browser session in the Marzi et al. paper18. Peaks with H3K27ac significant changes in AD were downloaded from Tables S4–5 in the same paper.
For comparison of our ChIP-seq data with published human frontolateral cortex H3K9ac ChIP-seq data, published H3K9ac ChIP-seq track files for each individual19 were downloaded from the ROSMAP study deposited in the Synapse database. Tau-burden correlated H3K9ac peaks were downloaded from Table S3 in the paper19.
Venn Diagrams showing overlap between our differentially enriched acetyl peaks and H3K27ac differential peaks from entorhinal cortex18, or H3K9ac peaks correlated with tau-burden in frontolateral cortex19 were generated for peaks with at least 1-bp overlap.
Boxplots showing ChIP-seq enrichments were generated by evaluating ChIP-seq signal in the published data over our peaks with changes in acetylation or evaluating ChIP-seq signal in our data over the published either H3K27ac differential enriched peaks or tau-burden correlating H3K9ac peaks, using the Bwtool package (“bwtool summary”) as described above.
Comparison to published mouse ChIP-seq data
For comparison of our ChIP-seq data with published H3K27ac ChIP-seq from theCK-p25 mouse model of AD, H3K27ac ChIP-seq track files were downloaded from the GEO database (GSE65159). H3K27ac peaks with changes in acetylation were downloaded from Table S3 in the paper, which provide both mouse genome coordinates and the lifted over human genome coordinates.
For comparison with the Tau mouse model, H3K9ac ChIP-seq track files and peaks with H3K9ac changes at either 6 or 11 months were obtain by the authors upon request19. We used UCSC LiftOver tool to convert mouse genomic coordinates to human coordinates using similar parameters as those in the original paper.
Venn Diagrams and boxplots of peak comparisons were generated in the same way as described above for the comparison with the published human data.
Comparison to published DNA methylation
71 CpG sites whose methylation levels were associated with neuritc amyloid plaques in frontolateral cortex were identified in De Jager et al.15. We examined the significance of the overlap (defined as CpG site within 1 kb from a peak) between the differentially enriched H3K27ac or H3K9ac or H3K122ac changes in AD (gains or losses) and the 71 CpG sites using Fisher’s exact test implemented in Bedtools.
Association between histone acetyl changes and AD GWAS SNPs
For the enrichment analysis of the differential acetylation peaks with AD GWAS SNPs from Lambert et al.83 a set of 2,371 SNPs passing stage I and stage II GWAS meta-analysis with p-value of ≤ 1 × 10⁻⁵ were downloaded from the International Genomics of Alzheimer’s Project (IGAP)83. INRICH was used to infer the relationship between H3K27ac, H3K9ac and H3K122ac changes and PLINK-joined AD GWAS SNP intervals (linkage due to HapMap release 23) using standard parameters. The set of all changed peaks (P < 0.05, 1-way ANOVA), was the background for the experiment.
IGAP is a large two-stage study based upon genome-wide association studies (GWAS) on individuals of European ancestry. In stage 1, IGAP used genotyped and imputed data on 7,055,881 single-nucleotide polymorphisms (SNPs) to meta-analyze four previously-published GWAS datasets consisting of 17,008 Alzheimer’s disease cases and 37,154 controls (The European Alzheimer’s disease Initiative – EADI the Alzheimer Disease Genetics Consortium – ADGC The Cohorts for Heart and Aging Research in Genomic Epidemiology consortium – CHARGE The Genetic and Environmental Risk in AD consortium – GERAD). In stage 2, 11,632 SNPs were genotyped and tested for association in an independent set of 8,572 Alzheimer’s disease cases and 11,312 controls. Finally, a meta-analysis was performed combining results from stages 1 & 2.
INRICH was also used to examine the intersection of differential acetylation peaks with the Kunkle et al.84 stage 1 AD GWAS SNPs in the following way. Summary statistics for 11,480,632 SNPs were downloaded from NIAGADS. 1,000 Genomes Project reference data was downloaded for volume 1, release 05-02-2013. Per-chromosome VCF files were concatenated with BCFtools v1.9, then converted to PLINK format using PLINK v1.9 with parameters --split-x b37 no-fail --allow-extra-chr 0 --const-fid --vcf-idspace-to _ --keep-allele-order. Duplicate/multiallelic and reference-mismatched variants were identified using PLINK v2.0 with parameters --rm-dup list --set-missing-var-ids @:#[b37], and a concatenated blacklist of those IDs was prepared. To find SNP clumps, 3,592 stage 1 SNPs with GWAS p-value < 1E-5 were used as input to PLINK v1.9 with parameters --exclude Blacklist.txt --clump Kunkle.1E-5.assoc --clump-p1 0.00001 --clump-p2 0.05 --clump-r2 0.5 --clump-range-border 20. The clumped ranges file was parsed with gawk to produce chromosome, start, stop coordinates for 540 clumped regions and the resulting file was used as input to INRICH, which was run as previously described.
eQTL data processing and sampling analysis
For the Zou et al. 2012 data87, eQTL data tables were downloaded from the National Institute on Aging Genetics of Alzheimer’s Disease Data Storage Site at the University of Pennsylvania (U24-AG041689–01), funded by the National Institute on Aging. The original paper analyzed samples from cerebellum in addition to temporal cortex, but we only used the temporal cortex data due to the cortical origin of our H4K16ac measurements and because regulatory elements are variable across brain regions109. Custom awk-based bash scripts, available by request, were used to convert eQTL data tables into BED format, use the liftOver utility from the UCSC Genome Browser110 to convert annotations from the hg18 genome build to hg19 to overlap with the H3K27ac, H3K9ac and H3K122ac peaks. 12 AD, 10 non-AD, and 18 combined condition eQTLs were unmapped by liftOver. We then used the intersect tool from the bedtools suite111 to overlap the H3K27ac, H3K9ac and H3K122ac changed peaks (P < 0.05, 1-way ANOVA) with the eQTL bed files.
For the sampling analysis, the shuffle tool from bedtools was used to generate 10,000 sets of matched control intervals, where unmappable regions as defined by the DAC blacklisted regions downloaded from the UCSC genome browser and ENCODE112. For each dataset, custom scripts, also available by request, were used to summarize the overlap counts in easy to parse files that were then read into the R programming language which was used to perform the empirical enrichment analyses.
Fly Husbandry and Fly Lines
Stocks were maintained on standard cornmeal-molasses medium. All flies were maintained at 26°C. Standard fly lines were from the Bloomington Drosophila Stock Center (gmr-GAL4, UAS-mCD8-GFP), amyloid beta fly line88 was courtesy of P. Fernandez-Funez (University of Minnesota), histone H3.3 WT and variants91, except as described below, were courtesy of A. Shilatifard (Northwestern University). Fly lines bearing new histone variants were generated as described below.
The pUAST-attB-H3.3-FLAG-HA construct (courtesy of Hans-Martin Herz, St. Jude Children’s Research Hospital) was mutagenized to make point mutations H3.3K27A and H3.3K27Q using the QuikChange II XL Site-Directed Mutagenesis Kit (Agilent, Santa Clara, CA): the K at position 27 (AAG) was changed to make H3.3K27A [AAG > GCG] and H3.3K27Q [AAG > CAG]. Constructs were sequenced after mutagenesis, then were used to make transgenic fly lines, inserting into the attP site 53B2 (Bestgene, Chino Hills, CA) (see Supplementary Table 14 for oligonucleotide sequences).
Drosophila eye imaging
Expression of UAS-Aß42, UAS-mCD8::GFP, and UAS-H3.3 variants (H3.3WT, H3.3K27M, H3.3K9M, H3.K27A, H3.3K27Q) were driven by gmr-gal4 (II). For imaging of external eyes, adult 2–3 days old Drosophila females were anesthetized with ether, placed on microscope slide using double-sided tape, and imaged using Leica Z16 APOA (Leica Biosystems, Buffalo Grove, IL). For internal sections, fly heads were fixed in Bouin’s solution (Sigma-Aldrich, St. Louis, MO) for 120 hrs. Heads were rinsed in leaching buffer (50 mM Tris/150 mM NaCl) overnight and processed with increasing concentrations of ethanol (70%, 80%, twice with 95%, twice with 100%) for 30 min each, twice in xylene for 30 min each and embedded in paraffin at 63°C twice for 1 hr each. Paraffin blocks were made using Shandon Histocentre2 (ThermoFisher Scientific, Grand Island, NY), and 8μm sections were cut using Leica RM2255. Sections were deparaffinized with Histoclear (National diagnostics, Atlanta, GA) and mounted on SuperFrost plus slides (ThermoFisher Scientific, Grand Island, NY) using Cytoseal XYL (ThermoFisher Scientific, Grand Island, NY). Images of endogenous autofluorescence were taken using Leica DM6000B fluorescence microscope. Images of retina sections were analyzed by ImageJ to measure the retinal depth across a consistent plane of the brain at the point of the optic chiasm. For each fly, 4 sections in the region of interest were measured and the average was used as the retinal depth for that animal. 4–6 animals/genotype were analyzed.
Statistics and Reproducibility
Statistical analysis of ChIP-seq data was performed with Wilcoxon rank-sum test (two-sided) or 1-way ANOVA as reported in text and corresponding figure legends. Statistical analysis of RNA-seq data was performed using DESeq2 (Wald test) with FDR < 0.05 controlled by Benjamini-Hochberg. Mass spectrometry analysis was performed using a Student’s t-test (two-sided). Samples used in each experiment are reported in Supplementary Table 2. No statistical method was used to predetermine sample sizes, but our sample sizes are similar to those reported in published studies17,113. For replicability, data were compared to published epigenomic and transcriptomic studies of AD18,19. Statistical analyses of Drosophila internal eyes were performed with a one-way ANOVA followed by a Tukey’s multiple comparison test. 4–5 animals were used for each genotype. Both epigenomic and fly data collection and analysis were not performed blind to the conditions of the experiments. No data points were excluded from the analyses.
Life Sciences Reporting Summary
Further information on research design is available in the Nature Research Reporting Summary linked to this article
Data availability
The epigenomic and transcriptomic data that support the findings of this study are available through the NCBI Gene Expression Omnibus (GEO) repository under accession number GSE153875. Part of the Input libraries were previously generated17 and are available under GSE84618. The proteomic data are available through the repository Chorus under accession number 1684.
Code availability
Code developed for the analyses performed in this study are available at https://github.com/yeminlan/ADEpigenetics.
Extended Data
Extended Data Fig. 1. STRING network analysis for genes changing in AD.
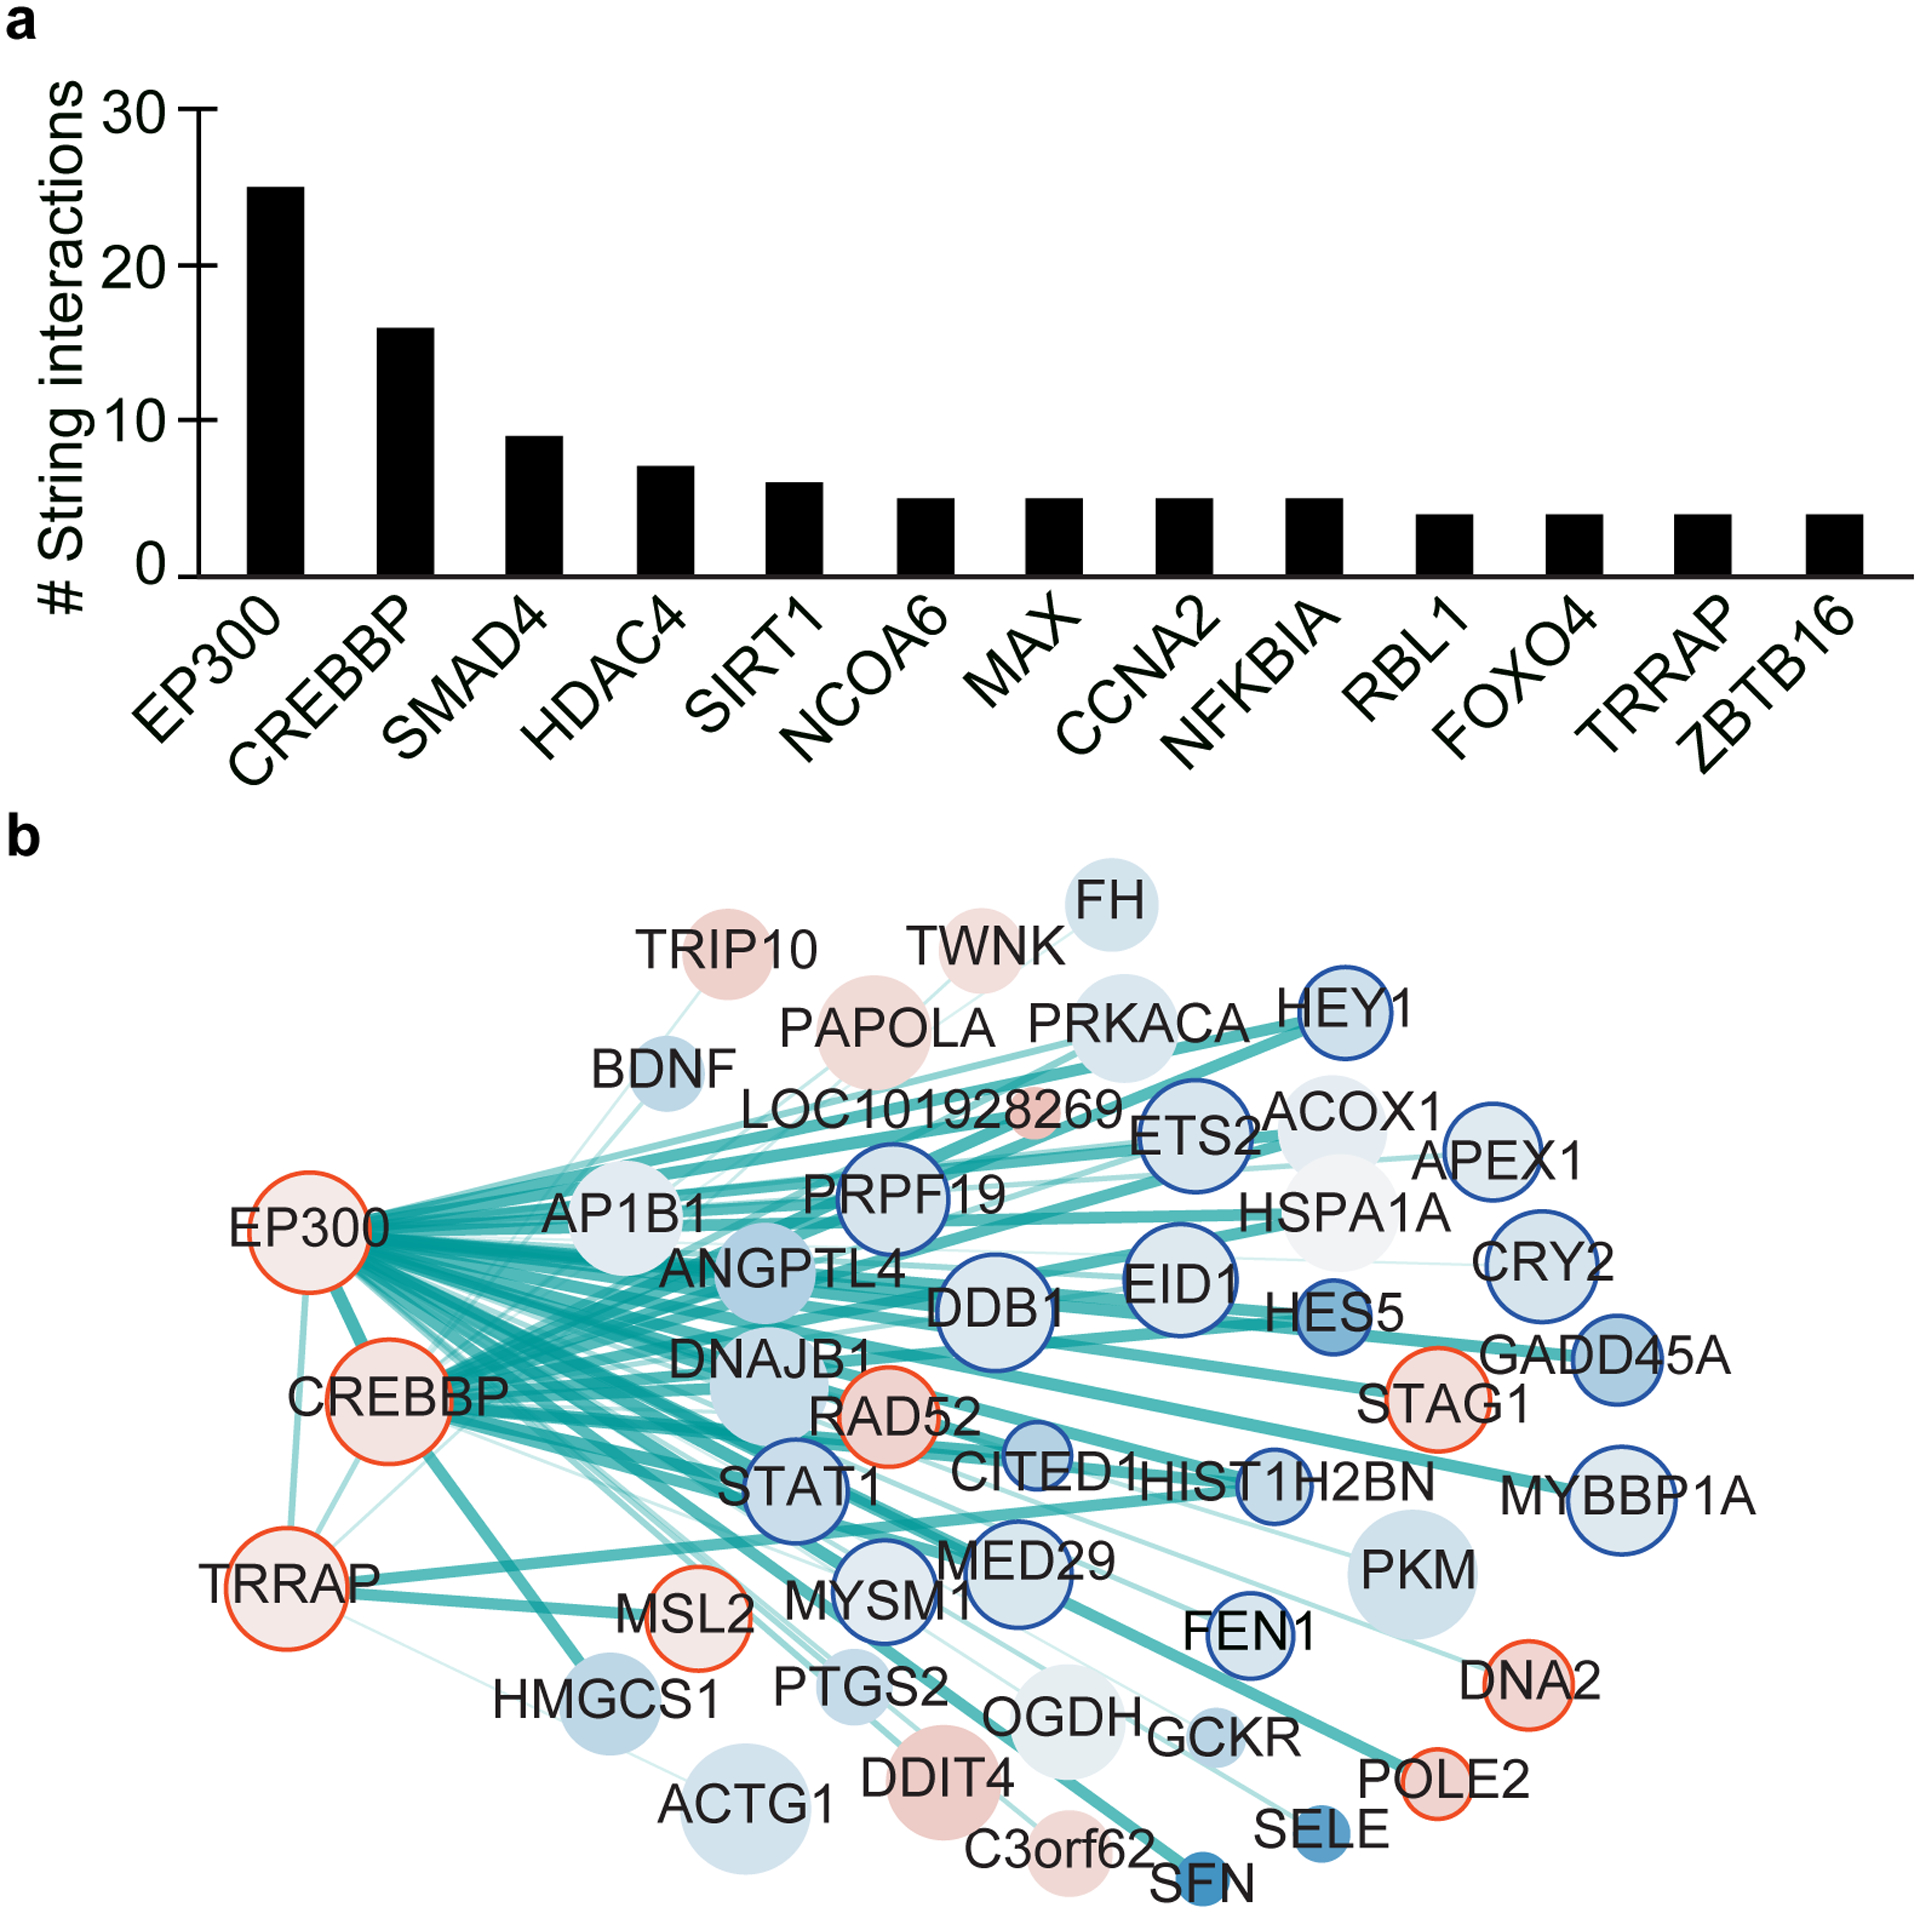
(a) Barplot showing the number of STRING (v11) interactions for genes with the top number of interactions in Fig. 1e. (b) STRING interaction network for genes changing in AD vs Old (q < 0.05) that interact with EP300, CREBBP and TRAPP. Interactions that were identified in Fig. 1e are not shown in this network. The gene network was visualized with Cytoscape (v3.6)103. Size of nodes represents RNA expression values, the color represents gene expression changes (log2 fold-change) in the AD vs Old comparison (red for upregulated in AD; blue for downregulated in AD) and the thickness of the line is the confidence of the interaction calculated by STRING. Nodes circled in red or blue represent known transcription and chromatin genes.
Extended Data Fig. 2. Histone posttranslational modifications in Younger, Old and AD.
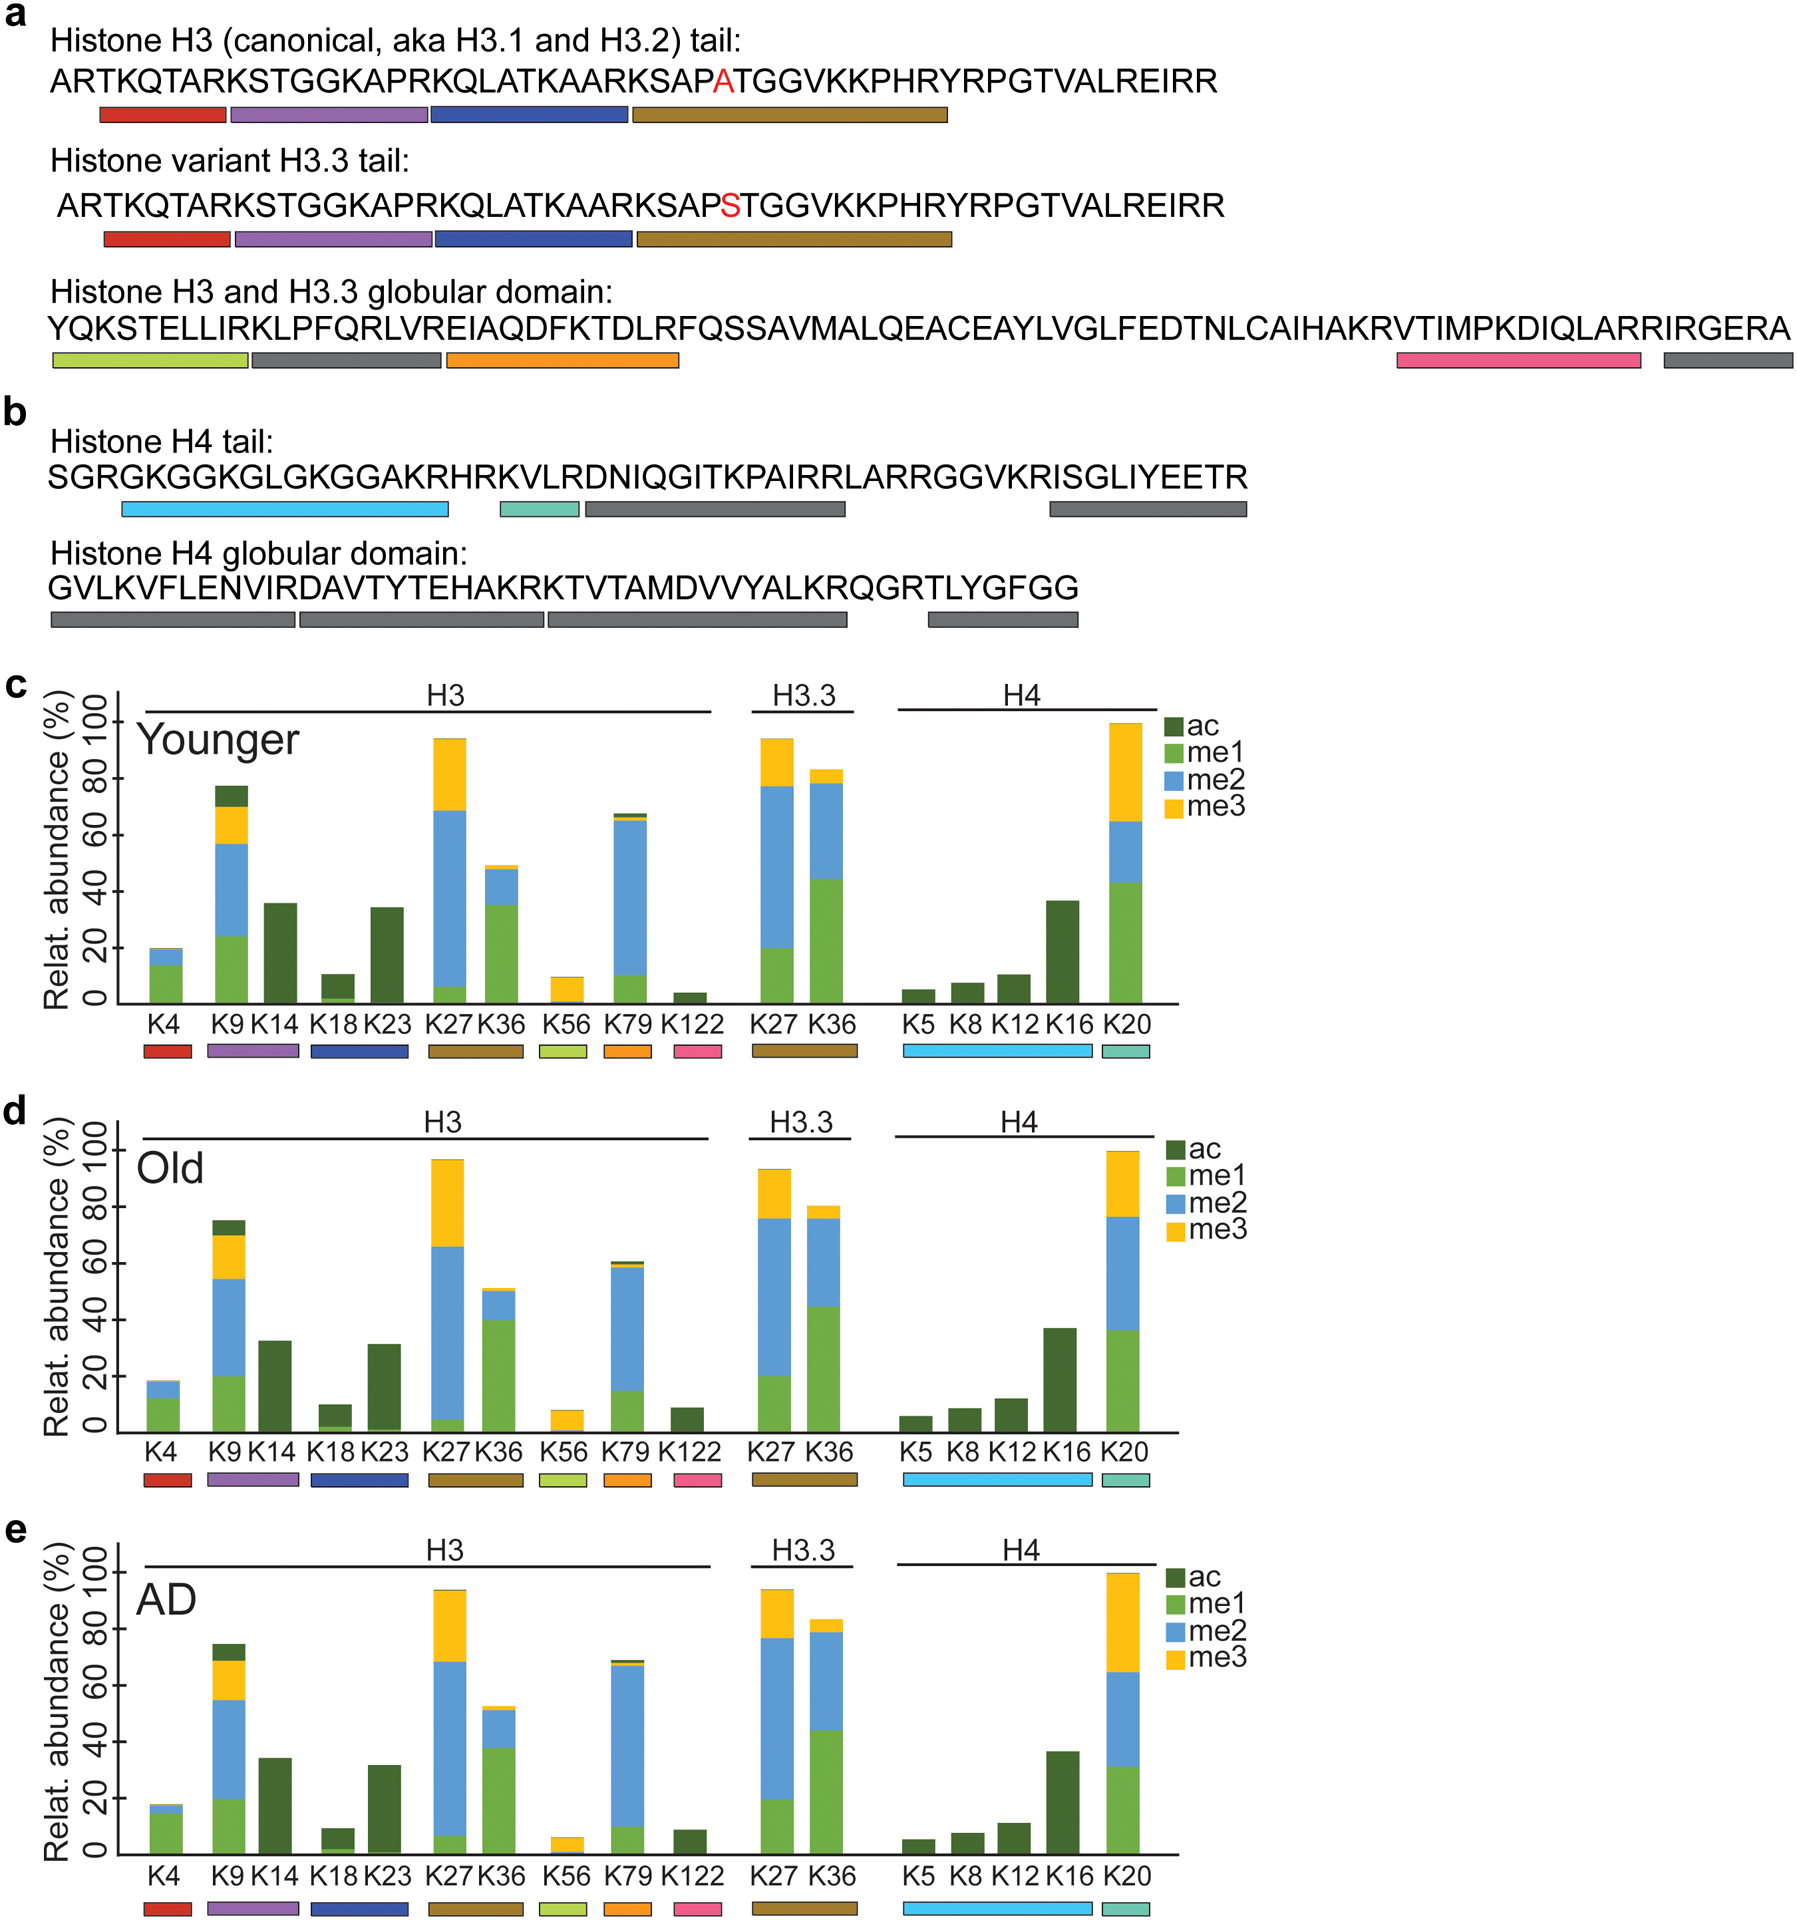
(a) Amino acid sequence of canonical histone H3 (H3.1 and H3.2) tail and globular domain, and its H3.3 variant. The residue that differs between canonical H3 and H3.3 is highlighted in red. (b) Amino acid sequence of histone H4 tail and globular domain. Bars below the amino acid sequence in panels a-b represent peptides generated in the trypsinization process that were identified on the mass spectrometer (LC-MS/MS). Grey bars represent peptides not reliably detected and therefore excluded from the analysis. (c-e) Stacked bar plots showing relative abundance of histone modifications (methylation and acetylation) on histones H3, H3.3 and H4 in (c) Younger, (d) Old and (e) AD. The lysine residues (K) analyzed are listed below the stacked bar plots.
Extended Data Fig. 3. Histone acetyl marks are enriched at both TSS and enhancers.
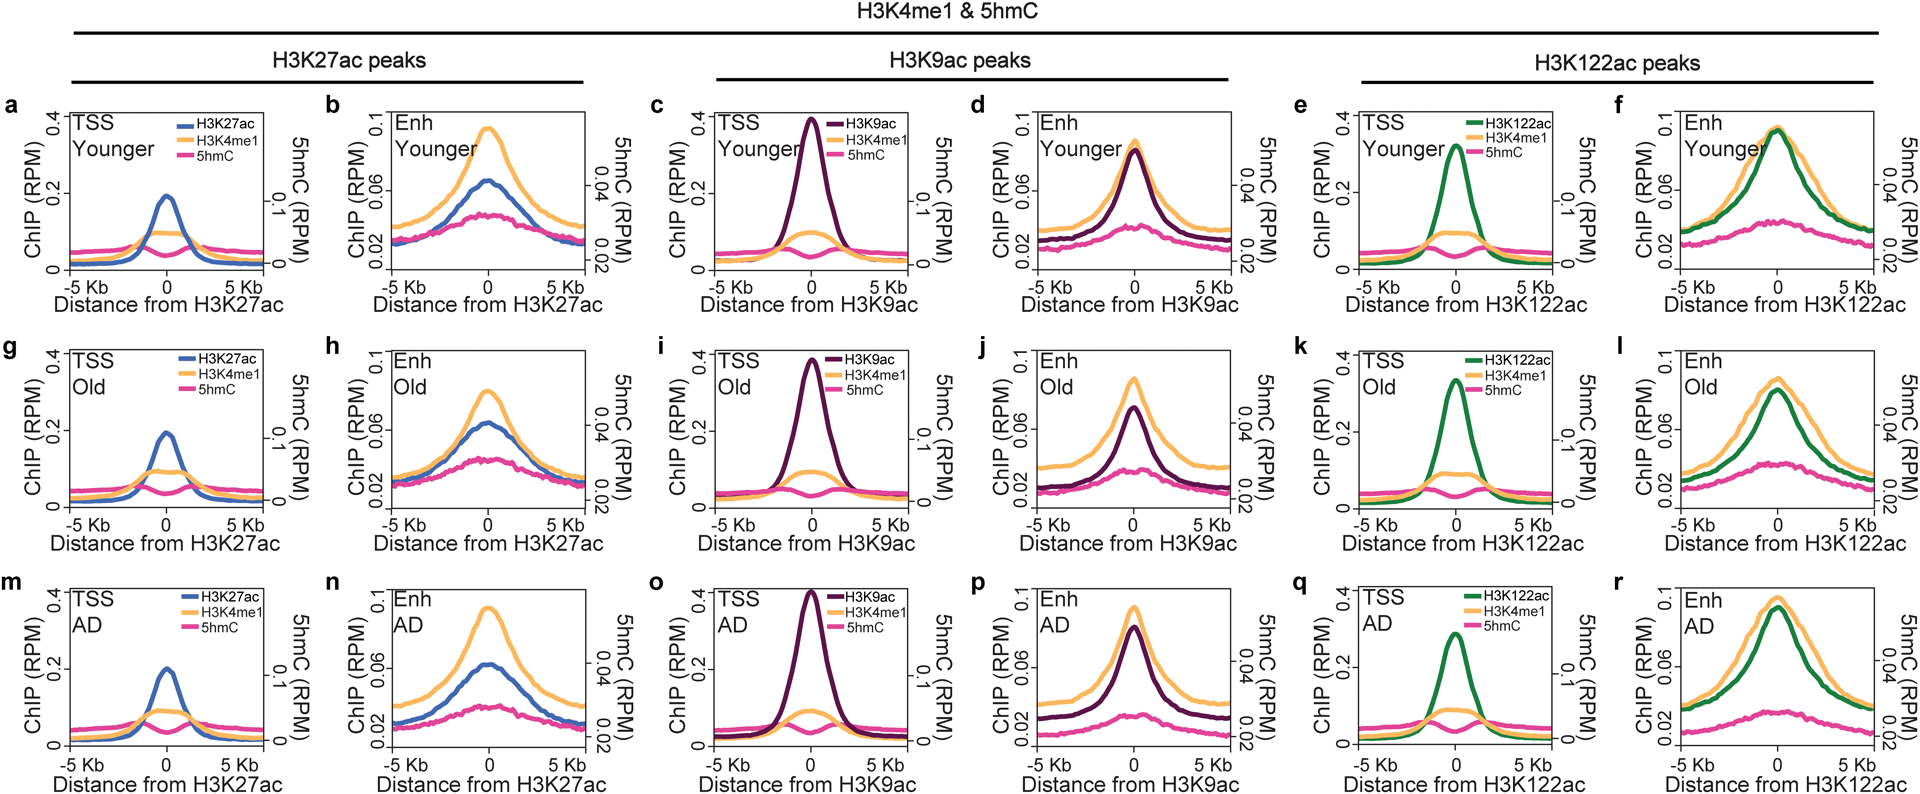
Metaplots showing peak enrichment of H3K27ac, H3K9ac and H3K122ac and corresponding 5hmC and H3K4me1 enrichments for peaks at transcriptional start sites (TSSs) (≤ 1 Kb from TSS) and enhancer (Enh) sites (> 1Kb from TSS) in (a-f) Younger, (g-l) Old and (m-r) AD brains. Histone acetyl-peaks are enriched at both TSSs and enhancers, while 5hmC and H3K4me1 mark enhancer sites.
Extended Data Fig. 4. H3K27ac, H3K9ac and H3K122ac peak distribution in Younger, Old and AD.
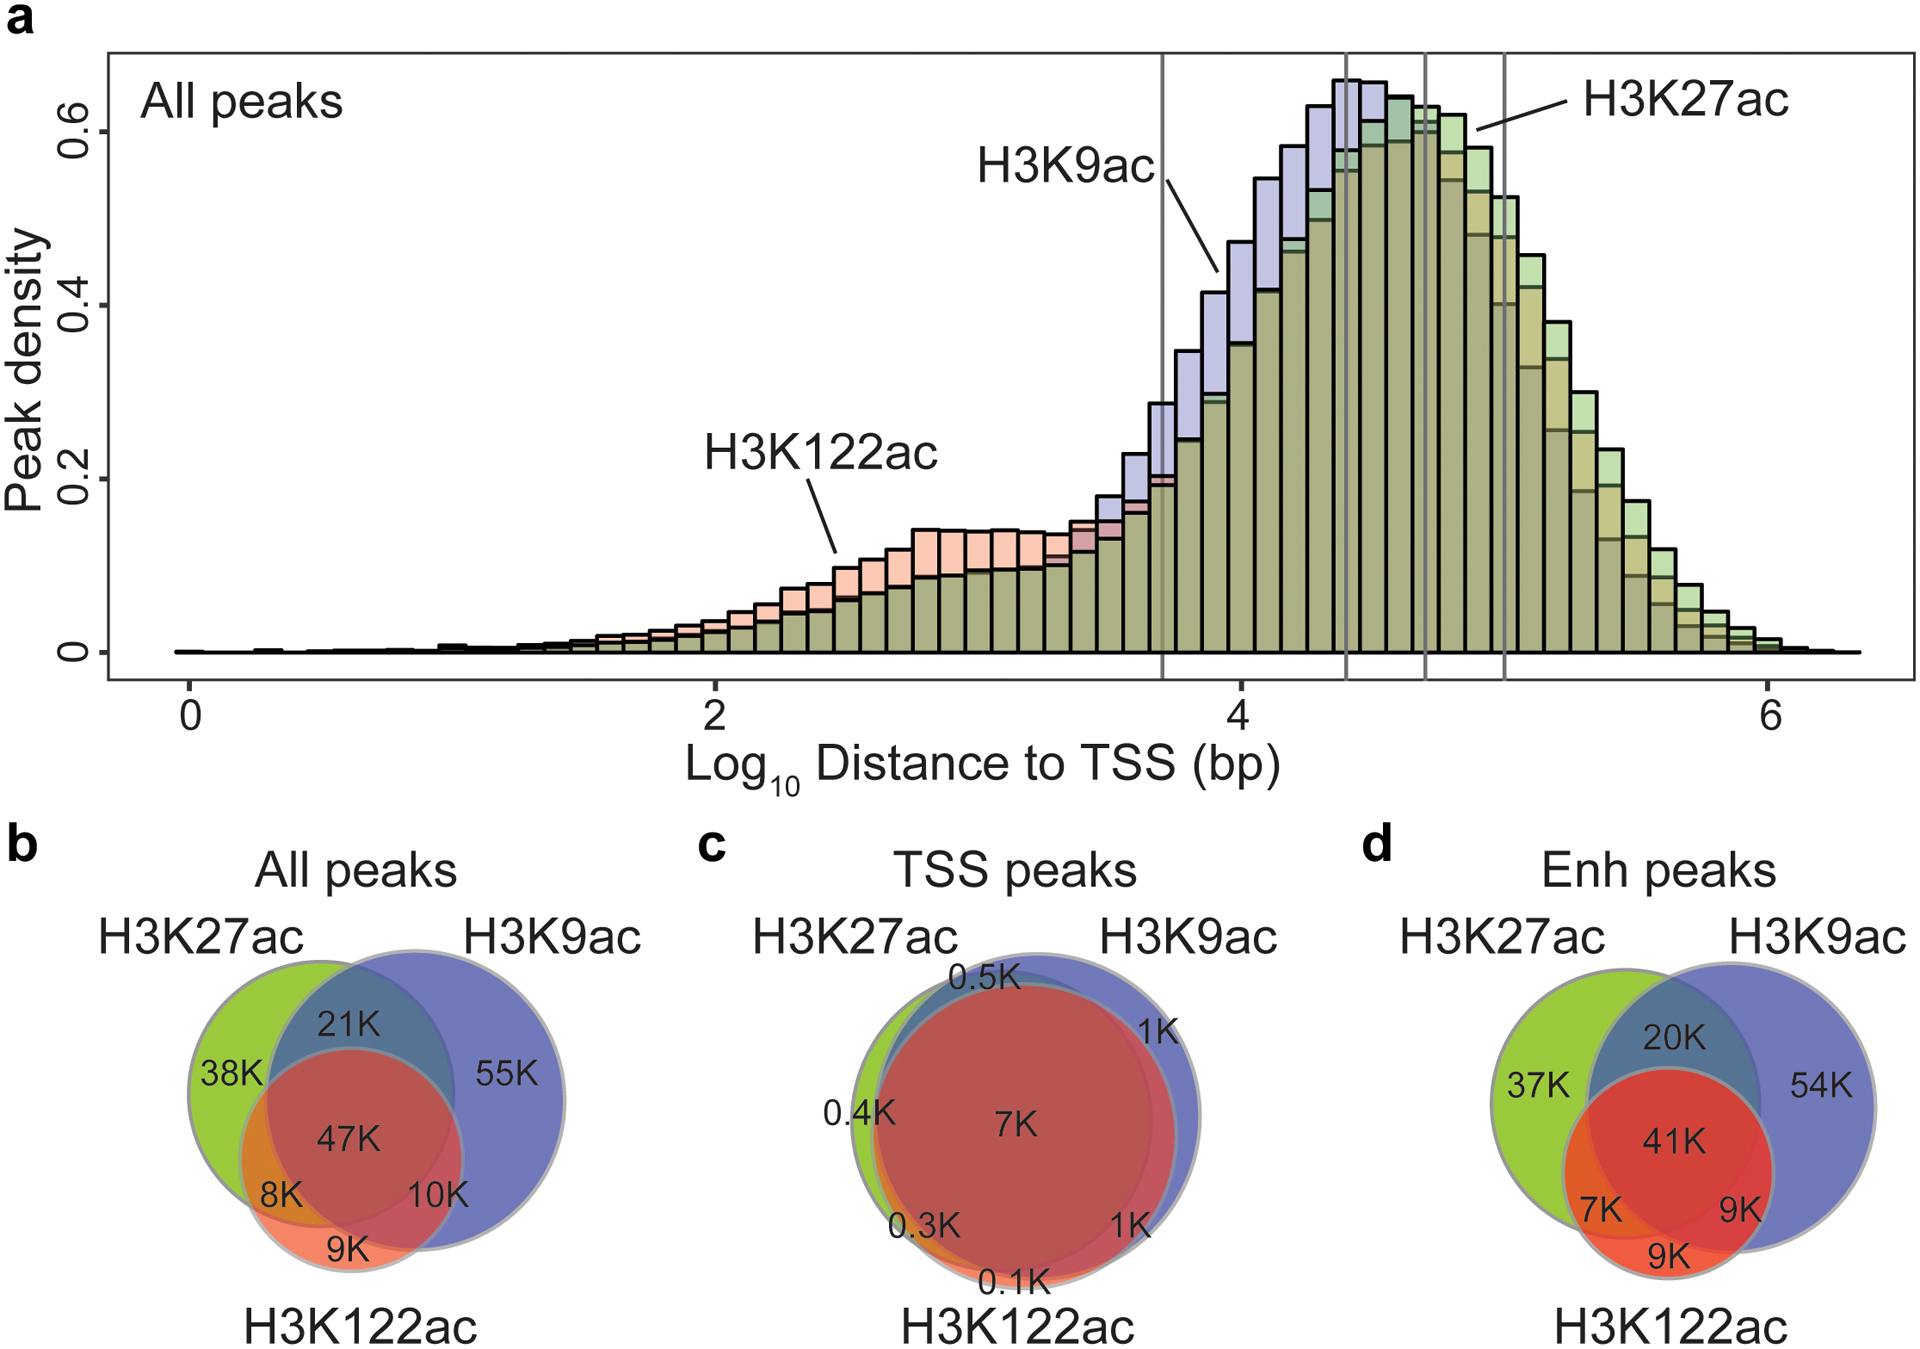
(a) Histogram of peak density for H3K27ac (light green), H3K9ac (light blue) and H3K122ac (light red), based on their distance from the transcriptional start site (TSS) for peaks detected in Younger, Old and AD. Grey vertical lines demark (from left to right): 5, 25, 50 and 100 Kb distance from TSS. (b-d) Venn Diagram showing the overlap between H3K27ac, H3K9ac and H3K122ac peaks for (b) All peaks, (c) TSS peaks (≤ 1Kb from TSS) and (d) enhancer (Enh) peaks (> 1Kb from TSS) detected in Younger, Old and AD.
Extended Data Fig. 5. Correlation between ChIP-seq and RNA-seq data.
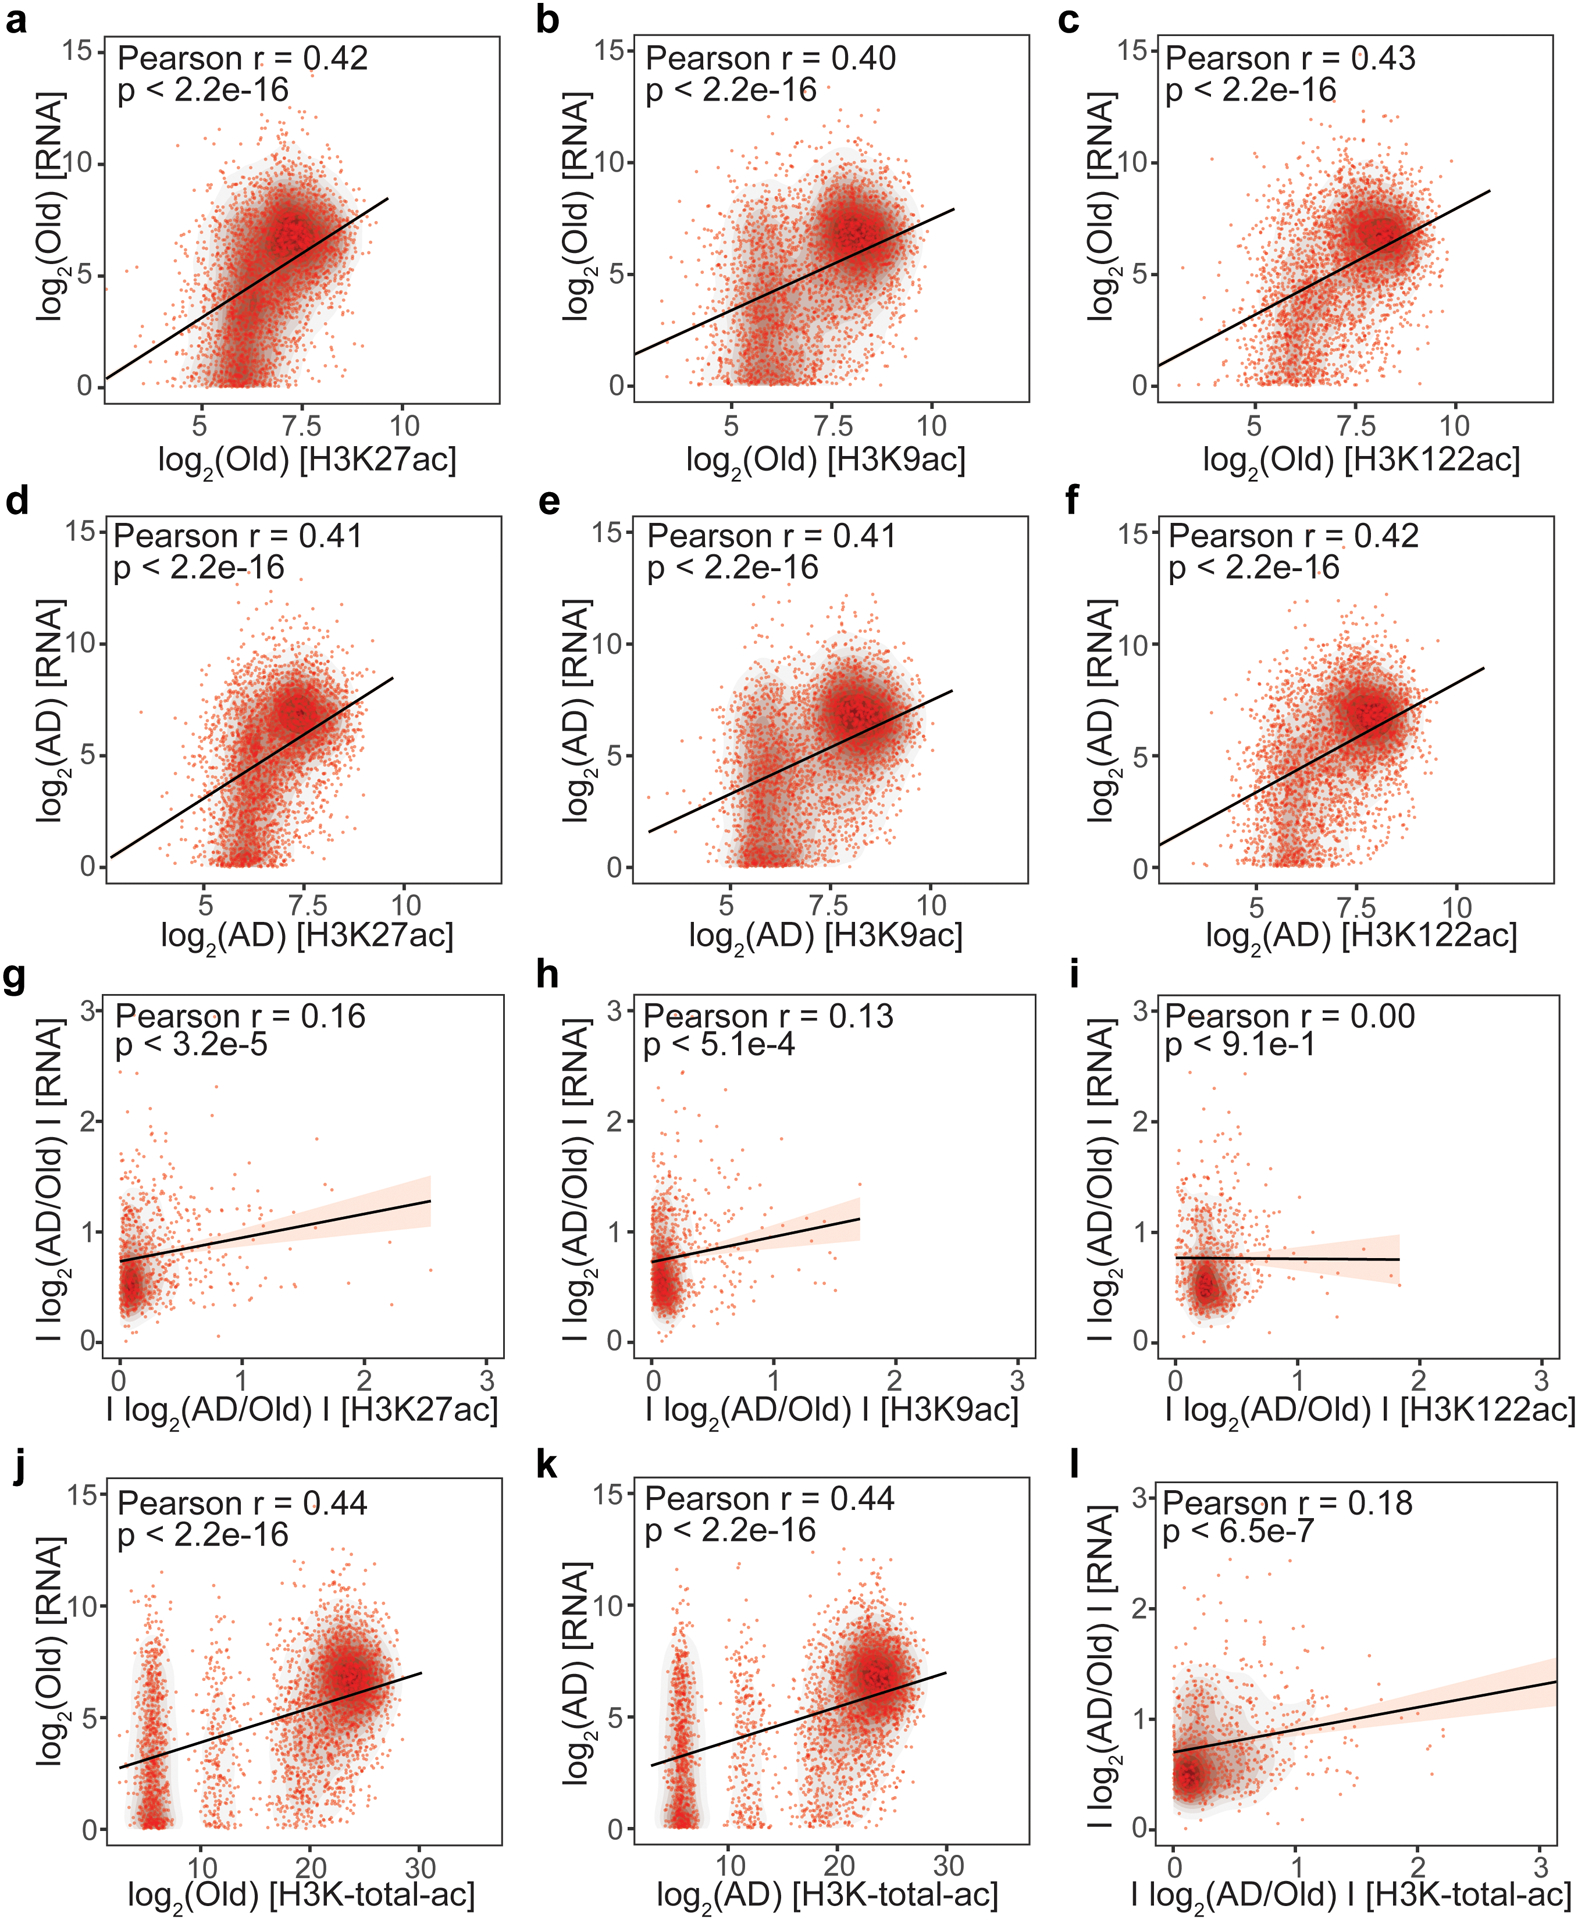
(a-c) Scatterplot of (a) H3K27ac, (b) H3K9ac and (c) H3K122ac peak enrichment vs gene expression for genes expressed in Old. (d-f) Scatterplot of (d) H3K27ac, (e) H3K9ac and (f) H3K122ac peak enrichment vs gene expression for genes expressed in AD. For graphical representation in a-b, 3000 randomly chosen points are shown in each panel. (g-i) Scatterplot of (g) H3K27ac, (h) H3K9ac and (i) H3K122ac absolute peak fold-change vs absolute gene expression change for significantly (q < 0.05) differentially expressed genes in AD vs Old. (j,k) Scatterplot of total acetyl-peak enrichment (H3K-total-ac; sum of H3K27ac, H3K9ac and H3K122ac peak enrichment at the same site) vs gene expression for genes expressed in (j) Old and (k) AD. (l) Scatterplot of H3K-total-ac absolute peak fold-change vs absolute gene expression change for significantly (q < 0.05) differentially expressed genes in AD vs Old. The closest peak to the TSS was chosen for these analyses. Linear regression trendlines, Pearson’s correlation coefficients and p-values (test for association using Pearson’s product moment correlation coefficient implemented by R stats package, two-sided) are indicated in each panel (a-l).
Extended Data Fig. 6. Comparison between histone marks enrichments at sites with disease-specific changes.
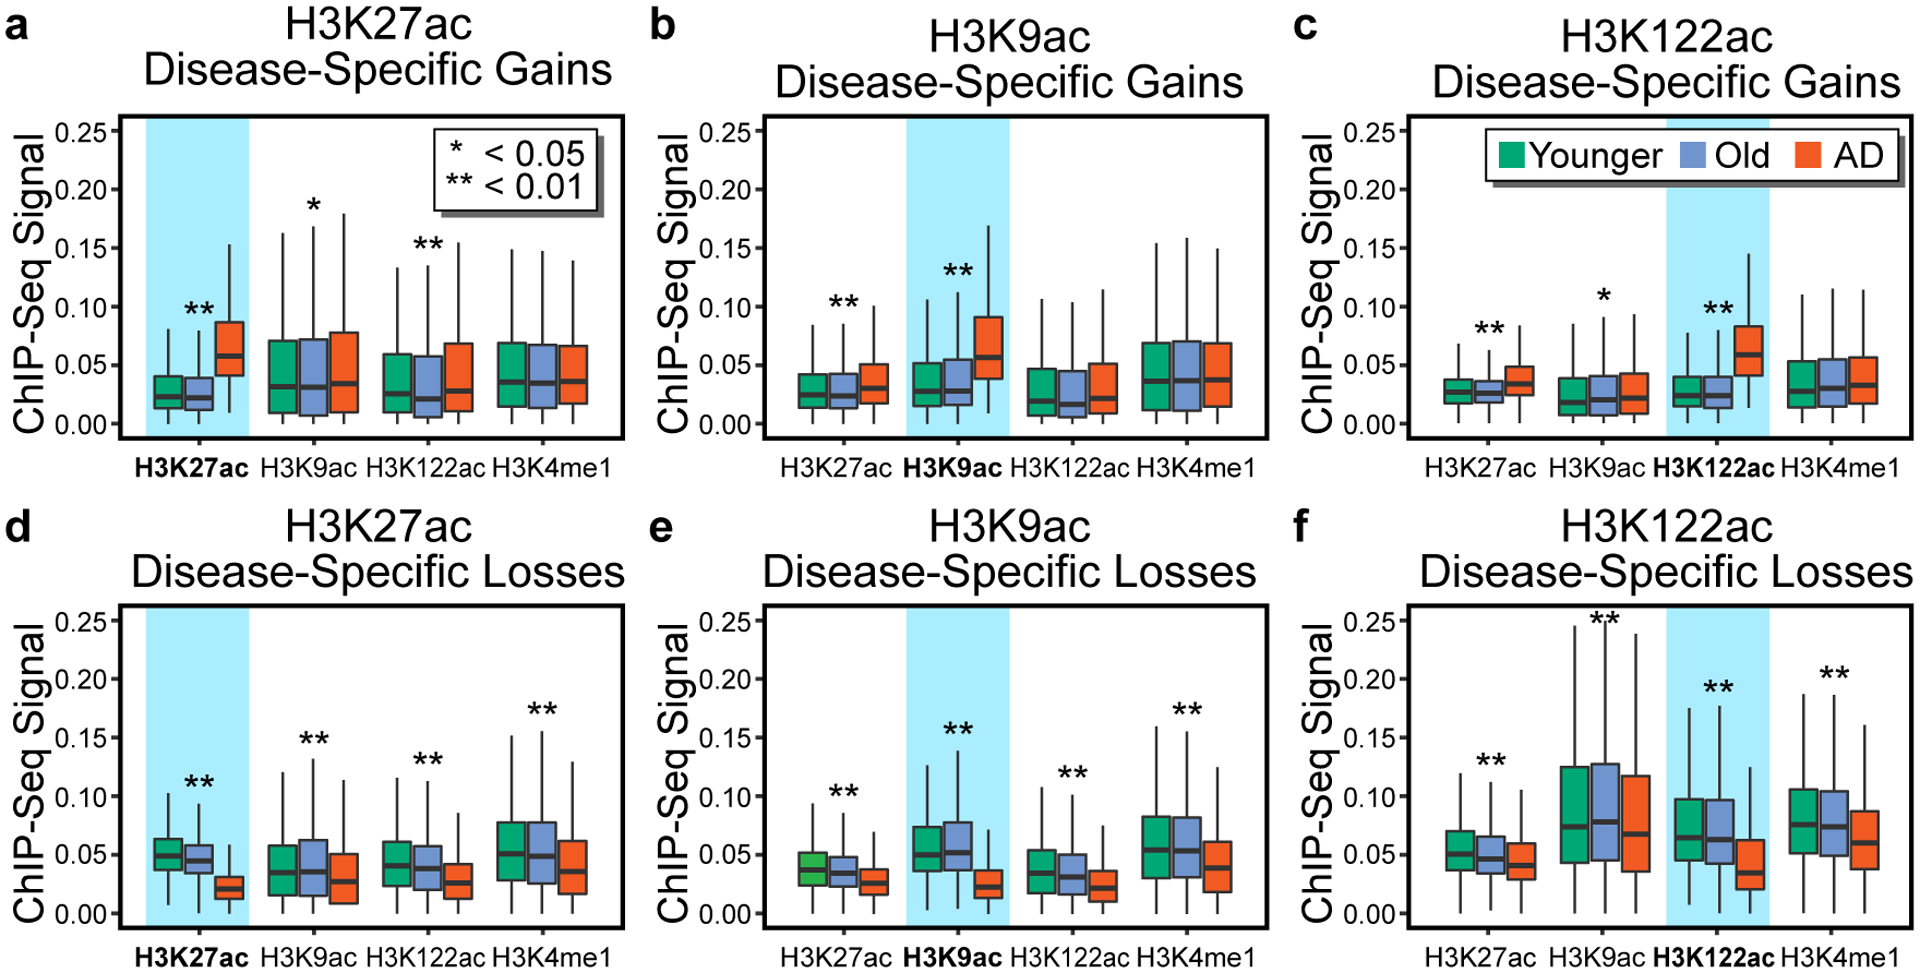
(a-c) Boxplots showing H3K27ac, H3K9ac, H3K122ac and H3K4me1 peak enrichment at sites with (a) H3K27ac, (b) H3K9ac, (c) H3K122ac (highlighted in blue) disease-specific gains. (d-f) Boxplots showing H3K9ac, H3K122ac and H3K4me1 peak enrichment at sites with (d) H3K27ac, (e) H3K9ac and (f) H3K122ac (highlighted in blue) disease-specific losses. Asterisks in (a-f) denote level of significance comparing peak enrichment across Younger (N = 11–12), Old (N = 10) and AD (N = 9–11) (* P < 0.05; ** P < 0.01, 1-way ANOVA) (Supplementary Table 2). Boxplots show minimum, first quartile, median (center line), third quartile and maximum.
Extended Data Fig. 7. H3K9ac disease-specific gain at CREBBP but not EP300.
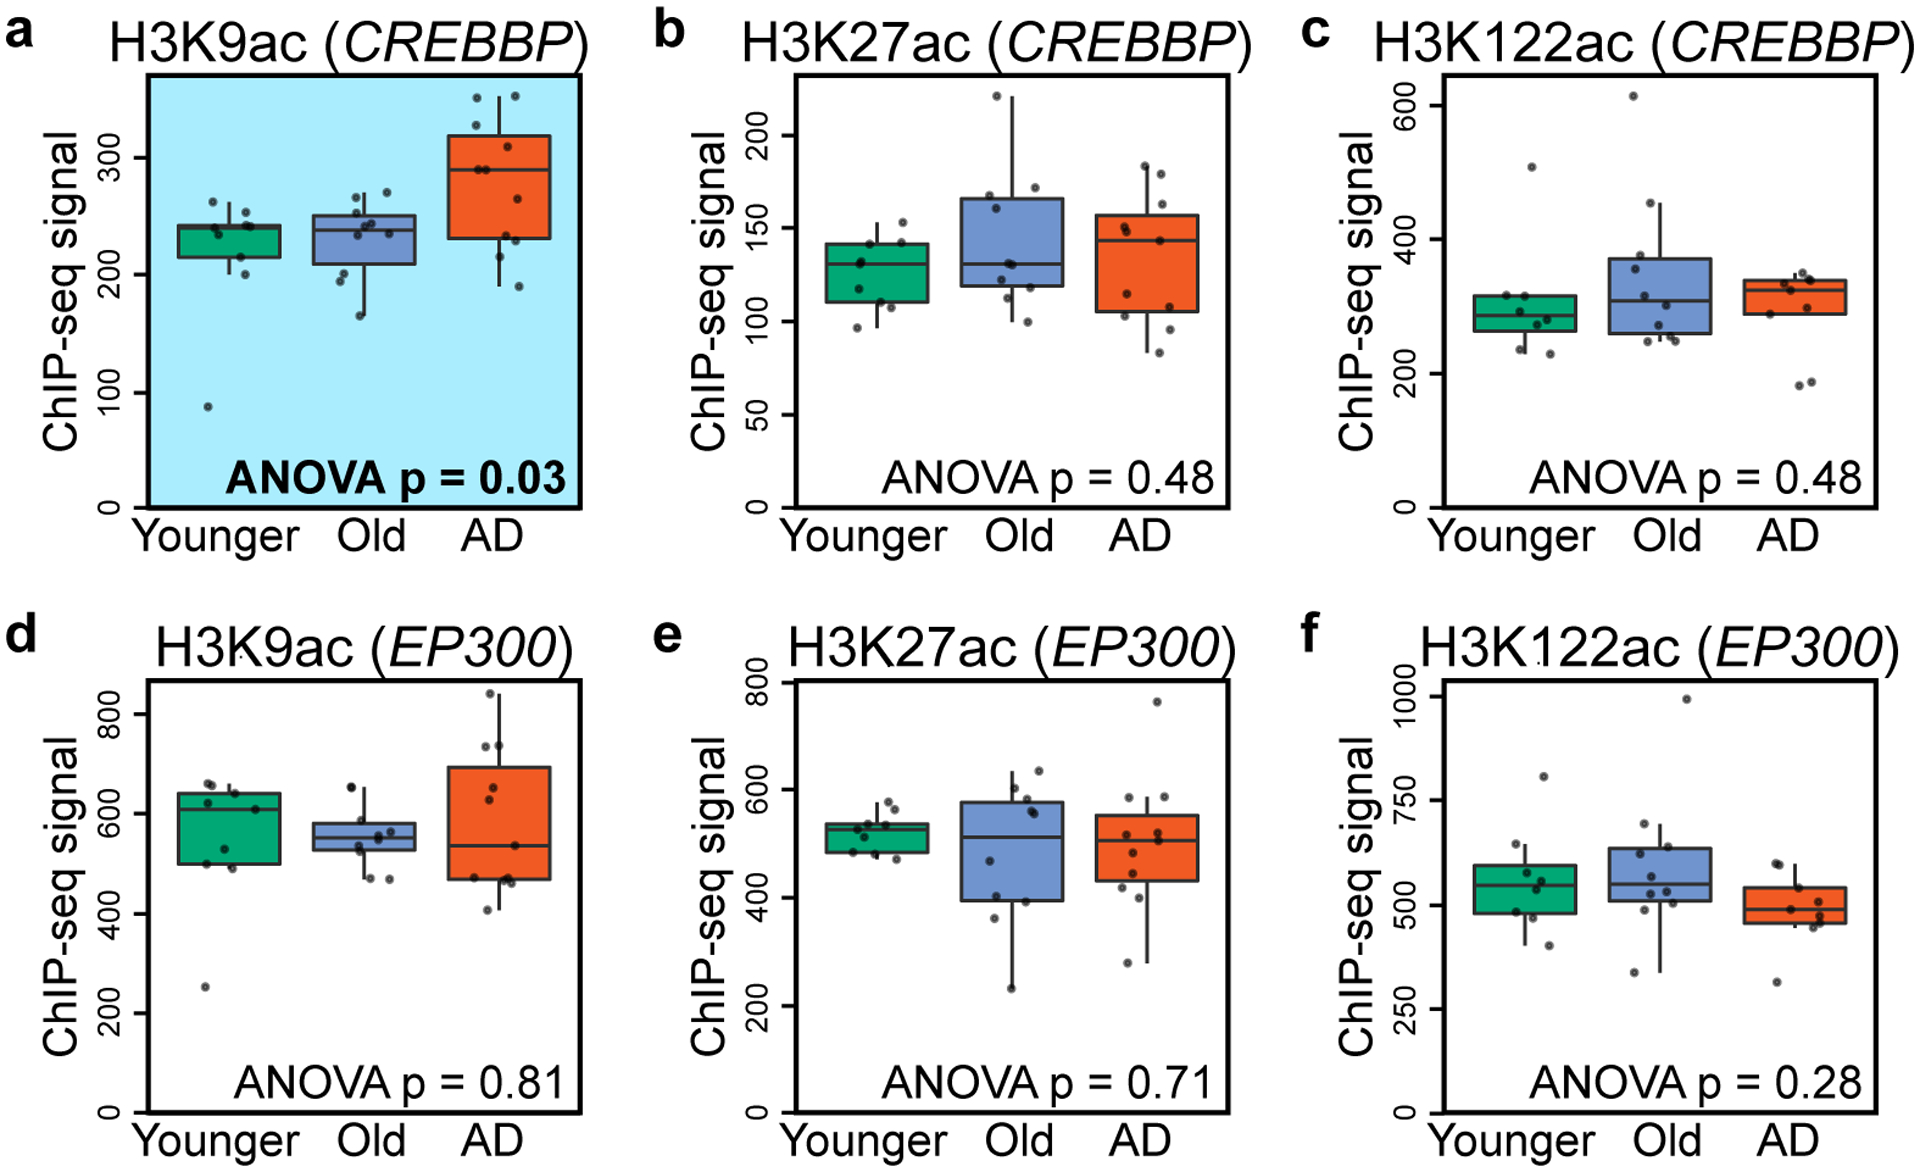
(a-c) Boxplot showing (a) H3K9ac, (b) H3K27ac and (c) H3K122ac peak enrichment at the CREBBP gene in Younger, Old and AD. A H3K9ac disease-specific gain is observed at CREBBP (highlighted in blue in a). (d-f) Boxplot showing (d) H3K9ac, (e) H3K27ac (f) H3K122ac peak enrichment at the EP300 gene in Younger, Old and AD showing no disease-specific changes. The closest peak to the gene was considered for this analysis. P-values comparing peak enrichment across Younger (N = 8–9), Old (N = 10) and AD (N = 9–11) (Supplementary Table 2) (1-way ANOVA) are reported in each panel. Boxplots show minimum, first quartile, median (center line), third quartile and maximum. Dots overlaid on boxplots represent individual data points.
Extended Data Fig. 8. Functional analysis of H3K27ac and H3K9ac disease-specific losses.
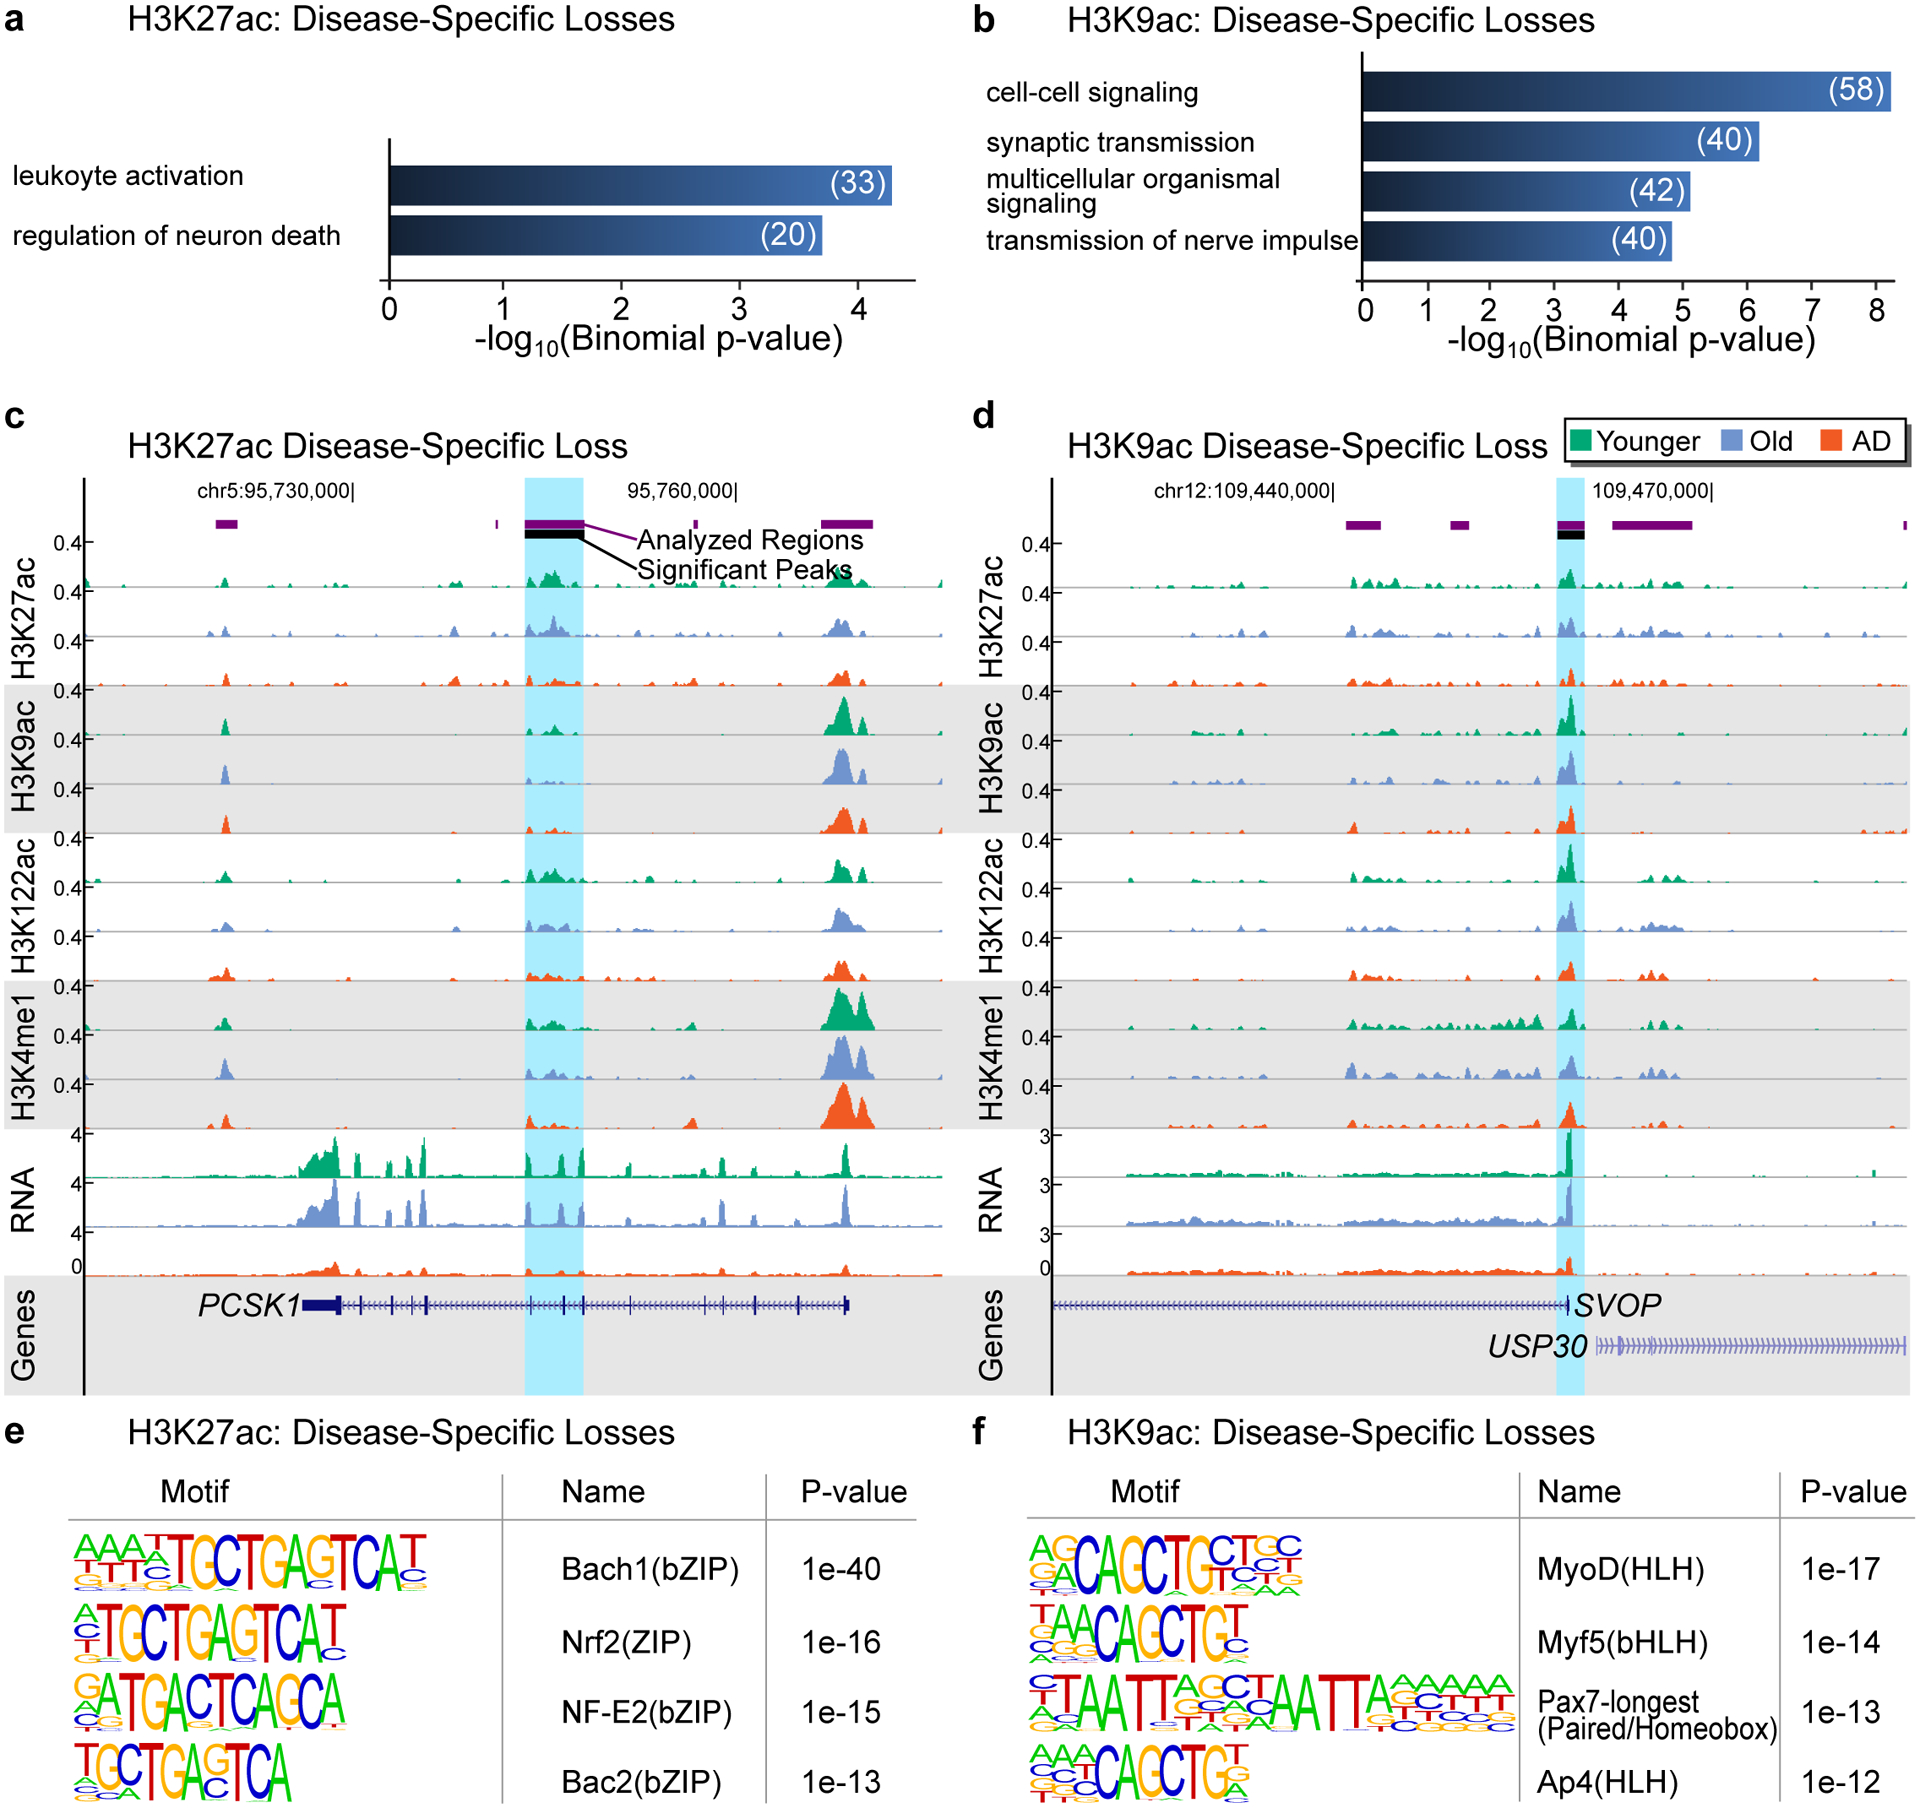
(a,b) Barplot showing top GO terms (Biological Processes; GREAT, FDR < 5%, % by both the binomial and the hypergeometric tests) for (a) H3K27ac disease-specific losses and (b) H3K9ac disease-specific losses for terms with at least 20 genes. (c,d) UCSC genome browser view showing an example of (c) H3K27ac disease-specific loss at the PCSK1 gene and (d) H3K9ac disease-specific loss at the SVOP gene. H3K27ac, H3K9ac, H3K122ac, H3K4me1 ChIP-seq and RNA-seq tracks are showed for Younger, Old and AD. (e,f) Top DNA motifs (HOMER v4.6) for (e) H3K27ac disease-specific losses and (f) H3K9ac disease-specific losses in AD. Enrichment results are shown for known motifs (q < 0.05, Benjamini-Hochberg).
Extended Data Fig. 9. Functional analysis of disease-specific changes using DAVID.
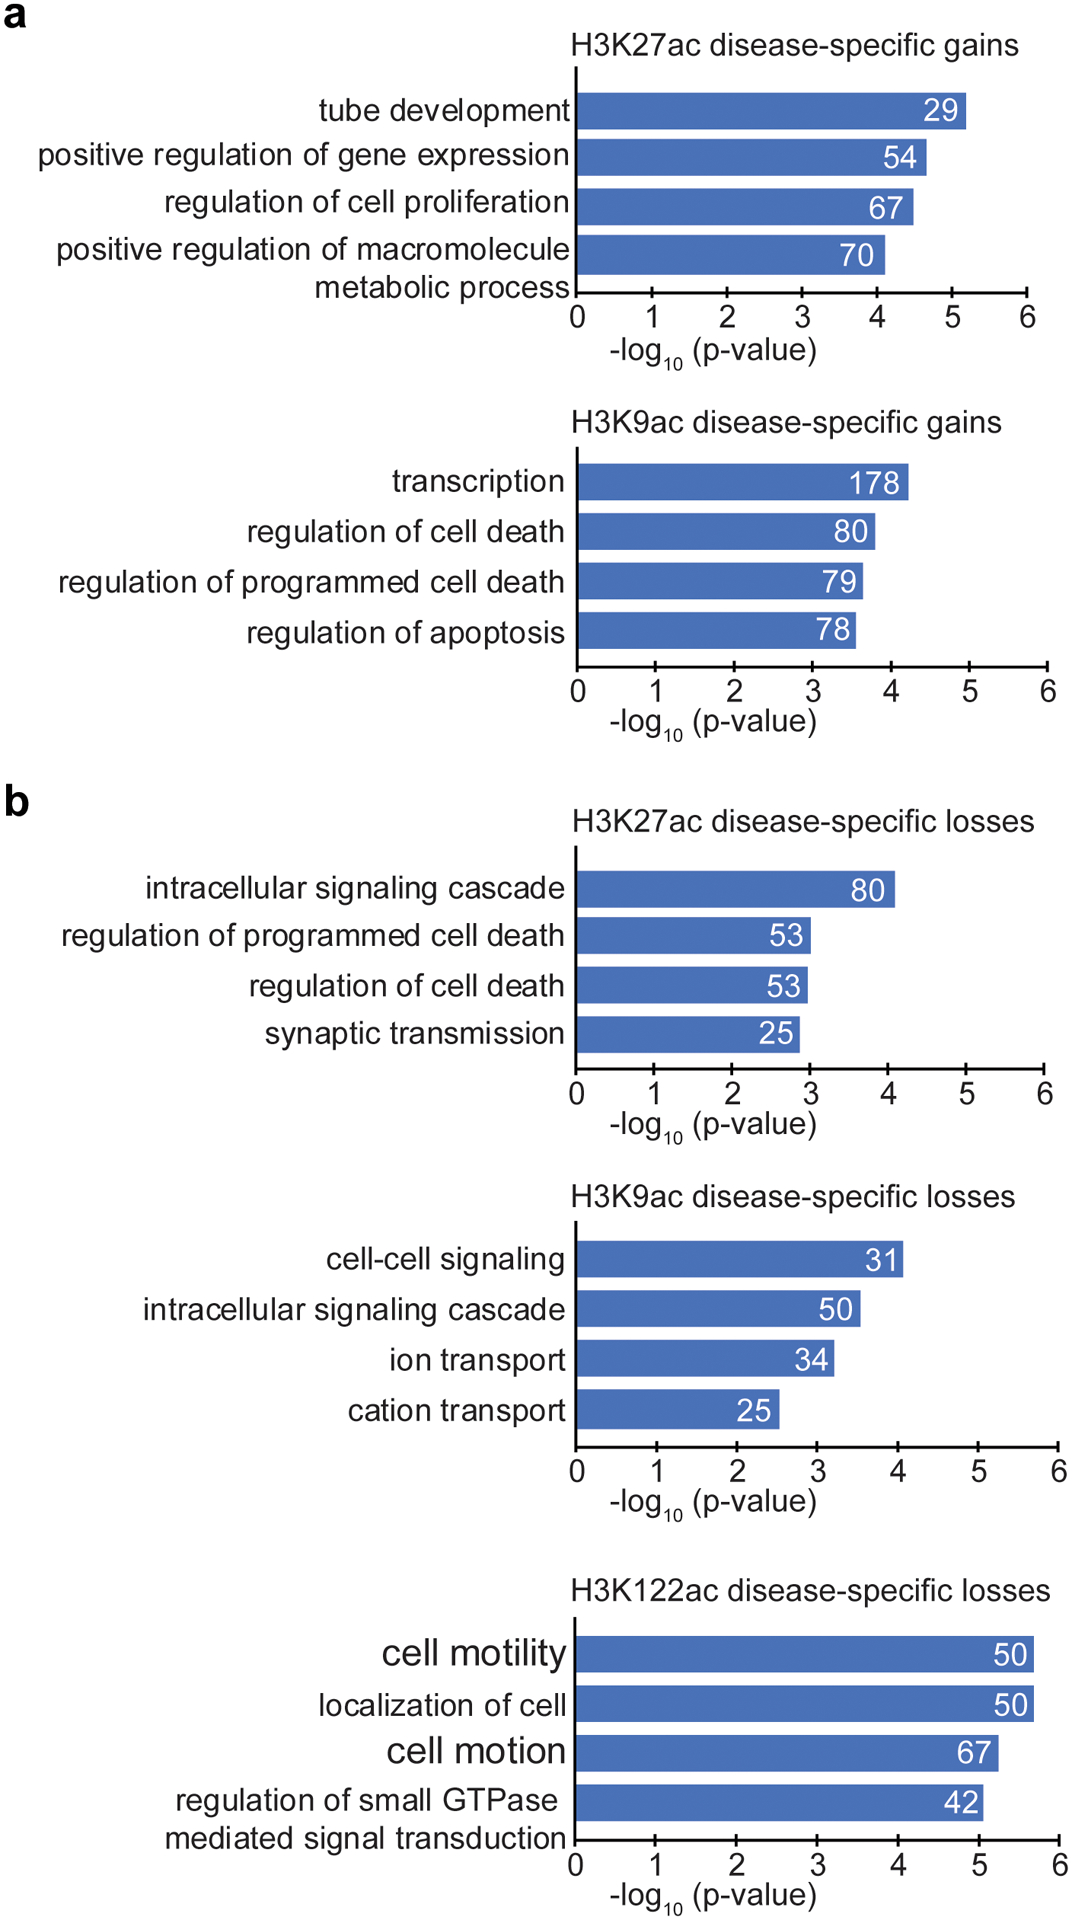
(a,b) Barplot showing top GO terms (Biological Processes, DAVID v6.7, FDR < 10%, Yekutieli) for genes targeted by (a) disease-specific gains (H3K27ac or H3K9ac) and (b) disease-specific losses (either H3K27 or H3K9ac or H3K122ac) for terms with at least 20 genes.
Extended Data Fig. 10. H3K27ac disease-specific gains are enriched with AD GWAS SNPs from Kunkle et al.
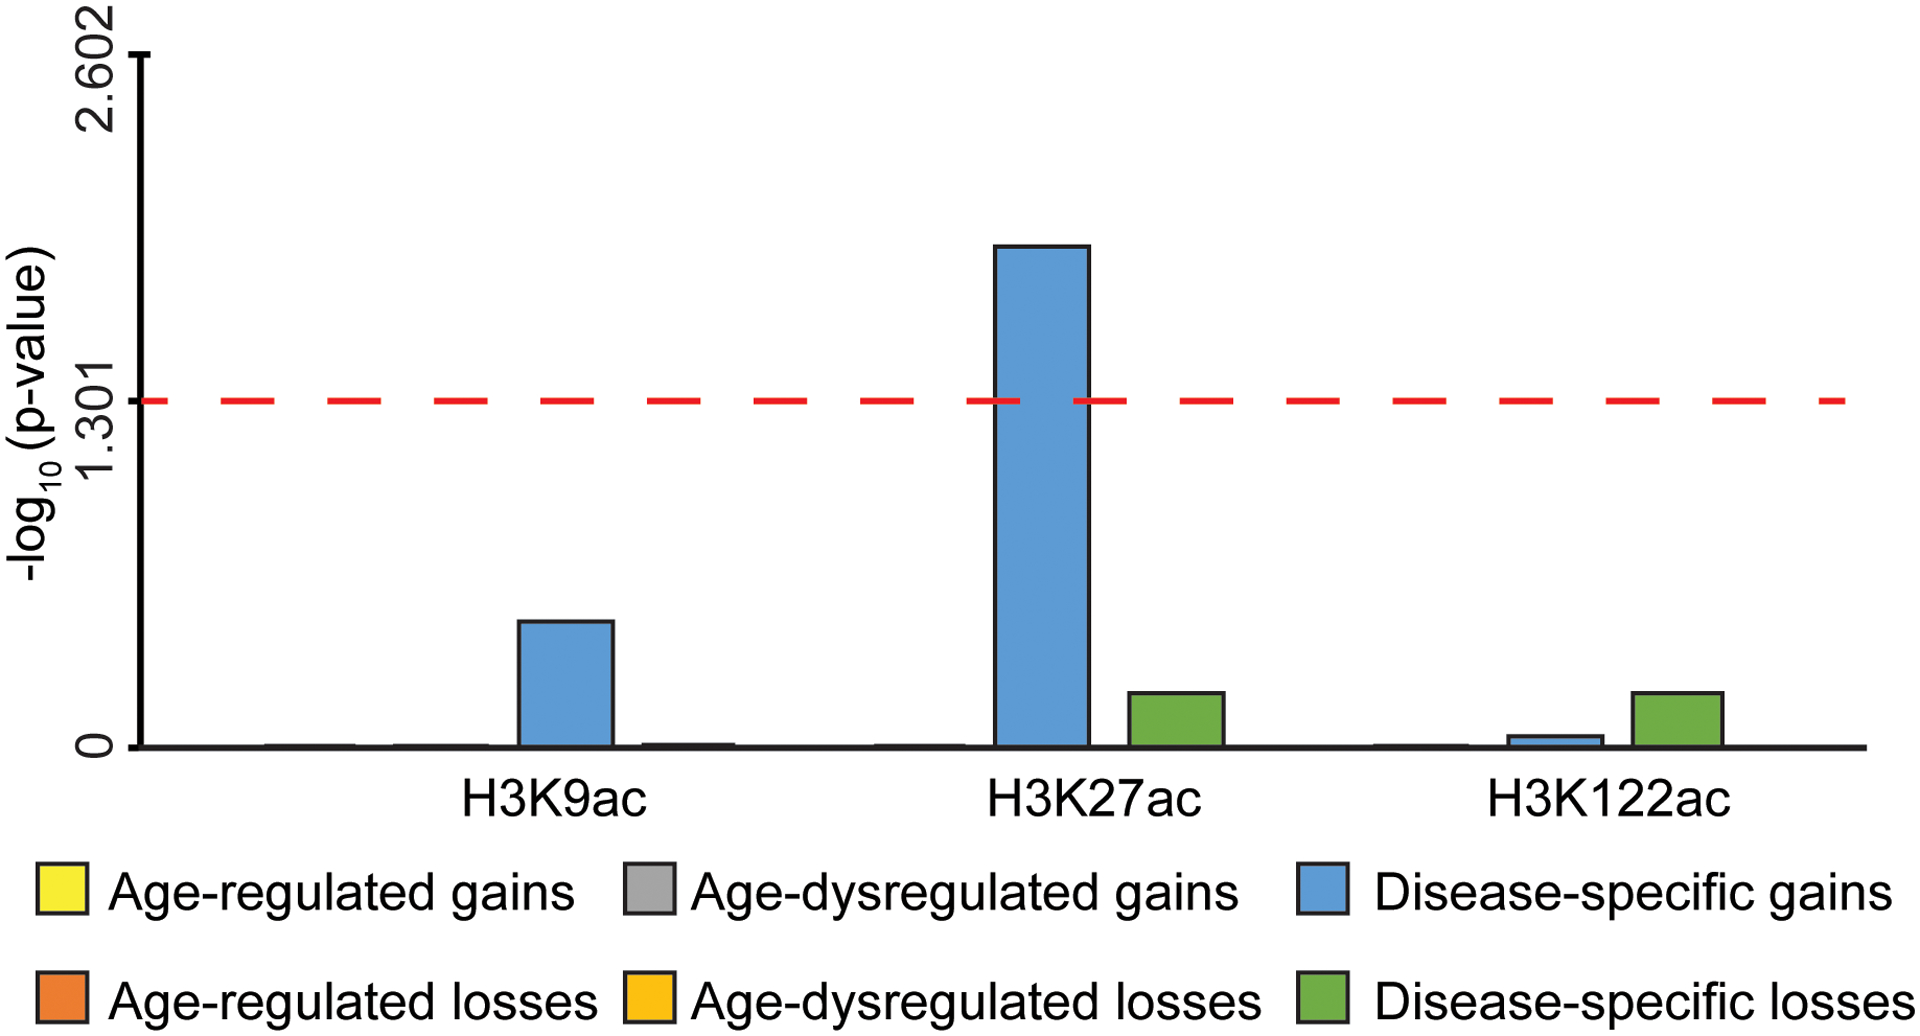
Bar plot showing the significance (-log10 p-value) of the association between each of the six classes of H3K27ac, H3K9ac and H3K122ac changes (age-regulated gains or losses, age-dysregulated gains or losses and disease-specific gains or losses) and AD SNP-regions from Kunkle et al.84 using INRICH. Red dashed horizontal line represents the threshold of significance (P < 0.05).
Supplementary Material
Acknowledgments
We thank A. Shilatifard for the histone H3.3 WT and the histone mutants H3.3K27M and H3.3K9M. We thank members of the Berger laboratory for comments on data analyses and P. Ortega for insightful scientific discussions. This work was supported by the Kleber foundation (to S.L.B. and N.M.B.), the NIH/NIA P01-AG031862 (to S.L.B.) and the NIH/NINDS R35-NS097275 (to N.M.B.) grants. C.H. is supported by R01-HG006827. C.H. is a Howard Hughes Medical Institute Investigator. L.W. is supported by U24-AG041689 (NIAGADS) and U54-AG052427 (GCAD). A.A.W. is supported by the T32-AG00255 training grant. B.A.G. is supported by the NIH grants R01-NS111997 and AI118891. J.Q.T. is supported by AG10124.
Footnotes
Competing interests
C.H. holds a patent on technology used (US8741567) and is a shareholder in Shanghai Epican Genetech LTD.
References
- 1.Van Cauwenberghe C, Van Broeckhoven C & Sleegers K The genetic landscape of Alzheimer disease: clinical implications and perspectives. Genet Med 18, 421–30 (2016). [DOI] [PMC free article] [PubMed] [Google Scholar]
- 2.Cummings J Lessons Learned from Alzheimer Disease: Clinical Trials with Negative Outcomes. Clin Transl Sci 11, 147–152 (2018). [DOI] [PMC free article] [PubMed] [Google Scholar]
- 3.Mehta D, Jackson R, Paul G, Shi J & Sabbagh M Why do trials for Alzheimer’s disease drugs keep failing? A discontinued drug perspective for 2010–2015. Expert Opin Investig Drugs 26, 735–739 (2017). [DOI] [PMC free article] [PubMed] [Google Scholar]
- 4.Sen P, Shah PP, Nativio R & Berger SL Epigenetic Mechanisms of Longevity and Aging. Cell 166, 822–839 (2016). [DOI] [PMC free article] [PubMed] [Google Scholar]
- 5.Benayoun BA, Pollina EA & Brunet A Epigenetic regulation of ageing: linking environmental inputs to genomic stability. Nat Rev Mol Cell Biol 16, 593–610 (2015). [DOI] [PMC free article] [PubMed] [Google Scholar]
- 6.Berson A, Nativio R, Berger SL & Bonini NM Epigenetic Regulation in Neurodegenerative Diseases. Trends Neurosci 41, 587–598 (2018). [DOI] [PMC free article] [PubMed] [Google Scholar]
- 7.Graff J & Tsai LH Histone acetylation: molecular mnemonics on the chromatin. Nat Rev Neurosci 14, 97–111 (2013). [DOI] [PubMed] [Google Scholar]
- 8.Gjoneska E et al. Conserved epigenomic signals in mice and humans reveal immune basis of Alzheimer’s disease. Nature 518, 365–9 (2015). [DOI] [PMC free article] [PubMed] [Google Scholar]
- 9.Frost B, Hemberg M, Lewis J & Feany MB Tau promotes neurodegeneration through global chromatin relaxation. Nat Neurosci 17, 357–66 (2014). [DOI] [PMC free article] [PubMed] [Google Scholar]
- 10.Graff J et al. An epigenetic blockade of cognitive functions in the neurodegenerating brain. Nature 483, 222–6 (2012). [DOI] [PMC free article] [PubMed] [Google Scholar]
- 11.Xu K, Dai XL, Huang HC & Jiang ZF Targeting HDACs: a promising therapy for Alzheimer’s disease. Oxid Med Cell Longev 2011, 143269 (2011). [DOI] [PMC free article] [PubMed] [Google Scholar]
- 12.Anand R, Gill KD & Mahdi AA Therapeutics of Alzheimer’s disease: Past, present and future. Neuropharmacology 76 Pt A, 27–50 (2014). [DOI] [PubMed] [Google Scholar]
- 13.Lu T et al. REST and stress resistance in ageing and Alzheimer’s disease. Nature 507, 448–54 (2014). [DOI] [PMC free article] [PubMed] [Google Scholar]
- 14.Ben-Hattar J & Jiricny J Methylation of single CpG dinucleotides within a promoter element of the Herpes simplex virus tk gene reduces its transcription in vivo. Gene 65, 219–27 (1988). [DOI] [PubMed] [Google Scholar]
- 15.De Jager PL et al. Alzheimer’s disease: early alterations in brain DNA methylation at ANK1, BIN1, RHBDF2 and other loci. Nat Neurosci 17, 1156–63 (2014). [DOI] [PMC free article] [PubMed] [Google Scholar]
- 16.Lunnon K et al. Methylomic profiling implicates cortical deregulation of ANK1 in Alzheimer’s disease. Nat Neurosci 17, 1164–70 (2014). [DOI] [PMC free article] [PubMed] [Google Scholar]
- 17.Nativio R et al. Dysregulation of the epigenetic landscape of normal aging in Alzheimer’s disease. Nat Neurosci 21, 497–505 (2018). [DOI] [PMC free article] [PubMed] [Google Scholar]
- 18.Marzi SJ et al. A histone acetylome-wide association study of Alzheimer’s disease identifies disease-associated H3K27ac differences in the entorhinal cortex. Nat Neurosci 21, 1618–1627 (2018). [DOI] [PubMed] [Google Scholar]
- 19.Klein HU et al. Epigenome-wide study uncovers large-scale changes in histone acetylation driven by tau pathology in aging and Alzheimer’s human brains. Nat Neurosci 22, 37–46 (2019). [DOI] [PMC free article] [PubMed] [Google Scholar]
- 20.Huang da W, Sherman BT & Lempicki RA Systematic and integrative analysis of large gene lists using DAVID bioinformatics resources. Nat Protoc 4, 44–57 (2009). [DOI] [PubMed] [Google Scholar]
- 21.Perez Ortiz JM & Swerdlow RH Mitochondrial dysfunction in Alzheimer’s disease: Role in pathogenesis and novel therapeutic opportunities. Br J Pharmacol (2019). [DOI] [PMC free article] [PubMed] [Google Scholar]
- 22.Swerdlow RH Mitochondria and Mitochondrial Cascades in Alzheimer’s Disease. J Alzheimers Dis 62, 1403–1416 (2018). [DOI] [PMC free article] [PubMed] [Google Scholar]
- 23.Chien HC et al. Targeted disruption in mice of a neural stem cell-maintaining, KRAB-Zn finger-encoding gene that has rapidly evolved in the human lineage. PLoS One 7, e47481 (2012). [DOI] [PMC free article] [PubMed] [Google Scholar]
- 24.Vincent-Fabert C et al. PLZF mutation alters mouse hematopoietic stem cell function and cell cycle progression. Blood 127, 1881–5 (2016). [DOI] [PubMed] [Google Scholar]
- 25.Nagy Z, Esiri MM & Smith AD The cell division cycle and the pathophysiology of Alzheimer’s disease. Neuroscience 87, 731–9 (1998). [DOI] [PubMed] [Google Scholar]
- 26.Meikrantz W & Schlegel R Apoptosis and the cell cycle. J Cell Biochem 58, 160–74 (1995). [DOI] [PubMed] [Google Scholar]
- 27.Piu F, Aronheim A, Katz S & Karin M AP-1 repressor protein JDP-2: inhibition of UV-mediated apoptosis through p53 down-regulation. Mol Cell Biol 21, 3012–24 (2001). [DOI] [PMC free article] [PubMed] [Google Scholar]
- 28.Zhang P et al. Hypoxia-inducible factor 3 is an oxygen-dependent transcription activator and regulates a distinct transcriptional response to hypoxia. Cell Rep 6, 1110–1121 (2014). [DOI] [PubMed] [Google Scholar]
- 29.Wethkamp N & Klempnauer KH Daxx is a transcriptional repressor of CCAAT/enhancer-binding protein beta. J Biol Chem 284, 28783–94 (2009). [DOI] [PMC free article] [PubMed] [Google Scholar]
- 30.Yang X, Khosravi-Far R, Chang HY & Baltimore D Daxx, a novel Fas-binding protein that activates JNK and apoptosis. Cell 89, 1067–76 (1997). [DOI] [PMC free article] [PubMed] [Google Scholar]
- 31.Tate CM, Lee JH & Skalnik DG CXXC finger protein 1 restricts the Setd1A histone H3K4 methyltransferase complex to euchromatin. FEBS J 277, 210–23 (2010). [DOI] [PMC free article] [PubMed] [Google Scholar]
- 32.Chang B, Chen Y, Zhao Y & Bruick RK JMJD6 is a histone arginine demethylase. Science 318, 444–7 (2007). [DOI] [PubMed] [Google Scholar]
- 33.Anderson KW et al. Quantification of histone deacetylase isoforms in human frontal cortex, human retina, and mouse brain. PLoS One 10, e0126592 (2015). [DOI] [PMC free article] [PubMed] [Google Scholar]
- 34.Shen X, Chen J, Li J, Kofler J & Herrup K Neurons in Vulnerable Regions of the Alzheimer’s Disease Brain Display Reduced ATM Signaling. eNeuro 3(2016). [DOI] [PMC free article] [PubMed] [Google Scholar]
- 35.Wu Y et al. Aberrant Expression of Histone Deacetylases 4 in Cognitive Disorders: Molecular Mechanisms and a Potential Target. Front Mol Neurosci 9, 114 (2016). [DOI] [PMC free article] [PubMed] [Google Scholar]
- 36.Lau P et al. Alteration of the microRNA network during the progression of Alzheimer’s disease. EMBO Mol Med 5, 1613–34 (2013). [DOI] [PMC free article] [PubMed] [Google Scholar]
- 37.Szklarczyk D et al. STRING v11: protein-protein association networks with increased coverage, supporting functional discovery in genome-wide experimental datasets. Nucleic Acids Res 47, D607–D613 (2019). [DOI] [PMC free article] [PubMed] [Google Scholar]
- 38.Petrij F et al. Rubinstein-Taybi syndrome caused by mutations in the transcriptional co-activator CBP. Nature 376, 348–51 (1995). [DOI] [PubMed] [Google Scholar]
- 39.Roelfsema JH et al. Genetic heterogeneity in Rubinstein-Taybi syndrome: mutations in both the CBP and EP300 genes cause disease. Am J Hum Genet 76, 572–80 (2005). [DOI] [PMC free article] [PubMed] [Google Scholar]
- 40.Jin Q et al. Distinct roles of GCN5/PCAF-mediated H3K9ac and CBP/p300-mediated H3K18/27ac in nuclear receptor transactivation. EMBO J 30, 249–62 (2011). [DOI] [PMC free article] [PubMed] [Google Scholar]
- 41.Koutelou E, Hirsch CL & Dent SY Multiple faces of the SAGA complex. Curr Opin Cell Biol 22, 374–82 (2010). [DOI] [PMC free article] [PubMed] [Google Scholar]
- 42.Spedale G, Timmers HT & Pijnappel WW ATAC-king the complexity of SAGA during evolution. Genes Dev 26, 527–41 (2012). [DOI] [PMC free article] [PubMed] [Google Scholar]
- 43.Allen M et al. Human whole genome genotype and transcriptome data for Alzheimer’s and other neurodegenerative diseases. Sci Data 3, 160089 (2016). [DOI] [PMC free article] [PubMed] [Google Scholar]
- 44.Wang M et al. The Mount Sinai cohort of large-scale genomic, transcriptomic and proteomic data in Alzheimer’s disease. Sci Data 5, 180185 (2018). [DOI] [PMC free article] [PubMed] [Google Scholar]
- 45.Yuan ZF et al. EpiProfile 2.0: A Computational Platform for Processing Epi-Proteomics Mass Spectrometry Data. J Proteome Res 17, 2533–2541 (2018). [DOI] [PMC free article] [PubMed] [Google Scholar]
- 46.Wagner EJ & Carpenter PB Understanding the language of Lys36 methylation at histone H3. Nat Rev Mol Cell Biol 13, 115–26 (2012). [DOI] [PMC free article] [PubMed] [Google Scholar]
- 47.Martin C & Zhang Y The diverse functions of histone lysine methylation. Nat Rev Mol Cell Biol 6, 838–49 (2005). [DOI] [PubMed] [Google Scholar]
- 48.Wang Z et al. Combinatorial patterns of histone acetylations and methylations in the human genome. Nat Genet 40, 897–903 (2008). [DOI] [PMC free article] [PubMed] [Google Scholar]
- 49.Kuo AJ et al. The BAH domain of ORC1 links H4K20me2 to DNA replication licensing and Meier-Gorlin syndrome. Nature 484, 115–9 (2012). [DOI] [PMC free article] [PubMed] [Google Scholar]
- 50.Kaimori JY et al. Histone H4 lysine 20 acetylation is associated with gene repression in human cells. Sci Rep 6, 24318 (2016). [DOI] [PMC free article] [PubMed] [Google Scholar]
- 51.Creyghton MP et al. Histone H3K27ac separates active from poised enhancers and predicts developmental state. Proc Natl Acad Sci U S A 107, 21931–6 (2010). [DOI] [PMC free article] [PubMed] [Google Scholar]
- 52.Calo E & Wysocka J Modification of enhancer chromatin: what, how, and why? Mol Cell 49, 825–37 (2013). [DOI] [PMC free article] [PubMed] [Google Scholar]
- 53.Guillemette B et al. H3 lysine 4 is acetylated at active gene promoters and is regulated by H3 lysine 4 methylation. PLoS Genet 7, e1001354 (2011). [DOI] [PMC free article] [PubMed] [Google Scholar]
- 54.Xhemalce B & Kouzarides T A chromodomain switch mediated by histone H3 Lys 4 acetylation regulates heterochromatin assembly. Genes Dev 24, 647–52 (2010). [DOI] [PMC free article] [PubMed] [Google Scholar]
- 55.Wu RS, Tsai S & Bonner WM Patterns of histone variant synthesis can distinguish G0 from G1 cells. Cell 31, 367–74 (1982). [DOI] [PubMed] [Google Scholar]
- 56.Wu RS & Bonner WM Separation of basal histone synthesis from S-phase histone synthesis in dividing cells. Cell 27, 321–30 (1981). [DOI] [PubMed] [Google Scholar]
- 57.Gabrielli F et al. Histone complements of human tissues, carcinomas, and carcinoma-derived cell lines. Mol Cell Biochem 65, 57–66 (1984). [PubMed] [Google Scholar]
- 58.Heintzman ND et al. Distinct and predictive chromatin signatures of transcriptional promoters and enhancers in the human genome. Nat Genet 39, 311–8 (2007). [DOI] [PubMed] [Google Scholar]
- 59.Pradeepa MM et al. Histone H3 globular domain acetylation identifies a new class of enhancers. Nat Genet 48, 681–6 (2016). [DOI] [PMC free article] [PubMed] [Google Scholar]
- 60.Han D et al. A Highly Sensitive and Robust Method for Genome-wide 5hmC Profiling of Rare Cell Populations. Mol Cell 63, 711–719 (2016). [DOI] [PMC free article] [PubMed] [Google Scholar]
- 61.Sun W, Zang L, Shu Q & Li X From development to diseases: the role of 5hmC in brain. Genomics 104, 347–51 (2014). [DOI] [PubMed] [Google Scholar]
- 62.Stroud H, Feng S, Morey Kinney S, Pradhan S & Jacobsen SE 5-Hydroxymethylcytosine is associated with enhancers and gene bodies in human embryonic stem cells. Genome Biol 12, R54 (2011). [DOI] [PMC free article] [PubMed] [Google Scholar]
- 63.Tropberger P et al. Regulation of transcription through acetylation of H3K122 on the lateral surface of the histone octamer. Cell 152, 859–72 (2013). [DOI] [PubMed] [Google Scholar]
- 64.McLean CY et al. GREAT improves functional interpretation of cis-regulatory regions. Nat Biotechnol 28, 495–501 (2010). [DOI] [PMC free article] [PubMed] [Google Scholar]
- 65.Wyss-Coray T Inflammation in Alzheimer disease: driving force, bystander or beneficial response? Nat Med 12, 1005–15 (2006). [DOI] [PubMed] [Google Scholar]
- 66.De Ferrari GV et al. Wnt/beta-catenin signaling in Alzheimer’s disease. CNS Neurol Disord Drug Targets 13, 745–54 (2014). [DOI] [PubMed] [Google Scholar]
- 67.Boonen RA, van Tijn P & Zivkovic D Wnt signaling in Alzheimer’s disease: up or down, that is the question. Ageing Res Rev 8, 71–82 (2009). [DOI] [PubMed] [Google Scholar]
- 68.Banzhaf-Strathmann J et al. MicroRNA-125b induces tau hyperphosphorylation and cognitive deficits in Alzheimer’s disease. EMBO J 33, 1667–80 (2014). [DOI] [PMC free article] [PubMed] [Google Scholar]
- 69.Heinz S et al. Simple combinations of lineage-determining transcription factors prime cis-regulatory elements required for macrophage and B cell identities. Mol Cell 38, 576–89 (2010). [DOI] [PMC free article] [PubMed] [Google Scholar]
- 70.Satoh J, Kawana N & Yamamoto Y Pathway Analysis of ChIP-Seq-Based NRF1 Target Genes Suggests a Logical Hypothesis of their Involvement in the Pathogenesis of Neurodegenerative Diseases. Gene Regul Syst Bio 7, 139–52 (2013). [DOI] [PMC free article] [PubMed] [Google Scholar]
- 71.Lee CS et al. Loss of nuclear factor E2-related factor 1 in the brain leads to dysregulation of proteasome gene expression and neurodegeneration. Proc Natl Acad Sci U S A 108, 8408–13 (2011). [DOI] [PMC free article] [PubMed] [Google Scholar]
- 72.Nativio R et al. Cohesin is required for higher-order chromatin conformation at the imprinted IGF2-H19 locus. PLoS Genet 5, e1000739 (2009). [DOI] [PMC free article] [PubMed] [Google Scholar]
- 73.Phillips JE & Corces VG CTCF: master weaver of the genome. Cell 137, 1194–211 (2009). [DOI] [PMC free article] [PubMed] [Google Scholar]
- 74.Trimarchi JM & Lees JA Sibling rivalry in the E2F family. Nat Rev Mol Cell Biol 3, 11–20 (2002). [DOI] [PubMed] [Google Scholar]
- 75.Qin XQ, Livingston DM, Kaelin WG Jr. & Adams PD Deregulated transcription factor E2F-1 expression leads to S-phase entry and p53-mediated apoptosis. Proc Natl Acad Sci U S A 91, 10918–22 (1994). [DOI] [PMC free article] [PubMed] [Google Scholar]
- 76.Shan B & Lee WH Deregulated expression of E2F-1 induces S-phase entry and leads to apoptosis. Mol Cell Biol 14, 8166–73 (1994). [DOI] [PMC free article] [PubMed] [Google Scholar]
- 77.Mitxelena J et al. An E2F7-dependent transcriptional program modulates DNA damage repair and genomic stability. Nucleic Acids Res 46, 4546–4559 (2018). [DOI] [PMC free article] [PubMed] [Google Scholar]
- 78.de Bruin A et al. Identification and characterization of E2F7, a novel mammalian E2F family member capable of blocking cellular proliferation. J Biol Chem 278, 42041–9 (2003). [DOI] [PubMed] [Google Scholar]
- 79.Liu B, Shats I, Angus SP, Gatza ML & Nevins JR Interaction of E2F7 transcription factor with E2F1 and C-terminal-binding protein (CtBP) provides a mechanism for E2F7-dependent transcription repression. J Biol Chem 288, 24581–9 (2013). [DOI] [PMC free article] [PubMed] [Google Scholar]
- 80.Zhang S & Cui W Sox2, a key factor in the regulation of pluripotency and neural differentiation. World J Stem Cells 6, 305–11 (2014). [DOI] [PMC free article] [PubMed] [Google Scholar]
- 81.Vaeth M & Feske S NFAT control of immune function: New Frontiers for an Abiding Trooper. F1000Res 7, 260 (2018). [DOI] [PMC free article] [PubMed] [Google Scholar]
- 82.Lee YF et al. Premature aging with impaired oxidative stress defense in mice lacking TR4. Am J Physiol Endocrinol Metab 301, E91–8 (2011). [DOI] [PMC free article] [PubMed] [Google Scholar]
- 83.Lambert JC et al. Meta-analysis of 74,046 individuals identifies 11 new susceptibility loci for Alzheimer’s disease. Nat Genet 45, 1452–8 (2013). [DOI] [PMC free article] [PubMed] [Google Scholar]
- 84.Kunkle BW et al. Genetic meta-analysis of diagnosed Alzheimer’s disease identifies new risk loci and implicates Abeta, tau, immunity and lipid processing. Nat Genet 51, 414–430 (2019). [DOI] [PMC free article] [PubMed] [Google Scholar]
- 85.Lee PH, O’Dushlaine C, Thomas B & Purcell SM INRICH: interval-based enrichment analysis for genome-wide association studies. Bioinformatics 28, 1797–9 (2012). [DOI] [PMC free article] [PubMed] [Google Scholar]
- 86.Nica AC & Dermitzakis ET Expression quantitative trait loci: present and future. Philos Trans R Soc Lond B Biol Sci 368, 20120362 (2013). [DOI] [PMC free article] [PubMed] [Google Scholar]
- 87.Zou F et al. Brain expression genome-wide association study (eGWAS) identifies human disease-associated variants. PLoS Genet 8, e1002707 (2012). [DOI] [PMC free article] [PubMed] [Google Scholar]
- 88.Casas-Tinto S et al. The ER stress factor XBP1s prevents amyloid-beta neurotoxicity. Hum Mol Genet 20, 2144–60 (2011). [DOI] [PMC free article] [PubMed] [Google Scholar]
- 89.Cutler T et al. Drosophila Eye Model to Study Neuroprotective Role of CREB Binding Protein (CBP) in Alzheimer’s Disease. PLoS One 10, e0137691 (2015). [DOI] [PMC free article] [PubMed] [Google Scholar]
- 90.Kouzarides T Acetylation: a regulatory modification to rival phosphorylation? EMBO J 19, 1176–9 (2000). [DOI] [PMC free article] [PubMed] [Google Scholar]
- 91.Herz HM et al. Histone H3 lysine-to-methionine mutants as a paradigm to study chromatin signaling. Science 345, 1065–70 (2014). [DOI] [PMC free article] [PubMed] [Google Scholar]
- 92.Tie F et al. CBP-mediated acetylation of histone H3 lysine 27 antagonizes Drosophila Polycomb silencing. Development 136, 3131–41 (2009). [DOI] [PMC free article] [PubMed] [Google Scholar]
- 93.Dai J et al. Probing nucleosome function: a highly versatile library of synthetic histone H3 and H4 mutants. Cell 134, 1066–78 (2008). [DOI] [PMC free article] [PubMed] [Google Scholar]
- 94.Korzus E, Rosenfeld MG & Mayford M CBP histone acetyltransferase activity is a critical component of memory consolidation. Neuron 42, 961–72 (2004). [DOI] [PMC free article] [PubMed] [Google Scholar]
- 95.Caccamo A, Maldonado MA, Bokov AF, Majumder S & Oddo S CBP gene transfer increases BDNF levels and ameliorates learning and memory deficits in a mouse model of Alzheimer’s disease. Proc Natl Acad Sci U S A 107, 22687–92 (2010). [DOI] [PMC free article] [PubMed] [Google Scholar]
- 96.Zhang M et al. Role of CBP and SATB-1 in aging, dietary restriction, and insulin-like signaling. PLoS Biol 7, e1000245 (2009). [DOI] [PMC free article] [PubMed] [Google Scholar]
- 97.Min SW et al. Acetylation of tau inhibits its degradation and contributes to tauopathy. Neuron 67, 953–66 (2010). [DOI] [PMC free article] [PubMed] [Google Scholar]
- 98.Weinert BT et al. Time-Resolved Analysis Reveals Rapid Dynamics and Broad Scope of the CBP/p300 Acetylome. Cell 174, 231–244 e12 (2018). [DOI] [PMC free article] [PubMed] [Google Scholar]
- 99.Toledo JB et al. A platform for discovery: The University of Pennsylvania Integrated Neurodegenerative Disease Biobank. Alzheimers Dement 10, 477–84 e1 (2014). [DOI] [PMC free article] [PubMed] [Google Scholar]
- 100.Mirra SS The CERAD neuropathology protocol and consensus recommendations for the postmortem diagnosis of Alzheimer’s disease: a commentary. Neurobiol Aging 18, S91–4 (1997). [DOI] [PubMed] [Google Scholar]
- 101.Braak H, Alafuzoff I, Arzberger T, Kretzschmar H & Del Tredici K Staging of Alzheimer disease-associated neurofibrillary pathology using paraffin sections and immunocytochemistry. Acta Neuropathol 112, 389–404 (2006). [DOI] [PMC free article] [PubMed] [Google Scholar]
- 102.Risso D, Ngai J, Speed TP & Dudoit S Normalization of RNA-seq data using factor analysis of control genes or samples. Nat Biotechnol 32, 896–902 (2014). [DOI] [PMC free article] [PubMed] [Google Scholar]
- 103.Shannon P et al. Cytoscape: a software environment for integrated models of biomolecular interaction networks. Genome Res 13, 2498–504 (2003). [DOI] [PMC free article] [PubMed] [Google Scholar]
- 104.Blalock EM, Buechel HM, Popovic J, Geddes JW & Landfield PW Microarray analyses of laser-captured hippocampus reveal distinct gray and white matter signatures associated with incipient Alzheimer’s disease. J Chem Neuroanat 42, 118–26 (2011). [DOI] [PMC free article] [PubMed] [Google Scholar]
- 105.Sidoli S, Bhanu NV, Karch KR, Wang X & Garcia BA Complete Workflow for Analysis of Histone Post-translational Modifications Using Bottom-up Mass Spectrometry: From Histone Extraction to Data Analysis. J Vis Exp (2016). [DOI] [PMC free article] [PubMed] [Google Scholar]
- 106.Sidoli S, Simithy J, Karch KR, Kulej K & Garcia BA Low Resolution Data-Independent Acquisition in an LTQ-Orbitrap Allows for Simplified and Fully Untargeted Analysis of Histone Modifications. Anal Chem 87, 11448–54 (2015). [DOI] [PMC free article] [PubMed] [Google Scholar]
- 107.Langmead B & Salzberg SL Fast gapped-read alignment with Bowtie 2. Nat Methods 9, 357–9 (2012). [DOI] [PMC free article] [PubMed] [Google Scholar]
- 108.Chen X et al. Integration of external signaling pathways with the core transcriptional network in embryonic stem cells. Cell 133, 1106–17 (2008). [DOI] [PubMed] [Google Scholar]
- 109.Kang HJ et al. Spatio-temporal transcriptome of the human brain. Nature 478, 483–9 (2011). [DOI] [PMC free article] [PubMed] [Google Scholar]
- 110.Kent WJ et al. The human genome browser at UCSC. Genome Res 12, 996–1006 (2002). [DOI] [PMC free article] [PubMed] [Google Scholar]
- 111.Quinlan AR & Hall IM BEDTools: a flexible suite of utilities for comparing genomic features. Bioinformatics 26, 841–2 (2010). [DOI] [PMC free article] [PubMed] [Google Scholar]
- 112.An integrated encyclopedia of DNA elements in the human genome. Nature 489, 57–74 (2012). [DOI] [PMC free article] [PubMed] [Google Scholar]
- 113.Moreno-Jimenez EP et al. Adult hippocampal neurogenesis is abundant in neurologically healthy subjects and drops sharply in patients with Alzheimer’s disease. Nat Med 25, 554–560 (2019). [DOI] [PubMed] [Google Scholar]
Associated Data
This section collects any data citations, data availability statements, or supplementary materials included in this article.
Supplementary Materials
Data Availability Statement
The epigenomic and transcriptomic data that support the findings of this study are available through the NCBI Gene Expression Omnibus (GEO) repository under accession number GSE153875. Part of the Input libraries were previously generated17 and are available under GSE84618. The proteomic data are available through the repository Chorus under accession number 1684.


