Abstract
Cluster analysis of presolar silicon carbide grains based on literature data for 12C/13C, 14N/15N, δ30Si/28Si, and δ29Si/28Si including or not inferred initial 26Al/27Al data, reveals nine clusters agreeing with previously defined grain types but also highlighting new divisions. Mainstream grains reside in three clusters probably representing different parent star metallicities. One of these clusters has a compact core, with a narrow range of composition, pointing to an enhanced production of SiC grains in asymptotic giant branch (AGB) stars with a narrow range of masses and metallicities. The addition of 26Al/27Al data highlights a cluster of mainstream grains, enriched in 15N and 26Al, which cannot be explained by current AGB models. We defined two AB grain clusters, one with 15N and 26Al excesses, and the other with 14N and smaller 26Al excesses, in agreement with recent studies. Their definition does not use the solar N isotopic ratio as a divider, and the contour of the 26Al-rich AB cluster identified in this study is in better agreement with core-collapse supernova models. We also found a cluster with a mixture of putative nova and AB grains, which may have formed in supernova or nova environments. X grains make up two clusters, having either strongly correlated Si isotopic ratios or deviating from the 2/3 slope line in the Si 3-isotope plot. Finally, most Y and Z grains are jointly clustered, suggesting that the previous use of 12C/13C = 100 as a divider for Y grains was arbitrary. Our results show that cluster analysis is a powerful tool to interpret the data in light of stellar evolution and nucleosynthesis modeling and highlight the need of more multi-element isotopic data for better classification.
Keywords: Nucleosynthesis (1131), Interstellar dust (836), Clustering (1908), Stellar evolution (1599)
1. Introduction
Presolar grains are condensates formed in stellar outflows or explosions during the advanced stages of stellar evolution and now found preserved in meteoritic materials. They can be recognized through their highly anomalous isotopic compositions that differ strongly from material formed in the solar system (see Zinner 2014; Nittler & Ciesla 2016). These anomalous isotopic compositions for a number of elements, e.g., C and O, are indicators of their formation in stars and provide a variety of information on their stellar sources, from the original Galactic material from which their parent stars formed, to the nucleosynthesis occurring in stars and the mixing of different layers within stars and exploding novae and supernovae. Among the different mineral phases of presolar grains, silicon carbides (SiC) are the most studied, since they can be isolated from meteorites relatively easily by acid dissolution. Their sizes typically range from a few hundred nm up to several micrometers, allowing detailed isotopic characterization by laboratory methods such as secondary ion mass spectrometry.
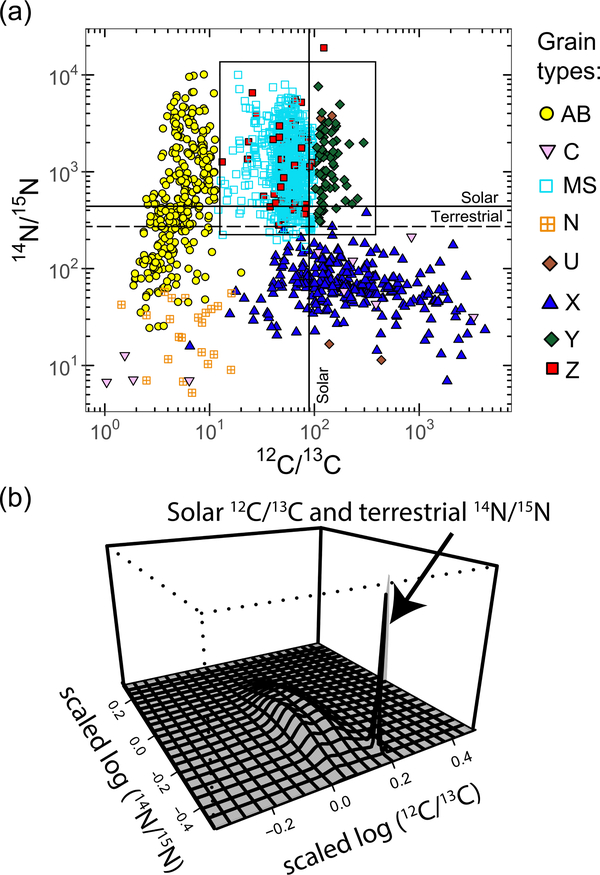
Previous studies used the isotopic compositions of presolar SiC grains to classify them into different types, potentially corresponding to different stellar formation environments. The majority of presolar SiC grains formed in asymptotic giant branch (AGB) stars, a late stage in the evolution of low- and intermediate-mass (1–8 M⨀) stars. AGB stars are believed to be the parents of ~95% of SiC grains, those classified as mainstream (hereafter MS, representing ~90% of all grains), Y (a few %), and Z (a few %) types (Zinner 2014). The MS grain population was defined as having a C isotopic composition (12C/13C) between 12 and 100, and δ29Si/28Si and δ30Si/28Si correlating with a slope of 1.37 (e.g., Lugaro et al. 1999; Stephan et al. 2020; Zinner 2014) (Figure 1(a)). Y and Z grains have Si isotopic compositions deviating from the linear correlation observed for MS grains toward larger 30Si enrichments relative to 29Si, with a larger deviation for Z grains than for Y grains (e.g., Zinner et al. 2006). These compositions were interpreted as the result of formation in low- to intermediate-mass AGB stars of lower-than-solar metallicities, which have enhanced maximum stellar temperatures to allow more efficient operation of the reaction 22Ne(α, n)25Mg and, in turn, higher production of the neutron-rich isotope 30Si by neutron capture (Hoppe et al. 1997; Lugaro et al. 1999). In addition, Y grains are defined to have 12C/13C > 100, while Z grains have 12C/13C < 100, similar to MS grains. This difference in C isotopic composition was interpreted as the signature of possible cool-bottom processing (CBP; Wasserburg et al. 1995) in the parent stars of Z grains, e.g., mixing of envelope material with material from deep hot regions close to the H-burning shell, resulting in extra productions of 13C in the parent stars of Z grains (e.g., Nittler & Alexander 2003). Alternatively, Z grains may come from high-mass stars, where hot bottom burning is activated (Lewis et al. 2013). However, by constraining the efficiency of the reaction 22Ne(α, n)25Mg using the Mo isotopic compositions of Z grains, Liu et al. (2019) showed that current nucleosynthesis models for AGB stars of lower-than-solar metallicity and/or highmasses (>3 M⨀) cannot explain Z grains’ large 30Si excesses. AB grains (4%–5%) have lower 12C/13C ratios (<12) than MS, Y, and X grains (Stephan et al. 2020). They show a similar range of Si isotopic compositions as MS grains, but exhibit a larger range of 14N/15N and higher inferred initial 26Al/27Al ratios. Their isotopic signatures suggest that they may originate in J-type carbon stars (Liu et al. 2017c), born-again AGB stars (Alexander 1993; Amari et al. 2001c), and/or core-collapse supernovae (CCSNe; Liu et al. 2017c). Type X grains have distinct excesses in 15N, 28Si, and 26Mg resulting from the decay of extinct 26Al (t1/2 = 0.72 Ma) and a wide range of 12C/13C ratios (Figure 1(a)). Some of these grains contain evidence for extinct 44Ti (t1/2 = 60 a), which is a proof of their supernova origin (Nittler et al. 1996). Type C grains are also thought to form in CCSNe and are characterized by very large excesses in 29Si and 30Si isotopes. In comparison to X grains, C grains are believed to originate from more external CCSN layers (Pignatari et al. 2013a). Putative nova grains (N grains) are generally characterized by large excesses in 13C, 15N, 30Si, and 26Al, which are likely caused by high-temperature explosive H burning in novae and/or supernovae (e.g., Amari et al. 2001a; Nittler 2005; Liu et al. 2016). Finally, grains with isotopic compositions that do not fit in any of the groups defined above are named ungrouped grains, U grains (<0.1‰), and some of them also likely originated in CCSNe (Xu et al. 2015; Liu et al. 2018a).
Figure 1.
Nitrogen and carbon (a) isotopic compositions of presolar SiC grains. Plotted data are from the updated PGD (Stephan et al. 2020). We used the following standard isotopic ratios: (12C/13C)solar = 89 (Lambert & Mallia 1968), (14N/15N)solar = 440 (Marty et al. 2011), and (14N/15N)terrestrial = 272 (Junk & Svec 1958). (b) is a perspective plot of the bivariate density distribution, scaled to an average of zero and unit standard deviation, for the area shown with the square in (a). Grains likely affected by solar system contamination create a peak at the solar 12C/13C and terrestrial 14N/15N isotopic ratios (b).
The classification of SiC grains has been continuously evolving because of the growing database of presolar grains and the improvements in astrophysical models. For example, it has been suggested to further sub-divide X, AB, and C grains on the basis of various isotopic signatures (Lin et al. 2010; Liu et al. 2016, 2017c). Advances in machine learning algorithms and the availability of the Presolar Grain Database (PGD; (Hynes & Gyngard 2009; Stephan et al. 2020) offer a great opportunity to improve this classification and to gain further insights into the origin of presolar grains. In particular, cluster analysis is a statistical method that enables quantitative determination of groups of samples having similar features based on the density distribution of the data set. In this study, we investigate the clustering of presolar SiC grains using state-of-the-art cluster analysis techniques and the updated PGD (Stephan et al. 2020). We then compare the results with previous classifications and astronomical models.
2. Methods
We used SiC grain data from the PGD, initially compiled ~10 years ago (Hynes & Gyngard 2009) and recently updated (Stephan et al. 2020) (https://presolar.phys-ics.wustl.edu/presolar-grain-database/). The most recent database PGD_SiC_2020–08-18 contains isotopic compositions for 19,759 presolar SiC grains. Here, we worked with two data sets; hereafter DB4 and DB5, which provide the most relevant results for addressing stellar formation environments of presolar grains (see Appendix A). The largest data set DB4 includes 1354 data points with measured 12C/13C, 14N/15N, δ29Si/28Si and δ30Si/28Si ratios from PGD_SiC_2020–08-18. DB5 additionally includes inferred initial 26Al/27Al ratios, which reduces the number of observations to 402. For DB5, we considered the database PGD_SiC_2020–01-30 (available throughout almost the entire duration of the project), and additional data published in the last four years (see Appendix A and Supp. Table available on Github8); the combined data set is similar to the data in the PGD_SiC_2020–08-18, and we, therefore, did not rerun our cluster analysis. We excluded grains of C and U types, since these grains are relatively rare. In addition, since DB4 samples a large number of MS grains, we excluded those having 1σ uncertainties in δ29Si/28Si and δ30Si/28Si larger than 10‰, to increase the clustering quality. We took the logarithms of all the isotopic ratios, and then scaled them to an average of zero and unit standard deviation. These transformations reduce the skewness of the data and are comparable to the graphical tradition of using equally sized axes, sometimes log-scaled, with optimal minimal and maximal values, to maximize the visualization of data variance. This normalization prevents the clustering from being controlled by the variables having the largest absolute values, rather than the variance of the entire data.
Several cluster analysis techniques exist, including clustering approaches based on the distribution or density of the data, connectivity of data points, and average distances between data points (e.g., Jain 2010). Each algorithm presents advantages and disadvantages and can be more or less appropriate to specific data sets. We used a model-based clustering algorithm, which assumes that the data set is a mixture of probability distributions and finds clusters by maximizing the probability that each data point belongs to a specific cluster. This technique is appropriate for overlapping clusters that are difficult to resolve with other algorithms. The SiC grain groups as currently defined present significant overlap, for example, AB and MS grains have similar Si isotopic compositions, and MS and Z grains have similar ranges of N and C isotopic ratios (Figure 1(a)). Therefore, model-based clustering is especially suitable for clustering presolar SiC grains. We used the Mclust R package (Scrucca et al. 2016) that assumes mixtures of Gaussian distributions and selected the best clustering models using the highest Bayesian Information Criterion, which is known to provide models that best fit overlapping data (Bouveyron et al. 2019). Our R code for presolar SiC cluster analysis is available on GitHub.9
3. Results and Discussion
3.1. Clustering Results
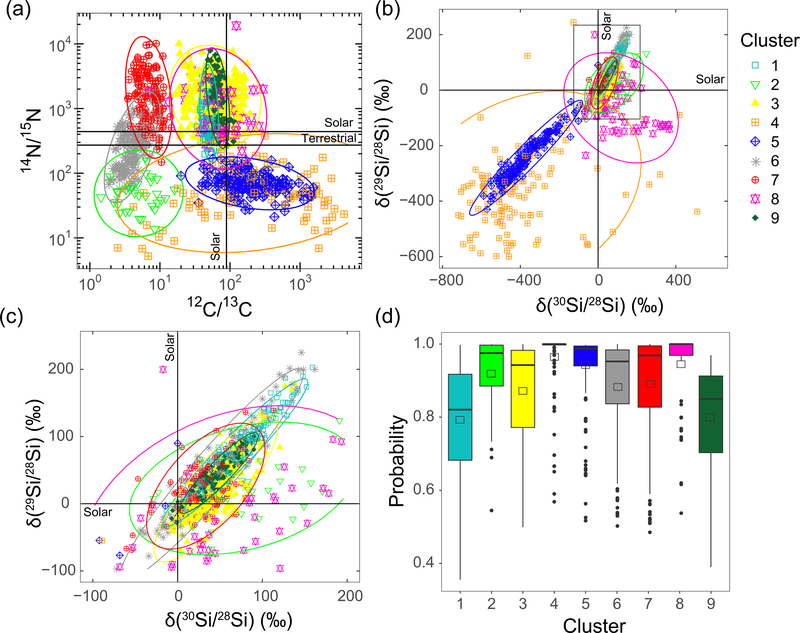
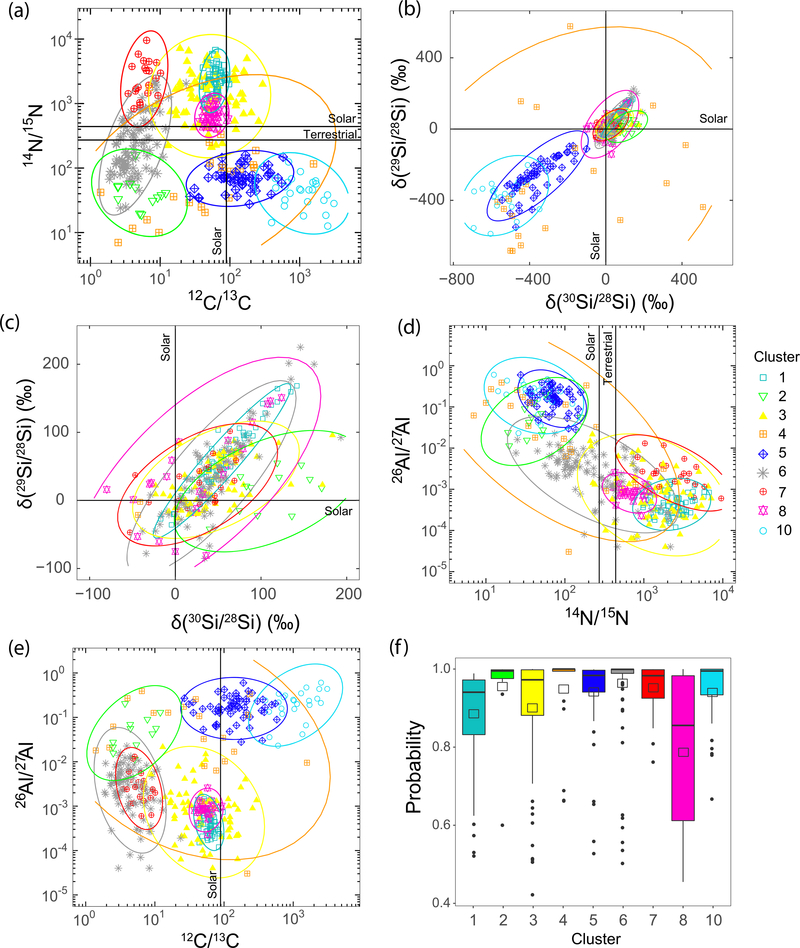
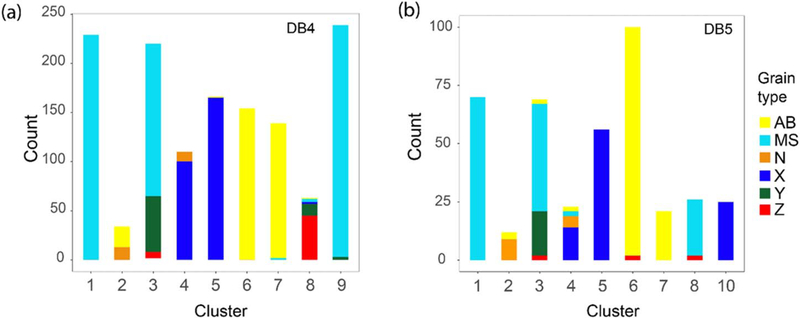
Initial cluster analysis of data set DB4 yielded, among other clusters, a tightly constrained group of 20 MS grains, having a terrestrial isotopic composition for C, Si, and N. These grains were likely contaminated by solar system material, and therefore, removed from our data sets, since their presence affects strongly the density distribution of the data sets (Figure 1(b)). Table 1, Figures 2–3, and the Supplementary Table available on Github10 show the properties of the obtained clusters, their isotopic compositions, and linear regression results of their Si isotopic compositions. Both cluster analyses of DB4 and DB5 indicate the presence of nine different clusters of relatively good quality, since all clusters have an average probability close to or higher than 0.8 (Figures 2(d) and 3(f)). However, clusters of grains with overlapping isotopic compositions (in DB4 cluster 1, 3, and 9, hereafter c1DB4, c3DB4, and c9DB4, respectively, and in DB5 clusters c1DB5, c3DB5, and c8DB5, all of which contain mostly MS, Y, and Z grains) have lower ranges of probability than the other clusters. Principal component analysis collapsing the dimensions into the most significant (Figure 7) shows that using both data sets, DB4 and DB5, ~67% and ~21% of the data set variance are included in the first and second components, respectively. While the first component includes the variances of all isotopic ratios, the second is dominated by 12C/13C, 14N/15N, and 26Al/27Al (Figure 8). Our results broadly agree with the original classification for the three main groups of presolar SiC grains (AB, X, and MS), but allowed us to discover additional divisions: AB grains are included in two clusters, X in two and three clusters in DB4 and DB5, respectively, and MS in three clusters (see Figure 9).
Table 1.
Isotopic Data of Clusters Found with DB4 and DB5
| Cluster DB4 | N | Types |
12C/13C |
14N/15N |
δ29Si/28Si (‰) |
δ30Si/28Si (‰) |
26Al/27Al |
Si Isotope Correlationa |
|||||||||||
|---|---|---|---|---|---|---|---|---|---|---|---|---|---|---|---|---|---|---|---|
| Mean | Std Dev | Mean | Std Dev | Mean | Std Dev | Mean | Std Dev | Mean | Std Dev | R2 | F | Intercept | Std Error | Slope | Std Error | p Value | |||
| 1 | 229 | 100% MS | 51 | 6 | 1080 | 804 | 76 | 45 | 68 | 35 | 0.91 | 2271 | −7.2 | 2 | 1.22 | 0.03 | <2e–16 | ||
| 2 | 34 | 62% AB 38% N | 6 | 3 | 59 | 39 | 26 | 42 | 82 | 59 | 0.23 | 9 | −1.9 | 11 | 0.34 | 0.11 | 4E–03 | ||
| 3 | 220 | 70% MS 26% Y 4% Z | 73 | 42 | 1995 | 1518 | 22 | 44 | 45 | 30 | 0.71 | 528 | −34.5 | 2.9 | 1.26 | 0.06 | <2e–16 | ||
| 4 | 110 | 91% X 9% N | 788 | 1424 | 67 | 59 | −394 | 163 | −389 | 273 | 0.1 | 12 | −321 | 26 | 0.19 | 0.05 | 8.E–04 | ||
| 5 | 166 | 99.4% X 0.6% AB | 283 | 288 | 75 | 29 | −244 | 84 | −371 | 118 | 0.92 | 1975 | 11 | 6 | 0.69 | 0.02 | <2e–16 | ||
| 6 | 154 | 100% AB | 4 | 2 | 351 | 346 | 43 | 64 | 40 | 44 | 0.91 | 1456 | −12.8 | 2.2 | 1.39 | 0.04 | <2e–16 | ||
| 7 | 139 | 98.6% AB 1.4% MS | 7 | 2 | 2133 | 1912 | 26 | 38 | 33 | 28 | 0.35 | 75 | 0.21 | 4 | 0.8 | 0.09 | 1E–14 | ||
| 8 | 63 | 71% Z19% Y 5% MS 3% X 2% AB | 82 | 55 | 1542 | 2439 | −64 | 79 | 118 | 118 | 0.07 | 5 | −12.7 | 13.8 | −0.18 | 0.08 | 4E–02 | ||
| 9 | 239 | 99% MS 1% Y | 68 | 11 | 1859 | 1331 | 46 | 24 | 49 | 19 | 0.84 | 1247 | −12.2 | 1.8 | 1.19 | 0.03 | <2e–16 | ||
| DB5 | |||||||||||||||||||
| 1b | 70 | 100% MS | 61 | 13 | 2496 | 1194 | 58 | 45 | 55 | 32 | 0.0005 | 0.0003 | 0.9 | 637 | −15 | 3 | 1.34 | 0.05 | <2e–16 |
| 2 | 12 | 75% N 25% AB | 6 | 3 | 49 | 37 | 14 | 32 | 109 | 39 | 0.06 | 0.06 | 0.23 | 3 | −28.6 | 25.9 | 0.39 | 0.22 | 0.12 |
| 3 | 69 | 67% MS 28% Y 3% AB 3% Z | 71 | 60 | 1839 | 1553 | 30 | 34 | 47 | 39 | 0.002 | 0.004 | 0.24 | 21 | 9.8 | 5.8 | 0.43 | 0.09 | 9e–10 |
| 4 | 23 | 61% X 22% N 9% AB 9% MS | 133 | 324 | 187 | 385 | −274 | 323 | −214 | 333 | 0.09 | 0.12 | 0.09 | 2 | −211 | 79 | 0.3 | 0.2 | 0.16 |
| 5 | 56 | 100% X | 176 | 126 | 75 | 30 | −263 | 100 | −358 | 106 | 0.19 | 0.11 | 0.62 | 87 | 4.6 | 29.8 | 0.75 | 0.08 | 8e–13 |
| 6 | 100 | 98% AB 2% Z | 5 | 3 | 383 | 459 | 33 | 57 | 42 | 40 | 0.004 | 0.004 | 0.67 | 199 | −16.5 | 4.9 | 1.18 | 0.08 | <2e–16 |
| 7 | 21 | 100% AB | 6 | 1.8 | 2950 | 2068 | 23 | 34 | 26 | 35 | 0.003 | 0.003 | 0.28 | 8 | 9.6 | 8 | 0.5 | 0.2 | 0.013 |
| 8 | 26 | 92% MS 8% Z | 56 | 13 | 686 | 213 | 27 | 73 | 22 | 58 | 0.0009 | 0.0004 | 0.32 | 11 | 11.7 | 13 | 0.71 | 0.21 | 3e–3 |
| 10 | 25 | 100% X | 1283 | 763 | 47 | 25 | −374 | 86 | −531 | 89 | 0.24 | 0.14 | 0.09 | 2 | −216 | 104 | 0.3 | 0.19 | 0.14 |
Notes.
Statistical results of the linear regression of their δ29,30Si isotopic ratios.
Clusters in DB4 and DB5 were named similarly based on the co-occurrence of similar grains in each of the two considered clusters. Clusters c9DB4 and c10DB5 are named differently because they do not have corresponding clusters in DB5 and DB4, respectively.
Figure 2.
(a) Nitrogen, carbon (a) and silicon ((b) and (c)) isotopic compositions of clustered presolar SiC grains for DB4 (subset of the PGD Stephan et al. 2020), and (c) is a zoom-in of (b). Ellipses are guidelines showing the different clusters. (d) Boxplot showing the probability that data points belong to their clusters. Open squares and horizontal lines are average and median probabilities, respectively, and black dots are outliers.
Figure 3.
Same as Figure 2. Here cluster analysis is conducted with DB5. (d) and (e) show their inferred initial 26Al/27Al as a function of their 14N/15N and 12C/13C ratios, respectively.
3.2. Mainstream, Y, and Z Grains
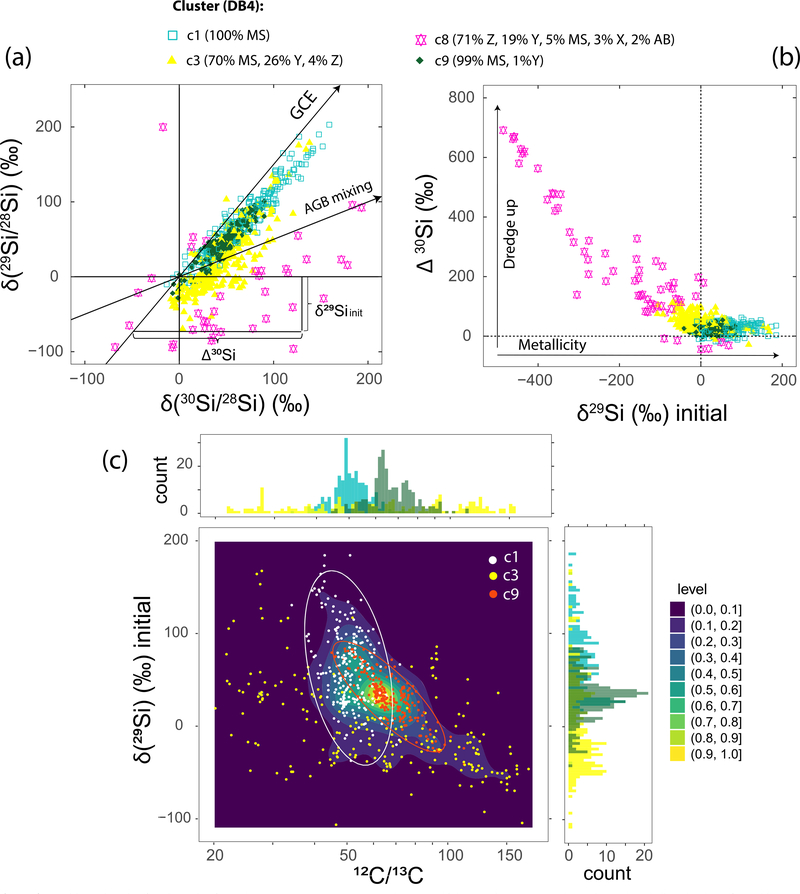
Mainstream SiC grains are generally accepted to originate from relatively low-mass AGB stars with metallicities comparable to or higher than that of the Sun (Zinner 2014; Lugaro et al. 2020). Their Si isotope ratios mainly reflect the initial compositions of their parent stars, set by Galactic Chemical Evolution (GCE), and possibly slightly modified by dredge-up of 30Si-rich material that has experienced neutron capture. GCE theory predicts that 29,30Si/28Si ratios increase linearly with metallicity (Timmes & Clayton 1996; Lewis et al. 2013), though the details are highly uncertain and local heterogeneities may arise due to inhomogeneous supernova enrichment of star-forming regions (Lugaro et al. 1999; Nittler 2005). The C isotopic ratios of AGB stars depend on their initial composition controlled by GCE and stellar nucleosynthesis, including production of 12C by triple alpha reaction during the shell He burning and possible production of 13C by CBP and/or hot-bottom burning (HBB) (e.g., Zinner et al. 2006). CBP is a process where envelope material of M < ~2.5 M⨀ stars is mixed with deep H-burning shell material (Wasserburg et al. 1995), while HBB happens in massive stars (M > ~4 M⨀) for which the bottom of the convective envelope reaches significantly high temperatures to initiate H burning (Nollett et al. 2003). In addition to GCE, the 14N/15N ratio is expected to be also set by dredge-up of material that experienced CNO-cycle H burning, although the observed ranges in MS, Y, and Z grains are higher than predicted by standard AGB stellar models that do not include CBP or HBB (e.g., Palmerini et al. 2011). Let us consider the MS-rich clusters found here in light of these processes. To aid in the discussion, we follow previous authors (e.g., Hoppe et al. 1997; Amari et al. 2001b; Nittler & Alexander 2003; Lewis et al. 2013) and project the Si-isotope data onto an assumed GCE line, to derive the initial composition (δ29,30Siinit) of the parent AGB stars (Figures 4(a)–(c)), and a proxy for the amount of processed material mixed into the envelope during the AGB phase (Δ30Si) (Figures 4(a) and (c)). Here, we considered a GCE line slope of 1.5 intersecting the solar composition, and a mixing line with a slope of 0.5, following Nittler & Alexander (2003). Projections on these lines to calculate the initial δ29Si and the degree of AGB mixing Δ30Si are shown in Figure 4(a). The specific values for these parameters depend on the precise assumptions made for the projection, but this exercise allows us to investigate the trends qualitatively and see how they vary for the different clusters.
Figure 4.
(a) Si isotopic ratios for SiC grains from clusters c1DB4, c3DB4, c8DB4, and c9DB4, which comprise MS, Y, and Z grains and are believed to have formed in AGB stars. Solid arrows show the GCE trend we assumed to represent the initial composition of the parent star, and the AGB mixing line, reflecting changes in grain composition due to dredge-up events (Nittler & Alexander 2003). Here, we considered a GCE line slope of 1.5 and intersecting the solar composition, and a mixing line with a slope of 0.5, following (Nittler & Alexander 2003). The initial δ29Si and the degree of AGB mixing (estimated with Δ30Si) were calculated using these lines and are shown in panels (b) and (c) with C isotopic ratios. In panel (c), we also plotted the density distribution of the data (highest and lowest in yellow and dark blue areas), and histograms for 12C/13C and initial δ29Si for the three selected clusters. White and orange ellipses are guidelines showing clusters c1DB4 and c9DB4, respectively.
For the DB4 results, cluster c8DB4 with 70% Y and 20% Z shows a negative correlation between δ29Siinit and Δ30Si (see Figure 4(b)), in agreement with previous studies (Nittler & Alexander 2003; Zinner et al. 2006), supporting the higher efficiency of third dredge-up and the more efficient operation of the reaction 22Ne(α, n)25Mg in low-metallicity stars because of enhanced maximum stellar temperatures. However, it is note-worthy that this implication is not supported by the Mo isotopic compositions of Z grains (Liu et al. 2019). Our derived divisions rely on a multidimensional approach and suggest that the use of 12C/13C = 100 to separate Y grains from other types of grains is arbitrary. In addition, the Si isotopic ratios of the two pure MS clusters c1DB4 and c9DB4 plot close to the MS line, which translates into a narrow range of Δ30Si values (Figure 4(c)), while cluster c3DB4, comprising a significant number of Y grains, has a larger spread in Δ30Si than the two other clusters. These three clusters show increasing average δ29,30Si values from c3DB4 to c9DB4 to c1DB4 (Table 1), suggesting increasing ranges of metallicity. Figure 4(c) reveals, as previously observed (Hoppe et al. 1996; Huss et al. 1997; Nittler & Alexander 2003), a negative correlation between δ29Siinit and the observed maximum 12C/13C for AGB-derived SiC grains, possibly due to increased dredge-up of Heburning material in lower-metallicity stars, or GCE control of initial compositions. Indeed, GCE models predict increasing 12C/13C with decreasing metallicity, but the predicted trend does not seem to be supported by existing limited astronomical observations (Kobayashi et al. 2020). Figure 4(c) also shows the density distribution for MS grains and highlights the very dense region (in yellow) corresponding to the center of cluster c9DB4 at 12C/13C ≅ 65. The dense center of c9DB4 (narrow ranges of C and Si isotopic compositions) indicates an enhanced production of grains from stars with a narrow range of mass and metallicity. It also shows a second broader high-density region coinciding with the compositional range of c1DB4, and the low-density region of heterogeneous cluster c3DB4. In addition, available Ti isotopic ratios for these three clusters show smaller ranges for cluster c9DB4 compared to c1DB4 and c3DB4 (e.g., δ46Ti/48Ti = 34 ± 32‰ compared to 59 ± 57‰ and 13 ± 55‰, respectively). Altogether, cluster analysis enables defining four clusters of grains formed in AGB stars with gradually increasing average metallicity: c8DB4 (Z- and Y-rich), c3DB4 (Y- and MS-rich), c9DB4 (MS-rich), and c1DB4 (MS-rich).
Two puzzles regarding SiC Si isotopes have long been recognized: (1) the slope of the MS SiC Si isotope line is steeper than predicted by GCE models (~1.4 versus 1) and (2) most grains are 29,30Si-rich, suggesting that their stars are of higher metallicity than the Sun despite forming earlier in Galactic history. A super-solar metallicity origin for large (>1 μm) MS grains has seen recent support from astronomical observations and trace-element isotope data (Lugaro et al. 2020), but the slope discrepancy remains unexplained, though many models have been suggested to explain it (e.g., Nittler & Dauphas 2006). One possible solution, suggested by Clayton (2003), is that a merger of a dwarf galaxy with the Milky Way a few Ga before solar system formation could have triggered a burst of star formation and led to a local evolution of Si isotopes down the MS line as low-metallicity gas from the dwarf mixed with the Milky Way disk. Depending on the timing of the merger, stars formed in the starburst of a given mass will have evolved to the AGB phase and produced SiC grains just in time to contribute to the forming solar system, and an excess of grains from a narrow mass/metallicity range may thus support this model. Heck et al. (2020) recently found that a higher-than-expected fraction of presolar SiC grains have cosmic-ray exposure ages smaller than 300 Ma and argued that this suggests an enhanced star formation around ~7 Ga ago, in agreement with the starburst hypothesis. Alternatively, the Si isotope ratios of MS grains can be simply explained as a result of increasing production of SiC in C-rich AGB stars of higher metallicities, i.e., higher Si abundances in the stellar envelope, as shown by Cristallo et al. (2020). Their calculations, which coupled a chemodynamical GCE model, a dust formation model, and AGB nucleosynthesis models, predict that the solar system incorporated SiC grains from dying AGB stars in the solar neighborhood with a restricted range of masses and metallicities. This prediction provides an alternative explanation for the identified compact core in Figure 4(c).
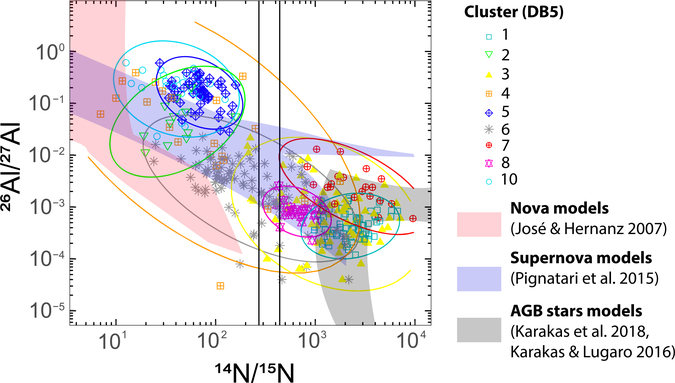
The addition of 26Al/27Al data (DB5) yields a significantly smaller sample of MS grains (142 instead of 625 in DB4) for our cluster analysis and hence different clusters for MS grains. This limited sampling may not provide the most accurate clustering results for MS, Y, and Z grains, as extensive data are needed to resolve overlapping compositions. However, interestingly, the analysis reveals two MS-rich clusters, c1DB5 and c8DB5, with relatively high (low) and low (high) average 14N/15N (26Al/27Al) ratios, respectively (Figure 5). This anticorrelation between 14N/15N and 26Al/27Al ratios in MS grains has not been noted before. AGB models generally predict these ratios should be positively correlated, since H burning at the temperatures experienced by such stars is predicted to produce 14N and 26Al so that one would expect a positive instead of negative correlation. Higher-temperature H burning in novae and/or some supernovae has been invoked to explain coupled 15N and 26Al in N and AB grains (Liu et al. 2017c, 2018b), but such burning is not expected for AGB stars. The observed enrichments in 26Al, 15N, and scattered Si isotopic ratios of cluster c8DB5 may be clues that these grains did not form in AGB stars and/or to future improvements of nucleosynthesis models of AGB stars. However, the two clusters have similar ranges of Si isotopic ratios (see Table 1, Figure 10), suggesting similar GCE effects.
Figure 5.
Al and N isotopic ratios for SiC grains clusters using DB5 compared to compositions of grains from nova and supernova nucleosynthesis models (José & Hernanz 2007; Pignatari et al. 2015; Karakas & Lugaro 2016; Karakas et al. 2018). Details on modeled stars in panel (d) are given in Karakas & Lugaro (2016), Karakas et al. (2018), and Liu et al. (2017a).
3.3. X, N, and AB Grains
We compared N and Al isotopic ratios for our obtained DB5 clusters with recent nova and CCSN stellar nucleosynthesis models in Figure 5 (José & Hernanz 2007; Pignatari et al. 2015). Both N grain-rich cluster c2DB5 and the cluster of 15N-rich AB grains c6DB5 match the CCSN models of Pignatari et al. (2015), in which H is ingested into the He/C zone during the supernova explosion, resulting in the production of large amounts of 13C, 15N, and 26Al. In comparison, the other AB cluster c7DB5 lies closer in composition to AGB models. These results are in line with those of previous studies, suggesting distinct stellar origins for 15N-poor AB grains (Liu et al. 2017c) and 15N-rich grains (Liu et al. 2017a, 2018b). According to astronomical observations, J stars dominantly show 14N/15N ratios close-to or greater-than the solar value, in agreement with the range of N isotope ratios of 15N-poor AB grains (Hedrosa et al. 2013). Hoppe et al. (2019) recently suggested that 15N-poor AB grains could also have originated from CCSNe that experienced explosive H burning but with a different mixing recipe compared with 15N-rich AB grains. However, it remains unclear if different mixing scenarios in similar parent supernovae can result in two distinct groups of AB grains as identified by the clustering analysis here. In addition, Liu et al. (2017a) defined two groups of AB1 (15N-rich) and AB2 (15N-poor) by using the solar 14N/15N ratio as the divider. The N isotopic composition of c7DB5 is consistent with this definition of AB2 grains, whereas c6DB5 covers a wider range of 14N/15N than AB1 grains, up to ~2000, which supports the suggestion of Hoppe et al. (2019) that a fraction of AB2 grains could have originated from CCSNe as AB1 grains. The accurate partitioning using cluster analysis enabled better defining contours for these two types of grains without having to use the solar isotopic composition as an arbitrary separator. It is interesting to note that our redefined cluster c6DB5 yields a better match with the models of Pignatari et al. (2015), specifically for the most 26Al-depleted compositions. However, note that the CCSN mixtures with 14N/15N ratios above the solar value are O-rich (Liu et al. 2017c), and equilibrium condensation calculations do not predict SiC condensation under such conditions. Thus, if these grains are indeed from CCSNe, they may have formed through a non-equilibrium process (e.g., Deneault 2017).
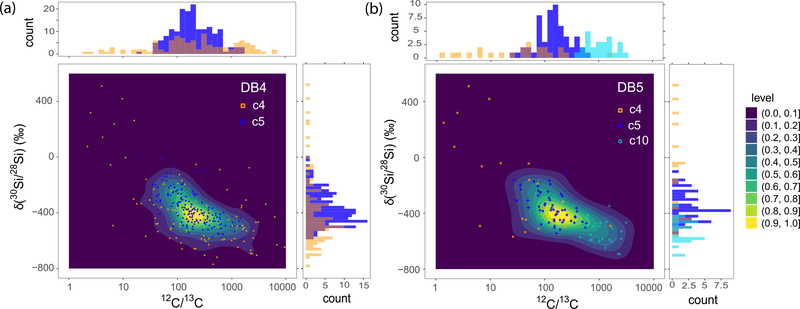
X grains are clustered in two and three clusters using DB4 and DB5, respectively. Clusters c5DB4 or c5DB5 have strongly correlated Si isotopes, similar to grains from previously proposed subtype X1 (Lin et al. 2002). The other X grains, defined as X0 and X2 by Lin et al. (2010), are either all clustered in the heterogeneous c4DB4, or split between a heterogeneous cluster c4DB5 and cluster c10DB5 with a large range of 12C/13C and stronger depletions in 29Si and 30Si abundances, respectively. However, cluster c10DB5 does not have a distinct range in 26Al/27Al and overlaps with c5DB5 (Figure 5). Moreover, the data distribution for all X grains is the same in DB4 and DB5 (Figure 6), and the use of the larger data set (DB4) did not lead to their splitting. For these reasons, the additional cluster c10DB5 may not be significant. Based on previous CCSN models, the tightly correlated Si isotopic ratios of cluster c5 X grains suggest mixing of material from the inner S/Si (Rauscher et al. 2002; Hoppe et al. 2010; or Si/C zone in the models of Pignatari et al. 2013b) and outer He/C zones. The scattered cluster c4 likely indicates additional contributions from other shells such as the O-rich shells having Si isotopic compositions strongly deviating from the trend defined by cluster c5 X grains in the Si 3-isotope plot, as previously suggested by Hoppe et al. (2010).
Figure 6.
δ30Si/28Si and 12C/13C for X grain-bearing clusters from DB4 (panel (a)) and DB5 (panel (b)), and their density distribution (highest density shown in yellow). Histograms for these two variables are also shown. δ30Si/28Si and 12C/13C are correlated as previously noticed by Lin et al. (2010). Since DB4 has more data than DB5 and both data sets show the same distribution, the splitting between c5DB5 and c10DB5 may not be significant.
4. Conclusions
Our analysis shows that with the available data on presolar SiC grains, clustering based on C, N, and Si isotopic compositions (data set named DB4), and additional inferred initial 26Al/27Al isotopic ratios (DB5) enables us to accurately define divisions between different groups of grains. Our conclusions are summarized below.
Four clusters of grains formed in AGB stars with gradually increasing metallicity: c8DB4 (with mainly Z and Y grains), c3DB4 (predominantly Y and MS grains), c9DB4 (almost all MS grains), and c1DB4 (MS grains).
Cluster c9DB4, containing 1/3 of all MS grains, has a very narrow range of 12C/13C and initial δ29,30Si ratios, indicating that these grains came from parent AGB stars with a narrow range of masses and metallicities. This inference is consistent with an enhanced grain production from a starburst event prior to the solar system formation, but is more likely to be a natural consequence of GCE and preferred SiC production in high-metallicity C-rich AGB stars.
Adding inferred initial 26Al/27Al data to the clustering identifies a cluster of MS grains with enrichments in 26Al and 15N, which questions their supposed AGB stellar origins or points to problems in current AGB models. However, since the MS data on their Al isotopic ratios remain limited, we stress that future studies should give special attention to 26Al/27Al when analyzing MS grains.
Two AB-rich clusters have either low 14N/15N and high 26Al/27Al, or high 14N/15N and low 26Al/27Al. Their comparable ranges of Si isotopic compositions suggest that they originated from parent stars with similar metallicities, and thus a GCE-related explanation for their different N and Al isotopic compositions is unlikely. Comparing their compositions with nova and CCSN models points to an origin in CCSNe for 15N- and 26Al-rich AB grains, specifically with mixtures from outer H envelope material and explosive H-burning products in the inner He/C zone.
A cluster mainly made of N grains and two clusters of X grains, one of which exhibits very correlated Si isotopic ratios, suggests mixing of material from the inner S/Si (or Si/C) and outer He/C zones. One of the two X grain clusters shows a heterogeneous Si composition and deviates from the 2/3 line in the Si 3-isotope plot, which indicates mixing with material from the other O-rich zones, as previously suggested.
Our results demonstrate the power of cluster analysis to separate varying stellar formation environments of presolar SiC grains using the complex covariance of their isotopic compositions. It also highlights the need to expand the PGD and clustering to include other attributes, e.g., isotope ratios of additional elements, morphological features, and interstellar ages. These additions would likely provide new insights into stellar nucleosynthesis, GCE, and interstellar processes and improve the classification of presolar grains.
We thank Maria Lugaro and Maximilien Verdier-Paoletti for fruitful discussions. Data-driven studies of mineral evolution and mineral ecology have been supported by the Alfred P. Sloan Foundation, the W. M. Keck Foundation, the John Templeton Foundation (grant #60645), the NASA Astrobiology Institute ENIGMA team (80NSSC18M0093), a private foundation, and the Carnegie Institution for Science. T.S. was supported by NASA through grants 80NSSC17K0250 and 80NSSC17K0251. N.L. acknowledges financial support from NASA 80NSSC20K0387. Any opinions, findings, or recommendations expressed herein are those of the authors and do not necessarily reflect the views of the National Aeronautics and Space Administration.
Appendix A
Additional Details on Methods
Clustering with DB5 was performed with the former database PGD_SiC_2020–01-30 (available before the recently updated one and throughout almost the entire duration of the project), and additional data published in the last four years (Liu et al. 2016, 2017a, 2017b, 2017c, 2018a, 2018b, 2019; Hoppe et al. 2018, 2019; Nguyen et al. 2018). The very recently updated database PGD_SiC_2020–08-18 contains only one additional initial 26Al/27Al ratio, so it is very similar to the one considered here. The supplementary table available on Github11 gives the data sets DB4 and DB5 used in this study and probabilities that each data point belongs to clusters from DB4 and DB5.
Although clustering with three attributes (12C/13C, 29Si/28Si, and 30Si/28Si) would increase the number of grains to 18172, this cluster analysis yields unstable results with clusters varying significantly at each run. The addition of the Ti isotopic ratios produces a data set of 382 grains. Its cluster analysis yields three clusters compared to six grain types (M, AB, X, Y, Z, and N) from the original classification, suggesting the need for more measurements of isotopic ratios of presolar SiC grains, including Ti isotopes. Therefore, in this study, we provide results for the two data sets DB4 and DB5, which yield the most relevant results for addressing formation environments of presolar SiC grains. It should be noted that each data set has different proportions of grain types, which may lead to sample biases. While this problem is beyond the scope of the present study, future work should address the effect of these sampling biases on cluster analysis.
Appendix B
Principal Component Analysis
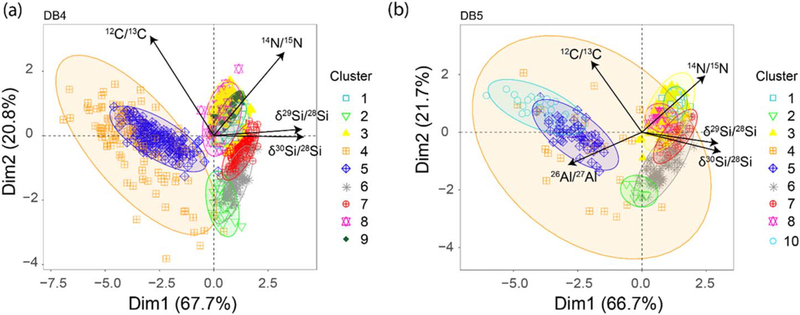
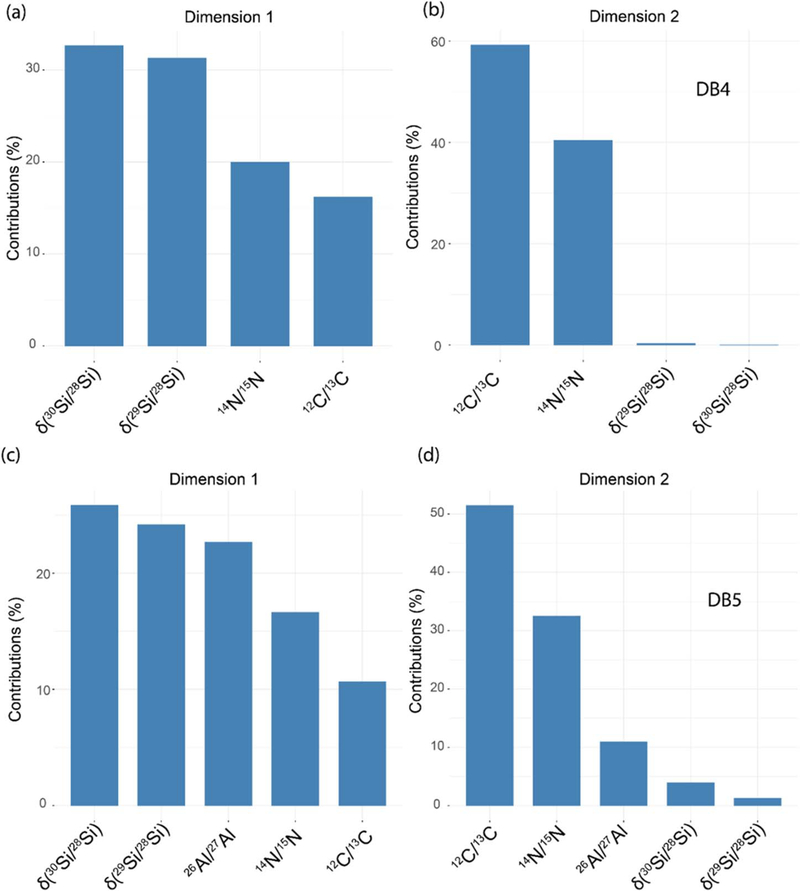
We performed a principal component analysis (PCA), allowing us to better visualize the variance of the data in a dimensionally reduced space. PCA biplots for DB4 and DB5 are shown in Figure 7. Figure 8 shows the contribution of each variable used in cluster analysis in the first and second principal components, for DB4 ((a) and (b)) and DB5 ((c) and (d)).
Figure 7.
Biplot showing the contribution of the four considered features 12C/13C, 14N/15N, 29Si/28Si, and 30Si/28Si in DB4 (panel (a)) and additional 26Al/27Al (panel (b)) in the two first principal components and the distribution of data in the collapsed dimensional space.
Figure 8.
Contribution of isotopic ratios to the first and second principal components (panels (a) and (b), respectively) for DB4, and for DB5 (panels (c) and (d), respectively).
Appendix C
Comparison of Clusters and Grain Types for DB4 and DB5
Figure 9 shows confusion matrices as bar plots, comparing clusters and grain types. Average compositions of clusters from DB4 and DB5 are compared in Figure 10.
Figure 9.
Bar plots comparing clusters and grain types for DB4 (a) and DB5 (b).
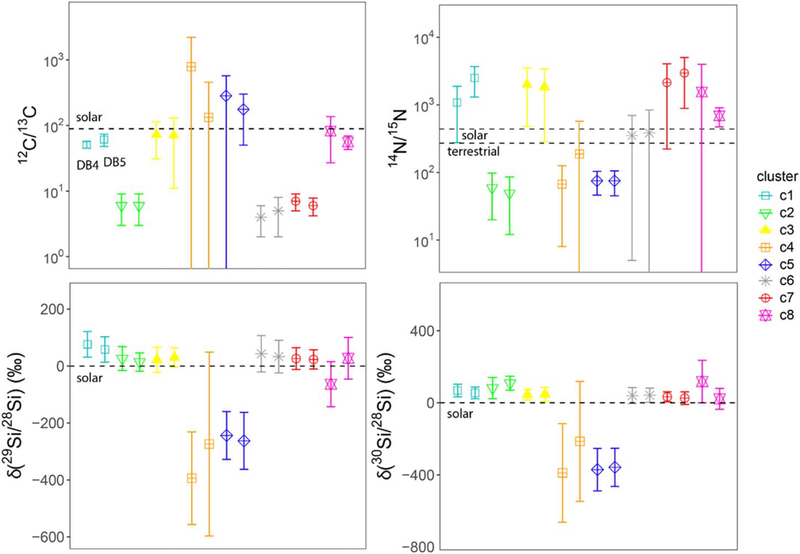
Figure 10.
Comparison between average isotopic compositions of clusters from DB4 (left symbol) and DB5 (right symbol, as shown for cluster c1 in the 12C/13C plot). Error bars are 1σ standard deviations for each cluster.
Footnotes
References
- Alexander CMO’D 1993, GeCoA, 57, 2869 [Google Scholar]
- Amari S, Gao X, Nittler LR, et al. 2001a, ApJ, 551, 1065 [Google Scholar]
- Amari S, Nittler LR, Zinner E, et al. 2001b, ApJ, 546, 248 [Google Scholar]
- Amari S, Nittler LR, Zinner E, et al. 2001c, ApJ, 559, 463 [Google Scholar]
- Bouveyron C, Celeux G, Murphy TB, & Raftery AE 2019, Model-Based Clustering and Classification for Data Science: With Applications in R (Cambridge: Cambridge Univ. Press; ) [Google Scholar]
- Clayton DD 2003, ApJ, 598, 313 [Google Scholar]
- Cristallo S, Nanni A, Cescutti G, et al. 2020, A&A, 644, A8 [Google Scholar]
- Deneault E 2017, AJ, 843, 57 [Google Scholar]
- Heck PR, Greer J, Kööp L, et al. 2020, PNAS, 117, 1884. [DOI] [PMC free article] [PubMed] [Google Scholar]
- Hedrosa RP, Abia C, Busso M, et al. 2013, ApJL, 768, L11 [Google Scholar]
- Hoppe P, Annen P, Strebel R, et al. 1997, ApJL, 487, L101 [Google Scholar]
- Hoppe P, Leitner J, Gröner E, et al. 2010, ApJ, 719, 1370 [Google Scholar]
- Hoppe P, Pignatari M, Kodolányi J, et al. 2018, GeCoA, 221, 182 [Google Scholar]
- Hoppe P, Stancliffe RJ, Pignatari M, & Amari S 2019, ApJ, 887, 8 [Google Scholar]
- Hoppe P, Strebel R, Eberhardt P, Amari S, & Lewis RS 1996, GeCoA, 60, 883. [DOI] [PubMed] [Google Scholar]
- Huss GR, Hutcheon ID, & Wasserburg GJ 1997, GeCoA, 61, 5117 [Google Scholar]
- Hynes KM, & Gyngard F 2009, LPI, 40, 1198 [Google Scholar]
- Jain AK 2010, PaReL, 31, 651 [Google Scholar]
- José J, & Hernanz M 2007, M&PS, 42, 1135 [Google Scholar]
- Junk GA, & Svec HJ 1958, Ames Laboratory ISC Technical Report 208, ISC-1138 [Google Scholar]
- Karakas AI, & Lugaro M 2016, ApJ, 825, 26 [Google Scholar]
- Karakas AI, Lugaro M, Carlos M, et al. 2018, MNRAS, 477, 421 [Google Scholar]
- Kobayashi C, Karakas AI, & Lugaro M 2020, AJ, 900, 179 [Google Scholar]
- Lambert DL, & Mallia EA 1968, ApL, 1, 85 [Google Scholar]
- Lewis KM, Lugaro M, Gibson BK, & Pilkington K 2013, ApJL, 768, L19 [Google Scholar]
- Lin Y, Amari S, & Pravdivtseva O 2002, ApJ, 575, 257 [Google Scholar]
- Lin Y, Gyngard F, & Zinner E 2010, ApJ, 709, 1157 [Google Scholar]
- Liu N, Nittler LR, Alexander CMO’D, et al. 2016, ApJ, 820, 140 [Google Scholar]
- Liu N, Nittler LR, Alexander CMO’D, & Wang J 2018a, SciA, 4, eaao1054. [DOI] [PMC free article] [PubMed] [Google Scholar]
- Liu N, Nittler LR, Pignatari M, et al. 2017a, ApJL, 842, L1 [Google Scholar]
- Liu N, Steele A, Nittler LR, et al. 2017b, M&PS, 52, 2550 [Google Scholar]
- Liu N, Stephan T, Boehnke P, et al. 2017c, ApJL, 844, L12 [Google Scholar]
- Liu N, Stephan T, Boehnke P, et al. 2018b, ApJ, 855, 144 [Google Scholar]
- Liu N, Stephan T, Cristallo S, et al. 2019, ApJ, 881, 1 [Google Scholar]
- Lugaro M, Cseh B, Világos B, et al. 2020, ApJ, 898, 96 [Google Scholar]
- Lugaro M, Zinner E, Gallino R, & Amari S 1999, ApJ, 527, 369 [Google Scholar]
- Marty B, Chaussidon M, Wiens RC, et al. 2011, Sci, 332, 1533. [DOI] [PubMed] [Google Scholar]
- Nguyen AN, Nittler LR, Alexander CMO’D, & Hoppe P 2018, GeCoA, 221, 162 [Google Scholar]
- Nittler LR 2005, ApJ, 618, 281 [Google Scholar]
- Nittler LR, & Alexander CMO’D 2003, GeCoA, 67, 4691 [Google Scholar]
- Nittler LR, Amari S, Zinner E, et al. 1996, ApJL, 462, L31 [Google Scholar]
- Nittler LR, & Ciesla F 2016, ARA&A, 54, 53 [Google Scholar]
- Nittler LR, & Dauphas N 2006, in Meteorites and the Early Solar System II, ed. Lauretta DS & McSween HY Jr. (Tucson, AZ: Univ. Arizona Press; ), 127 [Google Scholar]
- Nollett KM, Busso M, & Wasserburg GJ 2003, AJ, 582, 1036 [Google Scholar]
- Palmerini S, La Cognata M, Cristallo S, & Busso M 2011, ApJ, 729, 1 [Google Scholar]
- Pignatari M, Wiescher M, Timmes FX, et al. 2013a, ApJL, 767, L22 [Google Scholar]
- Pignatari M, Zinner E, Bertolli MG, et al. 2013b, ApJL, 771, L7 [Google Scholar]
- Pignatari M, Zinner E, Hoppe P, et al. 2015, ApJL, 808, L43 [Google Scholar]
- Rauscher T, Heger A, Hoffman RD, & Woosley SE 2002, ApJ, 576, 323 [Google Scholar]
- Scrucca L, Fop M, Murphy TB, & Raphtery AE 2016, The R Journal, 8, 287. [PMC free article] [PubMed] [Google Scholar]
- Stephan T, Bose M, Boujibar A, et al. 2020, LPI, 51, 2140 [Google Scholar]
- Timmes FX, & Clayton DD 1996, ApJ, 472, 723 [Google Scholar]
- Wasserburg GJ, Boothroyd AI, & Sackmann I-J 1995, AJ, 447, L37 [Google Scholar]
- Xu Y, Zinner E, Gallino R, et al. 2015, ApJ, 799, 156 [Google Scholar]
- Zinner E 2014, in Treatise on Geochemistry, ed. Davis AM, Holland HD, & Turekian KK (2nd ed.; Oxford: Elsevier; ), 181 [Google Scholar]
- Zinner E, Nittler LR, Gallino R, et al. 2006, ApJ, 630, 350 [Google Scholar]


