Abstract
Purpose
To compare invasive right heart catheterization with four-dimensional (4D) flow MRI for estimating shunt fraction in patients with intracardiac and extracardiac shunts.
Materials and Methods
In this retrospective study, patients who underwent 4D flow MRI and invasive right heart catheterization with a shunt run between August 2015 and November 2018 were included. The primary objective was comparison of estimated shunt fraction (ratio of pulmonary-to-systemic flow, Qp/Qs) at 4D flow and catheterization. Secondary objectives included comparison of the right ventricular–to–left ventricular stroke volume ratio (RVSV/LVSV) to shunt fraction (for those with applicable shunts) and comparison of cardiac output between 4D flow and catheterization. Statistical analysis included Pearson correlation and Bland-Altman plots.
Results
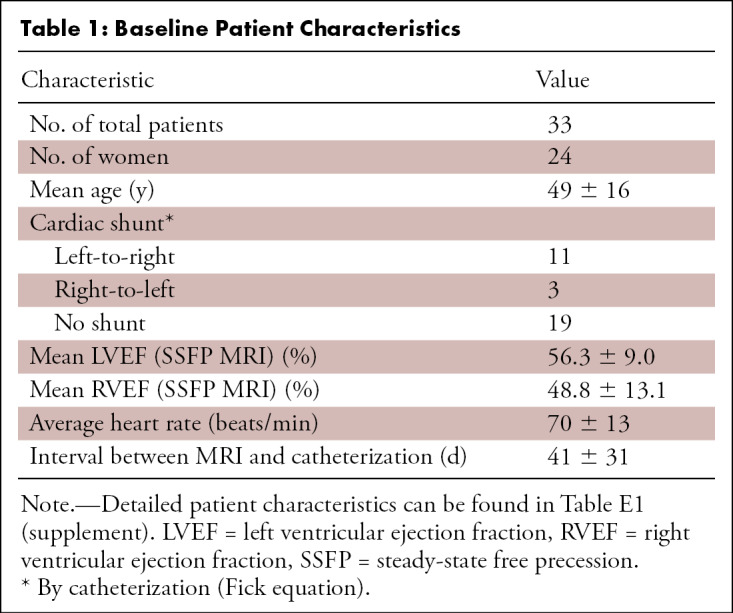
A total of 33 patients met inclusion criteria (mean age, 49 years ± 16 [standard deviation]; 24 women). 4D flow measurements of Qp/Qs strongly correlated with those at catheterization (r = 0.938), and there was no bias. RVSV/LVSV correlated strongly with Qp/Qs from 4D flow (r = 0.852) and catheterization (r = 0.842). Measurements of left ventricle (Qs) and right ventricle (QP) cardiac output from 4D flow and catheterization (Fick) correlated moderately overall (r = 0.673 [Qp] and r = 0.750 [Qs]).
Conclusion
Shunt fraction measurement using 4D flow MRI compares well with that using invasive cardiac catheterization.
Supplemental material is available for this article.
© RSNA, 2021
Summary
Four-dimensional flow–derived and catheterization-derived measurements of pulmonary-to-systemic flow ratio demonstrated excellent agreement and strong correlation; both measurements demonstrated strong correlation with stroke volume ratio and moderate-to-strong correlation with ventricular stroke volumes.
Key Points
■ Shunt quantification is crucial for appropriate management of patients with intracardiac and extracardiac shunts.
■ Invasive catheterization with oximetry has long been the reference standard for quantification in most patients.
■ Quantitative 4D flow MRI may be an acceptable noninvasive alternative to invasive catheterization for shunt fraction quantification.
Introduction
For patients with intracardiac and extracardiac shunts, determination of shunt severity is essential for appropriate management and consideration of surgical or interventional procedures (1,2). Shunt quantification involves assessment of systemic flow (Qs) and pulmonary flow (Qp) and may be performed using invasive or noninvasive methods. Noninvasive modalities for flow evaluation include transthoracic and transesophageal Doppler echocardiography and cardiac MRI with phase-contrast cine imaging.
Right heart catheterization with oximetry is an invasive technique to estimate systemic and pulmonary blood flow (3) and has long been the reference standard, permitting estimation of shunt fraction by the Fick equation (4). Although typically a safe procedure, complications including arrhythmias, vessel perforation, and infection do occur, and the test is often associated with increased patient discomfort and costs compared with noninvasive testing (5–7).
Two-dimensional (2D) Doppler echocardiography is widely available, noninvasive, and commonly used for survey of cardiac morphology and blood flow in patients with congenital heart disease (8,9). However, Doppler shunt quantification requires good acoustic windows and highly skilled operators, the lack of which may impact reliability and reproducibility (8,10).
Cardiac MRI with 2D planar phase-contrast cine imaging has proven to be a more reliable noninvasive method of shunt quantification, demonstrating fair correlation to invasive assessment in certain pediatric and adult populations (11–13). However, 2D planar phase-contrast cine imaging involves complex plane prescription in each vessel of interest, which requires a highly skilled technologist and/or physician to be physically present at the scanner and may be further complicated by complex three-dimensional flow patterns in patients with congenital heart disease.
Recently, four-dimensional (4D) flow MRI has emerged as an accurate and reproducible means of shunt quantification. This free-breathing, time-resolved volumetric MR angiography technique can be acquired in 8–10 minutes of scan time for retrospective quantification of blood flow in any vessel and/or plane within the imaged volume (14). Previous work showed that 4D flow compares favorably to 2D planar phase-contrast cine imaging, providing comparable quantification of blood flow without incremental cost of additional scan time for each vessel of interest (14–20). Unlike 2D planar phase-contrast cine imaging, regions of aliasing can be avoided during flow quantification, enabling quantification even when velocity aliasing is present. Further, 4D flow has demonstrated good intra- and interobserver consistency (15,17–19) and reliably preserves conservation of mass (15). However, there are scant data directly comparing 4D flow with catheterization. We therefore retrospectively assessed measurements of shunt fraction and cardiac output among patients who underwent both examinations in the course of routine clinical care.
Materials and Methods
Study Design
This retrospective study was Health Insurance Portability and Accountability Act compliant and was approved by the local institutional review board with waiver of informed consent because the study met all specific criteria according to 45 CFR 46.116 (d). We first identified all adult patients who underwent 4D flow cardiac MRI at 3 T between August 2015 and November 2018 and who also underwent invasive right heart catheterization with a shunt run within 3 months of the MRI for inclusion in the study (n = 42). Patients who underwent interval surgery or had a major change in clinical status (eg, hospitalization, decrease in right or left ventricular ejection fraction of greater than 10%) between MRI and catheterization were excluded (n = 3). Six patients were excluded because of poor quality of right heart catheterization. A total of 33 patients were included.
The primary objective was comparison of estimated shunt fraction (Qp/Qs) between 4D flow and right heart catheterization. Secondary objectives included: (a) comparison of right ventricular–to–left ventricular stroke volume ratio (RVSV/LVSV) obtained by manual segmentation of steady-state free precession (SSFP) data with 4D flow and right heart catheterization–derived Qp/Qs and (b) comparison of measurements of cardiac output between 4D flow and catheterization by the Fick equation.
Cardiac MRI
All patients were imaged with the same scanner with a 3-T superconducting magnet (Discovery MR750 using a 32-channel phased-array coil, software version DV26; GE Medical Systems, Boston, Mass). Postcontrast 4D flow MR angiography was performed in all patients, and all but two also underwent electrocardiographically gated balanced SSFP gradient-echo (also called FIESTA) imaging. The gadolinium-based contrast agent gadobenate dimeglumine was administered intravenously at 0.3 mL/kg (0.15 mmol/kg) (Multihance; Bracco Diagnostics, Monroe Township, NJ). Analysis of 4D flow and measurements of ventricular volumes were performed at the time of clinical examination according to our standard practice. Additionally, for the purposes of independent observation, 4D flow data were reanalyzed by a cardiothoracic radiologist (A.H.) with more than 10 years of experience in cardiac MRI with 4D flow.
4D Flow MRI
4D flow was performed as a postcontrast free-breathing sequence during the approximately 8–10 minutes following first-pass perfusion or MR angiography with a parallel imaging and compressed-sensing variant which uses variable-density off-Cartesian sampling; in 29 patients, respiratory self-gating was used, while in four others, a version without self-gating was used (16). The mean scan parameters were the following: acquired in-plane spatial resolution of 1.96 × 2.35 mm (range, 1.33–2.25 mm × 1.77–3.2 mm), flip angle of 20.7° (range, 15°–25°), repetition time of 4.76 msec (range, 4.04–5.52 msec), echo time of 2.42 msec (range, 1.77–2.66 msec), scan time of 11 minutes 11 seconds (range, 8 minutes 2 seconds to 14 minutes 38 seconds). Velocity encoding speed was varied by clinical indication, with lower velocity encoding (150 cm/sec) in patients with known or suspected venous shunts (eg, atrial septal defect or partial anomalous pulmonary venous return), high velocity encoding (350 cm/sec) for patients with known or suspected arterial stenosis or other high-velocity flow scenarios (eg, tetralogy of Fallot or hypertrophic cardiomyopathy), and intermediate velocity encoding (250 cm/sec) for all other patients. Data postprocessing and quantitative measurements were performed using the CardioAI v2.4 suite (Arterys, San Francisco, Calif). Background phase-error correction was employed, but no other additional phase-unwrapping or other postprocessing techniques were used. Cardiac imagers with 2 (M.J.H.), 3, and 10 (A.H., S.J.K.) years of experience in 4D flow prescribed orthogonal planes for aortic (Qs) and pulmonary (Qp) flow in the proximal ascending aorta and main pulmonary artery approximately 2–3 cm distal to the aortic and pulmonary valves, respectively. In one patient with a Fontan circuit, the sum of quantitative flow measurements in the inferior vena cava (Fontan) and superior vena cava (Glenn) conduits served as a surrogate measurement of Qp.
SSFP Segmentation and Volumetry
Data postprocessing, manual endocardial contour segmentation, and quantitative measurements of stroke volume were performed using the cvi42 v5 suite (Circle Cardiovascular Imaging, Calgary, Alberta, Canada). Volumetry was performed as part of routine clinical care by cardiac imaging fellows (M.J.H., D.F.K.) with direct supervision and oversight by two cardiothoracic radiologists with more than 10 years’ experience in congenital heart disease (A.H., S.J.K.). End-systolic and end-diastolic right ventricle and left ventricle endocardial boundaries were contoured at end diastole and end systole on cine SSFP short-axis images with a four-chamber view as a cross-reference.
Right Heart Catheterization for Invasive Oximetry
Right heart catheterization was performed through the internal jugular or femoral vein approach. Blood sample and oxygen saturations were obtained in the inferior vena cava, superior vena cava, right atrium, right ventricle, pulmonary artery, and aorta. Calculation of shunt fraction by using invasive oximetry was performed using the modified Fick equation with individual aortic and pulmonary outputs calculated (22). Aortic flow (Qs) was calculated as follows:
 |
where Vo2 is oxygen consumption, Sao2 and Svo2 are arterial and mixed venous oxygen saturation, respectively.
Pulmonary flow (Qp) was calculated as:
 |
where Vo2 is oxygen consumption, SPVo2 and SPAo2 are pulmonary venous and pulmonary arterial oxygen saturation, respectively.
Mixed venous oxygen saturation was calculated as:
 |
where SSVCo2 and SIVCo2 represent oxygen saturation in the superior and inferior vena cava, respectively.
The ratio of pulmonary-to-systemic flow was subsequently calculated to determine shunt fraction.
Statistical Analysis
Agreement between measurements of shunt fraction calculated using 4D flow versus catheterization data was assessed by linear regression with Pearson correlation as well as Bland-Altman plots using the Prism GraphPad software package (GraphPad, San Diego, Calif). Similar comparisons were made between RVSV/LVSV and Qp/Qs ratios calculated from data obtained by 4D flow and catheterization, as well as between 4D flow–and catheterization-derived measurements of aortic and pulmonary flow, using the same statistical tests.
Results
Patient Characteristics
Forty-two patients were identified who underwent cardiac MRI and catheterization within a 3-month window during the study period; three were excluded due to interval surgery or hospitalization with greater than 10% decrease in left or right ventricular ejection fraction. Six were excluded from analysis due to poor quality of right heart catheterization data. The mean age of the remaining 33 patients was 49 years ± 16 [standard deviation], and 24 patients (73%) were women. Eleven of 33 (33%) patients had a left-to-right shunt (Qp/Qs ≥ 1.3), three (9%) had a right-to-left shunt (Qp/Qs < 0.8), and 19 (58%) had no clinically significant shunt (0.8 ≤ Qp/Qs < 1.3) at catheterization by the Fick equation. Sixteen patients had valvular regurgitation greater than 10% by 4D flow (five with tricuspid regurgitation, one each with isolated mitral, aortic, and pulmonary regurgitation and eight with multivalve regurgitation). Additional patient characteristics and a complete list of diagnoses are included in Tables 1 and E1 (supplement).
Table 1:
Baseline Patient Characteristics
The mean time between invasive catheterization and MRI was 41 days ± 31. Twelve patients underwent catheterization prior to MRI, and all of these were solely diagnostic catheterizations without any intervention performed. The most common congenital abnormality was an atrial septal defect and/or patent foramen ovale occurring in 13 patients (39%) (Fig 1; Movies 1 and 2 [supplement]), seven of whom demonstrated left-to-right shunt at catheterization. The remaining six patients with atrial septal defect had no shunt. Six patients (18%) had partial anomalous pulmonary venous return—one with concomitant atrial septal defect—including one surgically repaired (Fig 1). The patient with surgical repairs had no residual shunt, but the other five all demonstrated left-to-right shunt. One patient (3%) had a ventricular septal defect and two (6%) had tetralogy of Fallot. One patient had tricuspid atresia palliated to a Fontan circuit, and the remaining 11 (33%) either had no cardiac abnormalities or abnormalities not associated with shunting (including new-onset heart failure, tricuspid regurgitation, pulmonary atresia, pulmonary hypertension, hypertrophic cardiomyopathy, Williams syndrome, repaired coronary fistula, and partial cor triatriatum; Table E1 [supplement]).
Figure 1:
Cardiac-gated MR angiography and four-dimensional (4D) flow images from patient 2 with partial anomalous pulmonary venous return (PAPVR) of the right upper lobe. Right ventricular outflow tract views from, A, MR angiography and, B, 4D flow show the connection between the right upper lobe pulmonary vein and superior vena cava. In C, four-chamber view shows an enlarged right atrium (RA) and left-to-right flow through a large secundum atrial septal defect. In D, red and black circles highlight the location of blood flow measurements in the ascending aorta and main pulmonary artery, respectively. LV = left ventricle, RV = right ventricle.
Movie 1:
Full cardiac cycle 4D flow cine images from a patient with a secundum atrial septal defect (ASD). Right ventricular outflow tract view demonstrates left-to-right flow through the ASD, which is imaged en face in this projection.
Movie 2:
Full cardiac cycle 4D flow cine images from a patient with a secundum atrial septal defect (ASD). Four-chamber view demonstrates left-to-right flow through the ASD.
Comparison of Shunt Fraction Derived from MRI and Catheterization Data
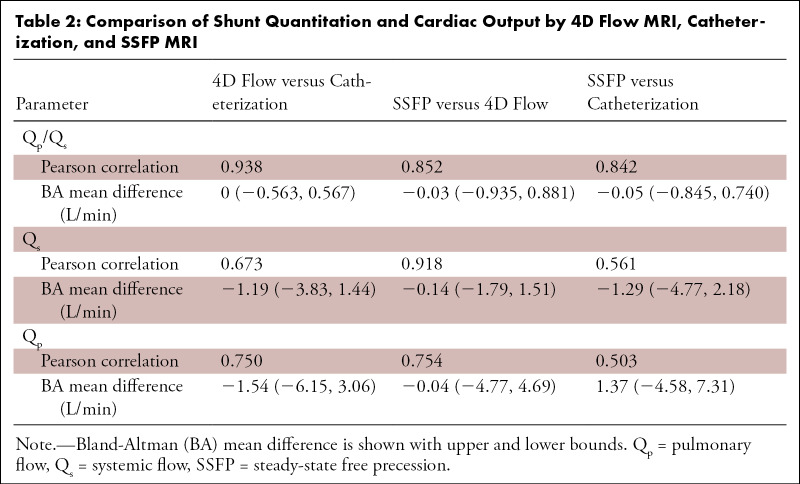
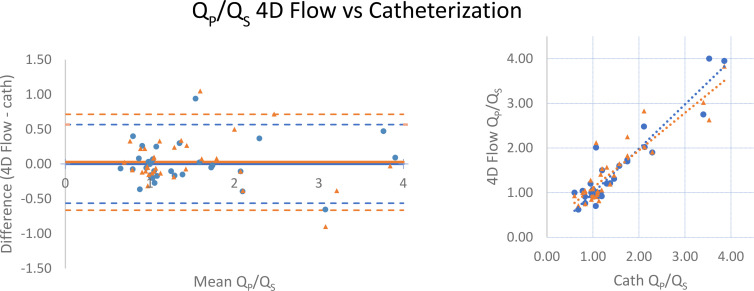
4D flow–derived Qp/Qs very strongly correlated with catheterization (r = 0.938). Bland-Altman analysis showed excellent agreement between Qp/Qs ratios obtained by 4D flow and catheterization, with no bias between the two methods (mean difference, 0 [limits of agreement: −0.563, 0.567]; Table 2 and Fig 2). 4D flow measurements performed at the time of clinical evaluation correlated very strongly with those subsequently performed by an independent observer (r = 0.933 for Qp/Qs, 0.911 for Qs, and 0.975 for Qp).
Table 2:
Comparison of Shunt Quantitation and Cardiac Output by 4D Flow MRI, Catheterization, and SSFP MRI
Figure 2:
Comparison of Qp/Qs between four-dimensional (4D) flow MRI and cardiac catheterization. (Left) Bland-Altman analysis and (right) scatterplots demonstrate minimal bias and strong correlation. Data obtained during initial (routine) clinical care are indicated by blue circles, while orange triangles represent recalculation of 4D flow measurements by an independent observer. Mean difference values are zero (initial data) and 0.04 (recalculated), while Pearson r = 0.938 and 0.905 for initial and recalculated data, respectively. Qp/Qs = ratio of pulmonary-to-systemic flow.
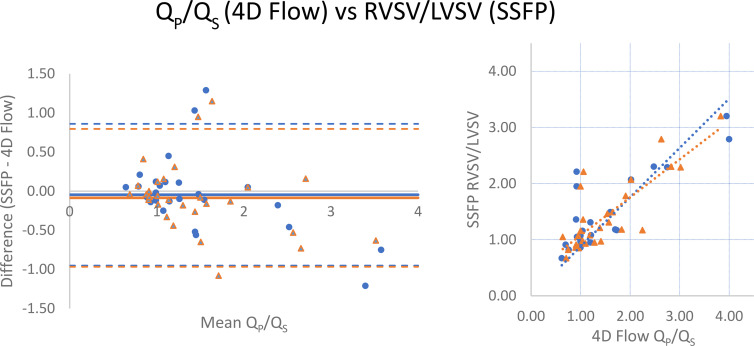
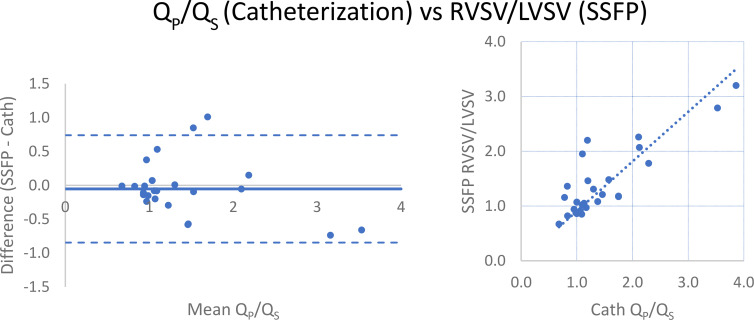
RVSV/LVSV, as calculated by manual segmentation of endocardial contours in end diastole and end systole at SSFP imaging, correlated strongly with 4D flow (r = 0.852) and catheterization-derived Qp/Qs (r = 0.842; Table 2 and Figs 3, 4). When excluding two patients, one with severe tricuspid regurgitation (regurgitant volume of 180 mL; regurgitant fraction of 73%) and the other with severe pulmonic regurgitation (regurgitant fraction of 44%), correlation to RVSV/LVSV improved to 0.913 for 4D flow and 0.887 for catheterization. There was minimal bias between the techniques, with SSFP measurements tending to slightly underestimate the ratio compared with 4D flow (mean difference, −0.03 [limits of agreement: −0.935, 0.881]; Fig 3) and catheterization-derived Qp/Qs (mean difference, −0.05 [limits of agreement: −0.845, 0.740]; Fig 4). LVSV correlated strongly with 4D flow–derived aortic flow (r = 0.918) but weakly-to-moderately with catheterization-derived left ventricular cardiac output by the Fick equation (r = 0.561). RVSV correlated moderately with 4D flow–derived pulmonary flow (r = 0.754) and weakly-to-moderately with Fick-derived right ventricular cardiac output (r = 0.503; Table 2); when excluding the two patients with severe tricuspid or pulmonary regurgitation, correlation improved to 0.885 (4D flow) and 0.602 (catheterization). Comparison of 4D flow and catheterization data to SSFP volumetry was not possible in three of the 33 patients (two patients did not undergo SSFP imaging and images were inadequate for accurate segmentation due to arrhythmia in the third).
Figure 3:
Comparison of Qp/Qs by four-dimensional (4D) flow MRI and right ventricular–to–left ventricular stroke volume (RVSV/LVSV) ratio from manual cardiac segmentation of steady-state free precession (SSFP) images. (Left) Bland-Altman analysis and (right) scatterplot demonstrate minimal bias and strong correlation. Data obtained during initial (routine) clinical care are indicated by blue circles, while orange triangles represent recalculation of 4D flow measurements by an independent observer. Mean difference values are −0.05 (initial) and −0.08 L/min (recalculated), while Pearson r = 0.852 and 0.815 for initial and recalculated data, respectively. Qp/Qs = ratio of pulmonary-to-systemic flow.
Figure 4:
Comparison of Qp/Qs by catheterization and right ventricular–to–left ventricular stroke volume (RVSV/LVSV) ratio from manual segmentation of steady-state free precession (SSFP) images. (Left) Bland-Altman analysis and (right) scatterplot demonstrate minimal bias (mean difference = −0.05) and strong correlation (r = 0.842). Qp/Qs = ratio of pulmonary-to-systemic flow.
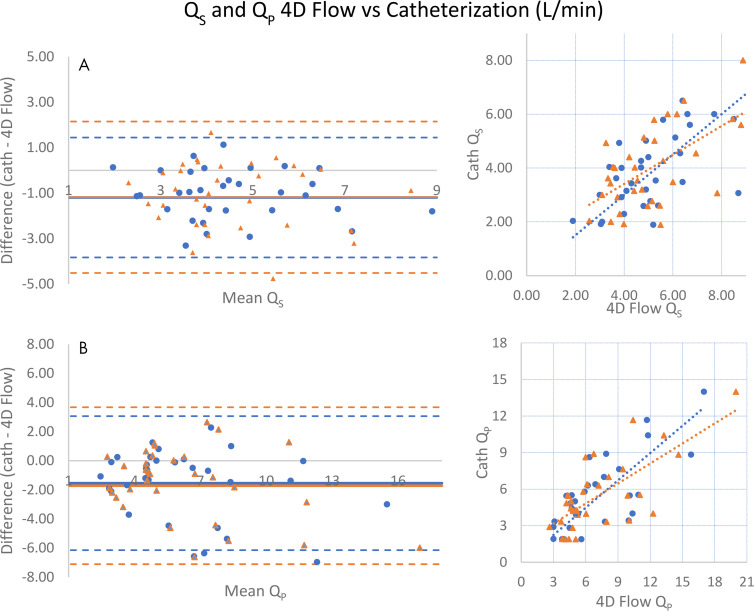
Measurements of left ventricular (Qs) and right ventricular (Qp) cardiac output between 4D flow and catheterization were moderately correlated (r = 0.673 and r = 0.750; Table 2). However, 4D flow tended to overestimate aortic and pulmonary flow compared with Fick equation calculations, and Bland-Altman limits of agreement were more broad (aortic flow mean difference, 1.19 L/min [limits of agreement: −3.83, 1.44] and pulmonary flow mean difference, 1.54 L/min [limits of agreement: −6.15, 3.06]; Table 2 and Fig 5).
Figure 5:
Comparison of systemic (Qs) and pulmonary (Qp) cardiac output measurements by four-dimensional (4D) flow MRI and catheterization. (Left) Bland-Altman analyses and (right) scatterplots show that measurements of, A, systemic and, B, pulmonary cardiac output by 4D flow tend to be higher than catheterization. Data obtained during initial (routine) clinical care are indicated by blue circles, while orange triangles represent recalculation of 4D flow measurements by an independent observer. For Qs, mean difference = −1.19 (initial) and −1.18 L/min (recalculated), respectively, while Pearson r = 0.673, 0.593 (initial, recalculated). For Qp, mean difference = −1.54, −1.72 and Pearson r = 0.750, 0.719 (initial, recalculated).
Discussion
Accurate quantification of shunt severity is crucial to appropriate triage and management of patients with intracardiac and extracardiac shunts (23–28). Although invasive catheterization remains prevalent, this study provided support to the use of 4D flow for noninvasive assessment of shunt lesions and suggested that in some patients, invasive catheterization may not be necessary unless further anatomic or physiologic delineation is required. Both methods agreed and correlated well with stroke volume ratio calculated from anatomic cine SSFP imaging, which may provide further support for 4D flow measurements at the time of MRI. Further, agreement of Qp/Qs ratio appeared more consistent between 4D flow and oximetry than what previous works have reported between 2D phase contrast and oximetry. In combination with conventional MRI, 4D flow can serve as an alternative to invasive testing in some patients, avoiding the costs, patient discomfort, and rare complications associated with catheterization.
In addition, individual 4D flow measurements of aortic and pulmonary flow correlated moderately well with individual left and right ventricular stroke volumes calculated from SSFP images. In contrast, catheterization-derived left and right ventricular cardiac output demonstrated weaker correlation with SSFP-derived stroke volumes. Such a difference is expected in the setting of concomitant valvular regurgitation. Indeed, 16 of 33 patients demonstrated at least one valve with greater than 10% regurgitant fraction at 4D flow; when excluding a single patient with severe tricuspid regurgitation (regurgitant volume of 180 mL and regurgitant fraction of 73%) and an additional patient with severe pulmonic regurgitation (regurgitant fraction of 44%), correlation with SSFP ventricular stroke volume ratio notably improved. Moreover, in these and other patients, some of the discrepancy may be due to physiologic variations in cardiac output that occur between time of catheterization and MRI that do not affect shunt fraction as greatly such as changes in preload, afterload, contractility, heart rate, body temperature, and environmental conditions (28). Further, use of the Fick equation introduces known errors into cardiac output calculations (eg, by using assumptions regarding oxygen extraction [29–32]). It has also been previously shown that Fick-derived Qp and Qs can be inaccurate in the setting of cavopulmonary connections (ie, Glenn or Fontan circuit [33]). As such, a clinically significant amount of shunting may cause over- or underestimation of cardiac output by catheter-derived methods; previous studies have established that error may approach 10% (28) and in such settings, quantitative blood flow measurement by using MRI-based techniques including 4D flow may be less prone to inaccuracies.
There were some limitations of our study that should be considered. The study was performed at a single center using a single MRI scanner, and variability may well exist across vendors, scanners, and 4D flow pulse sequences. 4D flow is a newer technique that requires a certain level of expertise to properly perform, as well as an awareness of limitations and pitfalls of imaging (eg, inaccuracies in the setting of vortical flow and recognition of various artifacts including from turbulence or dephasing and aliasing [34]). There may be a learning curve as 4D flow is incorporated into clinical workflow, although previous studies have shown good intra- and interobserver agreement in quantitative measurements. It is also worth noting that the cardiac volumetry measurements incorporated into this study were measurements performed during the course of clinical care, not measurements obtained for research purposes nor evaluated by a dedicated core laboratory, which may increase variability of measurements. However, 4D flow measurements recalculated by an independent observer correlated very strongly with those obtained at the time of initial clinical evaluation. Our work emphasizes that in the clinical environment, measurements of Qp/Qs from 4D flow are more reliable than those one might obtain from ventricular volumetry. Finally, this was a retrospectively performed study with a time delay between imaging and invasive catheterization in most cases. Patients who underwent surgery or major interval change in clinical status between imaging and catheterization were excluded, but changes in medications or other environmental factors may impact cardiac output and may have affected the correlation between catheterization and 4D flow measurements. Despite these many potential caveats, the consistency between invasive catheterization and 4D flow measurements is remarkable, highlighting the robustness of the 4D flow MRI technique, and its feasibility for routine clinical practice.
4D flow MRI can provide noninvasive measurements of cardiac output and shunt fraction that parallel invasive measurements by cardiac catheterization with oximetry. This study provides further support for 4D flow as a noninvasive alternative to guide clinical management of patients with congenital shunts. In our practice, on the rare occasion that there is discordance of catheterization and 4D flow MRI, we generally favor management of patients based on the Qp/Qs measurements from 4D flow.
SUPPLEMENTAL TABLES
M.J.H. and D.F.K. contributed equally to this work.
A.H. supported by an American Roentgen Ray Society (ARRS) Research Scholar Award. A.H. receives research grant support from GE Healthcare and Bayer.
Disclosures of Conflicts of Interest: M.J.H. disclosed no relevant relationships. D.F.K. disclosed no relevant relationships. H.G.E. disclosed no relevant relationships. L.A. disclosed no relevant relationships. S.J.K. Activities related to the present article: disclosed no relevant relationships. Activities not related to the present article: author is deputy editor of Radiology: Cardiothoracic Imaging. Other relationships: disclosed no relevant relationships. A.H. Activities related to the present article: disclosed no relevant relationships. Activities not related to the present article: author is founder, shareholder, and consultant for Arterys; consultant for GE Healthcare; received travel accommodations from GE Healthcare and Arterys; institution received grant from GE Healthcare. Other relationships: institution (Stanford University) has issued and licensed patents; author/institution receives royalties from patents.
Abbreviations:
- 4D
- four-dimensional
- PAPVR
- partial anomalous pulmonary venous return
- Qp
- pulmonary flow
- Qp/Qs
- ratio of pulmonary-to-systemic flow
- Qs
- systemic flow
- RVSV/LVSV
- right ventricular–to–left ventricular stroke volume ratio
- SSFP
- steady-state free precession
- 2D
- two-dimensional
References
- 1.Webb G, Gatzoulis MA. Atrial septal defects in the adult: recent progress and overview. Circulation 2006;114(15):1645–1653. [DOI] [PubMed] [Google Scholar]
- 2.Minette MS, Sahn DJ. Ventricular septal defects. Circulation 2006;114(20):2190–2197. [DOI] [PubMed] [Google Scholar]
- 3.Warnes CA, Williams RG, Bashore TM, et al. ACC/AHA 2008 Guidelines for the Management of Adults with Congenital Heart Disease: a report of the American College of Cardiology/American Heart Association Task Force on Practice Guidelines (writing committee to develop guidelines on the management of adults with congenital heart disease). Circulation 2008;118(23):e714–e833. [DOI] [PubMed] [Google Scholar]
- 4.Antman EM, Marsh JD, Green LH, Grossman W. Blood oxygen measurements in the assessment of intracardiac left to right shunts: a critical appraisal of methodology. Am J Cardiol 1980;46(2):265–271. [DOI] [PubMed] [Google Scholar]
- 5.Sprung CL, Pozen RG, Rozanski JJ, Pinero JR, Eisler BR, Castellanos A. Advanced ventricular arrhythmias during bedside pulmonary artery catheterization. Am J Med 1982;72(2):203–208. [DOI] [PubMed] [Google Scholar]
- 6.Kearney TJ, Shabot MM. Pulmonary artery rupture associated with the Swan-Ganz catheter. Chest 1995;108(5):1349–1352. [DOI] [PubMed] [Google Scholar]
- 7.Mermel LA, Maki DG. Infectious complications of Swan-Ganz pulmonary artery catheters. Pathogenesis, epidemiology, prevention, and management. Am J Respir Crit Care Med 1994;149(4 Pt 1):1020–1036. [DOI] [PubMed] [Google Scholar]
- 8.Dittmann H, Jacksch R, Voelker W, Karsch KR, Seipel L. Accuracy of Doppler echocardiography in quantification of left to right shunts in adult patients with atrial septal defect. J Am Coll Cardiol 1988;11(2):338–342. [DOI] [PubMed] [Google Scholar]
- 9.Gabbour M, Schnell S, Jarvis K, Robinson JD, Markl M, Rigsby CK. 4-D flow magnetic resonance imaging: blood flow quantification compared to 2-D phase-contrast magnetic resonance imaging and Doppler echocardiography. Pediatr Radiol 2015;45(6):804–813. [DOI] [PMC free article] [PubMed] [Google Scholar]
- 10.Boehrer JD, Lange RA, Willard JE, Grayburn PA, Hillis LD. Advantages and limitations of methods to detect, localize, and quantitate intracardiac left-to-right shunting. Am Heart J 1992;124(2):448–455. [DOI] [PubMed] [Google Scholar]
- 11.Debl K, Djavidani B, Buchner S, et al. Quantification of left-to-right shunting in adult congenital heart disease: phase-contrast cine MRI compared with invasive oximetry. Br J Radiol 2009;82(977):386–391. [DOI] [PubMed] [Google Scholar]
- 12.Hundley WG, Li HF, Lange RA, et al. Assessment of left-to-right intracardiac shunting by velocity-encoded, phase-difference magnetic resonance imaging. A comparison with oximetric and indicator dilution techniques. Circulation 1995;91(12):2955–2960. [DOI] [PubMed] [Google Scholar]
- 13.Beerbaum P, Körperich H, Barth P, Esdorn H, Gieseke J, Meyer H. Noninvasive quantification of left-to-right shunt in pediatric patients: phase-contrast cine magnetic resonance imaging compared with invasive oximetry. Circulation 2001;103(20):2476–2482. [DOI] [PubMed] [Google Scholar]
- 14.Markl M, Frydrychowicz A, Kozerke S, Hope M, Wieben O. 4D flow MRI. J Magn Reson Imaging 2012;36(5):1015–1036. [DOI] [PubMed] [Google Scholar]
- 15.Hsiao A, Alley MT, Massaband P, Herfkens RJ, Chan FP, Vasanawala SS. Improved cardiovascular flow quantification with time-resolved volumetric phase-contrast MRI. Pediatr Radiol 2011;41(6):711–720. [DOI] [PMC free article] [PubMed] [Google Scholar]
- 16.Hsiao A, Yousaf U, Alley MT, et al. Improved quantification and mapping of anomalous pulmonary venous flow with four-dimensional phase-contrast MRI and interactive streamline rendering. J Magn Reson Imaging 2015;42(6):1765–1776. [DOI] [PMC free article] [PubMed] [Google Scholar]
- 17.Chelu RG, Horowitz M, Sucha D, et al. Evaluation of atrial septal defects with 4D flow MRI-multilevel and inter-reader reproducibility for quantification of shunt severity. MAGMA 2019;32(2):269–279. [DOI] [PMC free article] [PubMed] [Google Scholar]
- 18.Feneis JF, Kyubwa E, Atianzar K, et al. 4D flow MRI quantification of mitral and tricuspid regurgitation: Reproducibility and consistency relative to conventional MRI. J Magn Reson Imaging 2018;48(4):1147–1158. [DOI] [PMC free article] [PubMed] [Google Scholar]
- 19.Driessen MMP, Schings MA, Sieswerda GT, et al. Tricuspid flow and regurgitation in congenital heart disease and pulmonary hypertension: comparison of 4D flow cardiovascular magnetic resonance and echocardiography. J Cardiovasc Magn Reson 2018;20(1):5. [DOI] [PMC free article] [PubMed] [Google Scholar]
- 20.Adriaans BP, Westenberg JJM, van Cauteren YJM, et al. Clinical assessment of aortic valve stenosis: Comparison between 4D flow MRI and transthoracic echocardiography. J Magn Reson Imaging 2020;51(2):472–480. [DOI] [PMC free article] [PubMed] [Google Scholar]
- 21.Roes SD, Hammer S, van der Geest RJ, et al. Flow assessment through four heart valves simultaneously using 3-dimensional 3-directional velocity-encoded magnetic resonance imaging with retrospective valve tracking in healthy volunteers and patients with valvular regurgitation. Invest Radiol 2009;44(10):669–675. [DOI] [PubMed] [Google Scholar]
- 22.Baim DS, Grossman W, eds. Grossman’s Cardiac Catheterization, Angiography, and Intervention. Philadelphia, Pa: Lippincott, Williams and Williams, 2006. [Google Scholar]
- 23.Valente AM, Cook S, Festa P, et al. Multimodality imaging guidelines for patients with repaired tetralogy of Fallot: a report from the American Society of Echocardiography: developed in collaboration with the Society for Cardiovascular Magnetic Resonance and the Society for Pediatric Radiology. J Am Soc Echocardiogr 2014;27(2):111–141. [DOI] [PubMed] [Google Scholar]
- 24.Silvestry FE, Cohen MS, Armsby LB, et al. Guidelines for the Echocardiographic Assessment of Atrial Septal Defect and Patent Foramen Ovale: From the American Society of Echocardiography and Society for Cardiac Angiography and Interventions. J Am Soc Echocardiogr 2015;28(8):910–958. [DOI] [PubMed] [Google Scholar]
- 25.Campbell RM, Douglas PS, Eidem BW, et al. ACC/AAP/AHA/ASE/HRS/SCAI/SCCT/SCMR/SOPE 2014 appropriate use criteria for initial transthoracic echocardiography in outpatient pediatric cardiology: a report of the American College of Cardiology Appropriate Use Criteria Task Force, American Academy of Pediatrics, American Heart Association, American Society of Echocardiography, Heart Rhythm Society, Society for Cardiovascular Angiography and Interventions, Society of Cardiovascular Computed Tomography, Society for Cardiovascular Magnetic Resonance, and Society of Pediatric Echocardiography. J Am Soc Echocardiogr 2014;27(12):1247–1266. [DOI] [PubMed] [Google Scholar]
- 26.Quiñones MA, Otto CM, Stoddard M, Waggoner A, Zoghbi WA; Doppler Quantification Task Force of the Nomenclature and Standards Committee of the American Society of Echocardiography. Recommendations for quantification of Doppler echocardiography: a report from the Doppler Quantification Task Force of the Nomenclature and Standards Committee of the American Society of Echocardiography. J Am Soc Echocardiogr 2002;15(2):167–184. [DOI] [PubMed] [Google Scholar]
- 27.Stout KK, Daniels CJ, Aboulhosn JA, et al. 2018 AHA/ACC Guideline for the Management of Adults With Congenital Heart Disease: A Report of the American College of Cardiology/American Heart Association Task Force on Clinical Practice Guidelines. Circulation 2019;139(14):e698–e800 [Published correction appears in Circulation 2019;139(14):e833–e834.]. [DOI] [PubMed] [Google Scholar]
- 28.Vincent JL. Understanding cardiac output. Crit Care 2008;12(4):174. [DOI] [PMC free article] [PubMed] [Google Scholar]
- 29.Dexter L, Haynes FW, Burwell CS, Eppinger EC, Sagerson RP, Evans JM. Studies of congenital heart disease. II. The pressure and oxygen content of blood in the right auricle, right ventricle, and pulmonary artery in control patients, with observations on the oxygen saturation and source of pulmonary “capillary” blood. J Clin Invest 1947;26(3):554–560. [DOI] [PMC free article] [PubMed] [Google Scholar]
- 30.Cigarroa RG, Lange RA, Hillis LD. Oximetric quantitation of intracardiac left-to-right shunting: limitations of the Qp/Qs ratio. Am J Cardiol 1989;64(3):246–247. [DOI] [PubMed] [Google Scholar]
- 31.Fakler U, Pauli C, Hennig M, Sebening W, Hess J. Assumed oxygen consumption frequently results in large errors in the determination of cardiac output. J Thorac Cardiovasc Surg 2005;130(2):272–276. [DOI] [PubMed] [Google Scholar]
- 32.Visscher MB, Johnson JA. The Fick principle: analysis of potential errors in its conventional application. J Appl Physiol 1953;5(10):635–638. [DOI] [PubMed] [Google Scholar]
- 33.Downing TE, Whitehead KK, Dori Y, et al. Accuracy of conventional oximetry for flow estimation in patients with superior cavopulmonary connection: a comparison with phase-contrast cardiac MRI. Circ Cardiovasc Imaging 2013;6(6):943–949. [DOI] [PMC free article] [PubMed] [Google Scholar]
- 34.Contijoch FJ, Horowitz M, Masutani E, Kligerman S, Hsiao A. 4D Flow vorticity visualization predicts regions of quantitative flow inconsistency for optimal blood flow measurement. Radiol Cardiothorac Imaging 2020;2(1):e190054. [DOI] [PMC free article] [PubMed] [Google Scholar]
Associated Data
This section collects any data citations, data availability statements, or supplementary materials included in this article.


