Abstract
Purpose
To evaluate the reproducibility and predicted clinical outcomes of CT-based quantitative lung density measurements using standard fixed-dose (FD) and reduced-dose (RD) scans.
Materials and Methods
In this retrospective analysis of prospectively acquired data, 1205 participants (mean age, 65 years ± 9 [standard deviation]; 618 men) enrolled in the COPDGene study who underwent FD and RD CT image acquisition protocols between November 2014 and July 2017 were included. Of these, the RD scans of 640 participants were also reconstructed using iterative reconstruction (IR). Median filtering was applied to the RD scans (RD-MF) to investigate an alternative noise reduction strategy. CT attenuation at the 15th percentile of the lung CT histogram (Perc15) was computed for all image types (FD, RD, RD-MF, and RD-IR). Reproducibility coefficients were calculated to quantify the measurement differences between FD and RD scans. The ability of Perc15 to predict chronic obstructive pulmonary disease (COPD) diagnosis and exacerbation frequency was investigated using receiver operating characteristic analysis.
Results
The Perc15 reproducibility coefficients with and without volume adjustment were as follows: RD, 29.43 HU ± 0.62 versus 32.81 HU ± 1.70; RD-MF, 7.42 HU ± 0.42 versus 19.40 HU ± 2.65; and RD-IR, 7.10 HU ± 0.52 versus 22.46 HU ± 3.91. Receiver operating characteristic curve analysis indicated that Perc15 on volume-adjusted FD and RD scans were both predictive for COPD diagnosis (area under the receiver operating characteristic curve [AUC]: FD, 0.724 ± 0.045; RD, 0.739 ± 0.045) and for having one or more exacerbation per year (AUCs: FD, 0.593 ± 0.068; RD, 0.589 ± 0.066). Similar trends were observed when volume adjustment was not applied.
Conclusion
A combination of volume adjustment and noise reduction filtering improved the reproducibility of lung density measurements computed using serial FD and RD CT scans.
Supplemental material is available for this article.
© RSNA, 2021
Summary
Noise reduction filtering applied to CT scans performed with reduced-dose lung cancer screening protocols, in combination with volume adjustment, significantly improves the reproducibility of lung density measurements for longitudinal analysis.
Key Points
■ Variations in dose and breath-hold volumes between serial CT scans resulted in an attenuation at the 15th percentile of the lung histogram (Perc15) reproducibility coefficient of 32.81 HU ± 1.70 (1.96 times standard deviation).
■ Median filtering and volume adjustment improved reproducibility, reducing the Perc15 reproducibility coefficient to 7.42 HU ± 0.42.
■ Receiver operating characteristic curve analysis indicated that volume-adjusted Perc15 using a standard fixed-dose (FD) protocol and a reduced-dose (RD) protocol were both predictive of chronic obstructive pulmonary disease diagnosis (areas under the receiver operating characteristic curve [AUCs]: FD, 0.724 ± 0.045; RD, 0.739 ± 0.045) and one or more annual exacerbation (AUCs: FD, 0.593 ± 0.068; RD, 0.589 ± 0.066).
Introduction
Emphysema is one of the most clinically important features of smoking-related lung injury. The presence and severity of emphysema, measured by CT lung densitometry (CTD), is associated with severity of physiologic impairment, risk of exacerbation of chronic obstructive pulmonary disease (COPD), and mortality. CTD is increasingly used to monitor temporal progression of emphysema (1,2), and it has also been used to evaluate the efficacy of treatment for emphysema related to α-1 antitrypsin deficiency (3). CTD is also used to identify clinically relevant subphenotypes of COPD (4), which may require differing treatment strategies.
Measurement reproducibility is critical for assessing change in CTD measurements during longitudinal imaging studies. Differences in radiation dose (5–8) and breath-hold volume (9–11) between scans reduce CTD reproducibility. The effort to appropriately minimize and individualize radiation dose in accordance with the “as low as reasonably achievable” principle poses a challenge for standardization of CTD, at a time when reduced-dose (RD) CT is increasingly used to screen for lung cancer in individuals who smoke cigarettes, and there is increasing interest in detecting emphysema as an important comorbidity and prognostic determinant at lung cancer screening CT (12–14).
The purpose of this study was to (a) evaluate the reproducibility of CTD measurements between standard fixed-dose (FD) and RD (ie, lung cancer screening) protocols with and without breath-hold volume adjustment and (b) investigate the differences in the ability of lung densitometry to predict clinical outcomes (COPD diagnosis and exacerbation frequency) in COPD using CT acquisitions with FD, RD, and RD with noise filtering applied.
Materials and Methods
Study Overview
The Genetic Epidemiology of COPD (COPDGene) study (COPDGene; ClinicalTrials.gov: NCT00608764) (15), a prospective multicenter observational cohort study of more than 10 000 individuals who had been current and former smokers at the time of inclusion, was conducted with the aim of understanding the etiology, progression, and heterogeneity of COPD (16). The COPDGene study was approved by the institutional review boards at each of the 21 participating clinical sites. For this current study, we obtained written informed consent from all participants, and the study was compliant with the Health Insurance Portability and Accountability Act. C.R.H. and J.P.C. were employed by Imbio and Thirona, respectively, at the time this study was conducted. Statistical analysis was performed by C.R.H., and image processing was partially supervised by J.P.C. Neither C.R.H. nor J.P.C. had influence over participant inclusion.
Participant Overview
This was a retrospective analysis of prospectively acquired data. Scanning occurred between November 2014 and July 2017. To investigate the effects of radiation dose on lung density measurements, a subset of 1358 participants enrolled in the COPDGene study were scanned at full inspiration using both the study’s original CT protocol (15) with an FD of 200 mAs and an updated RD protocol with average dose between 40 and 80 mAs that varied owing to dose modulation. A subset of participants also had RD scans reconstructed using iterative reconstruction (IR). Only patients who had FD and RD in the same scan field of view were included in the study, resulting in a total of 1205 subjects, 640 of which also had RD-IR scans. A study consort diagram is shown in Figure 1. Study population demographics are listed in Table 1.
Figure 1:
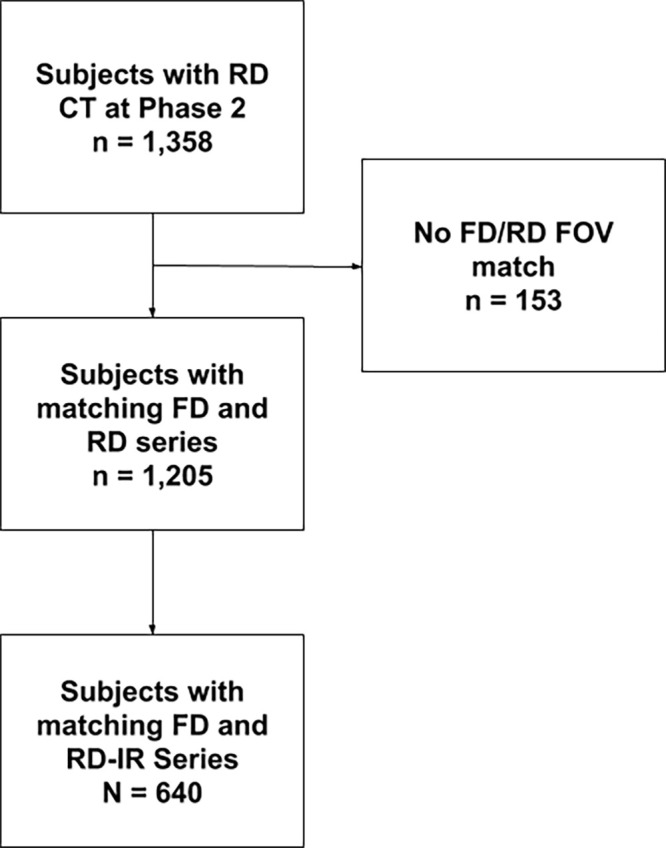
Consort diagram. FD = fixed dose, FOV = field of view, IR = iterative reconstruction, RD = reduced dose.
Table 1:
Study Population
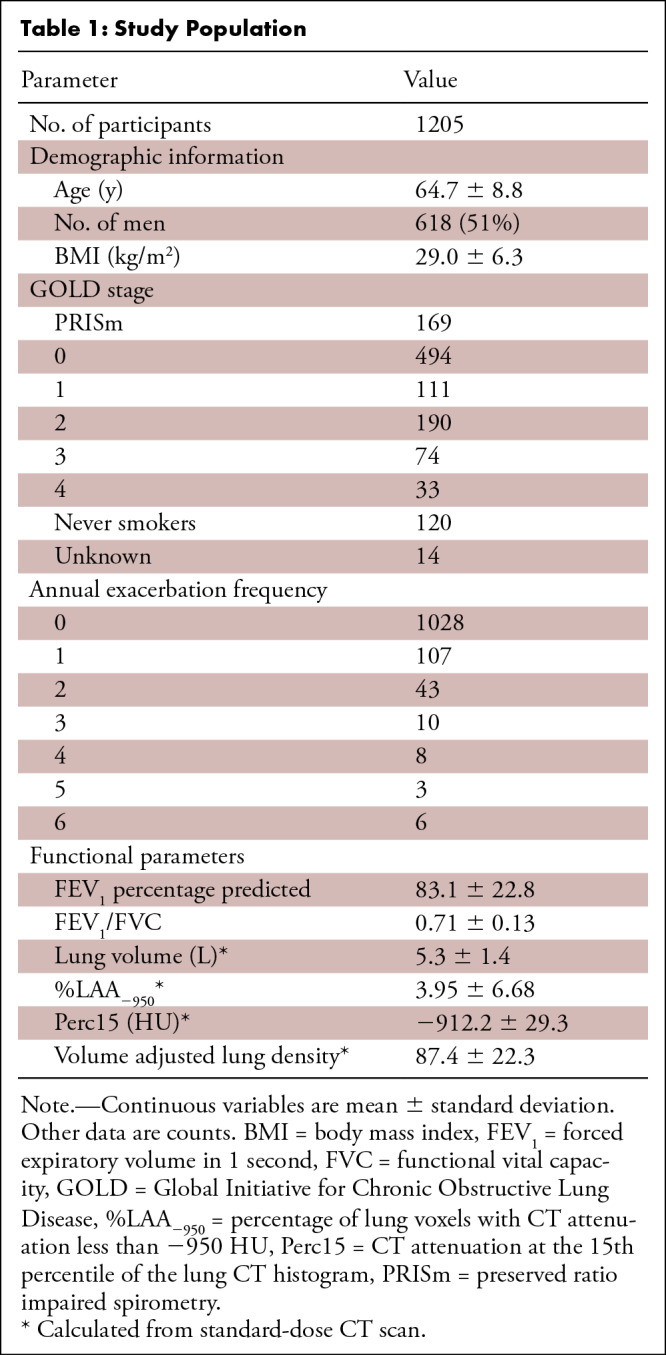
CT Imaging
A total of 12 scanners were used in this study, with different convolution kernels (Tables E1 and E2 [supplement]). Manufacturer-specific RD protocols with dose modulation were designed to have a fixed-reference tube current–time product (Siemens, Philips) or noise index (GE Healthcare). Detailed CT protocols are provided in Appendix E1 (supplement).
The FD and RD scans were performed during consecutive inspiratory breath-holds without the patient leaving the table. In an effort to reduce breath-hold volume variability and to ensure that scans were recorded as close as possible to total lung capacity, a standardized list of breathing instructions was used by site imaging technologists during scanning. Specific instructions can be found in the Quantitative Imaging Biomarkers Alliance lung density profile (17).
Image Processing
The lungs and airways were automatically segmented from each CT image using LungQ software (Thirona) and visually verified for accuracy by trained imaging analysts at the National Jewish Health Quantitative Imaging Laboratory. If a segmentation error was identified, it was manually corrected by an analyst using LungQ software. The 15th percentile point (Perc15) was computed by generating the attenuation histogram for the combined left and right lungs and finding the attenuation value corresponding to the 15th percentile of the histogram. Percentage of lung voxels with CT attenuation less than −950 HU (LAA−950) was computed by dividing the number of voxels less than −950 HU by the total number of voxels in the lungs.
The inspiratory FD and RD scans were performed serially and therefore did not always have the same breath-hold volume, which is known to produce variations in lung density measurements (11). For this reason, the FD and RD scans were adjusted to a predicted volume level based on an equation developed in the Multi-Ethnic Study of Atherosclerosis Lung Study (18). See Appendix E2 (supplement) for equations describing volume adjustment.
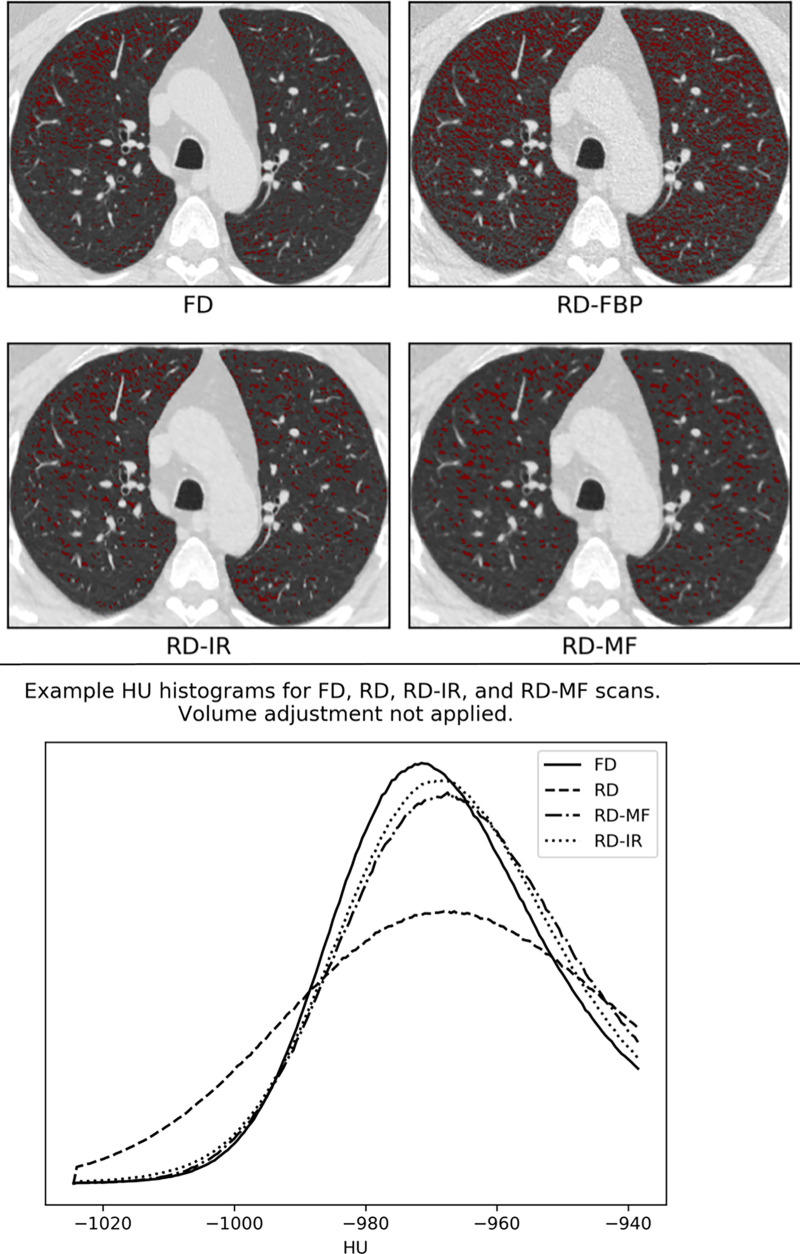
In addition to the RD-IR scans, the effect of applying a simple open-source noise reduction filter to the RD scans was investigated. A 3 × 3 median filter (MF) (19), which replaces every pixel in the image with the median of itself and neighboring pixels, was applied to each section in the RD scans prior to computing lung density measurements using SciPy software (version 1.4.1; scipy.ndimage.median_filter). This is referred to as “RD-MF” herein. Figure 2 presents a visual example of differences in LAA−950 and the effects on attenuation histograms owing to the use of different dose and noise reduction methods.
Figure 2:
Effects of varying dose and noise reduction filtering. In this example, the difference in lung volumes between reduced-dose (RD) and standard fixed-dose (FD) scans were negligible and volume adjustment was not applied. (Top) Low-attenuating area less than −950 (LAA−950) differences between the FD, RD, RD-iterative reconstruction (RD-IR), and RD-median filter (RD-MF) scans presented in this study. (Bottom) Lung attenuation histograms for FD, RD, RD-MF, and RD-IR. FBP = filtered back projection.
Statistical Analysis
Bland-Altman plots (20) were generated showing the bias (mean of differences) and limits of agreement (1.96 times standard deviation of differences) between FD and RD CTD measurements and between breath-hold volumes. The reproducibility coefficient between FD and RD CTD measurements was also computed; this is the value under which the difference between repeated measurements on the same participant performed under different conditions (ie, different dose levels) should fall within 95% probability (21,22). See Appendix E2 (supplement) for details.
The reproducibility 95% CIs were generated using bootstrapping with 5000 resamples. A paired t test was performed using scipy.stats.ttest_rel (version 1.4.1) to test the null hypothesis that the CTD measurements between FD and RD, FD and RD-MF, and FD and RD-IR scans were equal.
To illustrate the importance of reproducibility with regard to measuring longitudinal changes in lung density, the average change over time between CTD measurements was computed from FD scans at baseline of the COPDGene study and FD, RD, RD-MF, and RD-IR scans at 5-year follow-up. For these comparisons, volume adjustment was applied to all scans. A paired t test was used to test for differences in average change in Perc15 over all participants. Differences in longitudinal changes in CTD values (ie, “differences of differences”) for each dose and noise reduction method were compared with the standard method.
Finally, we also compared associations between CTD measures, COPD diagnosis, and exacerbation frequency. COPD diagnosis was defined as a forced expiratory volume in 1 second–to–forced vital capacity ratio of less than 0.70 as measured by spirometry. Exacerbation frequency was determined using a questionnaire. Area under the receiver operating characteristic curve (AUC) and Youden J statistic (sensitivity + specificity – 1) (23) values were calculated for detection of spirometrically defined COPD and the occurrence of one or more annual exacerbations. Spearman correlations between CTD measurements and Global Initiative for Chronic Obstructive Lung Disease (GOLD) stage were computed. The 95% CIs were generated using bootstrapping with 5000 resamples. Statistical differences between AUC values derived from FD and RD scans were assessed using the DeLong test. All statistical analyses were performed using scipy.stats (version 1.4.1). Because the purpose of this analysis was to conduct a head-to-head comparison of the ability of CTD measurements from FD, RD, RD-MF, and RD-IR scans to predict clinical outcomes, only participants for whom RD-IRs in addition to filtered back-projection reconstructions were available were considered.
Results
Breath-hold Volume Reproducibility
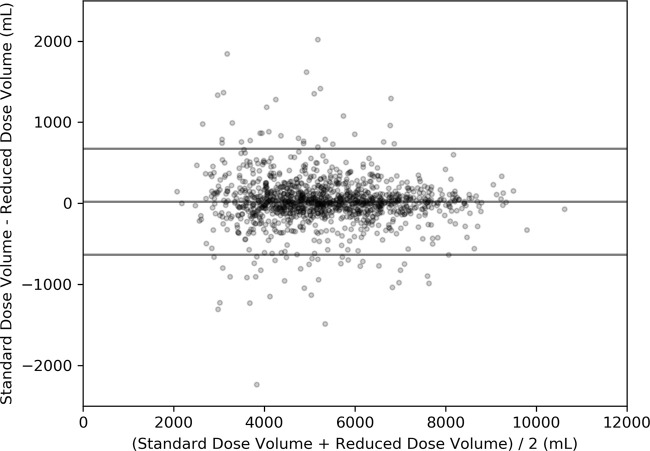
A Bland-Altman plot comparing the total lung capacity breath-hold lung volumes between FD and RD scans is shown in Figure 3. The FD volume was not different from the RD volume (FD, 5339.3 mL vs RD, 5319.7 mL; P = .73). The bias ± limits of agreement were 19.6 mL ± 654, which corresponds to −14.4% and +16.6%.
Figure 3:
Bland-Altman plot for total lung capacity breath-hold repeatability. The bias ± limits of agreement (19.6 mL ± 645) are represented as horizontal lines on the plot.
CTD Reproducibility
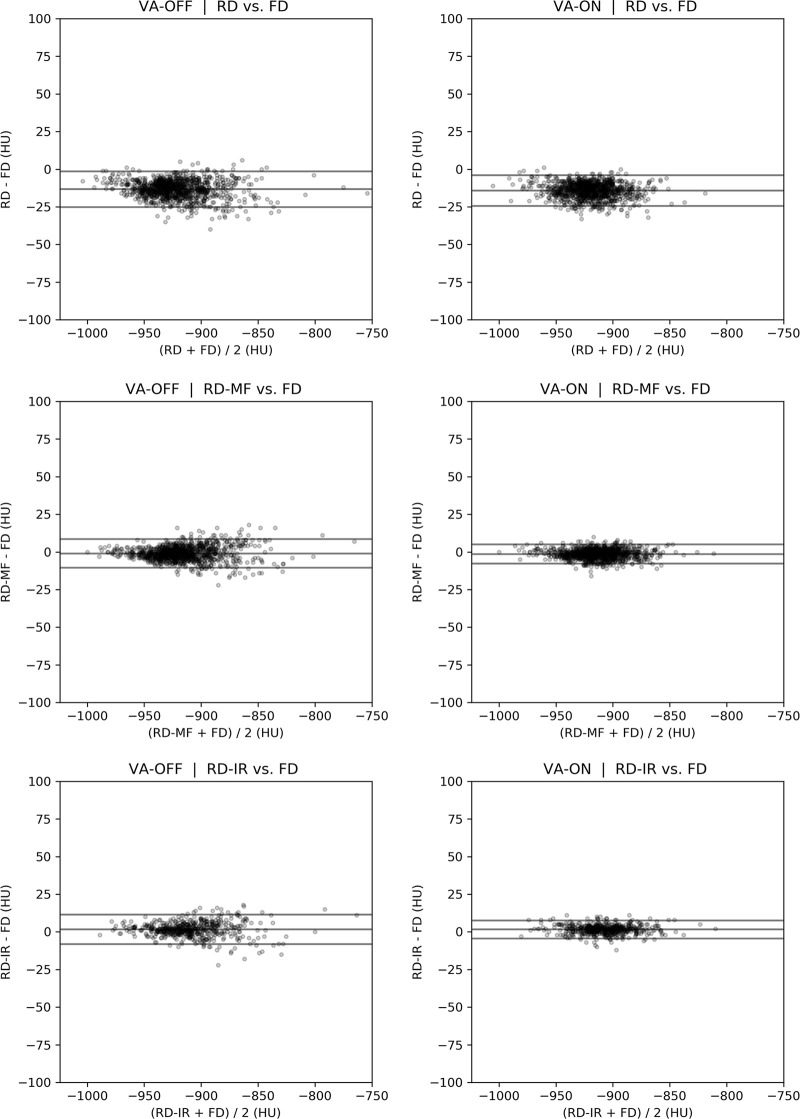
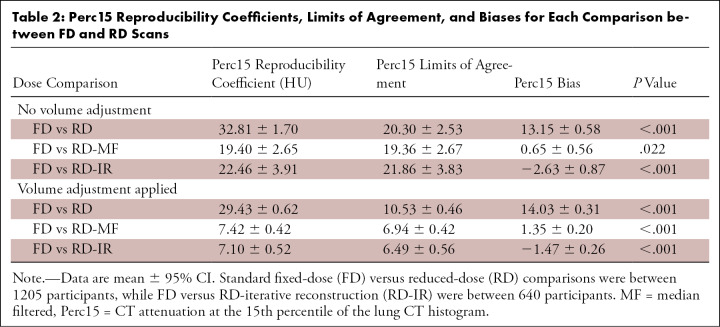
Bland-Altman plots showing differences in whole-lung in Perc15 and LAA−950 between FD and RD scans are shown in Figures 4 and E1 (supplement). Reproducibility coefficients, limits of agreement, bias, and t test results are summarized in Tables 2 and E3 (supplement). The same statistics are summarized in Tables E4 and E5 (supplement) for the subset of the cohort for whom IRs were available. When volume adjustment and noise reduction filtering were not used, variations in dose and breath-hold volumes between serial CT scans resulted in a Perc15 reproducibility coefficient of 32.81 HU ± 1.70 (95% CI). MF and IR, combined with volume adjustment improved reproducibility, reduced the Perc15 reproducibility coefficient to 7.42 HU ± 0.42 for RD-MF and 7.10 HU ± 0.42 for RD-IR scans. MF and IR appeared to remove most of the Perc15 measurement bias regardless of whether or not volume adjustment was applied, whereas application of volume adjustment contributed mainly to reducing measurement variability (ie, smaller limits of agreement). Significant differences in the mean measurements between FD scans and RD scans were demonstrated in all cases, indicating that lung density measurements are on average different for RD scans compared with FD scans, even when noise reduction filtering and volume adjustment were applied.
Figure 4:
Bland-Altman plots for CT attenuation at the 15th percentile of the lung CT histogram between standard fixed-dose (FD) and reduced-dose (RD) scans. IR = iterative reconstruction, MF = median filtered, VA = volume adjustment.
Table 2:
Perc15 Reproducibility Coefficients, Limits of Agreement, and Biases for Each Comparison between FD and RD Scans
Changes in mean ± standard deviation Perc15 (volume adjustment applied) between baseline and 5-year follow-up are shown in Table 3. Differences in longitudinal change between different doses and standard dose are shown in Table E6 (supplement). While the mean change over time computed using all FD and RD scanning methods was significantly different from the mean change computed using FD scans at both phases (−2.46 HU ± 14.1), the magnitude of the difference was smaller when the RD-MF (−4.67 HU ± 14.0) and RD-IR (−0.97 HU ± 14.4) methods were used for 5-year follow-up CTD measurements, as opposed to RD scans with no noise reduction (−17.48 HU ± 14.2).
Table 3:
Mean Changes in Perc15 from COPDGene Baseline to 5-year Follow-up
Association with Clinical Outcomes
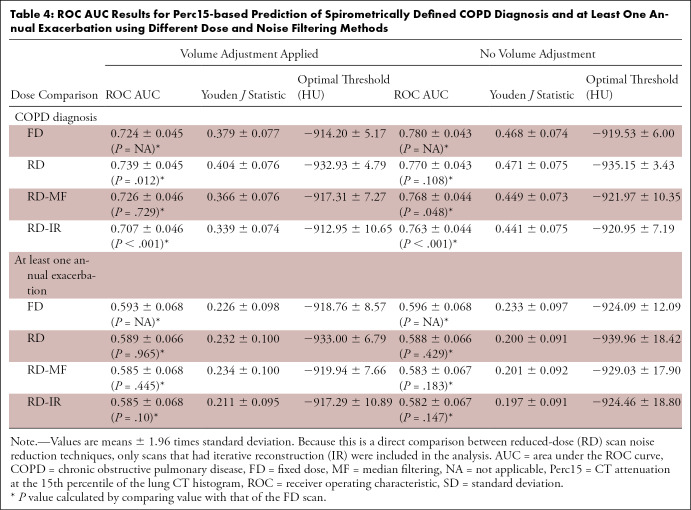
Receiver operating characteristic curve analysis results are shown in Table 4 for Perc15 and Table E7 (supplement) for LAA−950. When volume adjustment was used, the ability of Perc15 to predict clinical outcomes was the same for FD and RD-MF scans (FD, 0.724 ± 0.045; RD-MF, 0.726 ± 0.046; P = .73 for COPD diagnosis, and FD, 0.593 ± 0.068; RD, 0.585 ± 0.068; P = .45 for one or more annual exacerbation). However, the ability to predict COPD diagnosis was higher when using RD scans (RD, 0.739 ± 0.045; P = .012) and lower when using RD-IR scans (RD-IR, 0.707 ± 0.046; P < .001). Spearman correlations (Table E8 [supplement]) revealed significant relationships between CTD measurements and GOLD stage for FD, RD, RD-MF, and RD-IR scans. AUC values tended to be higher when volume adjustment was not applied. For LAA−950, AUC values for RD, RD-MF, and RD-IR were typically lower than for FD scans.
Table 4:
ROC AUC Results for Perc15-based Prediction of Spirometrically Defined COPD Diagnosis and at Least One Annual Exacerbation using Different Dose and Noise Filtering Methods
Discussion
We demonstrated that the use of noise reduction filtering and volume adjustment on RD scans improves the reproducibility of CTD measurements when compared with FD scans, allowing for more accurate detection of true smoking-related changes in lung density. Emphysema has been found to occur in 29% of smokers undergoing lung cancer screening with low-dose CT, and its presence has been shown to be strongly associated with increased risk of lung cancer diagnosis (24,25) and respiratory and lung cancer mortality (14,26). Additionally, quantitatively detected emphysema at CT can progress before any changes are evident at pulmonary function testing (1). When performing longitudinal analysis to assess changes in lung density between a baseline FD scan and a follow-up RD scan, the threshold for clinically significant change if no volume adjustment or noise filtering is applied is a difference of 32.8 HU for Perc15; however, if both volume adjustment and MF are applied, the threshold for significant change drops to 7.4 HU. Pompe et al (1) recently showed that patients with GOLD stages 1–4 had an average Perc15 decrease of 5.07 HU over 5 years in the COPDGene study. Because lung density does not change quickly for a typical patient with COPD, reducing the reproducibility coefficient to a value as low as possible will be important for detecting patients with clinically significant radiologic progression of emphysema.
It should be noted that although there was a very short time interval between the FD and RD scans, the variability in breath-hold lung volumes was relatively high compared with other studies. For example, lung volume differences (mean ± 1.96 times standard deviation) of 50.0 mL ± 80.0 with 9 months between scans (27) and 40.0 mL ± 80.0 with 15 minutes between scans (28) have previously been reported, compared with 19.6 mL ± 654 in our study. It is unclear why these differences in lung volume reproducibility exist, but one possible explanation is that the CT scans from our study were performed at 17 different sites and thus posed more of a challenge from the standpoint of imaging quality control. One advantage is that our study may more accurately reflect the breath-hold volume variability that would be encountered in a typical clinical scenario.
Associations between lung density and clinical outcomes were demonstrated for all FD and RD scan types. AUC values typically were higher with FD scans than with RD scans, but the difference was not always significant. Interestingly, the AUC and Youden J statistic values associated with prediction of COPD tended to increase when volume adjustment was not applied. This suggests that, although volume adjustment is important for achieving measurement reproducibility in longitudinal studies, there is some information loss associated with applying volume adjustment. This may be because increases in breath-hold volume may not be purely due to poor inspiratory effort but may also represent real change in disease, which application of volume adjustment removes.
A measurement of percentage of low-attenuation area greater than 5% is considered to be a clinically significant finding owing to differences observed in symptoms, annual exacerbations, and mortality for participants above and below that threshold (29). Based on data from the cohort described in this study, clinically significant thresholds for detection of COPD using Perc15 are −915 HU and −934 HU for FD and RD, respectively, and using LAA−950 are 1.8% and 8.6% for FD and RD, respectively. Similar values are useful for prediction of one or more annual exacerbations, although the predictive ability is weaker. This shows that, although CTD applied to FD and RD scans for prediction of clinical outcomes is not significantly different, the optimal thresholds used to determine clinically significant findings change depending on the dose and noise filtering techniques.
In terms of improving reproducibility between lung density metrics for FD and RD scans, there was no strong evidence that MF was superior to IR or vice versa. Both greatly improved reproducibility and had similar results in terms of predicting clinical outcomes. One advantage of MF is that it is simple to implement in commercial software and will always exhibit the same performance, whereas IRs vary between manufacturers and their performance is subject to change over time.
This study had a few limitations. The study population included sequential COPDGene participants scanned during the latter part of the second phase of the study. IR was not available at all sites, depending on equipment. We also did not evaluate the effect of RD on visual assessments of emphysema or lung texture. Finally, we did not investigate the effect of so-called partial iterative algorithms on lung density measurements.
Overall, the results of this study suggest that lung density measurements obtained from low-dose scans can be used for identification of clinical outcomes in COPD just as effectively as measurements obtained from FD scans, and that thresholds for detection of real changes in disease between FD and RD scans are comparable to what was previously reported in the literature for scans that had the same dose level if volume adjustment and noise reduction are applied to the RD scan. With the recent coverage of low-dose CT lung cancer screening by the Centers for Medicare & Medicaid Services (30), early detection and phenotyping of emphysema becomes important in identifying individuals at increased risk of mortality, lung cancer diagnosis, progressive airflow obstruction, and progressive emphysema (24,25,31). Considering that individuals who smoke are the main population at risk, detection of real changes may be useful in risk-modifying interventions such as smoking cessation in this screening population (32).
APPENDIX
SUPPLEMENTAL FIGURES
Supported by the COPDGene study (NCT00608764) from the National Heart, Lung, and Blood Institute (grants U01 HL089897 and U01 HL089856). The COPDGene® project is also supported by the COPD Foundation through contributions made to an Industry Advisory Board comprising AstraZeneca, Boehringer Ingelheim, GlaxoSmithKline, Novartis, Pfizer, Siemens, and Sunovion. They had no role in study design and collection, analysis, interpretation of data, and in writing the manuscript. C.R.H. supported by the National Institutes of Health (grants R44HL140894, and R01HL150023).
Disclosures of Conflicts of Interest: C.R.H. Activities related to the present article: institution receives grant from NIH NHLBI (1R01HL150023-01). Activities not related to the present article: author is employee and stock option holder at Imbio. Other relationships: disclosed no relevant relationships. A.S.O. disclosed no relevant relationships. N.A.O. disclosed no relevant relationships. J.P.C. Activities related to the present article: institution received grant form COPD Foundation for data analysis. Activities not related to the present article: author employed by Thirona (Head of R&D); author is shareholder in Thirona. Other relationships: disclosed no relevant relationships. D.A.L. Activities related to the present article: institution received grant from NHLBI (funding for COPDGene study). Activities not related to the present article: disclosed no relevant relationships. Other relationships: disclosed no relevant relationships. S.M.H. Activities related to the present article: institution received grant from NHLBI. Activities not related to the present article: disclosed no relevant relationships. Other relationships: disclosed no relevant relationships.
Abbreviations:
- AUC
- area under the receiver operating characteristic curve
- COPD
- chronic obstructive pulmonary disease
- Perc15
- CT attenuation at the 15th percentile of the lung CT histogram
- CTD
- CT lung densitometry
- FD
- fixed dose
- GOLD
- Global Initiative for Chronic Obstructive Lung Disease
- IR
- iterative reconstruction
- LAA−950
- percentage of lung voxels with CT attenuation less than −950 HU
- MF
- median filtering
- RD
- reduced dose
References
- 1.Pompe E, Strand M, van Rikxoort EM, et al. Five-year Progression of Emphysema and Air Trapping at CT in Smokers with and Those without Chronic Obstructive Pulmonary Disease: Results from the COPDGene Study. Radiology 2020;295(1):218–226. [DOI] [PMC free article] [PubMed] [Google Scholar]
- 2.Labaki WW, Gu T, Murray S, et al. Voxel-wise longitudinal parametric response mapping analysis of chest computed tomography in smokers. Acad Radiol 2019;26(2):217–223. [DOI] [PMC free article] [PubMed] [Google Scholar]
- 3.Dirksen A, Piitulainen E, Parr DG, et al. Exploring the role of CT densitometry: a randomised study of augmentation therapy in alpha1-antitrypsin deficiency. Eur Respir J 2009;33(6):1345–1353. [DOI] [PubMed] [Google Scholar]
- 4.Lynch DA, Austin JH, Hogg JC, et al. CT-Definable Subtypes of Chronic Obstructive Pulmonary Disease: A Statement of the Fleischner Society. Radiology 2015;277(1):192–205. [DOI] [PMC free article] [PubMed] [Google Scholar]
- 5.Madani A, De Maertelaer V, Zanen J, Gevenois PA. Pulmonary emphysema: radiation dose and section thickness at multidetector CT quantification--comparison with macroscopic and microscopic morphometry. Radiology 2007;243(1):250–257. [DOI] [PubMed] [Google Scholar]
- 6.Wang R, Sui X, Schoepf UJ, et al. Ultralow-radiation-dose chest CT: accuracy for lung densitometry and emphysema detection. AJR Am J Roentgenol 2015;204(4):743–749. [DOI] [PubMed] [Google Scholar]
- 7.Hammond E, Sloan C, Newell JD Jr, et al. Comparison of low- and ultralow-dose computed tomography protocols for quantitative lung and airway assessment. Med Phys 2017;44(9):4747–4757. [DOI] [PMC free article] [PubMed] [Google Scholar]
- 8.Koyama H, Ohno Y, Yamazaki Y, et al. Quantitative and qualitative assessments of lung destruction and pulmonary functional loss from reduced-dose thin-section CT in pulmonary emphysema patients. Acad Radiol 2010;17(2):163–168. [DOI] [PubMed] [Google Scholar]
- 9.Chong D, Brown MS, Kim HJ, et al. Reproducibility of volume and densitometric measures of emphysema on repeat computed tomography with an interval of 1 week. Eur Radiol 2012;22(2):287–294. [DOI] [PubMed] [Google Scholar]
- 10.Stoel BC, Putter H, Bakker ME, et al. Volume correction in computed tomography densitometry for follow-up studies on pulmonary emphysema. Proc Am Thorac Soc 2008;5(9):919–924. [DOI] [PubMed] [Google Scholar]
- 11.Shaker SB, Dirksen A, Laursen LC, Skovgaard LT, Holstein-Rathlou NH. Volume adjustment of lung density by computed tomography scans in patients with emphysema. Acta Radiol 2004;45(4):417–423. [DOI] [PubMed] [Google Scholar]
- 12.Regan EA, Lowe KE, Make BJ, et al. Identifying Smoking-Related Disease on Lung Cancer Screening CT Scans: Increasing the Value. Chronic Obstr Pulm Dis 2019;6(3):233–245. [DOI] [PMC free article] [PubMed] [Google Scholar]
- 13.Lowe KE, Regan EA, Anzueto A, et al. COPDGene® 2019: Redefining the Diagnosis of Chronic Obstructive Pulmonary Disease. Chronic Obstr Pulm Dis 2019;6(5):384–399. [DOI] [PMC free article] [PubMed] [Google Scholar]
- 14.Humphries SM, Notary AM, Centeno JP, et al. Deep Learning Enables Automatic Classification of Emphysema Pattern at CT. Radiology 2020;294(2):434–444. [DOI] [PMC free article] [PubMed] [Google Scholar]
- 15.Regan EA, Hokanson JE, Murphy JR, et al. Genetic epidemiology of COPD (COPDGene) study design. COPD 2010;7(1):32–43. [DOI] [PMC free article] [PubMed] [Google Scholar]
- 16.Bhatt SP, Washko GR, Hoffman EA, et al. Imaging Advances in Chronic Obstructive Pulmonary Disease. Insights from the Genetic Epidemiology of Chronic Obstructive Pulmonary Disease (COPDGene) Study. Am J Respir Crit Care Med 2019;199(3):286–301. [DOI] [PMC free article] [PubMed] [Google Scholar]
- 17.QIBA Lung Density Biomarker Committee . RSNA QIBA Lung Density Profile. https://qibawiki.rsna.org/index.php/Lung_Density_Biomarker_Ctte. Accessed November 20, 2020.
- 18.Hoffman EA, Ahmed FS, Baumhauer H, et al. Variation in the percent of emphysema-like lung in a healthy, nonsmoking multiethnic sample. The MESA lung study. Ann Am Thorac Soc 2014;11(6):898–907. [DOI] [PMC free article] [PubMed] [Google Scholar]
- 19.Hilts M, Duzenli C. Image filtering for improved dose resolution in CT polymer gel dosimetry. Med Phys 2004;31(1):39–49. [DOI] [PubMed] [Google Scholar]
- 20.Bland JM, Altman DG. Measuring agreement in method comparison studies. Stat Methods Med Res 1999;8(2):135–160. [DOI] [PubMed] [Google Scholar]
- 21.Obuchowski NA. Interpreting Change in Quantitative Imaging Biomarkers. Acad Radiol 2018;25(3):372–379. [DOI] [PMC free article] [PubMed] [Google Scholar]
- 22.Obuchowski NA, Reeves AP, Huang EP, et al. Quantitative imaging biomarkers: a review of statistical methods for computer algorithm comparisons. Stat Methods Med Res 2015;24(1):68–106. [DOI] [PMC free article] [PubMed] [Google Scholar]
- 23.Schisterman EF, Faraggi D, Reiser B, Hu J. Youden Index and the optimal threshold for markers with mass at zero. Stat Med 2008;27(2):297–315. [DOI] [PMC free article] [PubMed] [Google Scholar]
- 24.Hatt C, Galban C, Labaki W, Kazerooni E, Lynch D, Han M. Convolutional Neural Network Based COPD and Emphysema Classifications Are Predictive of Lung Cancer Diagnosis. In: Stoyanov D, Taylor Z, Kainz B, et al., eds. Image Analysis for Moving Organ, Breast, and Thoracic Images. RAMBO 2018, BIA 2018, TIA 2018. Lecture Notes in Computer Science, vol 11040. Cham, Switzerland: Springer, 2018; 302–309. [Google Scholar]
- 25.Labaki W, Wang W, Murray S, et al. Incremental Quantitative Emphysema on Low-Dose Screening Chest CT Is Associated with Lung Cancer Incidence and Mortality: An Analysis of the National Lung Screening Trial. D104. Phenotypes and the Multiple Dimensions of COPD [abstract]. In: American Thoracic Society 2018 International Conference, San Diego, CA, May 18–23, 2018. New York, NY: American Thoracic Society, 2018; A7491. https://www.atsjournals.org/doi/abs/10.1164/ajrccm-conference.2018.197.1_MeetingAbstracts.A7491. [Google Scholar]
- 26.Oelsner EC, Carr JJ, Enright PL, et al. Per cent emphysema is associated with respiratory and lung cancer mortality in the general population: a cohort study. Thorax 2016;71(7):624–632. [DOI] [PMC free article] [PubMed] [Google Scholar]
- 27.Brown MS, Kim HJ, Abtin F, et al. Reproducibility of lung and lobar volume measurements using computed tomography. Acad Radiol 2010;17(3):316–322. [DOI] [PubMed] [Google Scholar]
- 28.Gierada DS, Yusen RD, Pilgram TK, et al. Repeatability of quantitative CT indexes of emphysema in patients evaluated for lung volume reduction surgery. Radiology 2001;220(2):448–454. [DOI] [PubMed] [Google Scholar]
- 29.Han M, Tayob N, Kim V, et al. Association between emphysema, exacerbations and mortality in the COPDGene and SPIROMICS cohorts. Eur Respir J 2017;50(suppl 61):OA1496. [Google Scholar]
- 30.Wiener RS, Gould MK, Arenberg DA, et al. An official American Thoracic Society/American College of Chest Physicians policy statement: implementation of low-dose computed tomography lung cancer screening programs in clinical practice. Am J Respir Crit Care Med 2015;192(7):881–891. [DOI] [PMC free article] [PubMed] [Google Scholar]
- 31.Oh AS, Strand M, Pratte K, et al. Visual Emphysema at Chest CT in GOLD Stage 0 Cigarette Smokers Predicts Disease Progression: Results from the COPDGene Study. Radiology 2020;296(3):641–649. [DOI] [PMC free article] [PubMed] [Google Scholar]
- 32.Gietema HA, Schilham AM, van Ginneken B, van Klaveren RJ, Lammers JWJ, Prokop M. Monitoring of smoking-induced emphysema with CT in a lung cancer screening setting: detection of real increase in extent of emphysema. Radiology 2007;244(3):890–897. [DOI] [PubMed] [Google Scholar]
Associated Data
This section collects any data citations, data availability statements, or supplementary materials included in this article.


