Abstract
The emergent patterns of collective motion are thought to arise from application of individual-level rules that govern how individuals adjust their velocity as a function of the relative position and behaviours of their neighbours. Empirical studies have sought to determine such rules of interaction applied by ‘average’ individuals by aggregating data from multiple individuals across multiple trajectory sets. In reality, some individuals within a group may interact differently from others, and such individual differences can have an effect on overall group movement. However, comparisons of rules of interaction used by individuals in different contexts have been largely qualitative. Here we introduce a set of randomization methods designed to determine statistical differences in the rules of interaction between individuals. We apply these methods to a case study of leaders and followers in pairs of freely exploring eastern mosquitofish (Gambusia holbrooki). We find that each of the randomization methods is reliable in terms of: repeatability of p-values, consistency in identification of significant differences and similarity between distributions of randomization-based test statistics. We observe convergence of the distributions of randomization-based test statistics across repeat calculations, and resolution of any ambiguities regarding significant differences as the number of randomization iterations increases.
Keywords: collective motion, followers, Gambusia holbrooki, leaders, randomization methods, rules of interaction
1. Introduction
Coordinated collective motion is a ubiquitous phenomenon, manifest across multiple species [1,2]. In many instances, large groups move in a coherent and cohesive manner, producing striking patterns, without centralized control or prior planning. The broad, prevailing hypothesis is that the group-level patterns of collective motion, including coordinated directed movement, arise from relatively local social interactions between individual group members [1,2]. Such interactions are sometimes referred to as ‘rules of interaction’ or ‘rules of motion’ and describe how individuals adjust their velocity as a function of the relative positions, velocities and behaviours of their group mates [3].
Model-based interaction rules often include mechanisms for at least one of the following: collision avoidance with nearby group mates (repulsion), alignment/orientation with the movements of group mates at intermediate distances and attraction/cohesion to group mates to facilitate joining a group when an individual is isolated, to maintain group membership and to avoid or limit separation from the group for individuals [4–10]. With such rules, or a subset of such rules, in action, models of collective motion can generate patterns of movement that reasonably resemble real animal motion across a range of species and contexts.
Models including those referenced above grew to dominate the theory and understanding of collective animal movement. Empirical support for the hypothesis that collective animal motion arises from local interactions was limited to comparisons between emergent patterns from models and local group structure, such as neighbour distances, in real groups. This was until advances in animal tracking, and methods for analysing the trajectories of animals, led to the development of methods for resolving rules of interaction from observational data in much finer detail. One of the seminal studies in this area tracked the motion of starlings in three dimensions over short time periods via stereophotography, and found evidence of the use of local interaction rules in the statistical distribution of neighbours relative to other individuals [11]. Subsequent studies then examined the tendency for individuals to align in flocks of homing pigeons [12], and found further evidence for the presence of local interactions driving collective motion in the local group structure and alignment of flocks of surf scoters [13]. At a similar time, methods were developed to estimate interactions directly from animal (or particle) trajectories [14,15]. Building on this sequence of studies, Herbert-Read et al. [3] and Katz et al. [16] then concurrently applied techniques for estimating the average rules of interaction used by individuals undergoing two-dimensional motion to trajectory data of fish obtained by visual tracking. Explicitly, these methods estimated the components of the average changes in an individual's velocity as a function of: the relative coordinates of their group mates, along with the speed of the individual, the relative direction from the individual to their group mates and the speed of the group mates. Both studies revealed the presence of collision avoidance and attraction behaviour, consistent with model assumptions, but the details of these behaviours differed from how they have been modelled in some cases.
Subsequent studies have taken the analysis of interactions in collective motion further. Strandburg-Peshkin et al. [17] used ray-casting methods from computational science to infer the visual network in moving groups of fish, and identified that such visual networks better explain behavioural responses than the alternatives of metric, topological or Voronoi diagram-based networks [17]. Tunstrøm et al. [18] performed a systematic analysis of the emergent states of shoaling fish via order parameters at fine temporal scale; the decoupling of social and boundary interactions, and bursting and coasting movements, were addressed in [19,20]; and Heras et al. [21] used artificial neural networks to infer interaction rules, including work to understand which independent variables are most important in the determination of such rules. The ambition of recent work has even extended to inference of repulsion and attraction behaviour in ancient, and extinct, species through the structure of fossilized fish shoals [22]. A number of studies over the last decade have also sought to construct collective motion models informed by, or derived directly as part of, the process of estimating rules of interaction [19,20,23–25]. The resulting ‘data-driven’ models allow for an examination of the accuracy of estimated rules of interaction via comparisons of simulated and real group-level properties of movement.
Many of the studies outlined above infer interactions, or their presence, by aggregating data across multiple individuals or observational trials [3,11,13,16,21], and in so doing generate a picture of the behaviour of an average individual. For large enough groups of animals that exhibit a tendency to conform with the movements of others [26], the behaviour of this average individual may be a good indicator of the behaviour of the real individuals in the group. However, this may not be the case for all moving groups, and theoretical [27] and experimental work [28] has shown that the structure and dynamics of collective movement are affected by differences between individuals in interaction rules, sociability and locomotion. Such individual differences could be due to differences in internal state, such as hunger level [29,30], the acquired knowledge of individuals [31,32], cues in the environment [33,34] or the fact that a group comprises mixed species [35]. In broad terms, understanding the relationship between individual heterogeneity, across a broad range of physiological and behavioural traits, and group-level behaviour has become fundamental to better understanding of not just collective movement, but collective behaviour in general [36].
A key element to understanding whether there are differences in rules of interaction between categories of individuals is an appropriate statistical test. As an initial attempt to address this problem, a randomization method was applied to examine potential differences in interactions between leaders and followers in pairs of free-swimming eastern mosquitofish (Gambusia holbrooki) in the prototype work for this study [37]. That method identified particular intervals, to the front and back or sides of individuals, over which the difference in responses of leaders and followers to their partners, in terms of changes in speed, changes in direction of motion, speed and the statistical distribution of neighbour positions, were larger than might be expected at random. A similar approach was applied by Harpaz et al. [38] to examine differences in the weighting applied to social rules of interaction and interactions with arena walls between free-swimming naive zebrafish (Danio rerio) and zebrafish trained to seek food in the arena. The approach applied in [38] differed from that in [37] in that the measures of interest were compared over regions in two dimensions, rather than intervals in one dimension, and t-tests rather than randomizations were applied to identify any significant differences. Both approaches suggested some differences (at the 0.05 significance level) between the categories of individuals being compared. However, both analyses were performed over relatively large numbers of intervals (47 per behavioural measure in [37]) or regions (42 including the arena walls in different directions in [38]) without taking into account the potential for false positives owing to multiple testing. Beyond these two studies, direct comparisons of rules of interaction inferred from observational data have been largely qualitative. For example, work in [34] examined potential differences in estimated rules of interaction functions applied by X-ray tetras (Pristella maxillaris) in the presence of water-based chemical cues via visual inspection of the fitted curves. A similar approach was applied in [35] to compare the estimated rules of interaction applied by threespine sticklebacks (Gasterosteus aculeatus), ninespine sticklebacks (Pungitius pungitius) and roach (Rutilus rutilus) in mixed-species shoals.
In this paper, we describe a set of randomization methods for identifying when there are statistically different rules of interaction between differently categorized individuals within groups. The approach applied here is more in line with standard statistical methods for comparing curves or distributions [39–42], where differences between curves are summarized by single numerical values, rather than a multiple-test approach, as applied in [37,38]. The schemes that we have developed are general, and can be partnered with any technique for fitting functions that estimate rules of interaction from observational data (such as [3,16,19–21]). For this study, rules of interaction and related quantities, were determined by the force-matching methods used in [34], which have been shown to be capable of inferring model prescribed rules of interaction from simulated data to a reasonable level of accuracy, even when data are relatively limited [43] (see electronic supplementary material, §S2 for further discussion). We apply our randomization methods to a case study to examine potential differences in the rules of interaction, and related quantities, between leaders and followers in pairs of freely exploring eastern mosquitofish in shallow water in a laboratory. As part of this work we examine the convergence, repeatability and parsimony of each of the randomization schemes.
2. Material and methods
2.1. Rules of interaction and related measures
Electronic supplementary material, §S1 details the method that we applied to estimate rules of interaction in the form of the average changes in the components of velocity of individuals (via changes in speed, Δs/Δt, and direction of motion, Δθ/Δt) as a function of the relative (x, y) coordinates of their group mates. The consistent frame of reference for the fitted functions was constructed so that a ‘focal’ individual was located at the origin of the coordinate system (0, 0), and the direction of motion of the focal individual was aligned with the positive x-axis. In addition we examined the relative frequency that group mates occupied particular relative coordinates in the same coordinate system, and, for supplementary calculations, the mean speed of individuals as a function of the relative coordinates of group mates, along with measures of the relative alignment with group mates at given coordinates.
2.2. Randomization methods
We developed the following randomization tests as a first attempt at identifying when there are significant differences in the rules of motion applied by individuals belonging to two different categories within moving groups. The tests can be immediately and simply modified to make comparisons between more than two categories by applying a two-category test to all pairs of categories, and then making an appropriate correction to significance levels to take into account multiple comparisons, such as applying the Holm–Bonferroni method [44]. Although the case study examined further below is of data derived from the movements of pairs of eastern mosquitofish, the methods described here are immediately applicable to larger groups, where categories of interest contain more than one member per set of observations, and to any species, given individual trajectory data with sufficiently fine temporal resolution.
The first step in the two-category tests is to divide individuals within groups (or separate sets of observations) equally into the natural categories of interest/to be compared, such as leaders and followers (as for the case study examined here), or into differently treated group members, which, for example, could be hungry and satiated individuals as was the case for the mixed groups of crimson spotted rainbowfish studied in [30]. Having made this division, the next step is to fit a separate average rules of interaction (or some associated measure) function to the data from individuals in the two natural categories following the methods described in electronic supplementary material, §S1 (or another valid approach, such as that used by Katz et al. [16], Calovi et al. [19], Escobedo et al. [20] and Heras et al. [21]). We denote these fitted functions as A and B. We then adopt one of the three following measures as a quantifier of how different the fitted functions are between the different categories of individuals: the mean absolute difference between the observed functions (Dmean), the median absolute difference between the observed functions (Dmedian) or the maximum absolute difference between the observed functions (Dmax), where the mean, median or maximum is taken across all the bins used in determining the functions (see electronic supplementary material, §S1.2 for details on binning). Explicitly, the mean absolute difference is given by
where Ak and Bk are the values of the fitted functions, A and B, in the kth of Nb bins. The median and maximum values of the set of are also determined via standard processes. We then apply the following randomization procedure for n iterations.
-
(1)
Randomly assign equal numbers of individuals within each set of observational data into two categories, C1 and C2.
-
(2)
Generate a separate rules of interaction (or related measures) function for C1 and C2 individuals.
-
(3)
For each iteration, m, determine the mean, median or maximum absolute difference across bins of the C1 and C2 functions (as is consistent with the chosen reference statistic), , or .
An estimate for the probability of observing a mean, median or maximum absolute difference greater than the reference distance D (omitting the subscripted mean, median or max identifier) with individuals randomly categorized is then
Low values of p (less than 0.05) then suggest that the observed difference between fitted functions based on the selected categorization of individuals within groups is significantly larger than would be expected based on random categorization of individuals within groups. We discuss efficient implementation of the above randomization scheme in conjunction with estimating rules of interaction in electronic supplementary material, §S3.
2.3. Case study: leaders and followers in pairs of female eastern mosquitofish
We trialled our randomization methods on a set of 40 observations of pairs of female eastern mosquitofish (G. holbrooki) freely exploring a simple experimental arena (detailed in electronic supplementary material, §S5). We categorized individuals within each pair as leaders or followers based on the proportion of time spent at the front of the pair by each individual, when the pair were at close range to each other (electronic supplementary material, §S5).
2.4. Case study: measures examined, convergence and repeatability
We applied our randomization methods with each test statistic to examine potential differences between leaders and followers in pairs of mosquitofish across the following measures: the relative frequency, p, that partners occupied given relative x, y or (x, y) coordinates; the mean change in speed, Δs/Δt, of an individual as a function of the relative x, y or (x, y) coordinates of its partner; and the mean change in direction of motion, Δθ/Δt, of an individual as a function of x, y or (x, y). In supplementary calculations, we also examined: the mean speed of an individual, s, as a function of x, y or (x, y); and the mean directions of motion of partners as a function of their (x, y) coordinates, along with the focus, R, about these mean directions.
We examined the effect of increasing the number of randomizations on p-values and distributions of randomized test statistics, by performing sets of n = 100, n = 1000 and n = 10 000 randomizations for each measure and test statistic. We also examined the reliability of our results by repeating our calculations five times for each test statistic, measure and number of randomizations. (In total, we performed 2 331 000 randomization calculations for this study.) We made qualitative comparisons of the p-values derived from each test, along with the distributions of test statistics using histograms with consistent binning (for each test statistic at each resolution/number of randomizations). We also used two-sample Kolmogorov–Smirnov tests [40–42] to compare distributions of randomized test statistics for each of our mean, median and maximum absolute separation tests, for each measure and value of n, with significance thresholds corrected according to the Holm–Bonferroni method [44] to take into account multiple pairwise comparisons.
3. Results
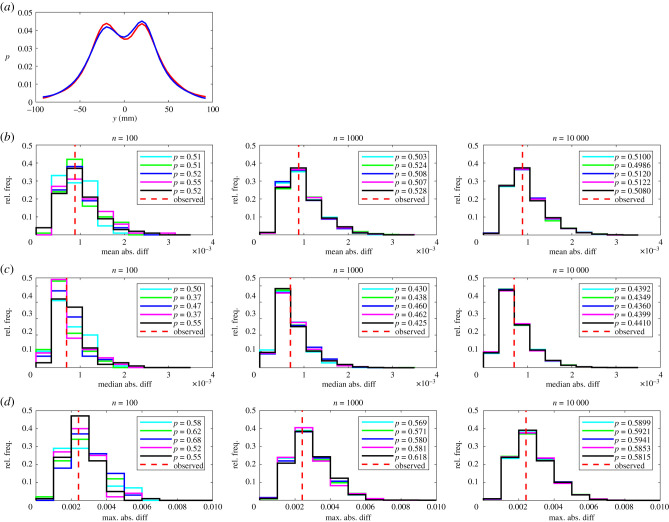
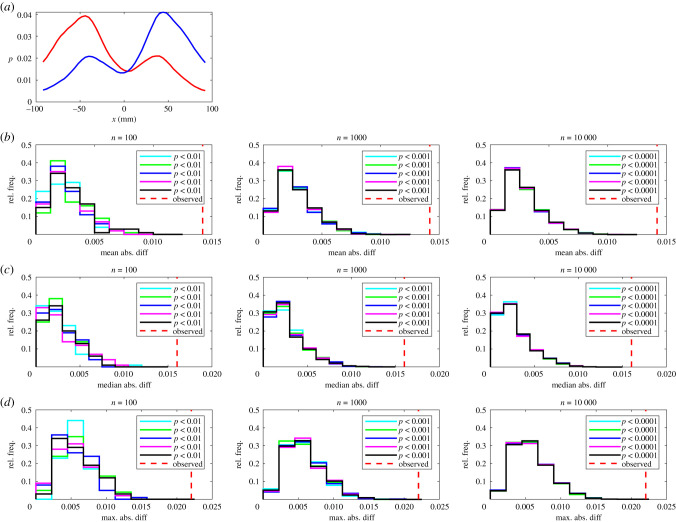
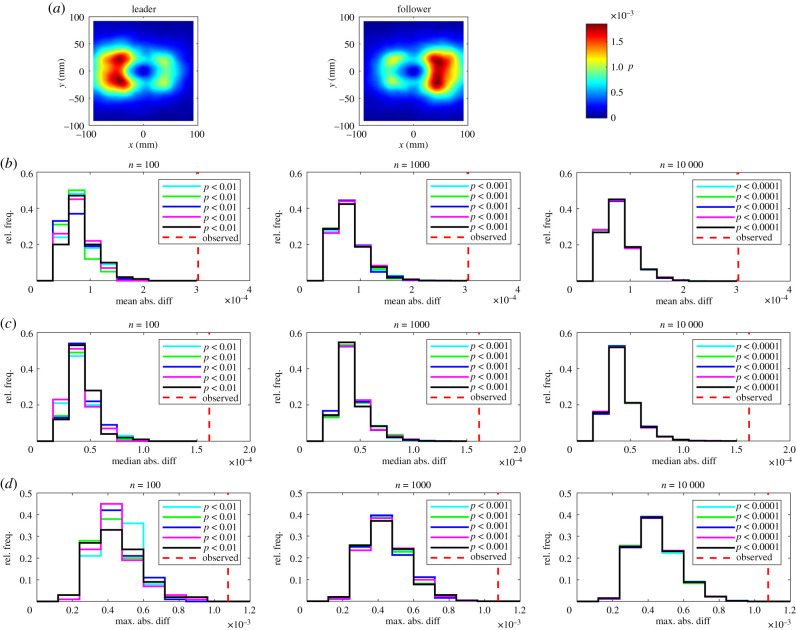
Over the domain of our plots partner fish tended to occupy regions to the front and back of focal individuals more frequently than to their sides (figures 1–3). There are also clear regions relatively rarely occupied by partners close to the focal individual in figure 3.
Figure 2.
(a) The relative frequency, p, that partners occupy given y-coordinates for leaders (red curve) and followers (blue curve). In this plot the focal individual is located at the origin, and is travelling parallel to the positive x-axis (out of the page, and towards the reader). Details of (b–d) are the same as those in figure 1.
Figure 1.
(a) The relative frequency, p, that partners occupy given x-coordinates for leaders (red curve) and followers (blue curve). In this plot the focal individual is located at the origin, and is travelling parallel to the positive x-axis (from left to right). (b–d) The results of randomization calculations based on mean (b), median (c), or maximum (d) absolute difference tests. The number of iterations, n, performed for each randomization test increases from left to right across the columns of this figure. Within each panel, histograms illustrate the distribution of randomized test statistics for each of five repeat tests (coloured histograms) for each form of test statistic and number of randomization iterations. A vertical dashed red line indicates the observed absolute difference between the fitted functions according to the chosen test statistic. P-values for each repeat test are tabulated in the legend of each panel.
Figure 3.
(a) The relative frequency, p, that partners occupy given (x, y) coordinates for leaders (left) and followers (centre). In these plots the focal individual is located at the origin, and is travelling parallel to the positive x-axis (from left to right). The colour scale on these plots is such that bluer regions correspond to lower densities, and redder regions correspond to greater densities. Details of (b–d) are the same as in figure 1.
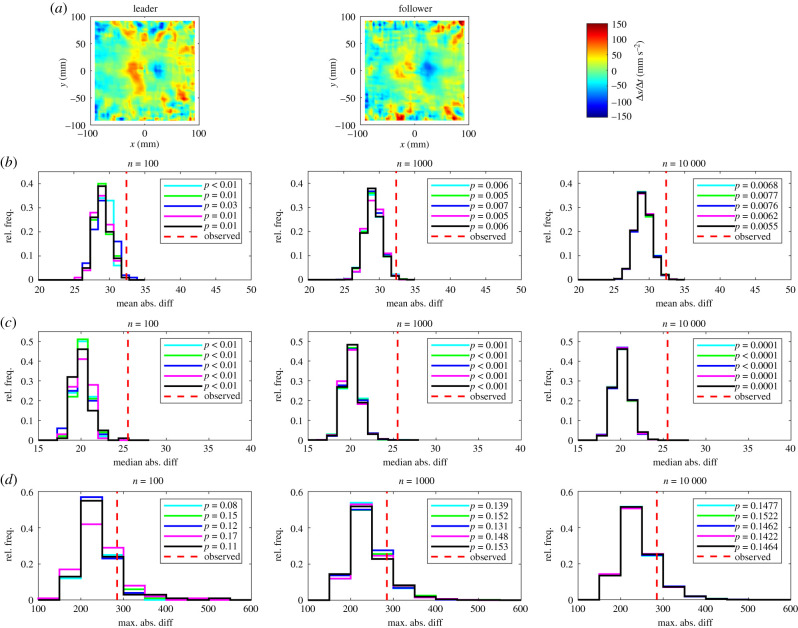
The fish in our observational set tended to speed up when their partners occupied a small region close to and behind them, and slow down when their partners were close to and in front of them (figures 4–6; the region where these effects are evident extends out to a distance of about 30–40 mm from the location of the focal individual). When partners were further away and behind, individuals tended to reduce their speed; when partners were further away, but to their front, then individuals tended to increase their speed. This behaviour is consistent with moderation of speed to avoid collisions at short range, so as not to be separated by too great a distance from partners, and was previously observed in [3]. The region over which speed moderated avoidance behaviour was observed coincided approximately with the region relatively rarely occupied by partners, close to the focal individual (figure 3).
Figure 4.
(a) The mean change in speed, , of leaders (red curve) and followers (blue curve). In this plot, the focal individual is located at the origin, and is travelling parallel to the positive x-axis (from left to right). Details of (b–d) are the same as in figure 1.
Figure 6.
(a) The mean change in speed, , of leaders (left) and followers (centre). In these plots, the focal individual is located at the origin, and is travelling parallel to the positive x-axis (from left to right). The colour scale on these plots is such that bluer regions correspond to decreases in speed, and redder regions correspond to increases in speed (right colour bar). Details of (b–d) are the same as in figure 1.
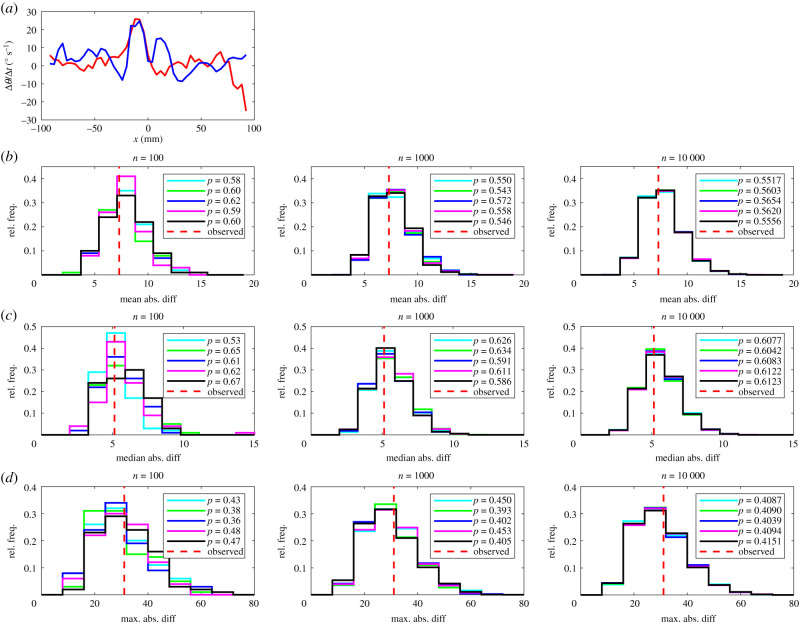
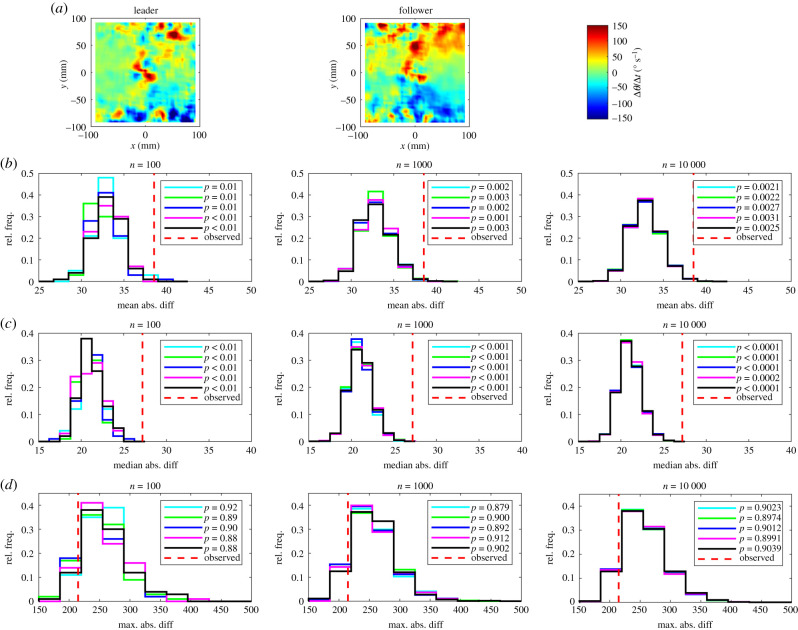
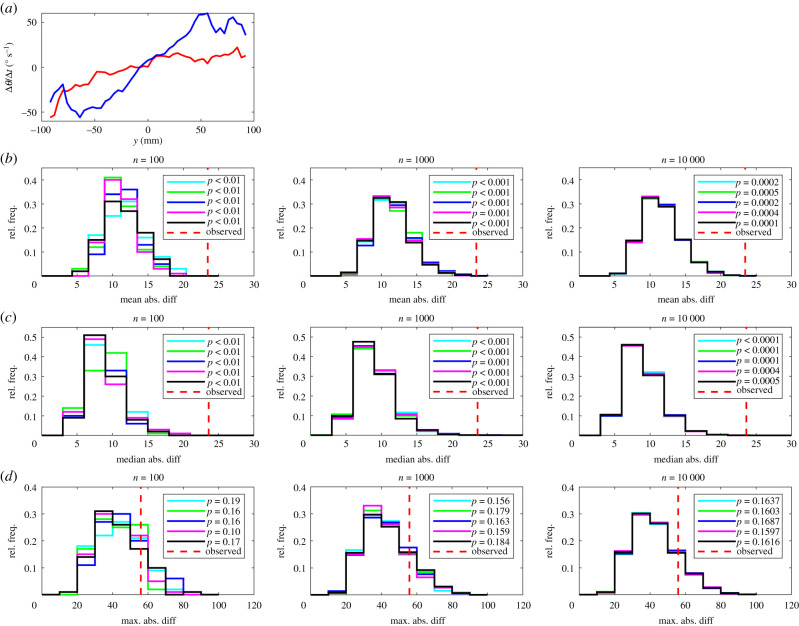
When partners were close to and in front of focal individuals (within approx. 30–40 mm), focal individuals tended to adjust their direction of motion to turn away from these partners (figures 7–9), consistent with short-range avoidance behaviour moderated via turning. When partners occupied the small region behind focal individuals, then focal individuals tended to turn towards, rather than away from, these partners—behaviour that is not consistent with simple short-range repulsion mechanisms used in model-based studies [10]. The overall short-range turning response revealed here was not fully resolved in the previous study of interaction rules used by eastern mosquitofish [3], perhaps because of the slightly coarser spatial resolution used in the previous study. Beyond the region extending out to about 30 mm from the focal individual, the mosquitofish tended to adjust their direction of motion to turn towards their partners (figures 8 and 9), consistent with [3].
Figure 7.
(a) The mean change in direction of motion, , of leaders (red curve) and followers (blue curve). In this plot, the focal individual is located at the origin, and is travelling parallel to the positive x-axis (from left to right). Positive changes in direction correspond to anticlockwise (or left) turns, and negative changes in direction correspond to clockwise (or right) turns. Details of (b–d) are the same as in figure 1.
Figure 9.
(a) The mean change in direction of motion, , of leaders (left) and followers (centre). In these plots, the focal individual is located at the origin, and is travelling parallel to the positive x-axis (from left to right). The colour scale on these plots is such that bluer regions correspond to clockwise (right) turns, and redder regions correspond to anticlockwise (left) turns (right colour bar). Details of (b–d) are the same as in figure 1.
Figure 8.
(a) The mean change in direction of motion, , of leaders (red curve) and followers (blue curve). In this plot, the focal individual is located at the origin, and is travelling parallel to the positive x-axis (out of the page, and towards the reader). Positive changes in direction correspond to anti-clockwise (or left) turns, and negative changes in direction correspond to clockwise (or right) turns. Details of (b–d) are the same as in figure 1.
The randomization tests identified significant differences between leaders and followers for nine measures across all five sets of randomizations with 100, 1000 and 10 000 iterations as detailed in table 1 and electronic supplementary material, table S3. The consistent identification of significant differences in the relative frequencies that partners occupied given x or (x, y) coordinates across all test statistics for all randomization realizations and values of n is internally consistent with the categorization of individuals based on the amount of time occupying the front or back of each pair.
Table 1.
Measures for which significant differences between leaders and followers were identified for all five repeat randomization tests with n = 100, n = 1000 and n = 10 000 for given test statistics. Here p is the relative frequency that partners occupied given relative coordinates, is the mean change in speed of individuals as a function of the relative coordinates of their partner and is the mean change in direction of individuals as a function of the relative coordinates of their partner.
| measure | test statistic(s) |
|---|---|
| p as a function of x | mean absolute difference, median absolute difference, maximum absolute difference |
| p as a function of (x, y) | mean absolute difference, median absolute difference, maximum absolute difference |
| as a function of x | mean absolute difference, median absolute difference |
| as a function of y | median absolute difference |
| as a function of (x, y) | mean absolute difference, median absolute difference |
| as a function of y | mean absolute difference, median absolute difference |
| as a function of (x, y) | mean absolute difference, median absolute difference |
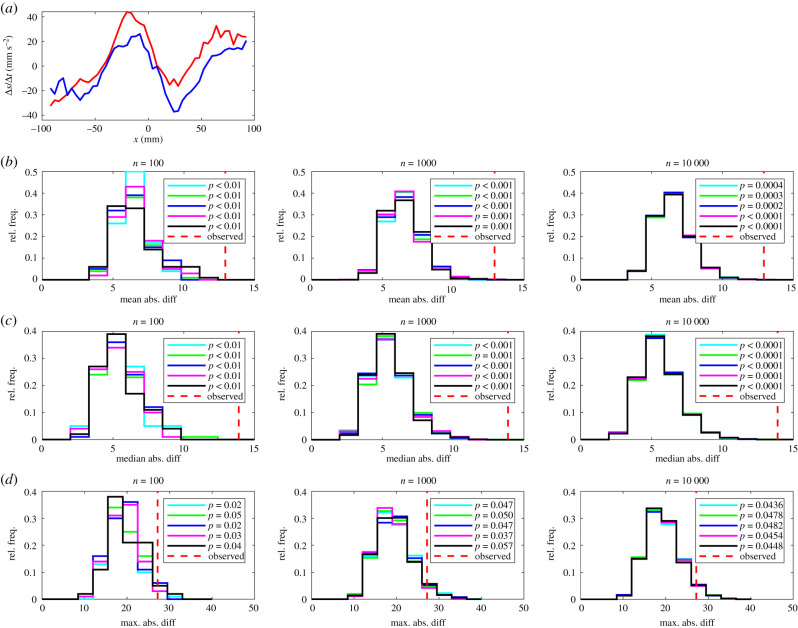
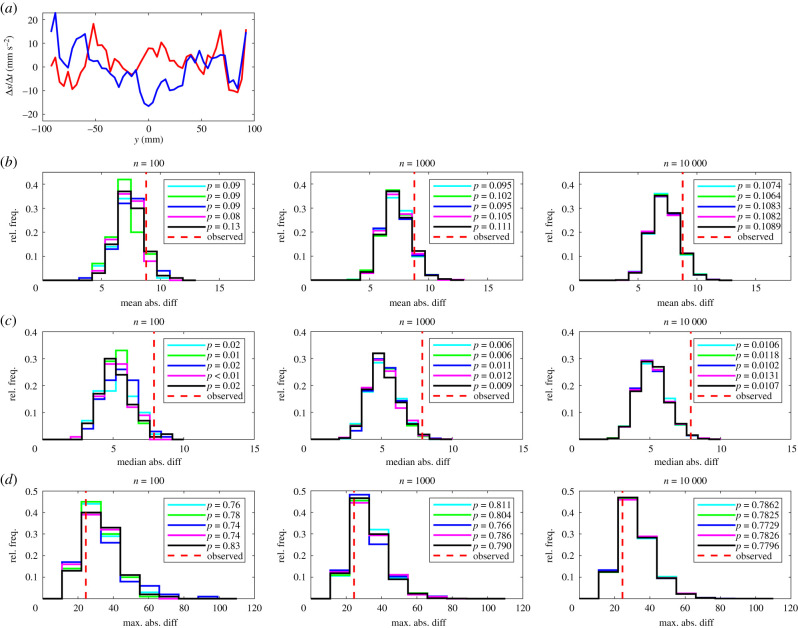
There was reasonably close agreement between p-values across sets of randomizations for each pairing of test statistic and n, and across different values of n, suggesting that tests based around each of the three test statistics are reliable. In most cases p-values all lay consistently above or below the 0.05 threshold for significance for a given test statistic and number of randomizations. However, some, but not all, repeats of the maximum absolute difference test for changes in speed as a function of x suggested significant differences for n = 100 iterations (four out of five cases) and n = 1000 iterations (three out of five cases), but this ambiguity was resolved with n = 10 000 iterations where all repeat tests suggested significant differences. Similar ambiguities for differences in speed as a function of x were also resolved when n was increased to 10 000 iterations (electronic supplementary material, table S4).
Visual disparities were evident in distributions of randomized test statistics for repeat test sets with n = 100 randomizations. These disparities diminished as n increased to 1000, and were negligible when n = 10 000 across all measures compared, for each of the mean, median and maximum absolute difference tests. There were very few instances where pairwise comparison of randomized test statistic distributions suggested that these distributions were drawn from different underlying distributions (see electronic supplementary material, table S5).
At the highest level of resolution (n = 10 000), the most conservative test was the maximum absolute difference test, which identified significant differences between leader and follower fish for four measures out of 14, including those detailed in the electronic supplementary material (mean change in speed as a function of x, the relative frequencies that partners occupied given x or (x, y) coordinates and the relative directions of motion of partners at given (x, y) coordinates). The mean absolute difference test identified significant differences between leaders and followers for nine measures with n = 10 000; in addition to the measures identified as significantly different by the maximum absolute difference test, these were the mean change in speed as a function of (x, y), the mean change in direction of motion as a function of y and as a function of (x, y), the mean speed as a function of x, and R (the focus of relative directions of motion of partners about the mean relative direction) as a function of (x, y). Least conservative was the median absolute difference test, which identified significant differences between leaders and followers across 10 measures, including the mean change in speed as a function of y, and all of the nine other measures determined as significantly different by the mean absolute difference test when n = 10 000.
In terms of the details of the significant differences other than those associated with the tendency to occupy the front or back of a pair, according to all three forms of randomization test, leaders adopted greater changes in speed than followers over the approximate partner range −75 < x < 100 mm (figure 4). As a consequence, leaders applied greater increases in speed when their partners were close to them and behind (approx. −50 < x < 0 mm), smaller decreases in speed when their partners were close to them and in front (approx. 10 < x < 40 mm) and greater increases in speed when partners were slightly further in front (for x > 40 mm, approx.).
Less conservatively, the mean and median absolute difference tests identified significant differences between leaders and followers in the mean change in speed as a function of (x, y), and the mean change in direction of motion as a function of y and as a function of (x, y). Consistent with inspection of the plots of the mean change in speed as a function of x, it seems that leaders exhibited greater changes in speed as a function of (x, y) when their partners occupied the domain where −50 < x < 50 mm, −50 < y < 50 mm, with an associated effect that leaders tended to exhibit larger magnitude increases in speed over a larger region where partners were close and behind them than followers (figure 6, redder regions of surface plots, directly behind the focal individual). In addition, the region over which leaders exhibited larger magnitude decreases in speed when partners were close and in front was smaller than that for followers (figure 6, comparing the darker blue regions directly in front of the focal individual). Outside the region directly in front of focal individuals where the individual tended to turn away from their partner (out to a distance of approx. 30 mm, figure 9), followers tended to exhibit greater speed turns towards their partners than leaders (figures 8 and 9), particularly those to their front (figure 9).
In addition, the median absolute difference test suggested that there were significant differences between leaders and followers in the mean change in speed of individuals as a function of y. The curves for both leaders and followers for this measure exhibit a lot of variation (figure 5), but one clear pattern is that leaders mostly tended to increase their speed when their partners were to their side over the approximate range −40 < y < 40 mm, whereas followers tended to reduce their speed when their partners occupied the same region to their sides.
Figure 5.
(a) The mean change in speed, , of leaders (red curve) and followers (blue curve). In this plot, the focal individual is located at the origin, and is travelling parallel to the positive x-axis (out of the page, and towards the reader). Details of (b–d) are the same as in figure 1.
4. Discussion
All three tests that we trialled, based on mean, median or maximum absolute differences between fitted functions, were largely self-consistent. These self-consistencies included generation of similar p-value estimates irrespective of the number of randomization iterations applied, broadly consistent identification of differences between fitted curves as being significantly different or not, and very few statistical differences between the distributions of randomization-generated test statistics.
The maximum absolute difference test was the most parsimonious of the three tests trialled here, identifying significant differences between leaders and followers for four measures (including those detailed in the electronic supplementary material). These measures included two that we had a reasonable expectation before we performed our calculations would be identified as different—the relative frequencies that individuals occupied given x-coordinates or (x, y) coordinates relative to a focal individual. This expectation was due to the position-based categorization of leaders and followers, and the fact that this expectation was met helps give some confidence that the randomization methods work sensibly. The mean absolute difference test identified significant differences across nine measures, with the least parsimonious of the tests being the median absolute difference test which identified 10 significant differences. Given that all three tests seem viable, and exhibit high levels of self-consistency, if only one test were to be applied, then, on the basis of parsimony, it might be reasonable to choose the mean absolute difference test, as it is neither the most nor the least giving of the three tests trialled, at least when applied to the data for this study. However, our study here does not resolve which test is best (if only a single test is to be used); such a question could be resolved via future work using simulation model-derived data where individuals are split into distinct categories with differing prescribed interaction rules, and the accuracy of each test in identifying these differences is scrutinized.
Another practical consideration is the number of randomization iterations required to reliably identify a significant difference. Calculations with 100 or 1000 iterations were sufficient for most of the cases examined here, except some instances where the estimated p-value was close to 0.05. These ambiguities were resolved when 10 000 randomization iterations were performed. A possible strategy for applying the randomization methods outside this study might be to perform a single set of 100 or 1000 randomizations per measure of interest, and then repeat with a larger number of iterations in cases where p is close to 0.05.
A potential issue with the tests that we have described in this work relates to non-equal sample sizes. Owing to the way that data are aggregated when fitting the types of functions examined in this work, if one category of individuals contributes substantially more data than the other to the overall pool of data, then the behaviour of this category could dominate the functions generated via randomization. In turn, this could make the differences between the functions fitted via randomization relatively small, and render any conclusions based on comparing the differences between real categories and random categories less meaningful. Thus, we think that the methods described here are likely to be most reliable when the categories of individuals to be compared provide roughly equal amounts of data. An option that could be investigated in terms of dealing with non-equal amounts of data could be sub-sampling smaller amounts of data from the category that dominates the data as part of the overall randomization procedure. We note that for this study equal amounts of data are provided from individuals classified as leaders and followers, but some groups provided relatively little data to the overall pool compared with others (see electronic supplementary material, tables S1 and S2) owing to the fact that not all pairs of mosquitofish stayed close to each other over the entire duration that they were filmed together. Thus, our overall results are likely to be more influenced by the behaviour of the pairs that stayed closely grouped for the longest durations throughout observations. Further issues that also should be investigated are the potential sensitivity of the analysis to the domain over which interactions are estimated (the domain was fixed at −100 ≤ x, y ≤ 100 mm for the case study here), and to the dimensions of the bins used during this estimation.
The methods described in this paper are specific to examining within-group differences, and could be of immediate use in examining differences in interaction rules from experimental data where the internal state of individuals has been manipulated. For example, multiple studies have established differences in basic measures of grouping and locomotion between hungry and satiated individuals within the same groups [29,30], and the analysis described here could be used to investigate further if such differences are correlated with significant differences in interaction rules. Allowing for a more nuanced perspective, individuals probably exhibit heterogeneity across more than just one measurable parameter [36]. Such parameters could include measures for boldness and the tendency to remain in close proximity to other group members [28], or measures of metabolic rates and critical sustained swimming speeds [45]. In the case that heterogeneity across more than one parameter is of interest, individuals could be associated with one of multiple natural categories, in a variant of the randomization schemes examined here, with pairwise comparisons made between all categories. An appropriate correction could then be made to significance thresholds to take into account such multiple pairwise comparisons. The randomization schemes can also be modified in a straightforward manner to examine differences across sets of differently treated groups as well, as was applied in [46]. The main alterations are to apply categorization at the level of the groups, rather than the individuals, first fitting and comparing functions based on treatment to obtain baseline reference statistics, and then randomly allocating entire groups to one of two categories to ultimately generate a distribution of randomized test statistics. Such alterations allow detection of significant differences in interaction rules, and related quantities in studies where the ecological context of entire groups is manipulated (or naturally different) [34].
A question about rules of interaction that is not necessarily answered directly by the analysis examined in this paper is if interactions identified as significantly different are biologically meaningful. A combination of experimental and analytical approaches will be needed to investigate this question further. Empirically, the identification of individuals that differ in their interactions from one another allows further experiments to test the functional significance of such traits. For example, do those types of individuals also differ in their ability to detect resources or avoid threats in their environment, and do these differences contribute to the survival and reproductive success of individuals? A further question is whether particular combinations of individuals with statistically different rules of interaction drive differences in group functioning at a collective level? Similar questions have been addressed in sticklebacks by assessing individual differences in sociability and activity [28]. If an across-group comparison of differently treated groups is made via the randomization methods described here, then measures of the emergent patterns of group motion can be examined in concert with interaction rules. These measures could include the statistical density or relative alignment of individuals relative to some reference point (a focal individual for local structure, or the group centroid for the whole group), and group order parameters, such as polarization and angular momentum [18]. Another approach, which seeks to establish a more causal relationship between observed interactions and group-level patterns of movement, is to use interactions inferred as part of the analysis as the basis for a generative model of collective motion. Equation-based interaction functions are a conceptually convenient basis for such a data-driven model [19,20,23–25,28]. However, functions fitted by the methods used in this paper, or the approach in [21], could also be used to construct such a model. In the context of an across-group comparison of behaviour, the relationship between differences in interaction rules and emergent patterns of movement could then be examined via simulation, with the accuracy of simulation results examined via direct comparison with experimentally observed group movement patterns.
With the above considerations in mind, our work reveals some potentially interesting differences in the way that mosquitofish that occupy the leadership position and their partners interact in terms of changes in velocity and the speed that they maintain with respect to the location of their partners. Leaders tended to adopt greater speeds than followers when their partners were behind them (see electronic supplementary material, §S6), and exhibited greater changes in speed than followers when pairs were separated by approximately 50 mm or less. In combination such behaviour seems consistent with leaders moving to take the front-most position, or to maintain this position once they have occupied it. Fish that occupied the rear of pairs most frequently exhibited avoidance behaviour moderated by changes in speed, especially reductions in speed, over a slightly larger domain than leaders, and tended to adjust their direction of motion more quickly to move towards partners to their side than leaders. Thus, according to these measures, followers seem more socially responsive to leaders than leaders are to followers in this context. At a group level, the prototype work for this study established that a functional outcome of the leader–follower relationship was that pairs travelled at greater median speeds when leaders occupied the front-most position of the pair versus when followers occupied these positions [37]. Diminished social responsiveness by leaders and heightened responsiveness of followers in leader–follower interactions have also been observed in other contexts, including the movement of threespine sticklebacks away from cover [47].
The methods described here allow the statistical identification of individuals with different rules of interaction within groups of freely moving animals. With the purported role of individual heterogeneity in groups driving group functioning, such methods may be applied to robustly test for the existence and importance of such heterogeneity in moving animal groups.
Acknowledgements
We thank Norman Gaywood for his management of the Turing computational system at the University of New England, which was vital for this work, Mary Myerscough and David Sumpter for their support of this project, and Jolle Jolles and Valentin Lecheval for their supportive and considered comments during the review process. Earlier versions of portions of this work are available at https://arxiv.org/abs/1601.08202.
Contributor Information
T. M. Schaerf, Email: tschaerf@une.edu.au.
J. E. Herbert-Read, Email: jh2223@cam.ac.uk.
Ethics
All procedures performed were in accordance with the ethical standards of the University of Sydney and were approved by the Animal Ethics Committee of the University of Sydney (ref no. L04/4-2012/3/5735).
Data accessibility
The datasets supporting this article form part of the electronic supplementary material.
Authors' contributions
T.M.S., J.E.H.-R. and A.J.W.W. conceived and designed the project; J.E.H.-R. and A.J.W.W. collected the data; T.M.S. analysed the data; T.M.S., J.E.H.-R. and A.J.W.W. wrote the paper.
Competing interests
We declare we have no competing interests.
Funding
This work was supported by Australian Research Council projects DP130101670, DP160103905 and DP190100660. J.E.H.-R. was supported by the Whitten Lectureship in Marine Biology, and Swedish Research Council grant no. 2018-04076.
References
- 1.Vicsek T, Zafiris A. 2012. Collective motion. Phys. Rep. 517, 71-140. ( 10.1016/j.physrep.2012.03.004) [DOI] [Google Scholar]
- 2.Ward AJW, Webster MM. 2016. Sociality: the behaviour of group-living animals. Berlin, Germany: Springer. [Google Scholar]
- 3.Herbert-Read JE, Perna A, Mann RP, Schaerf TM, Sumpter DJT, Ward AJW. 2011. Inferring the rules of interaction of shoaling fish. Proc. Natl Acad. Sci. USA 108, 18 726-18 731. ( 10.1073/pnas.1109355108) [DOI] [PMC free article] [PubMed] [Google Scholar]
- 4.Sakai S. 1973. A model for group structure and its behavior. Seibutsu Butsuri. 13, 82-90. ( 10.2142/biophys.13.82) [DOI] [Google Scholar]
- 5.Aoki I. 1982. A simulation study on the schooling mechanism in fish. Bull. Jap. Soc. Sci. Fish. 48, 1081-1088. ( 10.2331/suisan.48.1081) [DOI] [Google Scholar]
- 6.Reynolds CW. 1987. Flocks, herds, and schools: a distributed behavioral model. Comput. Graph. 21, 25-34. ( 10.1145/37402.37406) [DOI] [Google Scholar]
- 7.Vicsek T, Czirók A, Ben-Jacob E, Cohen I, Shochet O. 1995. Novel type of phase-transition in a system of self-driven particles. Phys. Rev. Lett. 75, 1226-1229. ( 10.1103/PhysRevLett.75.1226) [DOI] [PubMed] [Google Scholar]
- 8.Helbing D, Molnar P. 1995. Social force model for pedestrian dynamics. Phys. Rev. E 51, 4282-4286. ( 10.1103/PhysRevE.51.4282) [DOI] [PubMed] [Google Scholar]
- 9.D'Orsogna MR, Chuang YL, Bertozzi AL, Chayes LS. 2006. Self-propelled particles with soft-core interactions: patterns, stability, and collapse. Phys. Rev. Lett. 96, 104302. ( 10.1103/PhysRevLett.96.104302) [DOI] [PubMed] [Google Scholar]
- 10.Couzin ID, Krause J, James R, Ruxton GD, Franks NR. 2002. Collective memory and spatial sorting in animal groups. J. Theor. Biol. 218, 1-11. ( 10.1006/jtbi.2002.3065) [DOI] [PubMed] [Google Scholar]
- 11.Ballerini M, et al. 2008. Interaction ruling animal collective behavior depends on topological rather than metric distance: evidence from a field study. Proc. Natl Acad. Sci. USA 105, 1232-1237. ( 10.1073/pnas.0711437105) [DOI] [PMC free article] [PubMed] [Google Scholar]
- 12.Nagy M, Àkos Z, Biro D, Vicsek T. 2010. Hierarchical group dynamics in pigeon flocks. Nature 464, 890. ( 10.1038/nature08891) [DOI] [PubMed] [Google Scholar]
- 13.Lukeman R, Li YX, Edelstein-Keshet L. 2010. Inferring individual rules from collective behavior. Proc. Natl Acad. Sci. USA 107, 12 576-12 580. ( 10.1073/pnas.1001763107) [DOI] [PMC free article] [PubMed] [Google Scholar]
- 14.Eriksson A, Jacobi MN, Nyström J, Tunstrøm K. 2010. Determining interaction rules in animal swarms. Behav. Ecol. 21, 1106-1111. ( 10.1093/beheco/arq118) [DOI] [Google Scholar]
- 15.Eriksson A, Jacobi MN, Nyström J, Tunstrøm K. 2009. A method for estimating the interactions in dissipative particle dynamics from particle trajectories. J. Phys. Condens. Matter. 21, 095401. ( 10.1088/0953-8984/21/9/095401) [DOI] [PubMed] [Google Scholar]
- 16.Katz Y, Tunstrøm K, Ioannou CC, Huepe C, Couzin ID. 2011. Inferring the structure and dynamics of interactions in schooling fish. Proc. Natl Acad. Sci. USA 108, 18 720-18 725. ( 10.1073/pnas.1107583108) [DOI] [PMC free article] [PubMed] [Google Scholar]
- 17.Strandburg-Peshkin A, et al. 2013. Visual sensory networks and effective information transfer in animal groups. Curr. Biol. 23, R709-R711. ( 10.1016/j.cub.2013.07.059) [DOI] [PMC free article] [PubMed] [Google Scholar]
- 18.Tunstrøm K, Katz Y, Ioannou CC, Huepe C, Lutz MJ, Couzin ID. 2013. Collective states, multistability and transitional behavior in schooling fish. PLoS Comput. Biol. 9, e1002915. ( 10.1371/journal.pcbi.1002915) [DOI] [PMC free article] [PubMed] [Google Scholar]
- 19.Calovi DS, Litchinko A, Lecheval V, Lopez U, Pérez Escudero A, Chaté H, Sire C, Theraulaz G, Cavagna A. 2018. Disentangling and modeling interactions in fish with burst-and-coast swimming reveal distinct alignment and attraction behaviors. PLoS Comput. Biol. 14, e1005933. ( 10.1371/journal.pcbi.1005933) [DOI] [PMC free article] [PubMed] [Google Scholar]
- 20.Escobedo R, Lecheval V, Papaspyros V, Bonnet F, Mondada F, Sire C, Theraulaz G. 2020. A data-driven method for reconstructing and modelling social interactions in moving animal groups. Phil. Trans. R. Soc. B 375, 20190380. ( 10.1098/rstb.2019.0380) [DOI] [PMC free article] [PubMed] [Google Scholar]
- 21.Heras FJH, Romero-Ferrero F, Hinz RC, de Polavieja GG. 2019. Deep attention networks reveal the rules of collective motion in zebrafish. PLoS Comput. Biol. 15, e1007354. ( 10.1371/journal.pcbi.1007354) [DOI] [PMC free article] [PubMed] [Google Scholar]
- 22.Mizumoto N, Miyata S, Pratt SC. 2019. Inferring collective behaviour from a fossilized fish shoal. Proc. R. Soc. B 286, 20190891. ( 10.1098/rspb.2019.0891) [DOI] [PMC free article] [PubMed] [Google Scholar]
- 23.Gautrais J, Ginelli F, Fournier R, Blanco S, Soria M, Chate H, Theraulaz G. 2012. Deciphering interactions in moving animal groups. PLoS Comput. Biol. 8, e1002678. ( 10.1371/journal.pcbi.1002678) [DOI] [PMC free article] [PubMed] [Google Scholar]
- 24.Zienkiewicz A, Barton DAW, Porfiri M, Bernardo MD. 2015. Data-driven stochastic modelling of zebrafish locomotion. J. Math. Biol. 71, 1081-1105. ( 10.1007/s00285-014-0843-2) [DOI] [PMC free article] [PubMed] [Google Scholar]
- 25.Zienkiewicz AK, Ladu F, Barton DAW, Porfiri M, Bernardo MD. 2018. Data-driven modelling of social forces and collective behaviour in zebrafish. J. Theor. Biol. 443, 39-51. ( 10.1016/j.jtbi.2018.01.011) [DOI] [PubMed] [Google Scholar]
- 26.Herbert-Read JE, Krause S, Morrell LJ, Schaerf TM, Krause J, Ward AJW. 2013. The role of individuality in collective group movement. Proc. R. Soc. B 280, 20122564. ( 10.1098/rspb.2012.2564) [DOI] [PMC free article] [PubMed] [Google Scholar]
- 27.Romey WL. 1996. Individual differences make a difference in the trajectories of simulated fish schools. Ecol. Model. 92, 65-77. ( 10.1016/0304-3800(95)00202-2) [DOI] [Google Scholar]
- 28.Jolles JW, Boogert NJ, Sridhar VH, Couzin ID, Manica A. 2017. Consistent individual differences drive collective behavior and group functioning of schooling fish. Curr. Biol. 27, 2862-2868. ( 10.1016/j.cub.2017.08.004) [DOI] [PMC free article] [PubMed] [Google Scholar]
- 29.Hansen MJ, Schaerf TM, Ward AJ. 2015. The effect of hunger on the exploratory behaviour of shoals of mosquitofish Gambusia holbrooki. Behaviour 152, 1659-1677. ( 10.1163/1568539X-00003298) [DOI] [Google Scholar]
- 30.Hansen MJ, Schaerf TM, Ward AJW. 2015. The influence of nutritional state on individual and group movement behaviour in shoals of crimson-spotted rainbowfish (Melanotaenia duboulayi). Behav. Ecol. Sociobiol. 69, 1713-1722. ( 10.1007/s00265-015-1983-0) [DOI] [Google Scholar]
- 31.Beekman M, Fathke RL, Seeley TD. 2006. How does an informed minority of scouts guide a honeybee swarm as it flies to its new home? Anim. Behav. 71, 161-171. ( 10.1016/j.anbehav.2005.04.009) [DOI] [Google Scholar]
- 32.Schultz KM, Passino KM, Seeley TD. 2008. The mechanism of flight guidance in honeybee swarms: subtle guides or streaker bees? J. Exp. Biol. 211, 3287-3295. ( 10.1242/jeb.018994) [DOI] [PubMed] [Google Scholar]
- 33.Hoare DJ, Couzin ID, Godin JGJ, Krause J. 2004. Context-dependent group size choice in fish. Anim. Behav. 67, 155-164. ( 10.1016/j.anbehav.2003.04.004) [DOI] [Google Scholar]
- 34.Schaerf TM, Dillingham PW, Ward AJW. 2017. The effects of external cues on individual and collective behavior of shoaling fish. Sci. Adv. 3, e1603201. ( 10.1126/sciadv.1603201) [DOI] [PMC free article] [PubMed] [Google Scholar]
- 35.Ward AJW, Schaerf TM, Burns ALJ, Lizier JT, Crosato E, Prokopenko M, Webster MM. 2018. Cohesion, order and information flow in the collective motion of mixed-species shoals. R. Soc. open sci. 5, 181132. ( 10.1098/rsos.181132) [DOI] [PMC free article] [PubMed] [Google Scholar]
- 36.Jolles JW, King AJ, Killen SS. 2020. The role of individual heterogeneity in collective animal behaviour. Trends Ecol. Evol. 35, 278-291. ( 10.1016/j.tree.2019.11.001) [DOI] [PubMed] [Google Scholar]
- 37.Schaerf TM, Herbert-Read JE, Myerscough MR, Sumpter DJT, Ward AJW. 2016. Identifying differences in the rules of interaction between individuals in moving animal groups. (http://arxiv.org/abs/160108202)
- 38.Harpaz R, Tkačik G, Schneidman E. 2017. Discrete modes of social information processing predict individual behavior of fish in a group. Proc. Natl Acad. Sci. USA 114, 10 149-10 154. ( 10.1073/pnas.1703817114) [DOI] [PMC free article] [PubMed] [Google Scholar]
- 39.Pearson K. 1900. On the criterion that a given system of deviations from the probable in the case of a correlated system of variables is such that it can be reasonably supposed to have arisen from random sampling. Philos. Mag. 50, 157-175. ( 10.1080/14786440009463897) [DOI] [Google Scholar]
- 40.Kolmogoroff A. 1933. Sulla determinazione empirica di une legge di distribuzione. Giornale dell'Istituto Italiano degli Attuari. 4, 83-91. [Google Scholar]
- 41.Kolmogoroff A. 1941. Limits for an unknown distribution function. Ann. Math. Stat. 12, 461-463. ( 10.1214/aoms/1177731684) [DOI] [Google Scholar]
- 42.Smirnoff N. 1939. On the estimation of the discrepancy between empirical curves of distribution for two independent samples. Bulletin de l'Universite de Moscou, Serie internationale (Mathematiques). 2, 3-14. [Google Scholar]
- 43.Mudaliar RK, Schaerf TM. 2020. Examination of an averaging method for estimating repulsion and attraction interactions in moving groups. PLoS ONE 15, e0243631. ( 10.1371/journal.pone.0243631) [DOI] [PMC free article] [PubMed] [Google Scholar]
- 44.Holm S. 1979. A simple sequentially rejective multiple test procedure. Scand. J. Stat. 6, 65-70. [Google Scholar]
- 45.Ward AJW, Herbert-Read JE, Schaerf TM, Seebacher F. 2018. The physiology of leadership in fish shoals: leaders have lower maximal metabolic rates and lower aerobic scope. J. Zool. 305, 73-81. ( 10.1111/jzo.12534) [DOI] [Google Scholar]
- 46.Encel SA, Schaerf TM, Lizier JT, Ward AJW. 2021. Locomotion, interactions and information transfer vary according to context in a cryptic fish species. Behav. Ecol. Sociobiol. 75, 19. ( 10.1007/s00265-020-02930-0) [DOI] [Google Scholar]
- 47.Harcourt JL, Ang TZ, Sweetman G, Johnstone RA, Manica A. 2009. Social feedback and the emergence of leaders and followers. Curr. Biol. 19, 248-252. ( 10.1016/j.cub.2008.12.051) [DOI] [PubMed] [Google Scholar]
Associated Data
This section collects any data citations, data availability statements, or supplementary materials included in this article.
Data Availability Statement
The datasets supporting this article form part of the electronic supplementary material.


