

Abstract
Background
Adherence to healthy lifestyles/behaviours promotes healthy ageing. However, little is known about whether age, sex and/or race/ethnicity moderate associations of lifestyle/behavioural factors with relative telomere length (RTL), a potential biomarker of ageing.
Methods
We included 749 midlife to older non-Hispanic White (n = 254), Black (n = 248) and Hispanic (n = 247) US participants [mean (standard deviation) age = 69.3 (7.2) years; women: 50.5%]. We extracted genomic DNA from peripheral leucocytes. RTL was assayed using real-time quantitative polymerase chain reaction. Multivariable regression was used to examine associations between lifestyle/behavioural exposures (i.e. physical activity, alcohol consumption, smoking and depression) with RTL.
Results
Increasing chronological age was associated with shorter RTL (P < 0.01). Higher physical activity was associated with longer RTL (P-trend = 0.03); daily versus never/rare alcohol consumption and 30+ versus <5 smoking pack-year were associated with shorter RTLs (P-trend = 0.02). Associations varied significantly by sex and race/ethnicity. The association between physical activity and longer RTL appeared strongest among non-Hispanic Whites (P-interaction = 0.01). Compared to men, women had stronger associations between heavy smoking and shorter RTLs (P-interaction = 0.03). Light/moderate alcohol consumption (monthly/weekly) was associated with longer RTL among non-Hispanic Whites, while daily consumption was related to shorter RTLs among Blacks and Hispanics (P-interactions < 0.01). Associations of daily alcohol and heavy smoking with shorter RTLs were particularly apparent among Black women.
Conclusion
We observed novel variations by sex and race/ethnicity in associations between lifestyle/behavioural factors and RTL. Further work is needed to replicate these findings and to address potential public health implications for modifying strategies by sex or across racial/ethnic groups to optimise lifestyles/behaviours for healthy ageing.
Keywords: telomere length, biomarker, older people, health disparities, race/ethnicity
Key points
Higher physical activity was related to longer telomeres, while higher alcohol and smoking use were related to shorter telomeres.
Race/ethnicity and sex influence the strength and direction of associations of lifestyle/behavioural factors and telomere length.
Association of higher physical activity and longer telomeres was stronger among non-Hispanic Whites compared to minority groups.
Associations of daily alcohol consumption and shorter telomeres were strongest among Black and Hispanic women.
The association of heavy smoking and shorter telomeres was strongest among Black women.
Introduction
Telomeres, repetitive DNA sequences (TTAGGG) at the end of chromosomes, are essential for genome stability during cell division [1]. Telomere length (TL) is considered a potential biological ageing marker due to its established role in cellular ageing and apoptosis. Inflammation, oxidative stress and/or DNA damage mechanisms may accelerate age-associated telomere shortening. Modifiable lifestyle/behavioural factors may differentially influence such sources of telomere shortening and, thus, affect health and lifespan [2].
Physical activity may have a protective influence on TL by reducing inflammation and oxidative stress [3, 4]. However, associations between physical activity and TL have been mixed, with reports of positive [5–9], inverted ‘U’ [10, 11] or null associations [12, 13]. Furthermore, few studies evaluated associations between types of physical activity (including low-to-intermediate intensity exercise) and TL [6, 14]. The relation of alcohol to health outcomes appears U−/J-shaped. While moderate alcohol consumption has been associated with lower risk of cardiovascular disease (CVD) and overall mortality, adverse outcomes are observed with heavy alcohol consumption [15, 16]. TL is an emerging quantitative biomarker of health in ageing, and shorter TL is linked to increased mortality [17, 18]. Thus, it can be hypothesised that light/moderate alcohol consumption may be associated with longer TL, while heavy alcohol consumption may be related to shorter TL. However, studies on relations of alcohol to TL have been inconclusive [19–21]. Smoking may be related to cellular damage and, thus, telomere shortening [22]. Some, [23–25] but not all [26, 27] studies have found that higher smoking is associated with shorter telomeres. Finally, evidence suggests that poor behavioural health, including depression, is associated with telomere shortening [28, 29].
Little is known about whether associations of lifestyle/behavioural factors with TL differ by sex and/or race/ethnicity. Evidence suggests that Blacks and Hispanics compared to non-Hispanic Whites experience accelerated age-associated telomere shortening [30]. Furthermore, minority versus non-Hispanic Whites may have higher prevalence of unhealthy lifestyle/behavioural factors (e.g. physical inactivity, higher depression burden) that may influence TL [31, 32]. Potential variations in risk factor-biological ageing associations may provide an important explanatory link in understanding racial/ethnic disparities [33].
We hypothesised that unhealthy lifestyle/behavioural factors (i.e. physical inactivity, heavy alcohol and smoking use and depression) would be associated with shorter telomeres, and that light/moderate alcohol consumption would be associated with longer telomeres compared to either no or heavy consumption, among ~800 midlife and older adults. Further, we addressed potential variations in associations by age, sex and/or race/ethnicity.
Methods
Study participants
Participants were from VITAL-DEP (VITamin D and OmegA-3 TriaL-Depression Endpoint Prevention, NCT01696435) [34], a late-life depression prevention ancillary study to the VITAL (NCT01169259) trial [35, 36]. VITAL consists of 25,871 men and women, aged 50+ and 55+ years, respectively, in a 2 × 2 factorial randomised trial of cancer and CVD prevention using vitamin D3 and/or marine omega-3 supplementation; thus, all participants were free of heart disease or cancer at baseline. Additional VITAL-DEP eligibility criteria are provided elsewhere (Appendix 1). VITAL included 70% non-Hispanic white participants and 30% were members of racial/ethnic minority groups (i.e. Black, Hispanic, Asian and other, multiple or unspecified), as described elsewhere [35, 36].
Sample selection
In VITAL, Black and Hispanic adults were younger at baseline, reflecting earlier onset of CVD morbidity and mortality in these groups [37–39]. Thus, we used age-stratified sampling to select 800 VITAL-DEP participants with comparable age distributions, by 10-year age groups between 50 and 100, across racial/ethnic groups. To increase power to address racial/ethnic differences, participants were randomly selected within age strata so that one-third of the sample was non-Hispanic White, one-third was Black, and one-third was Hispanic; sex was balanced across groups. Participants with ≥1 microgram of genomic DNA were included. We excluded participants with missing relative telomere length (RTL) data (n = 8) or self-reported information on lifestyle/behavioural factors (n = 43) (Appendix 1). Excluded (n = 51) versus included (n = 749) participants were similar with regard to key characteristics: e.g. mean RTL (0.4 in both groups) and mean body mass index (BMI) (28 kg/m2 in both groups).
Assessment of physical activity
Physical activity was ascertained using a validated questionnaire method [40]. Participants reported average hours/week engaged in specific recreational activities and daily number of climbed stairs. Each activity was assigned a metabolic equivalent task (MET) value [41]. Total amount of physical activity was calculated by summing MET-hours/week from all recreational activities and climbing stairs. Based on its distribution, MET-hours/week was categorised into: 0–4.99, 5–29.99, and 30+ MET-hours/week. Frequency of physical activity was categorised into <1, 1 to <3.5, 3.5 to <7 and 7+ hours/week. Types of physical activity included low-to-intermediate (walking, weightlifting, yoga/stretching/toning, bicycling) and vigorous intensity (running, jogging, lap swimming, tennis, intense aerobics) activities. Regarding validity of self-reported physical activity in our sample, we observed an inverse correlation between BMI and physical activity (Spearman rho (ρ) = −0.28, P < 0.001).
Assessment of alcohol and smoking consumption
Alcohol consumption and cigarette smoking were ascertained via questionnaires. Alcohol consumption was categorised by frequency: rare/never, monthly, weekly and daily. Cumulative smoking exposure was summarised as pack-years and categorised into three groups: 0–4.99, 5–29.99 and 30+ pack-years; smoking was also categorised as never, past, or current.
Assessment and measures of depression
In VITAL-DEP, depression status was characterised by presence of current symptoms, diagnosis and/or treatment of depression [34]. Current depressive symptoms were ascertained via annual questionnaires using the Patient Health Questionnaire-8 (PHQ-8), which has clinical validity for identifying depression [42,43] and is well-validated among diverse samples of older adults [44, 45]. Participants also reported on past history of depression.
Ascertainment of covariates
Demographic characteristics included age (years), sex (men/women), race/ethnicity (non-Hispanic White, Black, Hispanic), education (<high school, high school diploma, attended/graduated from college, post-graduate) and income (<$15,000, $15,000–49,999, $50,000–89,999, $90,000–120,000, >$120,000). Lifestyle and health factors included BMI (18.5–24.99, 25–29.99, ≥30 kg/m2) and self-reported history of hypertension, diabetes, current use of cholesterol-lowering medications and multivitamin use.
RTL assay
Details on RTL assay methods and quality control (QC) procedures are provided elsewhere [46]. Briefly, genomic DNA was extracted from peripheral blood leukocytes and RTL was measured using quantitative real-time polymerase chain reaction. Average RTL was calculated as the exponentiated T/S ratio, defined as a Telomere repeat copy number to Single gene (36B4) copy number (T/S) corrected for a reference sample [47]. QC samples were interspersed across plates along with participants’ samples and were run in triplicates to assess inter- and intra-assay reliability; the average coefficient of variation (CV) for the exponentiated T/S ratio was 6.6%.
Statistical analysis
Participants’ characteristics were compared across racial/ethnic groups. Further, we evaluated the relationships of age, sex and race/ethnicity with RTL. We used multivariable linear regression analyses to estimate associations of physical activity, smoking, alcohol consumption and depression measures with RTL. Total physical activity was included as either a continuous (standardised z-score) or categorical variable. We computed mean-centred PHQ-8 score, categorised history of depression as a binary variable (yes/no), and used an interaction term to estimate combined effects of current depressive symptoms (PHQ-8) and history of depression; main effects were interpreted when the indicator term for the interaction was zero. Trend tests were used to assess linear relationships between lifestyle/behavioural exposures and RTL, and we used the linear step-up method of Benjamini and Hochberg for multiple hypothesis testing [48]. Separately, we ran multiplicative interaction tests to assess effect modification by age, sex and race/ethnicity of the primary associations, and also conducted stratified analyses.
For all analyses, education and income were coded as binary variables (<post-graduate versus post-graduate; <$50,000 versus ≥$50,000); BMI < 18.5 kg/m2 was considered missing. Regression models were initially adjusted for age and sex (model 1), and additionally adjusted for race/ethnicity, education, income, BMI, physical activity, alcohol, smoking, and depression measures, including main and interaction effects of current depressive symptoms and past-history of depression (model 2). A final model further adjusted for health-related variables as described above (model 3). Mean differences in RTLs, with 95% confidence intervals (CI), were calculated. Because smoking may reduce exercise capacity and affect participation in physical activity, [49] we explored in a sensitivity analysis whether associations between physical activity and RTL were stronger among participants with never-smoking or past-smoking rather than current-smoking status.
All analyses were performed using SAS version 9.4 (SAS, Cary, NC) and R 3.2.2. Two-tailed P < 0.05 was considered statistically significant. False discovery rate (FDR) is the expected proportion of Type-I errors (false positives) in null hypothesis testing when performing multiple comparisons; FDR < 0.05 was the significance cut-off used for multiple-hypothesis testing. The study was approved by the Institutional Review Board at Partners HealthCare-Brigham and Women’s Hospital.
Results
Table 1 shows participant characteristics by racial/ethnic group. Black participants had lower physical activity levels than other groups. Minorities were less likely to consume daily alcohol or to have a heavy smoking history, compared to non-Hispanic Whites. There were no differences by race/ethnicity in current depressive symptoms (measured as PHQ-8 score). Compared to non-Hispanic Whites, minority adults had higher BMI and medical comorbidity, and lower income and post-graduate education levels. RTL was inversely correlated with age (ρ = −0.12, P < 0.01). After multivariable adjustment, age was significantly associated with shorter RTL (β = −0.02, P < 0.01), but there were no significant associations of sex or race/ethnicity with RTL. Approximately 25% of participants reported 30+ MET-hours/week (men reported higher physical activity than women [median (IQR): 18.4 (6.1–38.7) versus 12.7 (3.0–27.9)]).
Table 1.
Baseline characteristics of study sample by race/ethnicity groups*
| Characteristic | Full samplea | Non-Hispanic White | Black | Hispanic |
|---|---|---|---|---|
| (n = 749) | (n = 254) | (n = 248) | (n = 247) | |
| Age in years, mean (SD) | 69.3 (7.2) | 69.9 (7.0) | 68.6 (7.6) | 69.5 (6.8) |
| Women, % | 49.0 | 53.2 | 52.0 | 41.7 |
| Post-graduate education, % | 42.1 | 53.0 | 38.7 | 34.4 |
| Income ≥50,000 per year, % | 62.8 | 74.8 | 54.7 | 58.5 |
| BMI in kg/m2, mean (SD) | 28.2 (5.4) | 26.7 (4.4) | 29.6 (6.2) | 28.3 (5.3) |
| Physical activity, MET-hours/week, median (IQR)b | 15.7 (4.4–31.8) | 17.9 (6.5–31.5) | 10.9 (3.1–27.7) | 18.1 (4.0–40.6) |
| Frequency of physical activityc, hours/week, % | ||||
| <1 | 25.0 | 18.5 | 30.7 | 25.9 |
| 1 to <3.5 | 22.8 | 25.6 | 25.8 | 17.0 |
| 3.5 to <7 | 22.0 | 28.4 | 16.5 | 21.1 |
| 7+ | 30.2 | 27.6 | 27.0 | 36.0 |
| Low-intermediate intensity physical activityd in hours/week, % | ||||
| < 0.75 | 24.6 | 17.7 | 29.4 | 26.7 |
| 0.75 to <2 | 17.5 | 19.3 | 22.2 | 10.9 |
| 2 to <5 | 20.7 | 23.2 | 16.5 | 22.3 |
| 5+ | 37.3 | 39.8 | 31.9 | 40.1 |
| Vigorous intensity physical activitye in hours/week, % | ||||
| <0.5 | 62.4 | 62.6 | 63.7 | 60.7 |
| 0.5 to <1.5 | 14.4 | 13.8 | 15.3 | 14.2 |
| 1.5 to <3 | 13.9 | 15.0 | 14.5 | 12.2 |
| 3+ | 9.4 | 8.7 | 6.5 | 13.0 |
| Cigarette smoking, in smoking pack-years,f % | ||||
| Never/minimal cigarette smokers (0.00–4.99) | 68.5 | 69.3 | 63.7 | 72.5 |
| Moderate cigarette smokers (5.00–29.99) | 23.8 | 22.4 | 28.2 | 20.7 |
| Heavy cigarette smokers (30+) | 7.7 | 8.3 | 8.1 | 6.9 |
| Alcohol consumption, % | ||||
| Rare/never | 33.1 | 22.8 | 43.6 | 33.2 |
| Monthly | 8.3 | 5.1 | 10.5 | 9.3 |
| Weekly | 37.8 | 43.7 | 34.7 | 34.4 |
| Daily | 21.0 | 28.4 | 11.3 | 23.1 |
| Multivitamin use, % | 43.0 | 45.7 | 40.8 | 42.5 |
| Hypertension, % | 55.3 | 45.8 | 70.2 | 50.0 |
| Diabetes, % | 18.8 | 12.6 | 23.8 | 20.2 |
| High cholesterol, % | 38.4 | 39.7 | 35.8 | 39.8 |
| PHQ-8 score, median (IQR) | 0.0 (0.0–2.0) | 0.0 (0.0–2.0) | 0.0 (0.0–2.0) | 0.0 (0.0–1.0) |
| Past, but not current, history of diagnosed depression, % | 8.3 | 8.7 | 8.5 | 7.7 |
| Relative telomere length (T/S ratio), mean (SD) | 0.42 (0.13) | 0.41 (0.12) | 0.44 (0.14) | 0.42 (0.13) |
Abbreviation: SD, standard deviation; IQR, interquartile range; T/S: exponentiated telomere/single gene ratio
*Figures for percentages may not add to 100.0 due to rounding.
aFor normally distributed continuous variables, this column contains mean (standard deviation) for non-missing responses. For non-normally distributed continuous variables, this column contains median (interquartile range) and percentages for categorical variables.
bTotal physical activity was based on MET-hours per week in the leisure time recreational activities: walking, jogging, running, bicycling, intense aerobic exercise, lower intensity exercise: yoga/stretching/toning, tennis, lap swimming, weight lifting, other exercise and reported number of flights of stairs climbed daily.
cFrequency of physical activity includes the amount of all recreational activities per week (hours/week).
dLow to intermediate intensity physical activity includes walking, weightlifting, yoga, stretching, toning, bicycling.
eVigorous intensity physical activity includes running, jogging, lap swimming, tennis, intense aerobics.
fCigarette smoking was measured as smoking pack-years [(average cigarettes per day/20)*total years smoked]. Never smokers were considered as having zero smoking pack-years.
Table 2 shows results for associations between physical activity and RTL. There was a significant positive association between total amount of physical activity and RTL (P-trend = 0.03); compared to those with low physical activity (<5 MET-hours/week), those with high physical activity (30+ MET-hours/week) had significantly longer telomeres. When we examined physical activity-RTL associations using frequency of physical activity, regardless of activity type, there was a non-significant trend of higher physical activity frequency with longer RTLs (P-trend = 0.07). Vigorous, but not low-to-intermediate, intensity physical activity appeared to have a positive association with RTL (P-trend = 0.05). The physical activity-RTL association varied by race/ethnicity: estimates in favour of a positive association between higher total amount of physical activity and longer RTL were observed among non-Hispanic Whites but not Hispanics (P-interaction = 0.005) (Figure 1). There were no interactions of physical activity with age or sex.
Table 2.
Association of physical activity measures with relative telomere length (exponentiated telomere/single gene ratio)
| Exposures | Model 1a | Model 2b | Model 3c | P-trendd |
|---|---|---|---|---|
| Continuous, total physical activity, Per SD MET-hours/week | 0.01 (−0.00, 0.02) | 0.01 (0.00, 0.02) | 0.01 (0.00, 0.02) | 0.03* |
| Categories, total physical activity, MET-hours/week | ||||
| <5, n = 208 | Ref | Ref | Ref | |
| 5 to 29.99, n = 343 | −0.01 (−0.03, 0.01) | −0.00 (−0.02, 0.02) | −0.00 (−0.02, 0.02) | |
| 30 or over, n = 198 | 0.01 (−0.01, 0.04) | 0.03 (0.00, 0.06) | 0.03 (0.00, 0.06) | 0.03* |
| Categories, frequency of physical activity a , hours/week | ||||
| <1, n = 187 | Ref | Ref | Ref | |
| 1 to 3.49, n = 171 | −0.01 (−0.04, 0.01) | −0.01 (−0.03, 0.02) | −0.01 (−0.04, 0.02) | |
| 3.50 to 6.99, n = 165 | −0.01 (−0.04, 0.01) | −0.00 (−0.03, 0.02) | −0.00 (−0.03, 0.02) | |
| 7 or over, n = 226 | 0.01 (−0.02, 0.03) | 0.02 (−0.01, 0.05) | 0.02 (−0.00, 0.05) | 0.07 |
| Low to intermediate intensity physical activity, hours/week | ||||
| <0.75, n = 184 | Ref | Ref | Ref | |
| 0.75 to 1.99, n = 131 | −0.00 (−0.03, 0.02) | 0.00 (−0.03, 0.03) | −0.00 (−0.03, 0.03) | |
| 2 to 4.99, n = 155 | −0.00 (−0.03, 0.02) | 0.01 (−0.02, 0.04) | 0.01 (−0.02, 0.03) | |
| 5 or over, n = 279 | 0.01 (−0.02, 0.03) | 0.02 (−0.01, 0.04) | 0.02 (−0.01, 0.04) | 0.13 |
| Vigorous intensity physical activity, hours/week | ||||
| <0.5, n = 467 | Ref | Ref | Ref | |
| 0.50 to 1.49, n = 108 | −0.01 (−0.03, 0.02) | −0.00 (−0.03, 0.03) | 0.00 (−0.03, 0.03) | |
| 1.50 to 4.99, n = 104 | −0.00 (−0.03, 0.03) | 0.01 (−0.02, 0.03) | 0.01 (−0.02, 0.03) | |
| 5 or over, n = 70 | 0.03 (−0.00, 0.06) | 0.03 (0.00, 0.07) | 0.04 (0.01, 0.07) | 0.05 |
Note: Relationship of continuous total physical activity and RTL varied by race/ethnicity: P-interaction for Hispanic ethnicity = 0.005.
*Estimates remained significant after adjusting for multiple testing FDR < 0.05 for main exposures. All definitions for measures of physical activity are provided in the footnotes of Table 1 (no. b–f).
aModel 1 was adjusted for age (years) and sex.
bModel 2 was adjusted for demographic and lifestyle/behavioral factors.
cModel 3 was adjusted for demographic, lifestyle/behavioural and health-related factors.
d P-trend across exposure categories was calculated based on Model 3.
Figure 1.
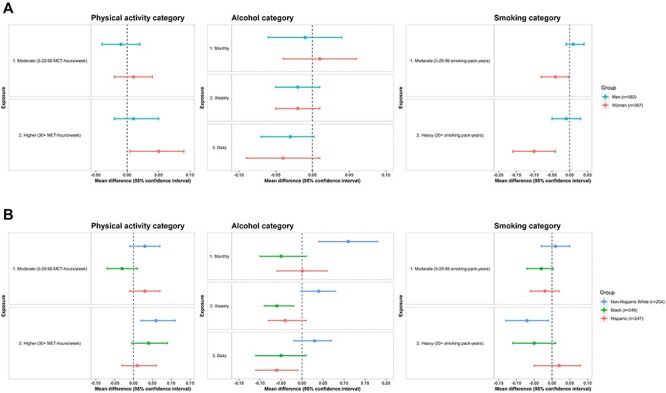
A. Associations of lifestyle and behavioural factors with relative telomere length (exponentiated telomere/single gene ratio), stratified by sex Figure 1B. Associations of lifestyle/behavioural factors with relative telomere length (exponentiated telomere/single gene ratio), stratified by race/ethnicity. Note: There were no statistically significant results for the associations of current depressive symptoms or past, but not current, history of diagnosed depression with RTL. Thus, stratified results for these variables are not illustrated in Figure 1A and B. For physical activity categories: Low physical activity (< 5 MET-hours/week) was the reference category. For alcohol consumption categories: Rare/never was the reference category. For Smoking categories: Never/minimal smoking (0–4.99 smoking pack-years) was the reference category. In Figure 1A and B, multivariable regression models were used to compute mean differences and CIs among moderate and higher versus lowest (reference) categories of selected lifestyle/behaviours exposures (i.e. physical activity, alcohol consumption and cigarette smoking). Models were adjusted for demographic, lifestyle/behavioural and health-related factors.
Associations of alcohol consumption, smoking and depression with RTL are presented in Table 3. Overall, higher alcohol consumption and smoking levels were related to shorter telomeres (P-trends = 0.02). Alcohol-RTL associations varied by race/ethnicity (Figure 1). Although light/moderate alcohol consumption (monthly/weekly) was positively related to RTL among non-Hispanic Whites, weekly or daily alcohol consumption was associated with shorter RTLs among Blacks and Hispanics; daily alcohol-shorter RTL associations were especially apparent among Black and Hispanic women (Figure 2).
Table 3.
Associations of alcohol, smoking consumption and depression variables with relative telomere length (exponentiated telomere/single gene ratio)
| Exposures | Model 1c | Model 2d | Model 3e | P Trendf |
|---|---|---|---|---|
| Alcohol consumption a | ||||
| Rare/never, n = 248 | Ref | Ref | Ref | |
| Monthly, n = 62 | −0.00 (−0.04, 0.03) | 0.00 (−0.03, 0.04) | 0.00 (−0.03, 0.04) | |
| Weekly, n = 282 | −0.02 (−0.05, −0.00) | −0.02 (−0.04, 0.00) | −0.02 (−0.04, 0.00) | |
| Daily, n = 157 | −0.03 (−0.06, −0.01) | −0.03 (−0.06, −0.00) | −0.03 (−0.06, −0.00) | 0.02* |
| Cigarette smoking pack-years b | ||||
| 0 to <5, n = 513 | Ref | Ref | Ref | |
| 5 to <30, n = 178 | −0.01 (−0.03, 0.01) | −0.01 (−0.03, 0.01) | −0.01 (−0.04, 0.01) | |
| 30+, n = 58 | −0.04 (−0.07,-0.00) | −0.04 (−0.08, −0.01) | −0.04 (−0.08, −0.01) | 0.02* |
| PHQ-8 Score | 0.00 (−0.00, 0.01) | 0.00 (−0.00, 0.01) | 0.00 (−0.00, 0.01) | 0.50 |
| Past but not current, history of diagnosed depression | ||||
| No, n = 687 | Ref | Ref | Ref | |
| Yes, n = 62 | −0.01 (−0.04, 0.02) | −0.00 (−0.04, 0.03) | −0.00 (−0.04, 0.03) | 0.81 |
*Estimates remained significant after adjusting for multiple testing FDR < 0.05 for main exposures.
aRelationship of alcohol consumption and RTL varied by race/ethnicity. P-interactions for race/ethnicity were as follows: P-interaction for Black race and monthly and weekly alcohol consumption = 0.001 and 0.003; P-interaction for Hispanic race and weekly and daily alcohol consumption = 0.005 and 0.02.
bRelationship of cigarette smoking pack-years and RTL varied by sex and Hispanic race/ethnicity: P-interaction for sex (for both smoking pack-years category: 0.03; P-interaction for Hispanic ethnicity for heavy smoking use (30+ smoking pack-years) = 0.03.
cModel 1 was adjusted for age (years) and sex.
dModel 2 was adjusted for demographic and lifestyle/behavioural factors.
eModel 3 was adjusted for demographic, lifestyle/behavioural and health-related factors.
fP Trend across exposure categories was calculated based on Model 3.
Figure 2.
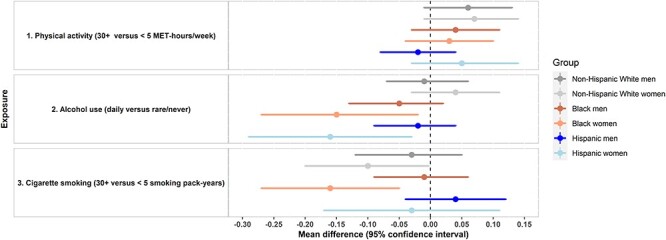
Associations of lifestyle/behavioural factors with relative telomere length (exponentiated telomere/single gene ratio): summary of variations by sex and racial/ethnic groups. Multivariable regression models were used to compute mean difference and Cis of RTL among highest versus lowest categories of selected lifestyle/behavioural exposures (i.e. physical activity, alcohol consumption, cigarette smoking). Models were adjusted for demographic, lifestyle/behavioural and health-related factors.
Heavy smoking (30+ pack-years), compared to no/minimal smoking (<5 pack-years), was related to shorter RTLs (adjusted mean difference (95% CI) = −0.04 (−0.08, −0.01)). Associations varied by sex and race/ethnicity (Figure 1). Estimates for the association of heavy versus no/minimal smoking with RTLs were stronger among women than men (P-interaction = 0.03) and among non-Hispanic White and Black compared to Hispanic adults (P-interaction = 0.03) (Figure 1). When stratifying by sex and race/ethnicity (Figure 2), this association was particularly strong among Black women (adjusted mean difference (95% CI) = −0.16 (−0.27, −0.05)).
There were no associations of current depressive symptoms or past depression history with RTLs. Finally, in a sensitivity analysis, we observed positive associations between amount of physical activity and RTL among those with never or past smoking, but not current smoking (data not shown).
Discussion
In a large, racially/ethnically diverse sample of midlife and older adults, we observed significant associations of lifestyle/behavioural factors with RTL, and variations in several associations by sex and/or race/ethnicity. Specifically, we observed that higher physical activity was associated with longer RTL; this association was strongest among non-Hispanic Whites. Light/moderate alcohol consumption (monthly/weekly) was related to longer RTL among non-Hispanic Whites, whereas daily alcohol consumption was related to shorter RTL among Blacks and Hispanics, especially women. Heavy smoking was related to shorter RTL, and estimates were stronger among women, especially Black women.
Our results are consistent with prior literature demonstrating positive associations between physical activity and TL [5–9]. Our study provides more granular data on relations of total amount, frequency and type (intensity level) of physical activity to RTL, as well as potential variations by race/ethnicity. Results suggest that the potential benefits of exercise with respect to biological ageing may not be uniform across racial/ethnic groups. Furthermore, an exploratory analysis suggested positive associations between physical activity and RTL among those who never smoked or quit smoking, but not among those with current smoking; this may have clinical implications regarding smoking cessation as a proactive approach to optimise benefits of physical activity on healthy ageing.
As with PA, our results for smoking are consistent with hypotheses and prior findings. In a meta-analysis of 30 studies, Astuti et al. [25] observed shorter telomeres among those with current versus no smoking (standardised mean difference (95% CI) = −0.11 (−0.16, −0.07)); the analyses also suggested a dose–response association between smoking pack-years and shorter RTL. Our finding of variation by sex in the smoking-RTL association is also consistent with prior data: in a large cross-sectional study of 5,624 older adults, the association between current smoking and shorter telomeres was stronger among women than men [50]. Our novel report of further variation by race/ethnicity in inverse smoking-telomere associations, especially among Black women, suggests biological paths by which smoking may contribute to health disparities affecting women and minorities.
Reported alcohol-RTL associations have been less consistent than those observed for physical activity and smoking. We observed a significant trend of higher alcohol consumption and shorter RTL, but racial/ethnic variation was noted: light/moderate alcohol consumption was associated with longer RTL among non-Hispanic Whites, but daily alcohol consumption appeared inversely related to RTL among Blacks and Hispanics. Regarding biological mechanisms, moderate alcohol consumption exerts beneficial health effects through reduction of inflammation—which could protect telomeres against shortening [51–53]. Although biological mechanisms underlying daily alcohol-shorter RTL associations have not been well established, some evidence suggests that daily alcohol consumption may induce cascades of cellular dysfunction that potentiate oxidative stress, which could shorten telomeres [54, 55]. Further, Blacks and Hispanics may experience more rapid age-related telomere shortening than non-Hispanic whites [30]; thus, potential negative consequences for TL of alcohol consumption may be greater among minorities compared to non-Hispanic Whites. However, we cannot exclude the possibility of unmeasured confounding: light/moderate alcohol consumption may be correlated with social/behavioural patterns (e.g. social engagement that may promote longer TL) [56] and such correlations could be stronger among non-Hispanic whites than minorities. Finally, studies identified that genomic determinants of TL may vary by race/ethnicity [57]; thus, genetic variations may explain racial/ethnic differences in alcohol-RTL associations. Therefore, our study findings highlight the need for future work to investigate the biological pathways that may underlie potential racial/ethnic variation in alcohol consumption-biological ageing associations.
Finally, prior evidence suggests that clinical-level psychiatric symptoms or disorders may be related to biological ageing [29, 46, 58]. Prior findings regarding depression and TL have been compelling, but not uniform, in the existing literature [59, 60]. We observed suggestive but non-significant associations between past depression and shorter RTLs, but no association between current depressive symptoms and RTLs. As VITAL-DEP was a depression prevention study, the sample did not include participants with prevalent depression or clinically significant depressive symptoms. Thus, the distribution of depressive symptoms was restricted to the mild range—in contrast with prior studies that included patient/clinical samples with broader ranges of depression severity [28, 29].
Strengths of this include its diverse, well-characterised sample and examination of sex and racial/ethnic differences in lifestyle/behaviour-telomere associations. We also acknowledge limitations. First, the study was cross-sectional; longitudinal studies are necessary to examine associations between lifestyle/behavioural factors and prospective change in RTL. Second, misclassification of self-reported exposures is a potential concern: random/non-differential misclassification could bias estimates towards the null, and differential item functioning (DIF) in self-reported measures (e.g. DIF by race/ethnicity) could bias estimates in either direction. However, our use of established, well-validated approaches to ascertain lifestyle/behavioural factors mitigates potential misclassification. Third, we did not measure social variables (e.g. social engagement) which may be correlated with alcohol consumption and might have influenced observed alcohol-RTL associations and variations by race/ethnicity; results should be interpreted with caution; additionally, as we did not collect information on binge drinking, it may underestimate daily alcohol-shorter RTL associations. Fourth, the sample size was relatively small to address additional variation in primary associations by sex and race/ethnicity; caution is needed regarding potential for chance findings.
In summary, we found significant associations between physical activity, alcohol consumption and cigarette smoking with TL, and novel sex and racial/ethnic variations in these associations. If confirmed, these results may have implications regarding approaches to optimise modifiable behaviours to reduce health disparities in ageing.
Supplementary Material
Acknowledgements
We thank Ms. Alison Weinberg and Ms. Jennifer Coates for special assistance with the VITAL-DEP ancillary study. We are indebted to the 25,871 VITAL participants and to the entire VITAL staff for their dedicated and conscientious collaboration.
Contributor Information
Chirag M Vyas, Department of Psychiatry, Massachusetts General Hospital and Harvard Medical School, Boston, MA, USA.
Soshiro Ogata, Channing Division of Network Medicine, Department of Medicine, Brigham and Women’s Hospital and Harvard Medical School, Boston, MA, USA; Faculty of Nursing, School of Health Science, Fujita Health University, Toyoake, Japan; Department of Preventive Medicine and Epidemiology, National Cerebral and Cardiovascular Center, Osaka, Japan.
Charles F Reynolds, Department of Psychiatry, UPMC and University of Pittsburgh School of Medicine, Pittsburgh, PA, USA.
David Mischoulon, Department of Psychiatry, Massachusetts General Hospital and Harvard Medical School, Boston, MA, USA.
Grace Chang, Department of Psychiatry, VA Boston Healthcare System and Harvard Medical School, Boston, MA, USA.
Nancy R Cook, Division of Preventive Medicine, Department of Medicine, Brigham and Women's Hospital and Harvard Medical School, Boston, MA, USA; Department of Epidemiology, Harvard T. H. Chan School of Public Health, Boston, MA, USA.
JoAnn E Manson, Channing Division of Network Medicine, Department of Medicine, Brigham and Women’s Hospital and Harvard Medical School, Boston, MA, USA; Division of Preventive Medicine, Department of Medicine, Brigham and Women's Hospital and Harvard Medical School, Boston, MA, USA; Department of Epidemiology, Harvard T. H. Chan School of Public Health, Boston, MA, USA.
Marta Crous-Bou, Department of Epidemiology, Harvard T. H. Chan School of Public Health, Boston, MA, USA; BarcelonaBeta Brain Research Center (BBRC), Pasqual Maragall Foundation, Barcelona, Spain; Department of Nutrition and Cancer, Cancer Epidemiology Research Program, Catalan Institute of Oncology (ICO) - Bellvitge Biomedical Research Institute (IDIBELL), Barcelona, Spain.
Immaculata De Vivo, Channing Division of Network Medicine, Department of Medicine, Brigham and Women’s Hospital and Harvard Medical School, Boston, MA, USA; Department of Epidemiology, Harvard T. H. Chan School of Public Health, Boston, MA, USA.
Olivia I Okereke, Department of Psychiatry, Massachusetts General Hospital and Harvard Medical School, Boston, MA, USA; Channing Division of Network Medicine, Department of Medicine, Brigham and Women’s Hospital and Harvard Medical School, Boston, MA, USA; Department of Epidemiology, Harvard T. H. Chan School of Public Health, Boston, MA, USA.
Declaration of Conflict of Interest
Dr Mischoulon has received research support from Nordic Naturals and from heckel medizintechnik GmbH. He has received honoraria for speaking from the Massachusetts General Hospital Psychiatry Academy, Harvard Blog, and PeerPoint Medical Education Institute, LLC. He also works with the MGH Clinical Trials Network and Institute (CTNI), which has received research funding from multiple pharmaceutical companies and NIMH. Dr. Okereke receives royalties from Springer Publishing for a book on late-life depression prevention. Dr. Reynolds receives payment from the American Association of Geriatric Psychiatry as Editor-in-Chief of the American Journal of Geriatric Psychiatry and royalty income for intellectual property as co-inventor of the Pittsburgh Sleep Quality Index. Dr. Chang receives royalties from Up-to-Date.
Declaration of Sources of Funding
This work was supported from National Institute of Mental Health (NIMH) [grant number R01 MH096776]. VITAL-DEP is supported from NIMH [grant number R01 MH091448]. VITAL is supported from National Cancer Institute; National Heart, Lung and Blood Institute (NHLBI); Office of Dietary Supplements; National Institute of Neurological Disorders and Stroke; and the National Center for Complementary and Integrative Health of the National Institutes of Health [grant numbers U01 CA138962, R01 CA138962]. The VITAL ancillary studies and Clinical and Translational Science Center (CTSC) component are supported from the National Institute of Diabetes and Digestive and Kidney Diseases [grant numbers DK088078, R01 DK088762]; NHLBI [grant numbers R01 HL101932, R01 HL102122]; National Institute on Aging [grant number R01 AG036755]; National Institute of Arthritis and Musculoskeletal and Skin Diseases [grant numbers R01 AR059086, R01 AR060574] and NIMH [grant number R01 MH091448]. C.F.R.’s participation is also supported by P30 MH090333 from NIMH, and the University of Pittsburgh Medical Center Endowment in Geriatric Psychiatry. Pharmavite LLC of Northridge, California (vitamin D) and Pronova BioPharma (BASF) of Norway (Omacor® fish oil) donated the study agents, matching placebos and packaging in the form of calendar packs. S.O. is supported by JSPS KAKENHI Grant No. 15 J03698. M.C.-B. holds a Miguel Servet fellowship (Grant CP19/00035) funded by Acción Estratégica de Salud—Instituto de Salud Carlos III, Spain. The funding sources had no role in the study design, data analysis or interpretation or the preparation of the manuscript.
References
A full list of references can be found in Appendix 3.
- 1. Blackburn EH. Structure and function of telomeres. Nature 1991; 350: 569–73. [DOI] [PubMed] [Google Scholar]
- 2. Shammas MA. Telomeres, lifestyle, cancer, and aging. Curr Opin Clin Nutr Metab Care 2011; 14: 28–34. [DOI] [PMC free article] [PubMed] [Google Scholar]
- 4. Rowinski R, Kozakiewicz M, Kedziora-Kornatowska K, Hubner-Wozniak E, Kedziora J. Markers of oxidative stress and erythrocyte antioxidant enzyme activity in older men and women with differing physical activity. Exp Gerontol 2013; 48: 1141–6. [DOI] [PubMed] [Google Scholar]
- 6. Du M, Prescott J, Kraft Pet al. Physical activity, sedentary behavior, and leukocyte telomere length in women. Am J Epidemiol 2012; 175: 414–22. [DOI] [PMC free article] [PubMed] [Google Scholar]
- 7. Shadyab AH, LaMonte MJ, Kooperberg Cet al. Leisure-time physical activity and leukocyte telomere length among older women. Exp Gerontol 2017; 95: 141–7. [DOI] [PMC free article] [PubMed] [Google Scholar]
- 9. Stenbäck V, Mutt SJ, Leppäluoto Jet al. Association of physical activity with telomere length among elderly adults - The Oulu Cohort 1945. Front Physiol 2019; 10: 444. [DOI] [PMC free article] [PubMed] [Google Scholar]
- 10. Savela S, Saijonmaa O, Strandberg TEet al. Physical activity in midlife and telomere length measured in old age. Exp Gerontol 2013; 48: 81–4. [DOI] [PubMed] [Google Scholar]
- 12. Soares-Miranda L, Imamura F, Siscovick D, Jenny NS, Fitzpatrick AL, Mozaffarian D. Physical activity, physical fitness, and leukocyte telomere length: the cardiovascular health study. Med Sci Sports Exerc 2015; 47: 2525–34. [DOI] [PMC free article] [PubMed] [Google Scholar]
- 15. Di Castelnuovo A, Costanzo S, Bagnardi V, Donati MB, Iacoviello L, Gaetano G. Alcohol dosing and total mortality in men and women: an updated meta-analysis of 34 prospective studies. Arch Intern Med 2006; 166: 2437–45. [DOI] [PubMed] [Google Scholar]
- 17. Epel ES, Merkin SS, Cawthon Ret al. The rate of leukocyte telomere shortening predicts mortality from cardiovascular disease in elderly men. Aging 2008; 1: 81–8. [DOI] [PMC free article] [PubMed] [Google Scholar]
- 19. Sun Q, Shi L, Prescott Jet al. Healthy lifestyle and leukocyte telomere length in U.S. women. PLoS One 2012; 7: e38374. [DOI] [PMC free article] [PubMed] [Google Scholar]
- 20. Wang H, Kim H, Baik I. Associations of alcohol consumption and alcohol flush reaction with leukocyte telomere length in Korean adults. Nutr Res Pract 2017; 11: 334–9. [DOI] [PMC free article] [PubMed] [Google Scholar]
- 21. Weischer M, Bojesen SE, Nordestgaard BG. Telomere shortening unrelated to smoking, body weight, physical activity, and alcohol intake: 4,576 general population individuals with repeat measurements 10 years apart. PLoS Genet 2014; 10: e1004191. [DOI] [PMC free article] [PubMed] [Google Scholar]
- 25. Astuti Y, Wardhana A, Watkins J, Wulaningsih W. Cigarette smoking and telomere length: a systematic review of 84 studies and meta-analysis. Environ Res 2017; 158: 480–9. [DOI] [PMC free article] [PubMed] [Google Scholar]
- 28. Verhoeven JERD, Epel ES, Lin J, Wolkowitz OM, Penninx BW. Major depressive disorder and accelerated cellular aging: results from a large psychiatric cohort study. Mol Psychiatry 2014; 19: 895–901. [DOI] [PubMed] [Google Scholar]
- 30. Rewak M, Buka S, Prescott Jet al. Race-related health disparities and biological aging: does rate of telomere shortening differ across blacks and whites? Biol Psychol 2014;99:92–9. [DOI] [PMC free article] [PubMed] [Google Scholar]
- 32. Vyas CM, Donneyong M, Mischoulon Det al. Association of race and ethnicity with late-life depression severity, symptom burden, and care. JAMA Netw Open 2020; 3: e201606. [DOI] [PMC free article] [PubMed] [Google Scholar]
- 34. Okereke OI, Reynolds CF 3rd, Mischoulon Det al. The VITamin D and OmegA-3 TriaL-depression endpoint prevention (VITAL-DEP): rationale and design of a large-scale ancillary study evaluating vitamin D and marine omega-3 fatty acid supplements for prevention of late-life depression. Contemp Clin Trials 2018; 68: 133–45. [DOI] [PMC free article] [PubMed] [Google Scholar]
- 35. Manson JE, Cook NR, Lee IMet al. Marine n-3 fatty acids and prevention of cardiovascular disease and cancer. N Engl J Med 2019; 380: 23–32. [DOI] [PMC free article] [PubMed] [Google Scholar]
- 41. Ainsworth BE, Haskell WL, Herrmann SDet al. 2011 compendium of physical activities: a second update of codes and MET values. Med Sci Sports Exerc 2011; 43: 1575–81. [DOI] [PubMed] [Google Scholar]
- 42. Kroenke K, Strine TW, Spitzer RL, Williams JB, Berry JT, Mokdad AH. The PHQ-8 as a measure of current depression in the general population. J Affect Disord 2009; 114: 163–73. [DOI] [PubMed] [Google Scholar]
- 43. Lichtman JH, Bigger JT Jr, Blumenthal JAet al. Depression and coronary heart disease: recommendations for screening, referral, and treatment: a science advisory from the American Heart Association Prevention Committee of the Council on Cardiovascular Nursing, Council on Clinical Cardiology, Council on Epidemiology and Prevention, and Interdisciplinary Council on Quality of Care and Outcomes Research: endorsed by the American Psychiatric Association. Circulation 2008; 118: 1768–75. [DOI] [PubMed] [Google Scholar]
- 44. Diez-Quevedo C, Rangil T, Sanchez-Planell L, Kroenke K, Spitzer RL. Validation and utility of the patient health questionnaire in diagnosing mental disorders in 1003 general hospital Spanish inpatients. Psychosom Med 2001; 63: 679–86. [DOI] [PubMed] [Google Scholar]
- 46. Vyas CM, Hazra A, Chang SCet al. Pilot study of DNA methylation, molecular aging markers and measures of health and well-being in aging. Transl Psychiatry 2019; 9: 118. [DOI] [PMC free article] [PubMed] [Google Scholar]
- 52. Lu B, Solomon DH, Costenbader KH, Keenan BT, Chibnik LB, Karlson EW. Alcohol consumption and markers of inflammation in women with preclinical rheumatoid arthritis. Arthritis Rheum 2010; 62: 3554–9. [DOI] [PMC free article] [PubMed] [Google Scholar]
- 54. Harpaz T, Abumock H, Beery Eet al. The effect of ethanol on telomere dynamics and regulation in human cells. Cell 2018; 7: 169. [DOI] [PMC free article] [PubMed] [Google Scholar]
- 56. Dare J, Wilkinson C, Allsop S, Waters S, McHale S. Social engagement, setting and alcohol use among a sample of older Australians. Health Soc Care Community 2014; 22: 524–32. [DOI] [PubMed] [Google Scholar]
- 57. Zeiger AM, White MJ, Eng Cet al. Genetic determinants of telomere length in African American youth. Sci Rep 2018; 8: 13265. [DOI] [PMC free article] [PubMed] [Google Scholar]
- 58. Simon NM, Smoller JW, McNamara KLet al. Telomere shortening and mood disorders: preliminary support for a chronic stress model of accelerated aging. Biol Psychiatry 2006; 60: 432–5. [DOI] [PubMed] [Google Scholar]
- 60. Schaakxs R, Verhoeven JE, Oude Voshaar RC, Comijs HC, Penninx B. Leukocyte telomere length and late-life depression. Am J Geriatr Psychiatry 2015; 23: 423–32. [DOI] [PubMed] [Google Scholar]
Associated Data
This section collects any data citations, data availability statements, or supplementary materials included in this article.