Abstract
Computer-based quantitative computed tomography analysis has a growing role in the clinical evaluation, prognosis, and longitudinal management of diffuse parenchymal diseases. It provides improved characterization and quantification of disease. The pulmonary vessel-related structure score is a purely computer-based parameter that cannot be evaluated by the human eye and allows us to prognosticate outcomes in patients with fibrosing interstitial lung disease.
KEY WORDS: Computer-Aided Lung Informatics for Pathology Evaluation and Rating, pulmonary vessel-related structure, quantitative computed tomography analysis
INTRODUCTION
Quantitative computed tomography (CT) analysis (QA) is a rapidly growing field of computer-aided quantification that involves extracting, analyzing, and interpreting quantitative data from images that aid in disease diagnosis and prognosis.[1] Most quantitative tools use volumetric datasets. Quantitative analyses range from simple threshold measurements to texture metrics or complex spatiotemporal constructs. There are several quantitative texture analysis tools, Computer-Aided Lung Informatics for Pathology Evaluation and Rating (CALIPER), being one among them (CALIPER, developed at the Biomedical Imaging Resource, Mayo Clinic, Rochester, MN, USA).
Computer-based quantitative CT evaluation has greater precision than visual scoring in the estimation of extent of diffuse parenchymal diseases.[2] The quantitative CT measures of disease severity in patients with idiopathic pulmonary fibrosis (IPF) help to identify increased mortality risk.[3] The pulmonary vessel-related structure (PVRS) score not only predominantly quantifies pulmonary arteries and veins but also captures connected tubular structures, mainly representing adjoining regions of fibrosis. This is a purely computer-based parameter that cannot be evaluated by the human eye and allows us to prognosticate outcomes in patients with IPF and has outperformed the current gold standard measure, forced vital capacity (FVC) decline in a cohort of IPF patients to study drug trial design.[3]
BACKGROUND
One of the first CAD systems for QA was developed as far back as 2011 in patients with scleroderma. The study classified CT pixels with a visual semi-quantitative pulmonary fibrosis score in patients with scleroderma-related interstitial lung disease (ILD) and showed good accuracy.[4]
Bartholmai et al. in 2013 first published a paper describing the use of CALIPER in ILDs.[5] Over the next 7 years, multiple studies[2,6,7] followed that validated the use of CALIPER in diffuse lung diseases, from correlation with functional indices, to predicting outcomes and mortality and to finally coming up with specific features and cutoff numbers that help with outcome management in clinical practice.
TECHNIQUE
An end-inspiratory scan is a prerequisite. The volume has to be of 1 mm or thinner slices at 0.5 mm intervals with a reconstruction algorithm that is not too sharp (e.g., ≤B70 on a Siemens scanner but not B80). This volume is then sent to the lung texture analysis (LTA) tool of the CALIPER software.
The lung is extracted from the surrounding thoracic structures and segmented into upper, middle, and lower lobes after removal of the central airways.
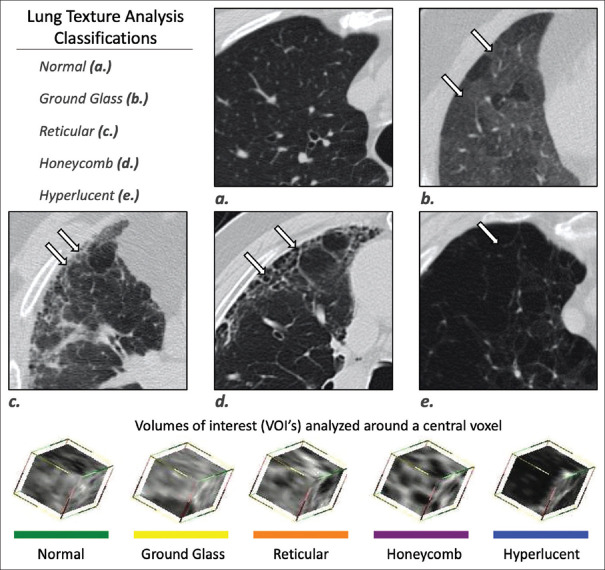
15 × 15 × 15 voxel sizes are then assigned to parenchymal tissue classification of normal, ground-glass, reticular, honeycombing, and low-attenuation area (LAA). The LAAs can be further quantified into three grades, 2 and 3 corresponding to emphysema. These can all be individually calculated per lobe as well, and a fibrosis score is then generated[8] [Figure 1].
Figure 1.
Computer-aided lung informatics for pathology evaluation and rating computation. This composite image shows how 15 cm × 15 mm voxels are assigned one of the following categories: normal, ground-glass, reticular, honeycombing, or low-attenuation area and color-coded accordingly. Courtesy: Imbio, LLC – www.imbio.com
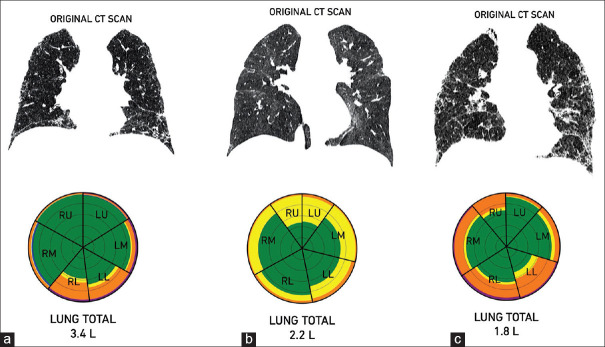
This is done using supervised and unsupervised machine learning to train the algorithm, which has been successfully validated in multiple scenarios and in multiple papers.[1] CALIPER does not include quantification of consolidation or traction bronchiectasis.[8] The initial papers stressed the use of glyphs for stratification [Figure 2], which offer visual interpretation and representation of results;[9] however, these are no longer used.
Figure 2.
Glyphs of different types of interstitial lung diseases. The idiopathic pulmonary fibrosis glyph. (a) Predominant peripheral reticular opacities, while the inflammatory hypersensitivity pneumonitis glyph. (b) Predominant ground glass, while the chronic hypersensitivity pneumonitis glyph. (c) Central and peripheral reticular opacities and ground glass
INDICATIONS
Function
CT scan of the chest is commonly indicated in routine clinical practice in all patients suspected to have an interstitial lung disease, primarily to establish a baseline diagnosis, and to routinely follow up progression/stability of disease. In a series of transplant recipient patients, Matsumoto et al. showed that CT-based total lung capacity (TLC) is as good as TLC measured by plethysmography (TLCpleth) and can replace the need for TLCpleth quite easily, particularly in transplant patients with severe pulmonary fibrosis,[10] without additional radiation exposure to the patient and additional cost. TLC measured by plethysmography, on the other hand, is time-consuming and adds additional cost to the patient.[10]
Ungprasert et al.[11] in their study on 110 patients with inflammatory myopathies also showed that CALIPER can supplement the current use of PFT measurements and could be useful in instances where accuracy of PFT is limited, such as patients with pulmonary hypertension and emphysema. Another advantage of CALIPER measurements of PFT is that it can provide regional changes, in contrast to PFTs where only global pulmonary function can be measured. The accuracy of PFT is effort dependent which is limited by patient cooperation in some cases.[11]
Idiopathic pulmonary fibrosis
The accurate assessment of prognosis and survival predictability of patients with IPF is difficult visually due to interobserver and intraobserver variability. Various studies have demonstrated the usefulness and superiority of CALIPER-based fibrosis scoring over visual scoring and functional parameters.[6]
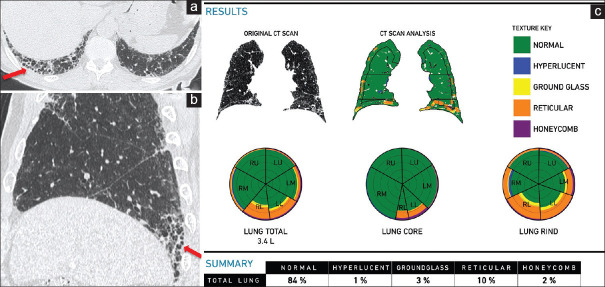
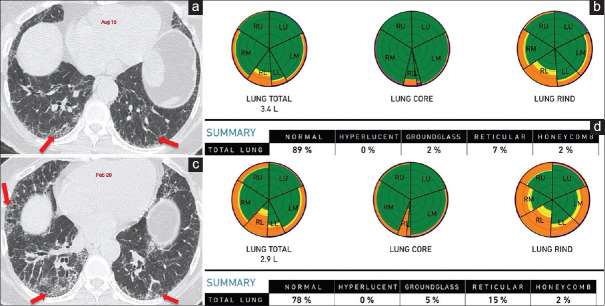
Romei et al. have provided cutoff values on baseline scans; a fibrosis score of >20% has a worse prognosis than a fibrosis score of <20% at baseline scan. Similarly, a PVRS >5% is worse than PVRS <5%[12] [Figure 3]. Sverzellati et al. have recently shown that a 10% change in FVC and >20% change in fibrosis score at 1 year mark the worst outcome. At year 2, >20% change in PVRS was the best predictor of outcome[13] [Figure 4]. These quantitative CT variables in IPF fare better than the GAP score for predicting mortality.[7,14]
Figure 3.
(a-c) Idiopathic pulmonary fibrosis. A 70-year-old man. Axial (a) and sagittal (b) computed tomography scan images show a typical usual interstitial pneumonia pattern, with subpleural basal predominant honeycombing (arrows). The clinical diagnosis was highly suggestive of idiopathic pulmonary fibrosis. The Computer-Aided Lung Informatics for Pathology Evaluation and Rating analysis (c) shows the pattern of involvement in the glyphs and the extent of involvement. The total lung involvement is 15% with a pulmonary vessel-related structure score of 5.03%
Figure 4.
(a-d) Idiopathic pulmonary fibrosis. Axial computed tomography scan (a) of August 2018 shows subpleural basal predominant reticular opacities (arrow), consistent with probable UIP pattern, diagnosed as idiopathic pulmonary fibrosis. Computer-aided lung informatics for pathology evaluation and rating analysis (b) done shows 11% total lung involvement with a pulmonary vessel-related structure score of 4.6%. A repeat axial computed tomography. (c) After 18 months in February 2020 shows visual progression with progression on the Computer-Aided Lung Informatics for Pathology Evaluation and Rating analysis. (d) As well with a total lung involvement of 22% and pulmonary vessel-related structure score of 6.1%. This means a 100% increase in lung involvement and a 32.5% increase in the pulmonary vessel-related structure score, both of which imply poor prognosis
In clinical trials, CALIPER can reduce the sample size by 26%, thus saving time, energy, and money.[3] It has also been found useful in patients with CPFE[15] and in differentiating IPF and NSIP patients.[16]
Unclassifiable interstitial lung diseases
In a cohort of patients with unclassifiable fibrosing ILD, Jacobs et al. found that at baseline, the composite physiologic index, traction bronchiectasis, and Main pulmonary artery (MPA) size were important predictive parameters, while longitudinal change in fibrosis score with CALIPER was the best predictor of outcomes, especially when the change in FVC was marginal.[17]
Chronic fibrotic hypersensitivity pneumonitis
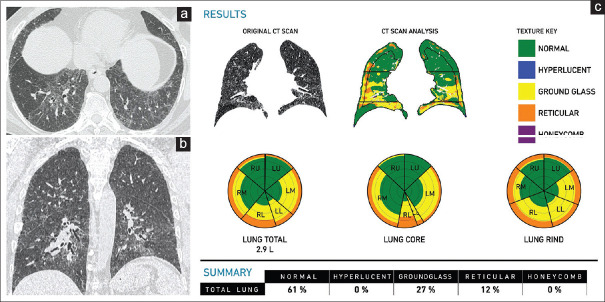
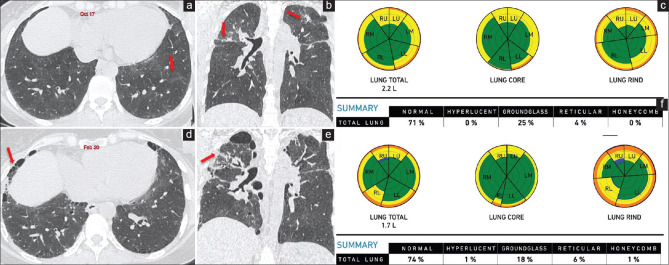
Chronic hypersensitivity pneumonitis has variable clinical outcomes. Traditionally, individual CT parenchymal patterns such as honeycombing and traction bronchiectasis have been associated with worse outcomes.[18] Of all the scores, PVRS is most significantly associated with the restrictive functional indices,[19] a PVRS of >6.5% identifying patients with a mean survival of 35.3 ± 6.1 months, and a rate of disease progression, similar to those with IPF[20] [Figures 5 and 6].
Figure 5.
(a-c) Chronic hypersensitivity pneumonitis. A 57-year-old man. Axial (a) and coronal. (b) Computed tomography scan images show ground-glass attenuation with reticular opacities and axial distribution, findings consistent with the clinical impression of chronic hypersensitivity pneumonitis. The Computer-Aided Lung Informatics for Pathology Evaluation and Rating analysis (c) shows total lung involvement of 39% with ground glass of 27% and a pulmonary vessel-related structure score of 5.2%
Figure 6.
(a-f) Chronic hypersensitivity pneumonitis. Computed tomography images show ground glass (arrows in a) with bronchocentric fibrosis (arrows in b) in October 2017. The retrospective Computer-Aided Lung Informatics for Pathology Evaluation and Rating analysis (c) shows 29% lung involvement with ground glass of 25% and fibrosis of 4% and pulmonary vessel-related structure score of 3.46%. In February 2020, computed tomography images show progression of fibrosis with honeycombing (arrows in d) and upper lobe predominance (arrows in e). Computer-aided lung informatics for pathology evaluation and rating (f) shows lung volumes reduced from 2.2 L to 1.7 L with progression of fibrosis to 6% and reduction in ground glass to 18%. The total fibrosis has increased by 75%. The pulmonary vessel-related structure score is 4.85% showing 40% progression
Connective tissue diseases
Just like with IPF patients, CALIPER-based parameters are better than traditional functional parameters for assessing outcome and mortality in connective tissue disease-ILD patients, the PVRS being the single most reliable variable that predicts outcomes.[21]
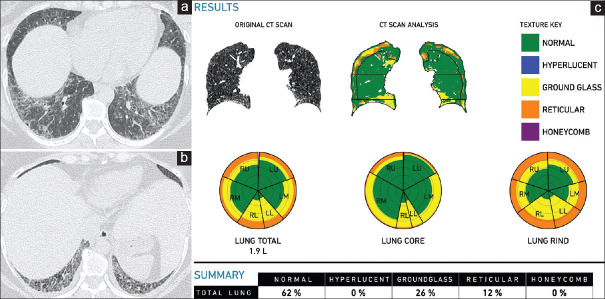
A recent study using CALIPER on 66 scleroderma patients demonstrated a negative linear relationship between reticular opacities and lung function and showed that ground glass was the main radiological finding predicting worsening of pulmonary function at 1 year. A value of the ground glass ≥4.5% was predictive of DLCO worsening of 10% at 1 year[22] [Figure 7].
Figure 7.
(a-c) Scleroderma interstitial lung disease. A 41-year-old woman with recently diagnosed scleroderma. The axial computed tomography scans (a, b) show a pattern consistent with a fibrotic nonspecific interstitial pneumonia pattern, which is consistent with scleroderma interstitial lung disease. The total involvement is 38% with a predominant ground glass of 26% and a pulmonary vessel-related structure score of 5.76%
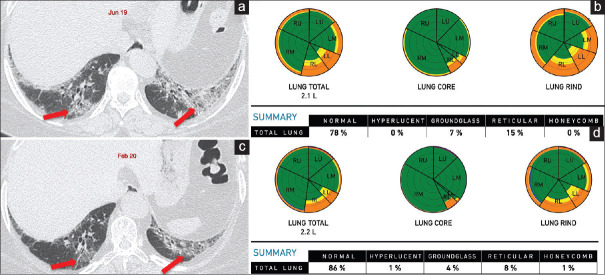
In rheumatoid arthritis-related ILD (RA-ILD), Jacob et al. showed that a PVRS score of >4.4% predicted outcomes similar to IPF[23] [Figure 8].
Figure 8.
(a-d) A 51-year-old woman with RA on follow-up. Axial computed tomography of June 2019 (a) shows a mixed OP-NSIP pattern (arrows). Retrospective Computer-Aided Lung Informatics for Pathology Evaluation and Rating analysis (b) shows total lung involvement of 22%, 7% ground glass, 15% reticular opacities. Her pulmonary vessel-related structure score was 5.24%. A follow-up scan in February 2020 shows regression of the ground glass and some reticular opacities (arrows in c), representing the component that responded to treatment. The residual interstitial lung disease is now 14% of the total lung involvement (d), representing the fibrotic component with some residual inflammation. The pulmonary vessel-related structure score reduced to 4.03%
In inflammatory myopathies, the fibrosis percentage determined using CALIPER correlate with PFT measurements.[11]
OTHER METHODS
Among the other techniques used for quantitative analysis is DTA-data-driven texture analysis, which is a machine learning method, that allows lung fibrosis quantification on HRCT and provides an IPF severity index that correlates well with lung function.[24,25]
Other quantitative CT methods of mean lung attenuation, kurtosis, and skewness have been used to quantify and follow up fibrosis in IPF.[26] Various other homegrown software have been used from time to time for fibrosis quantification and prognostication.[27,28,29,30,31]
Kloth et al. used a texture analysis-based software (Siemens) where VOIs had to be selected to monitor lung involvement in scleroderma patients going for stem cell transplantation.[32]
The adaptive multiple feature method (AMFM) LTA software, used by the IPFnet group, showed that the AMFM scores correlated with the visual assessment of expert radiologists and the hazard of disease progression with a change in scores on follow-up correlating with change in pulmonary function.[33]
LIMITATIONS AND CHALLENGES
Although quantitative CT analysis of diffuse lung diseases is a promising tool in the era of machine learning and artificial intelligence, there are certain limitations in its interpretation and practical implementations.
Foremost is the use of standardized imaging protocols such as reconstruction kernel, section thickness, and dose for accurate and comparable quantitative analysis.[1,34] A good inspiratory image must be obtained as poor inspiratory effort can lead to changes in attenuation and lung volumes, thus resulting in misinterpretation as disease progression.[1,4,34]
Similarly, inadequate lung inflation may lead to underestimation of emphysema.[1] Poor correlations were obtained between CALIPER emphysema extent and functional indices (Kco).[2]
Another pitfall is inadequate extraction in the setting of anatomic variations such as patulous esophagus, hiatus hernia, or colonic interposition, where region growing may include nonlung structures.[1] A minor contamination of PVV by reticulation has been observed in cases with severe fibrosis, which, though considered a limitation, is likely why the score is able to predict disease change and mortality.[2]
We recognize these shortcomings of an automated software which increases the complexity in routine clinical practice. Currently, the main potential application of quantitative CT analysis is in clinical trials to stratify patients by disease severity and as a longitudinal predictor of early mortality. Their validation would require that serial quantitative analysis predicts mortality more accurately than serial FVC.[34]
CONCLUSION
Although technical features of image acquisition and reconstruction are important to obtain quantitative analysis, CALIPER has been successfully used to predict survival and future physiological change in a variety of fibrotic lung diseases.[34] CALIPER-derived PVRS provides better prognostication in various fibrotic ILDs over visual and functional parameters.[6,13,23,34]
Declaration of patient consent
The authors certify that they have obtained all appropriate patient consent forms. In the form the patient(s) has/have given his/her/their consent for his/her/their images and other clinical information to be reported in the journal. The patients understand that their names and initials will not be published and due efforts will be made to conceal their identity, but anonymity cannot be guaranteed.
Financial support and sponsorship
Nil.
Conflicts of interest
There are no conflicts of interest.
REFERENCES
- 1.Chen A, Karwoski RA, Gierada DS, Bartholmai BJ, Koo CW. Quantitative CT analysis of diffuse lung disease. Radiographics. 2020;40:28–43. doi: 10.1148/rg.2020190099. [DOI] [PubMed] [Google Scholar]
- 2.Jacob J, Bartholmai BJ, Rajagopalan S, Kokosi M, Nair A, Karwoski R, et al. Automated quantitative computed tomography versus visual computed tomography scoring in idiopathic pulmonary fibrosis: Validation against pulmonary function. J Thorac Imaging. 2016;31:304–11. doi: 10.1097/RTI.0000000000000220. [DOI] [PubMed] [Google Scholar]
- 3.Jacob J, Bartholmai BJ, Rajagopalan S, van Moorsel CHM, van Es HW, van Beek FT, et al. Predicting outcomes in idiopathic pulmonary fibrosis using automated computed tomographic analysis. Am J Respir Crit Care Med. 2018;198:767–76. doi: 10.1164/rccm.201711-2174OC. [DOI] [PMC free article] [PubMed] [Google Scholar]
- 4.Kim HG, Tashkin DP, Clements PJ, Li G, Brown MS, Elashoff R, et al. A computer-aided diagnosis system for quantitative scoring of extent of lung fibrosis in scleroderma patients. Clin Exp Rheumatol. 2010;28:S26–35. [PMC free article] [PubMed] [Google Scholar]
- 5.Bartholmai BJ, Raghunath S, Karwoski RA, Moua T, Rajagopalan S, Maldonado F, et al. Quantitative computed tomography imaging of interstitial lung diseases. J Thorac Imaging. 2013;28:298–307. doi: 10.1097/RTI.0b013e3182a21969. [DOI] [PMC free article] [PubMed] [Google Scholar]
- 6.Maldonado F, Moua T, Rajagopalan S, Karwoski RA, Raghunath S, Decker PA, et al. Automated quantification of radiological patterns predicts survival in idiopathic pulmonary fibrosis. Eur Respir J. 2014;43:204–12. doi: 10.1183/09031936.00071812. [DOI] [PubMed] [Google Scholar]
- 7.Jacob J, Bartholmai BJ, Rajagopalan S, Kokosi M, Nair A, Karwoski R, et al. Mortality prediction in idiopathic pulmonary fibrosis: Evaluation of computer based CT analysis with conventional severity measures. Eur Respir J. 2017;49 doi: 10.1183/13993003.01011-2016. [DOI] [PubMed] [Google Scholar]
- 8.Jacob J, Bartholmai BJ, Rajagopalan S, Kokosi M, Egashira R, Brun AL, et al. Serial automated quantitative CT analysis in idiopathic pulmonary fibrosis: Functional correlations and comparison with changes in visual CT scores. Eur Radiol. 2018;28:1318–27. doi: 10.1007/s00330-017-5053-z. [DOI] [PubMed] [Google Scholar]
- 9.Raghunath S, Rajagopalan S, Karwoski RA, Maldonado F, Peikert T, Moua T, et al. Quantitative stratification of diffuse parenchymal lung diseases. PLoS One. 2014;9:e93229. doi: 10.1371/journal.pone.0093229. [DOI] [PMC free article] [PubMed] [Google Scholar]
- 10.Matsumoto AJ, Bartholmai BJ, Wylam ME. Comparison of total lung capacity determined by plethysmography with computed tomographic segmentation using CALIPER. J Thorac Imaging. 2017;32:101–6. doi: 10.1097/RTI.0000000000000249. [DOI] [PubMed] [Google Scholar]
- 11.Ungprasert P, Wilton KM, Ernste FC, Kalra S, Crowson CS, Rajagopalan S, et al. Novel assessment of interstitial lung disease using the “computer-aided lung informatics for pathology evaluation and rating” (CALIPER) software system in idiopathic inflammatory myopathies. Lung. 2017;195:545–52. doi: 10.1007/s00408-017-0035-0. [DOI] [PubMed] [Google Scholar]
- 12.Romei C, Tavanti LM, Taliani A, De Liperi A, Karwoski R, Celi A, et al. Automated computed tomography analysis in the assessment of Idiopathic pulmonary fibrosis severity and progression. Eur J Radiol. 2020;124:108852. doi: 10.1016/j.ejrad.2020.108852. [DOI] [PubMed] [Google Scholar]
- 13.Sverzellati N, Silva M, Seletti V, Galeone C, Palmucci S, Piciucchi S, et al. Stratification of long-term outcome in stable idiopathic pulmonary fibrosis by combining longitudinal computed tomography and forced vital capacity. Eur Radiol. 2020;30:2669–79. doi: 10.1007/s00330-019-06619-5. [DOI] [PubMed] [Google Scholar]
- 14.Cottin V. Combined pulmonary fibrosis and emphysema: Bad and ugly all the same? Eur Respir J. 2017;50 doi: 10.1183/13993003.00846-2017. [DOI] [PubMed] [Google Scholar]
- 15.Jacob J, Bartholmai BJ, Rajagopalan S, Kokosi M, Maher TM, Nair A, et al. Functional and prognostic effects when emphysema complicates idiopathic pulmonary fibrosis. Eur Respir J. 2017;50(1) doi: 10.1183/13993003.00379-2017. [DOI] [PubMed] [Google Scholar]
- 16.De Giacomi F, Raghunath S, Karwoski R, Bartholmai BJ, Moua T. Short-term automated quantification of radiologic changes in the characterization of idiopathic pulmonary fibrosis versus nonspecific interstitial pneumonia and prediction of long-term survival. J Thorac Imaging. 2018;33:124–31. doi: 10.1097/RTI.0000000000000317. [DOI] [PubMed] [Google Scholar]
- 17.Jacob J, Bartholmai BJ, Rajagopalan S, Egashira R, Brun AL, Kokosi M, et al. Unclassifiable-interstitial lung disease: Outcome prediction using CT and functional indices. Respir Med. 2017;130:43–51. doi: 10.1016/j.rmed.2017.07.007. [DOI] [PubMed] [Google Scholar]
- 18.Jacob J, Bartholmai BJ, Rajagopalan S, Karwoski R, Mak SM, Mok W, et al. Automated computer-based CT stratification as a predictor of outcome in hypersensitivity pneumonitis. Eur Radiol. 2017;27:3635–46. doi: 10.1007/s00330-016-4697-4. [DOI] [PubMed] [Google Scholar]
- 19.Jacob J, Bartholmai BJ, Brun AL, Egashira R, Rajagopalan S, Karwoski R, et al. Evaluation of visual and computer-based CT analysis for the identification of functional patterns of obstruction and restriction in hypersensitivity pneumonitis. Respirology. 2017;22:1585–91. doi: 10.1111/resp.13122. [DOI] [PubMed] [Google Scholar]
- 20.Jacob J, Bartholmai BJ, Egashira R, Brun AL, Rajagopalan S, Karwoski R, et al. Chronic hypersensitivity pneumonitis: Identification of key prognostic determinants using automated CT analysis. BMC Pulm Med. 2017;17:81. doi: 10.1186/s12890-017-0418-2. [DOI] [PMC free article] [PubMed] [Google Scholar]
- 21.Jacob J, Bartholmai BJ, Rajagopalan S, Brun AL, Egashira R, Karwoski R, et al. Evaluation of computer-based computer tomography stratification against outcome models in connective tissue disease-related interstitial lung disease: A patient outcome study. BMC Med. 2016;14:190. doi: 10.1186/s12916-016-0739-7. [DOI] [PMC free article] [PubMed] [Google Scholar]
- 22.Ferrazza AM, Gigante A, Gasperini ML, Ammendola RM, Paone G, Carbone I, et al. Assessment of interstitial lung disease in systemic sclerosis using the quantitative CT algorithm CALIPER. Clin Rheumatol. 2020;39:1537–42. doi: 10.1007/s10067-020-04938-3. [DOI] [PubMed] [Google Scholar]
- 23.Jacob J, Hirani N, van Moorsel CHM, Rajagopalan S, Murchison JT, van Es HW, et al. Predicting outcomes in rheumatoid arthritis related interstitial lung disease. Eur Respir J. 2019;53(1) doi: 10.1183/13993003.00869-2018. [DOI] [PMC free article] [PubMed] [Google Scholar]
- 24.Humphries SM, Swigris JJ, Brown KK, Strand M, Gong Q, Sundy JS, et al. Quantitative high resolution computed tomography fibrosis score: Performance characteristics in idiopathic pulmonary fibrosis. Eur Respir J. 2018;52 doi: 10.1183/13993003.01384-2018. [DOI] [PubMed] [Google Scholar]
- 25.Humphries SM, Yagihashi K, Huckleberry J, Rho BH, Schroeder JD, Strand M, et al. Idiopathic Pulmonary fibrosis: data-driven textural analysis of extent of fibrosis at baseline and 15-month follow-up. Radiology. 2017;285:270–8. doi: 10.1148/radiol.2017161177. [DOI] [PMC free article] [PubMed] [Google Scholar]
- 26.Best AC, Meng J, Lynch AM, Bozic CM, Miller D, Grunwald GK, et al. Idiopathic pulmonary fibrosis: Physiologic tests, quantitative CT indexes, and CT visual scores as predictors of mortality. Radiology. 2008;246:935–40. doi: 10.1148/radiol.2463062200. [DOI] [PubMed] [Google Scholar]
- 27.Iwasawa T, Ogura T, Sakai F, Kanauchi T, Komagata T, Baba T, et al. CT analysis of the effect of pirfenidone in patients with idiopathic pulmonary fibrosis. Eur J Radiol. 2014;83:32–8. doi: 10.1016/j.ejrad.2012.02.014. [DOI] [PubMed] [Google Scholar]
- 28.Park HJ, Lee SM, Song JW, Lee SM, Oh SY, Kim N, et al. Texture-based automated quantitative assessment of regional patterns on initial CT in patients with idiopathic pulmonary fibrosis: Relationship to decline in forced vital capacity. AJR Am J Roentgenol. 2016;207:976–83. doi: 10.2214/AJR.16.16054. [DOI] [PubMed] [Google Scholar]
- 29.Kim HJ, Brown MS, Chong D, Gjertson DW, Lu P, Kim HJ, et al. Comparison of the quantitative CT imaging biomarkers of idiopathic pulmonary fibrosis at baseline and early change with an interval of 7 months. Acad Radiol. 2015;22:70–80. doi: 10.1016/j.acra.2014.08.004. [DOI] [PubMed] [Google Scholar]
- 30.Bak SH, Park HY, Nam JH, Lee HY, Lee JH, Sohn I, et al. Predicting clinical outcome with phenotypic clusters using quantitative CT fibrosis and emphysema features in patients with idiopathic pulmonary fibrosis. PLoS One. 2019;14 doi: 10.1371/journal.pone.0215303. e0215303. [DOI] [PMC free article] [PubMed] [Google Scholar]
- 31.Lee SM, Seo JB, Oh SY, Kim TH, Song JW, Lee SM, et al. Prediction of survival by texture-based automated quantitative assessment of regional disease patterns on CT in idiopathic pulmonary fibrosis. Eur Radiol. 2018;28:1293–300. doi: 10.1007/s00330-017-5028-0. [DOI] [PubMed] [Google Scholar]
- 32.Kloth C, Blum AC, Thaiss WM, Preibsch H, Ditt H, Grimmer R, et al. Differences in texture analysis parameters between active alveolitis and lung fibrosis in chest CT of patients with systemic sclerosis: A feasibility study. Acad Radiol. 2017;24:1596–603. doi: 10.1016/j.acra.2017.07.002. [DOI] [PubMed] [Google Scholar]
- 33.Salisbury ML, Lynch DA, van Beek EJ, Kazerooni EA, Guo J, Xia M, et al. Idiopathic pulmonary fibrosis: the association between the adaptive multiple features method and fibrosis outcomes. Am J Respir Crit Care Med. 2017;195:921–9. doi: 10.1164/rccm.201607-1385OC. [DOI] [PMC free article] [PubMed] [Google Scholar]
- 34.Wu X, Kim GH, Salisbury ML, Barber D, Bartholmai BJ, Brown KK, et al. Computed tomographic biomarkers in idiopathic pulmonary fibrosis.The future of quantitative analysis. Am J Respir Crit Care Med. 2019;199:12–21. doi: 10.1164/rccm.201803-0444PP. [DOI] [PubMed] [Google Scholar]


