

Abstract
Matrix-assisted laser desorption/ionization imaging mass spectrometry (MALDI IMS) allows for highly multiplexed, untargeted detection of many hundreds of analytes from tissue. Recently, laser post-ionization (MALDI-2) has been developed for increased ion yield and sensitivity for lipid IMS. However, the dependence of MALDI-2 performance on the various lipid classes is largely unknown. To understand the effect of the applied matrix on MALDI-2 analysis of lipids, samples including an equimolar lipid standard mixture, various tissue homogenates, and intact rat kidney tissue sections were analyzed using the following matrices: α-cyano-4-hydroxycinnamic acid (CHCA), 2’,5’-dihydroxyacetophenone (DHA), 2’,5’-dihydroxybenzoic acid (DHB), and norharmane (NOR). Lipid signal enhancement of protonated species using MALDI-2 technology varied based on the matrix used. Although signal improvements were observed for all matrices, the most dramatic effects using MALDI-2 were observed using NOR and DHB. For lipid standards analyzed by MALDI-2, NOR provided the broadest coverage, enabling the detection of all 13 protonated standards, including non-polar lipids, whereas DHB gave less coverage but gave the highest signal increase for those lipids recorded. With respect to tissue homogenates and rat kidney tissue, mass spectra were compared and showed that the number and intensity of neutral lipids tentatively identified with MALDI-2 using NOR increased significantly (e.g. 5-fold intensity increase for triacylglycerol). In the cases of DHB with MALDI-2, the number of protonated lipids identified from tissue homogenates doubled with 152 on average compared to 76 with MALDI alone. High spatial resolution imaging (~20 μm) of rat kidney tissue showed similar results using DHB with 125 lipids tentatively identified from MALDI-2 spectra versus just 72 using standard MALDI. From the four matrices tested, NOR provided the greatest increase in sensitivity for neutral lipids (triacylglycerol, diacylglycerol, monoacylglycerol, cholesterol ester) and DHB provided the highest overall number of lipids detected using MALDI-2 technology.
INTRODUCTION
Matrix-assisted laser desorption/ionization (MALDI) imaging mass spectrometry (IMS) allows for label-free mapping of many hundreds of molecules in an untargeted manner within a single tissue imaging experiment.1,2 The combination of molecular specificity that mass spectrometry provides and the spatial information afforded by IMS allows for the precise mapping of biological compounds such as proteins, peptides, lipids, and metabolites.3–11 Due to these unique capabilities, IMS has been used to investigate molecular distributions within tissue for various biologically relevant systems including tumor margins,12–15 diabetic disease models,16,17, the host-pathogen interface, as well as many more.18,19 In order to more thoroughly analyze the molecular complexity of cells and tissues and identify the biochemical species within an individual pixel, improvements in sensitivity is essential.
Attempts to increase sensitivity of MALDI IMS has led to the development of multiple targeted and untargeted technologies. Targeted methods such as chemical tagging using photocleavable mass tags or in-source reactive tags have allowed for up to 40-fold increase in ion yields.20–23 Nevertheless these methods are targeted and only provide improvements for molecules with specific chemical functionality. Non-tagging approaches to increase sensitivity include the development of novel matrices,24–26 the incorporation of chemical additives to matrices, removal of interfering species from tissue sections by organic solvset and aqueous washes27,28, and use of laser wavelengths that better match the absorption bands of the matrices.29 As an example, adding 2-hydroxy-5-methoxybenzoic acid to 2,5-dihydroxybenzoic acid (DHB) allowed for a 3-fold increase in signal-to-noise (S/N) for oligosaccharides compared to DHB alone.30
While MALDI allows for high spatial resolution sampling of tissue surfaces with good sensitivity, mostly neutral molecules are desorbed with low overall ion yields. It is estimated that ~106 neutral molecules are desorbed for every ion generated.31–33 To address this, a technology termed laser post-ionization (MALDI-2) capitalizes on the abundance of neutrals in the initial MALDI desorption plume to generate additional ions.34 For clarity, we will term the normal MALDI event MALDI-1 and the combination experiment of MALDI-1/MALDI-2 simply as MALDI-2. Briefly, the MALDI-2 process utilizes a secondary laser aligned ~ 400 μm above the primary MALDI-1 ablation surface so that the secondary laser pulses intersect the primary MALDI-1 desorption plume at a given delay time, resulting in ionization of some of the desorbed neutrals.35–42 The MALDI-2 ionization process is thought to result from a two-photon ionization threshold mechanism that gives rise primarily to protonated species.34,36,43,44 MALDI-2 has been shown to improve ion yields by more than two orders of magnitude for some lipid classes.34,36,44 Additionally, the increase in ion intensity has enhanced conditions needed for ultra-high spatial resolution MALDI imaging applications.42
Although the enhanced performance observed with MALDI-2 has been reported, much more needs to be done to further characterize this technology. For example, the difference in the overall molecular coverage between MALDI-1 and MALDI-2 has not yet been fully studied. Thus far, MALDI-2 has proven to improve sensitivity for certain molecular classes including liposoluble vitamins, mono- and oligosaccharides, certain lipid classes, and exogenous drugs.34,36,38–43,45,46 Lipid classes that have been shown to have dramatically increased ion intensities in positive ion mode include hexosylceramides (HexCers), phosphatidylethanolamines (PEs), phosphatidylinositols (PIs), phosphatidylglycerols (PGs), phosphatidylserines (PSs), triacylglycerols (TGs), and cholesterol esters (CEs).34 Interestingly, other classes of lipids such as phosphatidylcholines (PCs) were not shown to increase significantly with MALDI-2. In addition, recent work by Boskamp and Soltwisch has demonstrated ion suppression and ion promotion effects among different lipid classes with MALDI-2.43 Overall, these data suggest a significant lipid-class dependence for MALDI-2 experiments.
The choice of matrix is known to affect desorption/ionization upon laser ablation for MALD-1 analyses, but no studies have been reported that systematically investigate the influence of various matrices with MALDI-2 for lipid analyses. Matrices that have been used most commonly in MALDI-2 analysis include α-cyano-4-hydroxycinnamic acid (CHCA), 2’,5’-dihydroxyacetophenone (DHA), 2’,5’-dihydroxybenzoic acid (DHB), and norharmane (NOR). To understand the effect of matrix on detection of lipid classes with MALDI-2, we examined sensitivity and lipid coverage using a variety of samples: an equimolar lipid standard mixture, rabbit adrenal gland, rat brain, rat kidney, and rat liver tissue homogenates. The four matrices listed above were used for these analyses, and each sample was analyzed both with MALDI-1 and MALDI-2. This study lays the groundwork for improved, standardized methods for MALDI-2 analysis and the findings allow for tuning of matrix choice to maximize sensitivity for specific lipid classes.
METHODS
Materials and methods
Lipid standards were purchased from Avanti Polar Lipids (Alabaster, AL, USA) as EquiSPLASH LIPIDOMIX Quantitative Mass Spec Internal Standard containing a methanol solution of 100 μg/mL of each of thirteen deuterated lipids of following lipid classes: phosphatidylcholine (PC), lysophosphatidylcholine (LPC), phosphatidylethanolamine (PE), lysophosphatidylethanolamine (LPE), phosphatidylglycerol (PG), phosphatidylinositol (PI), phosphatidylserine (PS), triacylglycerol (TG), diacylglycerol (DG), monoacylglycerol (MG), cholesterol ester (CE), sphingomyelin (SM), and ceramide (Cer). Ammonium formate and the MALDI matrices DHA, DHB, CHCA, and NOR were purchased from MilliporeSigma (Burlington, MA, USA). The matrices DHA, DHB, and CHCA were purified via recrystallization in-house prior to use. Acetonitrile (ACN) and methanol (MeOH) were purchased from Fisher Scientific (Pittsburgh, PA, USA) and water (H2O) of 18.2 MΩ cm resistivity was obtained from a Milli-Q Reference Water Purification System (MilliporeSigma, Burlington, MA, USA). The lipid standard mixture was prepared by mixing 100 uL lipid solution with 4 mg matrix in 1 mL MeOH for each of the four matrices. The matrix/lipid combination was sprayed onto indium-tin oxide (ITO)-coated glass slides (Delta Technologies, Loveland, CO, USA) using the TM Sprayer (HTX Technologies, Chapel Hill, NC, USA) with a solvent flow rate of 0.05 mL/minute, 16 passes, 1350 mm/s velocity, and 60°C nozzle temperature.
Tissue samples of rabbit adrenal gland, rat brain, rat kidney, and rat liver were obtained from BioIVT (Baltimore, MD, USA). Tissue homogenates were prepared as described by Groseclose and Castellino.47 Tissue sections and tissue homogenates were stored frozen at −80°C, sectioned at 10 μm thickness at −20°C (Leica CM3050, Leica Biosystems, Buffalo Grove, IL, USA), thaw-mounted onto ITO-coated glass slides, washed in a solution of 50 mM ammonium formate for 30 seconds, and dried under a stream of nitrogen.48 Matrix solutions for coating tissue homogenates were prepared for CHCA (5 mg/mL, 80:20, ACN:H2O), DHA (15 mg/mL, 90:10, ACN:H2O), DHB (20 mg/mL, 90:10, MeOH:H2O), and NOR (5 mg/mL, 90:10, MeOH:H2O) and sprayed with the TM Sprayer with a solvent flow rate of 0.05 mL/minute, 16 passes, 1350 mm/s velocity, and 60°C nozzle temperature. Autofluorescence microscopy images were obtained prior to matrix application with EGFP, DAPI and DsRed filters using a Zeiss AxioScan Z1 slide scanner (Carl Zeiss Microscopy GmbH, Germany).
Instrument/acquisition parameters
Samples were analyzed on an Orbitrap Elite (Thermo Scientific, San Jose, CA) mass spectrometer equipped with a Spectroglyph MALDI-1 ion source (Spectroglyph LLC., Kennewick, WA). The Spectroglyph source has a MALDI-2 laser setup as described previously.46 Briefly, the MALDI-2 laser (266 nm, FQSS266–200-STA, CryLaS GmbH, Berlin, Germany) is aligned parallel to the sample surface to irradiate the initial MALDI-1 plume at ~400 μm above the sample surface. A delay time was set to be 20 μs between the initial MALDI-1 event and the MALDI-2 laser irradiation. MALDI-2 energy was set to 150 μJ per pulse. The mass spectrometer was operated at a resolving power of 120,000 at m/z 400 with 1 microscan. IMS of tissue homogenate and rat kidney tissue section was obtained with 20 μm spatial resolution with a mass range of m/z 400–1500. Spectra for lipid standards were obtained in full profile mode and 20 spectra were averaged from line scans with 20 μm spatial resolution. Grids of ~500 pixels were obtained with MALDI-1 and MALDI-2 from adjacent regions for the tissue homogenates. An averaged spectrum of the image was generated and used for subsequent lipid identification. Technical replicates of tissue homogenates were prepared and analyzed on separate days.
Data analysis
Thermo RAW files were opened in Xcalibur Qual Browser and the spectra over the time of the image were averaged and imported into the spectral processing software mMass (mmass.org,).49 A signal-to-noise (S/N) threshold was manually set to 3x above the baseline noise level observed for each experiment. Tissue homogenate spectra were processed by removing isotopes and linearly recalibrating the mass axis. Spectra were annotated and lipids were tentatively identified via accurate mass measurements using a mass accuracy of +/− 2 ppm based on a custom reference mass list including PC, LPC, PE, LPE, SM, CE, Cer, HexCer, Cholesterol, MG, DG, TG, PA, PG, PI, and PS lipid classes. Identified lipids and their intensities were exported via the “Analysis Report” feature and were compared using Microsoft Excel (Version 1902, Redmond, WA, USA). IMS data of rat kidney tissue was converted to vendor-neutral imzML data format using ImageInsight (Spectroglyph, LLC., Kennewick, WA, USA) and imported to SCiLS (2019c, Bruker Daltonics, Billerica, MA) for visualization of ion images. Hotspot removal tool and RMS normalization were used in SCiLS for processing of ion images.
RESULTS AND DISCUSSION
Analysis of Lipid Standards
To explore the effect of the MALDI matrix on the ionization of different lipid classes by MALDI-2, an equimolar mixture of deuterated lipid standards, each of which represents a different lipid class, was analyzed by both MALDI-1 and MALDI-2 in positive ion mode. The lipid mixture contained PC(15:0/18:1 d7), PE(15:0/18:1 d7), PS(15:0/18:1 d7), PG(15:0/18:1 d7), PI(15:0/18:1 d7), LPC(18:1 d7), LPE(18:1 d7), CE(18:1 d7), MG(18:1 d7), DG(18:1 d7), TG(18:1 d7), SM(18:1/18:1 d7), and Ceramide (d18:1 d7/15:0). Sheet S1 shows the m/z, identity based on accurate mass measurements of +/− 2 ppm error, and the respective ppm error for each standard identified for each matrix. Matrices CHCA, DHA, DHB, and NOR were chosen for this study as they comprise the majority of matrices used in published reports of MALDI-2 analyses.34,36,42,50 For MALDI-1, the spectra were typically dominated by PC, LPC, and SM lipid classes as seen in the overview spectra (Figure S1), typical for MALDI-1 analysis as the PC and SM head groups are positively charged and are detected readily in positive ion mode.8,43 For MALDI-2, protonated lipid species show the greatest increase in signal intensity, whereas most of the sodium- and potassium-adducted lipids do not dramatically increase (Table S1, Table S2). Therefore, our analysis is focused on enhancement of protonated forms of lipids. Figure 1 shows expanded MALDI-1 (black) and MALDI-2 (red) spectra for protonated PC, PE, PG, PI, and TG lipid standards. Intensity comparisons among matrices show CHCA and DHB give similar intensity profiles for MALDI-2 spectra (within 3x). MALDI-1 and MALDI-2 lipid intensity profiles are similar using DHA and NOR for most lipid standards except for non-polar species. None of the non-polar lipid standards (TG, DG, MG and CE) were detected with DHA using either MALDI-1 or MALDI-2. On the other hand, all were detected using MALDI-2 and NOR (Figures 1 and S2).
Figure 1:

Spectra of lipid standard mixture expanded to show enhancement of protonated species for select lipid classes. MALDI-1 spectra are the black traces (top), MALDI-2 are the red traces (bottom), and the intensity scale is the same for each pair of MALDI-1 and MALDI-2 spectra. Asterisks indicates ion of interest was detected.
Overall, MALDI-2 was found to have significantly increased molecular coverage of protonated lipids for all matrices tested (CHCA, DHA, DHB, and NOR). Lipid classes such as PI, PS, and PG were detected as the protonated form with MALDI-2 for all matrices. Additionally, MALDI-2 enabled the detection of protonated TG using CHCA, DHB, and NOR (Figure 1) and protonated forms other non-polar species (MG, DG, and CE) with NOR (Figure S2). This contrasts with MALDI-1 analysis where neutral lipid classes are typically detected as sodiated adducts in positive ion mode. Improvements in sensitivity from MALDI-2 were matrix- and lipid class-dependent for the lipid standards and results are summarized in Table 1 and Table S3. Data presented in Table 1 indicate the S/N fold change between MALDI-1 and MALDI-2 for lipids detected in both cases. Species that are only detected with MALDI-2 are noted with an asterisk (*) and lipids not detected with either MALDI-1 or MALDI-2 are denoted with “ND”. From this summary PC, LPC, and SM lipids are each detected with MALDI-1 and MALDI-2 with no significant differences in intensities due to post-ionization as denoted by a fold change of 1. In contrast, all other lipid classes detected showed a significant increase in intensity when MALDI-2 was activated. One benefit of positive ion mode analysis by MALDI-2 is the detection of lipid species typically only observed in negative ion mode only such as PI, PS, PG. Recent work by Boskamp and Soltwisch has shown that MALDI-2 may correct for ion suppression effects to enable detection of these protonated species.43 MALDI-2 increased protonated lipid coverage with all matrices but the species detected with MALDI-2 varied based on the matrix. The TG species, for example, was detected only with MALDI-2 for CHCA, DHB, and NOR but was not detected with DHA. Note, although the intact molecular ions for protonated TGs, DGs, and MGs were detected in certain cases, we do detect [DG+H-H2O]+ and [MG+H-H2O]+ with greater intensity. These ions are likely the result of MALDI-induced fragmentation of the corresponding protonated TGs and DGs. Lipids DG, MG, and CE were only detected with NOR matrix with MALDI-2. In contrast, species such as PG and PI were detected for all matrices, but only with MALDI-2.
Table 1.
Fold change intensity increase (numbers in cells) with MALDI-2 for protonated lipid standards in mixture. Fold change spans from lowest (red cells) to highest (green cells). “ND” in a white cell denotes detected neither with MALDI-1 nor with MALDI-2. An asterisk (*) denotes species only detected with MALDI-2.

|
From the study of lipid standards, NOR provided the broadest coverage for protonated lipids with MALDI-2 whereas DHB provided for the largest fold change increase for PE lipids. One explanation for the discrepancy in performance among matrices may be based on their absorption profile and interaction with the laser. Initial experiments by Soltwisch et al. show that PE lipid signal is laser wavelength- and pulse energy-dependent.34 Note, the MALDI-2 laser pulse energy for our studies is lower than what has been used recently by the Ellis group (150 μJ vs. 500 μJ), as limited by the maximum energy output for the laser.44 Early studies showed that a dramatic increase in signal could be produced with MALDI-2 while operating MALDI-1 energy at or below the ionization threshold,.36,46 Here, we operated the MALDI-1 laser well above the ionization threshold to obtain maximum lipid signal without MALDI-2. Therefore, any increase in number lipids detected with MALDI-2 activated are in addition to what is already detectable with MALDI-1 alone.
Improved lipid sensitivity using MALDI-2 was observed for all matrices in the analysis of standards, but the lipid class coverage was matrix dependent. NOR was the only matrix that enabled all classes in the lipid standard to be detected in the protonated form using MALDI-2. While the lipid standards mixture analysis provides confirmation that MALDI-2 enhances sensitivity for lipid classes that are not typically detected in their protonated form (PG, PI, PS, TG, MG, DG), it does not accurately represent the complex mixture of lipids detected during tissue analysis. The hierarchy of ion suppression effects may affect lipid classes detected for tissue and tissue homogenate sections.43
Lipidomic Comparisons Across Multiple Tissue Types
In order to evaluate the performance of matrices with MALDI-2 for a complex, broad range of lipids, homogenates of various tissues were analyzed. Tissue homogenates help to reduce possible spatial heterogeneity while maintaining the overall lipid, protein, and salt compositions of tissues. As a result, tissue homogenates are commonly used for generating calibrations curves that enable in situ quantitative analysis, and as a means to optimize tissue IMS sample preparation.51–56 For the studies described herein, tissue homogenates were used to minimize variability between MALDI-1 and MALDI-2 for each of the tested matrices and tissue types. Spectral comparisons of MALDI-1 and MALDI-2 are shown for brain and kidney homogenates for each of the four matrices (Figure 2). Spectral data from rabbit adrenal tissue and rat liver tissue can be found in Figure S3 and full data in Sheet S2. Average spectra for MALDI-1 alone are the black traces on the top of each pair and MALDI-2 average spectra are inverted along the x-axis (red traces). The intensity for each panel is scaled to the most intense peak from the pair of spectra for a given matrix and tissue homogenate combination. In general, MALDI-1 spectra for the tissue homogenates are dominated by PC and SM lipids and this is reflected in the spectral profiles as they are relatively similar among the matrices when comparing MALDI-1 alone. In comparison with MALDI-2, MALDI-1 spectra for CHCA and DHA matrices have comparable signal intensity and spectral features and MALDI-2 does increase the number of species detected, but many of these species are relatively low in signal. In contrast, MALDI-2 for DHB and NOR show dramatic increases in both signal intensity and spectral complexity. MALDI-2 with NOR has been shown to produce many lipid-matrix adducts. Here, we also observe intense lipid-NOR adducts between m/z 800–900 (Figure 2, NOR, brain and Figure S3) but matrix adducts are only minimally detected in spectra with the other matrices tested. Spectra were compared to a lipid reference list to determine total number of identified lipids for each experiment, based on accurate mass measurements within +/− 2 ppm error.
Figure 2:
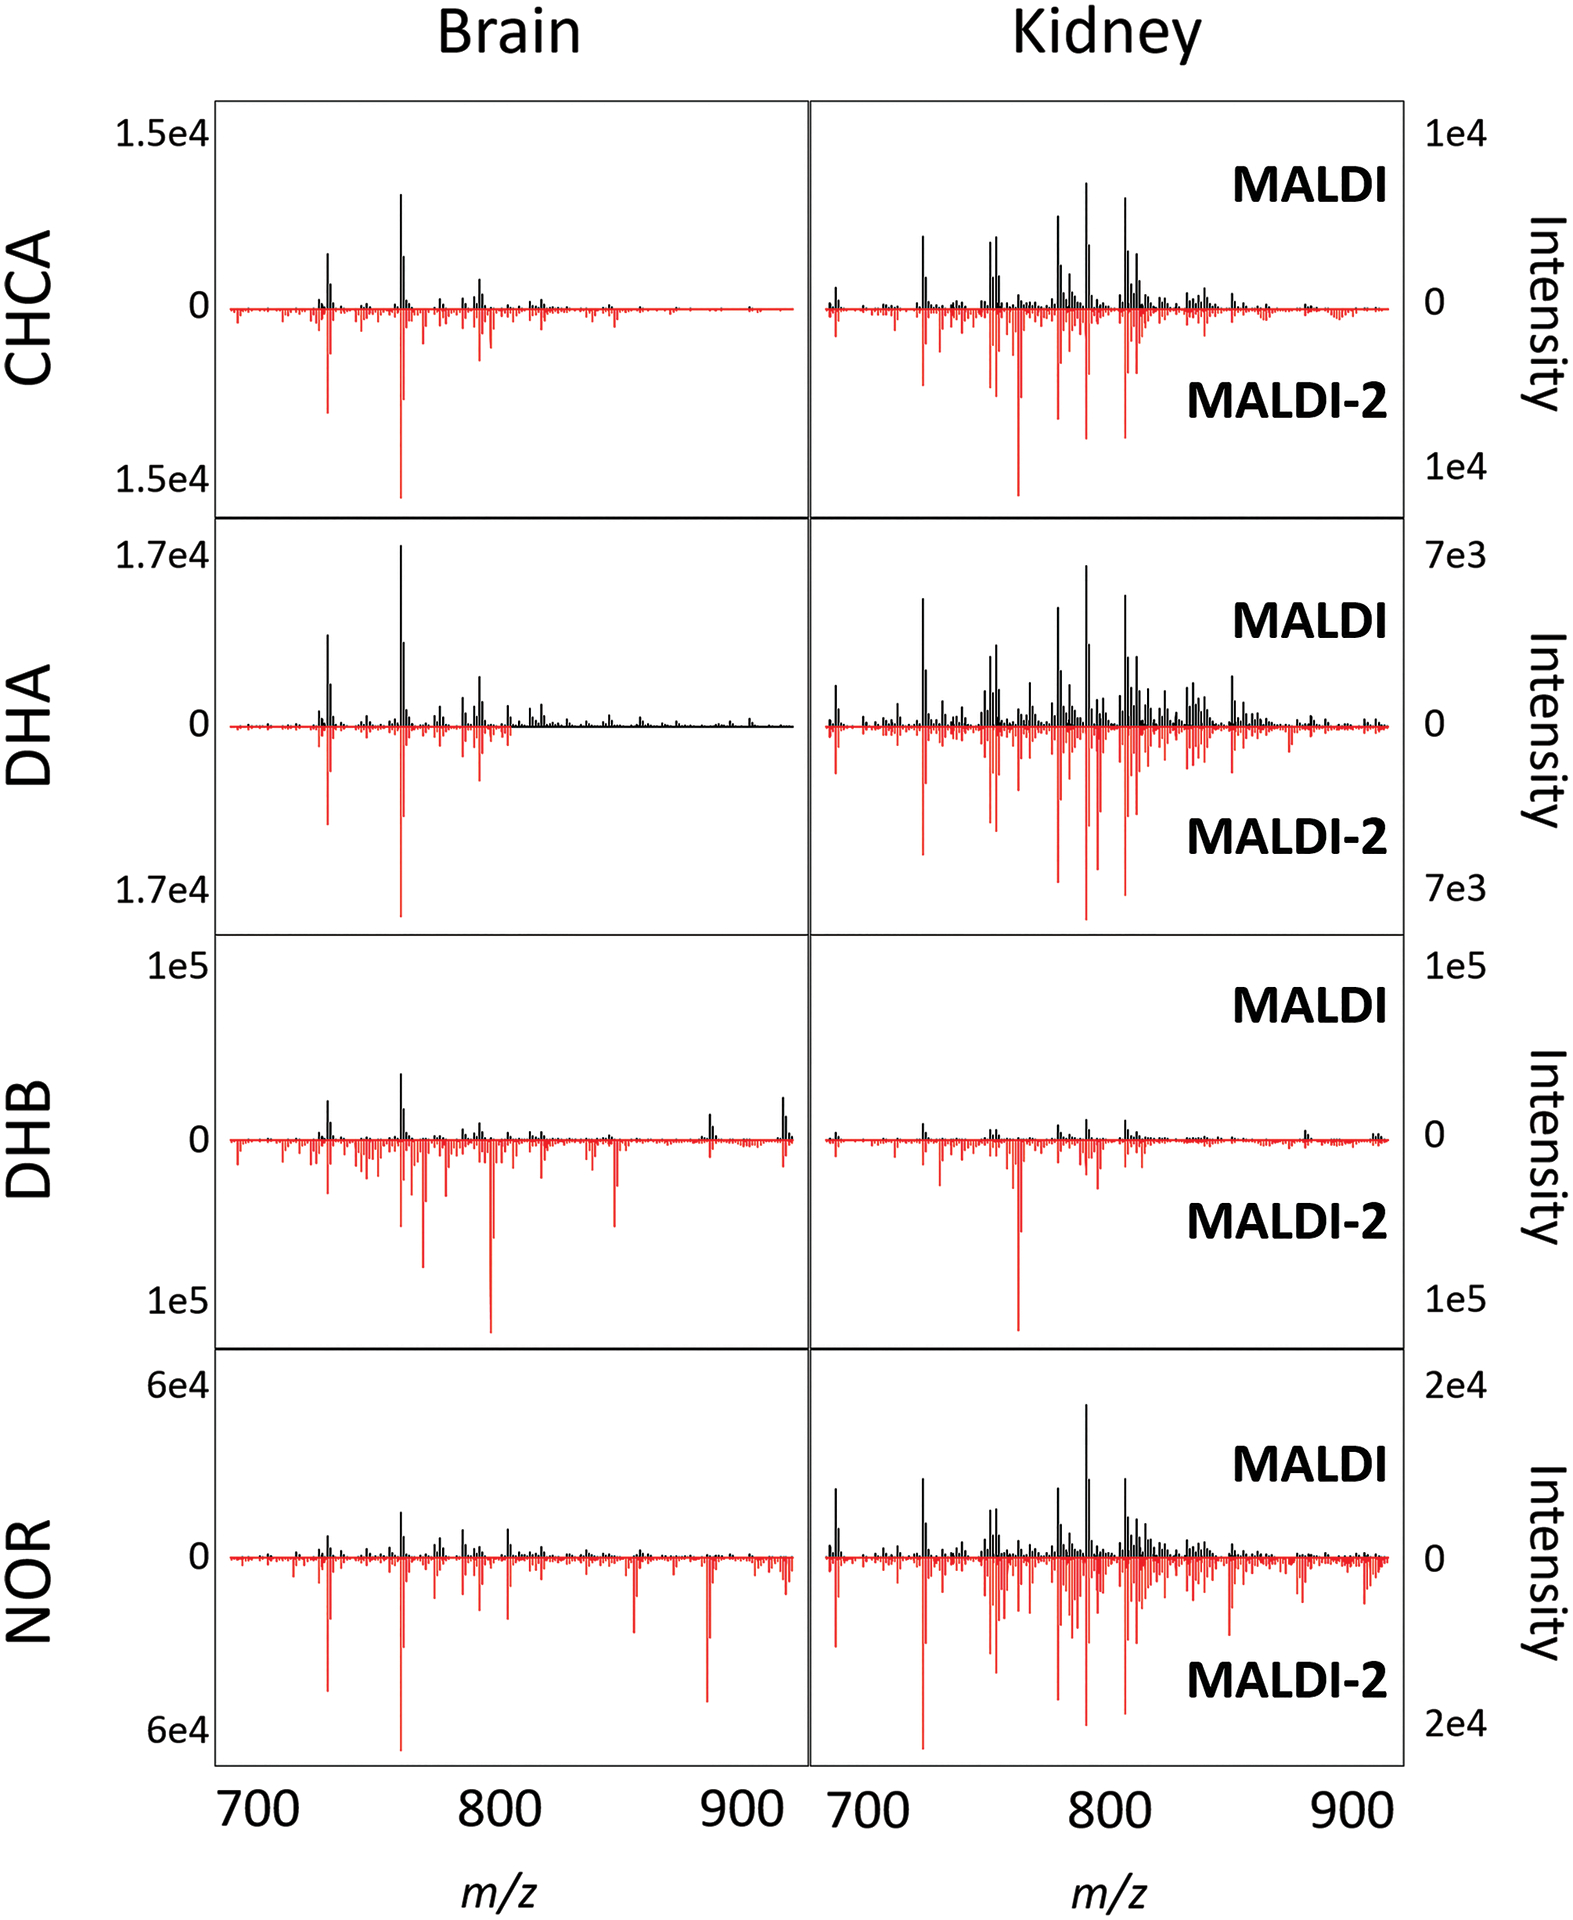
Overview spectra of rat brain and rat kidney tissue homogenates analyzed with MALDI-1 (black, top) and MALDI-2 (red, bottom) with CHCA, DHA, DHB, NOR matrices. Intensity is scaled to the base peak of MALDI-1 or MALDI-2 for each pair of spectra. Dramatic increases in lipid intensity with MALDI-2 may make MALDI-1 spectra seem insensitive (e.g. DHB, kidney, MALDI-1).
The total number of identified protonated lipids for each matrix and tissue homogenate was calculated as an average of the three technical replicates and is shown in Figure 3 for MALDI-1 (blue bars) and MALDI-2 (red bars). Error bars represent the standard deviation for the three replicates. Totals for sodiated, potassiated, and total unique lipids are shown in Figures S4–S6. Overall, MALDI-2 provides an increase in number of lipids detected compared with MALDI-1. The matrices CHCA and DHB both provided larger average increases in number of identified lipids with MALDI-2 (65 ± 23 and 76 ± 12, respectively) compared to DHA and NOR (32 ± 13 and 27 ±22, respectively). Note, these values were calculated by taking the average increase in the lipids detected for each matrix across all tissue types. These results indicate that the spectral complexity observed in the overview spectra with MALDI-2 is not simply a result of fragmentation or chemical noise but, at least in part, corresponds to an increase in sensitivity for lipids not commonly detected with MALDI-1 alone.
Figure 3:

Bar graphs of total protonated lipids identified with MALDI-1 (blue bars) and MALDI-2 (red bars) for the CHCA, DHA, DHB, NOR matrices and rabbit adrenal gland, rat brain, rat kidney, and rat liver tissue homogenates). Error bars represent the standard deviation of three technical replicate experiments.
With more complex samples as with tissue homogenates, ion suppression effects based on lipid class may affect ion yield.43 While NOR performed well with MALDI-2, DHB had the highest increase in lipids detected with MALDI-2 from the tissue homogenates compared with other matrices. The number of lipids detected in each lipid class for DHB and NOR is displayed in Figure 4. Data from CHCA and NOR matrices are shown in Figure S7. These data show the dramatic differences in ionization efficiency between the matrices. For example, MALDI-1 analysis of liver homogenate with DHB detects all lipid classes presented in Figure 4 but with NOR only 6/13 lipid classes are detected. With MALDI-2, NOR provides a significant increase in most neutral lipid classes (CE, MG, DG, TG), as expected based on performance of lipid standard mixture. DHB provides greatly improved sensitivity for phospholipids (PC, PE, PS, PI, PA, LPC, LPE). This global comparison of lipidomic profiles from various tissue types for each of the MALDI-1 matrices tested suggests that DHB and NOR are best suited for MALDI-2 studies, depending on lipid classes of interest. Further, differences in MALDI-2 lipid profiles show that specific matrices can be chosen to improve sensitivity for specific lipid classes. For the matrices tested here, NOR is optimal for non-polar lipid studies and DHB is better applied to increased sensitivity of phospholipids.
Figure 4:

Number of protonated lipids identified per lipid class for DHB and NOR matrices and for each of the four tissue homogenates with MALDI-1 (blue bars) and MALDI-2 (red bars). Error bars represent the standard deviation of three technical replicate experiments.
High Spatial Resolution MALDI-2 IMS: Improved Phospholipid Sensitivity using DHB
Based on the number of lipids tentatively identified from tissue homogenates, DHB was selected to demonstrate improved imaging performance of phospholipids using MALDI-2. Defined regions from a single rat kidney tissue section were selected for analysis with and without MALDI-2 activated. Prior to IMS, the tissue was imaged using autofluorescence microscopy to provide a high spatial resolution morphological image.57 The autofluorescence microscopy image clearly shows the various anatomical regions of the kidney including the renal pelvis, medulla, inner cortex and outer cortex (Figure 5A). Specified areas of the tissue were defined for MALDI-1 (white, top) and MALDI-2 (red, bottom) analysis. Averaged spectra of the acquired image regions were annotated similarly to the tissue homogenate experiments using mass accuracy (+/− 2 ppm mass tolerance). Compared with the rat kidney tissue homogenate, the MALDI-1 spectra had a comparable number or lipids identified (73 for homogenate, 72 for tissue) but the number of lipids identified with MALDI-2 for tissue were lower than for the homogenate (162 for homogenate, 125 for tissue). The number of lipids detected per lipid class for rat kidney tissue is shown in Figure S8. One explanation for lower number of identifications for the tissue section may be that there is greater variation in lipid concentrations from pixel-to-pixel within the intact tissue imaging experiment compared with the tissue homogenate. Still, a greater number of lipid species were detected with MALDI-2 compared with MALDI-1 alone and overall image quality was dramatically improved for many of the phospholipid species Figure 5 (B–E). Of the examples shown, the PS, PE, and PI lipids were detected with much greater sensitivity with MALDI-2 as compared to MALDI-1. In many cases no discernable image is detected with MALDI-1 but ion images with good S/N and spatial fidelity were generated with MALDI-2 activated. Briefly, [PE(38:5)+H]+ localizes to the medulla and, less so, the cortex. The species [PS(36:4)+H]+, which is only detected with MALDI-2, is found specifically in the medulla, renal pelvis, and the glomeruli that appear as punctate regions within the cortex of the kidney. In contrast, [PS(38:4)+H]+ is found at higher abundance in the inner and outer cortex. The species at m/z 887.564, identified as [PI(38:4)+H]+, is observed more ubiquitously throughout the kidney with seemingly higher abundance in the renal pelvis and inner cortex. Overall, DHB provided for a dramatic increase in sensitivity, molecular coverage, and image quality for phospholipid species. No signal improvements were observed for non-polar lipid species. These results corroborate our lipid standards and tissue homogenate experimental data.
Figure 5:

A) Autofluorescence image of rat kidney tissue with annotated substructures, and boxed regions indicating where MALDI-1 (white) and MALDI-2 (red) IMS data were collected. MALDI-1 and MALDI-2 IMS selected ion images for B) m/z 766.538 ((PE 38:5), [M+H]+), C) m/z 788.544 (PS(36:4) [M+H]+), D) m/z 812.544 ((PS 38:4), [M+H]+), and E) m/z 887.564 ((PI 38:4), [M+H]+). Ion intensity is relatively scaled from 0% (blue) to 100% (yellow). Ions are tentatively identified based on exact mass measurements (2ppm mass accuracy). Scale bars shown are 1 mm.
CONCLUSIONS
This study provides a systematic comparison of molecular coverage and sensitivity of protonated lipids between MALDI-1 and MALDI-2 for the matrices CHCA, DHA, DHB, and NOR. From MALDI-2 analysis of the equimolar, deuterated lipid standard mixture, NOR provided the broadest lipid coverage with all protonated forms of neutral lipids (TG, DG, MG, CE) detected, and DHB provided the greatest fold change increase with MALDI-2 for species already detected with MALDI-1. DHB provided the combination of greatest increase in the number of lipids detected as well as the greatest number of lipids detected with MALDI-2 for tissue homogenates and these results were confirmed in high resolution imaging experiments of rat kidney tissue. This study highlights the importance of matrix selection for MALDI-2 imaging MS experiments and the need to tune MALDI-2 sample preparation for specific molecular classes. Future work will be to determine MALDI-2 performance differences of common matrices in negative ion mode. These matrix-dependent effects are of interest as post-ionization strategies become more widely utilized and will require optimized methods to fully describe the molecular underpinnings of specific biological processes.
Supplementary Material
ACKNOWLEDGEMENTS
The authors would like to thank Dr. Martin Dufresne (Vanderbilt University) for providing tissue homogenate samples and Dr. Mikhail Belov (Spectroglyph LLC.) for providing technical support for the Spectroglyph ion source. Support for this work is provided by the NIH: National Institute of General Medical Sciences (P41GM103391) awarded to R.M.C. and NIH Common Fund and National Institute of Diabetes and Digestive and Kidney Diseases (U54DK120058) awarded to J.M.S. and R.M.C..
References
- [1].Caprioli RM, Farmer TB, Gile J. Molecular Imaging of Biological Samples: Localization of Peptides and Proteins Using MALDI-TOF MS. Anal. Chem 1997, 69, 4751–4760. [DOI] [PubMed] [Google Scholar]
- [2].Norris JL, Caprioli RM. Analysis of Tissue Specimens by Matrix-Assisted Laser Desorption/Ionization Imaging Mass Spectrometry in Biological and Clinical Research. Chem. Rev 2013, 113, 2309–2342. [DOI] [PMC free article] [PubMed] [Google Scholar]
- [3].Morgan TM, Seeley EH, Fadare O, Caprioli RM, Clark PE. Imaging the Clear Cell Renal Cell Carcinoma Proteome. J. Urol 2013, 189, 1097–1103. [DOI] [PMC free article] [PubMed] [Google Scholar]
- [4].Maccarrone G, Nischwitz S, Deininger S-O, Hornung J, König FB, Stadelmann C, Turck CW, Weber F. MALDI imaging mass spectrometry analysis—A new approach for protein mapping in multiple sclerosis brain lesions. J. Chromatogr. B 2017, 1047, 131–140. [DOI] [PubMed] [Google Scholar]
- [5].Sun C, Li Z, Ma C, Zang Q, Li J, Liu W, Zhao H, Wang X. Acetone immersion enhanced MALDI-MS imaging of small molecule metabolites in biological tissues. J. Pharm. Biomed. Anal 2019, 176, 112797. [DOI] [PubMed] [Google Scholar]
- [6].Yang B, Patterson NH, Tsui T, Caprioli RM, Norris JL. Single-Cell Mass Spectrometry Reveals Changes in Lipid and Metabolite Expression in RAW 264.7 Cells upon Lipopolysaccharide Stimulation. J. Am. Soc. Mass Spectrom 2018, 29, 1012–1020. [DOI] [PMC free article] [PubMed] [Google Scholar]
- [7].Dilillo M, Ait-Belkacem R, Esteve C, Pellegrini D, Nicolardi S, Costa M, Vannini E, De Graaf EL, Caleo M, McDonnell LA. Ultra-High Mass Resolution MALDI Imaging Mass Spectrometry of Proteins and Metabolites in a Mouse Model of Glioblastoma. Sci. Rep 2017, 7, 1–11. [DOI] [PMC free article] [PubMed] [Google Scholar]
- [8].Berry KAZ, Hankin JA, Barkley RM, Spraggins JM, Caprioli RM, Murphy RC. MALDI Imaging of Lipid Biochemistry in Tissues by Mass Spectrometry 2011,. [DOI] [PMC free article] [PubMed]
- [9].Spraggins JM, Rizzo DG, Moore JL, Noto MJ, Skaar EP, Caprioli RM. Next-generation technologies for spatial proteomics: Integrating ultra-high speed MALDI-TOF and high mass resolution MALDI FTICR imaging mass spectrometry for protein analysis. Proteomics 2016, 16, 1678–1689. [DOI] [PMC free article] [PubMed] [Google Scholar]
- [10].Swales JG, Dexter A, Hamm G, Nilsson A, Strittmatter N, Michopoulos F, Hardy C, Morentin-Gutierrez P, Mellor M, Andren PE, Clench MR, Bunch J, Critchlow SE, Goodwin RJA. Quantitation of Endogenous Metabolites in Mouse Tumors Using Mass-Spectrometry Imaging. Anal. Chem 2018, 90, 6051–6058. [DOI] [PubMed] [Google Scholar]
- [11].Holzlechner M, Reitschmidt S, Gruber S, Zeilinger S, Marchetti-Deschmann M. Visualizing fungal metabolites during mycoparasitic interaction by MALDI mass spectrometry imaging. Proteomics 2016, 16, 1742–1746. [DOI] [PMC free article] [PubMed] [Google Scholar]
- [12].Kriegsmann J, Kriegsmann M, Casadonte R. MALDI TOF imaging mass spectrometry in clinical pathology: A valuable tool for cancer diagnostics (review). Int. J. Oncol 2015, 46, 893–906. [DOI] [PubMed] [Google Scholar]
- [13].Spraggins JM, Schwamborn K, Heeren RMA, Eberlin LS. The importance of clinical tissue imaging. Clin. Mass Spectrom 2019, 12, 47–49. [DOI] [PMC free article] [PubMed] [Google Scholar]
- [14].Angel PM, Mehta A, Norris-Caneda K, Drake RR. MALDI Imaging Mass Spectrometry of N-glycans and Tryptic Peptides from the Same Formalin-Fixed, Paraffin-Embedded Tissue Section, in: Sarwal MM, Sigdel TK (Eds.), Tissue Proteomics Methods Protoc, Springer New York, New York, NY, 2018: pp. 225–241. [DOI] [PMC free article] [PubMed] [Google Scholar]
- [15].Mascini NE, Teunissen J, Noorlag R, Willems SM, Heeren RMA. Tumor classification with MALDI-MSI data of tissue microarrays: A case study. Methods 2018, 151, 21–27. [DOI] [PubMed] [Google Scholar]
- [16].Prentice BM, Caprioli RM, Vuiblet V. Label-free molecular imaging of the kidney. Kidney Int 2017, 92, 580–598. [DOI] [PMC free article] [PubMed] [Google Scholar]
- [17].Miyamoto S, Hsu CC, Hamm G, Darshi M, Diamond-Stanic M, Declèves AE, Slater L, Pennathur S, Stauber J, Dorrestein PC, Sharma K. Mass Spectrometry Imaging Reveals Elevated Glomerular ATP/AMP in Diabetes/obesity and Identifies Sphingomyelin as a Possible Mediator. EBioMedicine 2016, 7, 121–134. [DOI] [PMC free article] [PubMed] [Google Scholar]
- [18].Moore JL, Caprioli RM, Skaar EP. Advanced mass spectrometry technologies for the study of microbial pathogenesis. Curr. Opin. Microbiol 2014, 19, 45–51. [DOI] [PMC free article] [PubMed] [Google Scholar]
- [19].Cassat JE, Moore JL, Wilson KJ, Stark Z, Prentice BM, Van de Plas R, Perry WJ, Zhang Y, Virostko J, Colvin DC, Rose KL, Judd AM, Reyzer ML, Spraggins JM, Grunenwald CM, Gore JC, Caprioli RM, Skaar EP. Integrated molecular imaging reveals tissue heterogeneity driving host-pathogen interactions. Sci. Transl. Med 2018, 10,. [DOI] [PMC free article] [PubMed] [Google Scholar]
- [20].Lemaire R, Stauber J, Wisztorski M, Van Camp C, Desmons A, Deschamps M, Proess G, Rudlof I, Woods AS, Day R, Salzet M, Fournier I. Tag-Mass: Specific molecular imaging of transcriptome and proteome by mass spectrometry based on photocleavable tag. J. Proteome Res 2007, 6, 2057–2067. [DOI] [PMC free article] [PubMed] [Google Scholar]
- [21].Thiery-Lavenant G, Zavalin AI, Caprioli RM. Targeted Multiplex Imaging Mass Spectrometry in Transmission Geometry for Subcellular Spatial Resolution. J. Am. Soc. Mass Spectrom 2013, 24, 609–614. [DOI] [PMC free article] [PubMed] [Google Scholar]
- [22].Qiao L, Roussel C, Wan J, Kong J, Yang P, Girault HH, Liu B. MALDI In-Source Photooxidation Reactions for Online Peptide Tagging. Angew. Chemie Int. Ed 2008, 47, 2646–2648. [DOI] [PubMed] [Google Scholar]
- [23].Pashkova Anna, Moskovets A. Eugene, Karger BL. Coumarin Tags for Improved Analysis of Peptides by MALDI-TOF MS and MS/MS. 1 Enhancement in MALDI MS Signal Intensities. 2004,. [DOI] [PubMed] [Google Scholar]
- [24].Li N, Wang P, Liu X, Han C, Ren W, Li T, Li X, Tao F, Zhao Z. Developing IR-780 as a Novel Matrix for Enhanced MALDI MS Imaging of Endogenous High-Molecular-Weight Lipids in Brain Tissues. Anal. Chem 2019, 91, 15873–15882. [DOI] [PubMed] [Google Scholar]
- [25].Liu H, Zhou Y, Wang J, Xiong C, Xue J, Zhan L, Nie Z. N-Phenyl-2-naphthylamine as a Novel MALDI Matrix for Analysis and in Situ Imaging of Small Molecules. Anal. Chem 2018, 90, 729–736. [DOI] [PubMed] [Google Scholar]
- [26].Yang J, Norris JL, Caprioli R. Novel vacuum stable ketone-based matrices for high spatial resolution MALDI imaging mass spectrometry. J. Mass Spectrom 2018,. [DOI] [PubMed] [Google Scholar]
- [27].Thomas A, Patterson NH, Laveaux Charbonneau J, Chaurand P. Orthogonal organic and aqueous-based washes of tissue sections to enhance protein sensitivity by MALDI imaging mass spectrometry. J. Mass Spectrom 2013, 48, 42–48. [DOI] [PubMed] [Google Scholar]
- [28].Seeley EH, Oppenheimer SR, Mi D, Chaurand P, Caprioli RM. Enhancement of protein sensitivity for MALDI imaging mass spectrometry after chemical treatment of tissue sections. J. Am. Soc. Mass Spectrom 2008, 19, 1069–1077. [DOI] [PMC free article] [PubMed] [Google Scholar]
- [29].Wiegelmann M, Soltwisch J, Jaskolla TW, Dreisewerd K. Matching the laser wavelength to the absorption properties of matrices increases the ion yield in UV-MALDI mass spectrometry. Anal. Bioanal. Chem 2013, 405, 6925–6932. [DOI] [PubMed] [Google Scholar]
- [30].Karas M, Ehring H, Nordhoff E, Stahl B, Strupat K, Hillenkamp F, Grehl M, Krebs B. Matrix-assisted laser desorption/ionization mass spectrometry with additives to 2,5-dihydroxybenzoic acid. Org. Mass Spectrom 1993, 28, 1476–1481. [Google Scholar]
- [31].Tsai M-T, Lee S, Lu I-C, Chu KY, Liang C-W, Lee CH, Lee YT, Ni C-K. Ion-to-neutral ratio of 2,5-dihydroxybenzoic acid in matrix-assisted laser desorption/ionization. Rapid Commun. Mass Spectrom 2013, 27, 955–963. [DOI] [PubMed] [Google Scholar]
- [32].Knochenmuss R, Karbach V, Wiesli U, Breuker K, Zenobi R. The Matrix Suppression Effect in Matrix-assisted Laser Desorption/Ionization: Application to Negative Ions and Further Characteristics, 1998. https://onlinelibrary.wiley.com/doi/pdf/10.1002/%28SICI%291097-0231%2819980515%2912%3A9%3C529%3A%3AAID-RCM188%3E3.0.CO%3B2-E (accessed February 13, 2019).
- [33].Mowry CD, V Johnston M. Simultaneous Detection of Ions and Neutrals Produced by Matrix-assisted Laser Desorption, 1993. https://onlinelibrary.wiley.com/doi/pdf/10.1002/rcm.1290070702 (accessed May 30, 2019).
- [34].Soltwisch J, Kettling H, Vens-Cappell S, Wiegelmann M, Müthing J, Dreisewerd K. Mass spectrometry imaging with laser-induced postionization. Science (80-. ) 2015, 348, 211–215. [DOI] [PubMed] [Google Scholar]
- [35].Spengler B, Bahr U, Karas M, Hillenkamp F. Postionization of laser-desorbed organic and inorganic compounds in a time of flight mass spectrometer. Instrum. Sci. Technol 1988, 17, 173–193. [Google Scholar]
- [36].Ellis SR, Soltwisch J, Paine MRL, Dreisewerd K, Heeren RMA. Laser post-ionisation combined with a high resolving power orbitrap mass spectrometer for enhanced MALDI-MS imaging of lipids. Chem. Commun 2017, 53, 7246–7249. [DOI] [PubMed] [Google Scholar]
- [37].McMillen JC, Spivey EC, Ryan DJ, Spraggins JM, Caprioli RM. MALDI Spatial Resolution Improvment using MALDI-2 Post-Ionization, in: MALDI Spat. Resolut. Improv Using MALDI-2 Post-Ionization, Poster presentation at the American Society for Mass Spectrometry, Atlanta, GA, 2019. [Google Scholar]
- [38].Steven RT, Shaw M, Dexter A, Murta T, Green FM, Robinson KN, Gilmore IS, Takats Z, Bunch J. Construction and testing of an atmospheric-pressure transmission-mode matrix assisted laser desorption ionisation mass spectrometry imaging ion source with plasma ionisation enhancement. Anal. Chim. Acta 2019, 1051, 110–119. [DOI] [PubMed] [Google Scholar]
- [39].Hanley L, Wickramasinghe R, Yung YP. Laser Desorption Combined with Laser Postionization for Mass Spectrometry. Annu. Rev. Anal. Chem 2019, 12, annurev-anchem-061318–115447. [DOI] [PubMed] [Google Scholar]
- [40].Diologent L, Bolbach G, Focsa C, Ziskind M, Fournier I. Laser induced post-desolvation of MALDI clusters. Int. J. Mass Spectrom 2017, 416, 29–36. [Google Scholar]
- [41].Niehaus M, Soltwisch J. New insights into mechanisms of material ejection in MALDI mass spectrometry for a wide range of spot sizes. Sci. Rep 2018, 8, 7755. [DOI] [PMC free article] [PubMed] [Google Scholar]
- [42].Niehaus M, Soltwisch J, Belov ME, Dreisewerd K. Transmission-mode MALDI-2 mass spectrometry imaging of cells and tissues at subcellular resolution. Nat. Methods 2019, 16, 925–931. [DOI] [PubMed] [Google Scholar]
- [43].Boskamp MS, Soltwisch J. Charge distribution between different classes of glycerophospolipids in MALDI-MS imaging. Anal. Chem 2020,. [DOI] [PubMed] [Google Scholar]
- [44].Bowman AP, Bogie JFJ, Hendriks JJA, Haidar M, Belov M, Heeren RMA, Ellis SR. Evaluation of lipid coverage and high spatial resolution MALDI-imaging capabilities of oversampling combined with laser post-ionisation. Anal. Bioanal. Chem 2019,. [DOI] [PMC free article] [PubMed] [Google Scholar]
- [45].Barré FPY, Paine MRL, Flinders B, Trevitt AJ, Kelly PD, Ait-Belkacem R, Garcia JP, Creemers LB, Stauber J, Vreeken RJ, Cillero-Pastor B, Ellis SR, Heeren RMA. Enhanced sensitivity using maldi imaging coupled with laser postionization (maldi-2) for pharmaceutical research. Anal. Chem 2019, 91, 10840–10848. [DOI] [PMC free article] [PubMed] [Google Scholar]
- [46].Spivey EC, McMillen JC, Caprioli RM, Spraggins JM, Ryan DJ. Combining MALDI-2 and Transmission Geometry Laser Optics to Achieve High Sensitivity for Ultra-High Spatial Resolution Surface Analysis. J. Mass Spectrom 2019,. [DOI] [PubMed] [Google Scholar]
- [47].Groseclose MR, Castellino S. A Mimetic Tissue Model for the Quantification of Drug Distributions by MALDI Imaging Mass Spectrometry. Anal. Chem 2013, 85, 10099–10106. [DOI] [PubMed] [Google Scholar]
- [48].Angel PM, Spraggins JM, Baldwin HS, Caprioli R. Enhanced Sensitivity for High Spatial Resolution Lipid Analysis by Negative Ion Mode Matrix Assisted Laser Desorption Ionization Imaging Mass Spectrometry. Anal. Chem 2012, 84, 1557–1564. [DOI] [PMC free article] [PubMed] [Google Scholar]
- [49].Strohalm M, Hassman M, Košata B, Kodíček M. mMass data miner: An open source alternative for mass spectrometric data analysis. Rapid Commun. Mass Spectrom 2008, 22, 905–908. [DOI] [PubMed] [Google Scholar]
- [50].Huizing LRS, Ellis SR, Beulen BWAMM, Barré FPY, Kwant PB, Vreeken RJ, Heeren RMA. Development and evaluation of matrix application techniques for high throughput mass spectrometry imaging of tissues in the clinic. Clin. Mass Spectrom 2019, 12, 7–15. [DOI] [PMC free article] [PubMed] [Google Scholar]
- [51].Chumbley CW, Reyzer ML, Allen JL, Marriner GA, Via LE, Barry CE, Caprioli RM. Absolute Quantitative MALDI Imaging Mass Spectrometry: A Case of Rifampicin in Liver Tissues. Anal. Chem 2016, 88, 2392–2398. [DOI] [PMC free article] [PubMed] [Google Scholar]
- [52].Takai N, Tanaka Y, Saji H. Quantification of Small Molecule Drugs in Biological Tissue Sections by Imaging Mass Spectrometry Using Surrogate Tissue-Based Calibration Standards. Mass Spectrom 2014, 3, A0025–A0025. [DOI] [PMC free article] [PubMed] [Google Scholar]
- [53].Jadoul L, Longuespée R, Noël A, De Pauw E. A spiked tissue-based approach for quantification of phosphatidylcholines in brain section by MALDI mass spectrometry imaging. Anal. Bioanal. Chem 2015, 407, 2095–2106. [DOI] [PubMed] [Google Scholar]
- [54].Dufresne M, Patterson NH, Norris JL, Caprioli RM. Combining Salt Doping and Matrix Sublimation for High Spatial Resolution MALDI Imaging Mass Spectrometry of Neutral Lipids. Anal. Chem 2019, 91, 12928–12934. [DOI] [PubMed] [Google Scholar]
- [55].Dufresne M, Masson JF, Chaurand P. Sodium-Doped Gold-Assisted Laser Desorption Ionization for Enhanced Imaging Mass Spectrometry of Triacylglycerols from Thin Tissue Sections. Anal. Chem 2016, 88, 6018–6025. [DOI] [PubMed] [Google Scholar]
- [56].Barry JA, Groseclose MR, Fraser DD, Castellino S. Revised Preparation of a Mimetic Tissue Model for Quantitative Imaging Mass Spectrometry. Protoc. Exch 2018,. [Google Scholar]
- [57].Patterson NH, Tuck M, Van de Plas R, Caprioli RM. Advanced Registration and Analysis of MALDI Imaging Mass Spectrometry Measurements through Autofluorescence Microscopy. Anal. Chem 2018, 90, 12395–12403. [DOI] [PubMed] [Google Scholar]
Associated Data
This section collects any data citations, data availability statements, or supplementary materials included in this article.