

Abstract
Background
There is growing interest in paying for performance (P4P) as a means to align the incentives of healthcare providers with public health goals. Rigorous evidence on the effectiveness of these strategies in improving health care and health in low‐ and middle‐income countries (LMICs) is lacking; this is an update of the 2012 review on this topic.
Objectives
To assess the effects of paying for performance on the provision of health care and health outcomes in low‐ and middle‐income countries.
Search methods
We searched CENTRAL, MEDLINE, Embase, and 10 other databases between April and June 2018. We also searched two trial registries, websites, online resources of international agencies, organizations and universities, and contacted experts in the field. Studies identified from rerunning searches in 2020 are under 'Studies awaiting classification.'
Selection criteria
We included randomized or non‐randomized trials, controlled before‐after studies, or interrupted time series studies conducted in LMICs (as defined by the World Bank in 2018). P4P refers to the transfer of money or material goods conditional on taking a measurable action or achieving a predetermined performance target. To be included, a study had to report at least one of the following outcomes: patient health outcomes, changes in targeted measures of provider performance (such as the delivery of healthcare services), unintended effects, or changes in resource use.
Data collection and analysis
We extracted data as per original review protocol and narratively synthesised findings. We used standard methodological procedures expected by Cochrane. Given diversity and variability in intervention types, patient populations, analyses and outcome reporting, we deemed meta‐analysis inappropriate. We noted the range of effects associated with P4P against each outcome of interest. Based on intervention descriptions provided in documents, we classified design schemes and explored variation in effect by scheme design.
Main results
We included 59 studies: controlled before‐after studies (19), non‐randomized (16) or cluster randomized trials (14); and interrupted time‐series studies (9). One study included both an interrupted time series and a controlled before‐after study.
Studies focused on a wide range of P4P interventions, including target payments and payment for outputs as modified by quality (or quality and equity assessments). Only one study assessed results‐based aid. Many schemes were funded by national governments (23 studies) with the World Bank funding most externally funded schemes (11 studies). Targeted services varied; however, most interventions focused on reproductive, maternal and child health indicators. Participants were predominantly located in public or in a mix of public, non‐governmental and faith‐based facilities (54 studies). P4P was assessed predominantly at health facility level, though districts and other levels were also involved.
Most studies assessed the effects of P4P against a status quo control (49 studies); however, some studies assessed effects against comparator interventions (predominantly enhanced financing intended to match P4P funds (17 studies)). Four studies reported intervention effects against both comparator and status quo.
Controlled before‐after studies were at higher risk of bias than other study designs. However, some randomised trials were also downgraded due to risk of bias. The interrupted time‐series studies provided insufficient information on other concurrent changes in the study context.
P4P compared to a status quo control
For health services that are specifically targeted, P4P may slightly improve health outcomes (low certainty evidence), but few studies assessed this. P4P may also improve service quality overall (low certainty evidence); and probably increases the availability of health workers, medicines and well‐functioning infrastructure and equipment (moderate certainty evidence). P4P may have mixed effects on the delivery and use of services (low certainty evidence) and may have few or no distorting unintended effects on outcomes that were not targeted (low‐certainty evidence), but few studies assessed these. For secondary outcomes, P4P may make little or no difference to provider absenteeism, motivation or satisfaction (low certainty evidence); but may improve patient satisfaction and acceptability (low certainty evidence); and may positively affect facility managerial autonomy (low certainty evidence). P4P probably makes little to no difference to management quality or facility governance (low certainty evidence). Impacts on equity were mixed (low certainty evidence).
For health services that are untargeted, P4P probably improves some health outcomes (moderate certainty evidence); may improve the delivery, use and quality of some health services but may make little or no difference to others (low certainty evidence); and may have few or no distorting unintended effects (low certainty evidence). The effects of P4P on the availability of medicines and other resources are uncertain (very low certainty evidence).
P4P compared to other strategies
For health outcomes and services that are specifically targeted, P4P may make little or no difference to health outcomes (low certainty evidence), but few studies assessed this. P4P may improve service quality (low certainty evidence); and may have mixed effects on the delivery and use of health services and on the availability of equipment and medicines (low certainty evidence).
For health outcomes and services that are untargeted, P4P may make little or no difference to health outcomes and to the delivery and use of health services (low certainty evidence). The effects of P4P on service quality, resource availability and unintended effects are uncertain (very low certainty evidence).
Findings of subgroup analyses
Results‐based aid, and schemes using payment per output adjusted for service quality, appeared to yield the greatest positive effects on outcomes. However, only one study evaluated results‐based aid, so the effects may be spurious. Overall, schemes adjusting both for quality of service and rewarding equitable delivery of services appeared to perform best in relation to service utilization outcomes.
Authors' conclusions
The evidence base on the impacts of P4P schemes has grown considerably, with study quality gradually increasing. P4P schemes may have mixed effects on outcomes of interest, and there is high heterogeneity in the types of schemes implemented and evaluations conducted. P4P is not a uniform intervention, but rather a range of approaches. Its effects depend on the interaction of several variables, including the design of the intervention (e.g., who receives payments ), the amount of additional funding, ancillary components (such as technical support) and contextual factors (including organizational context).
Plain language summary
Paying for performance to improve the delivery of healthcare services in low‐ and middle‐income countries
The aim of this Cochrane Review was to assess the effects of ‘pay for performance’ on the delivery of healthcare services in low‐ and middle‐income countries. The review authors collected and analysed all relevant studies to answer this question and found 59 studies.
Key messages
The studies included in this review looked at pay for performance approaches that varied in their design, setting and implementation. The review shows that pay for performance may have both positive and negative effects on the health services it targets. It may also have positive effects on other health services that are not directly targeted and may have no unintended negative effects on these services. However, most of this evidence is of low certainty and we need more, well‐conducted studies on this topic.
What is ‘pay for performance’?
In a 'pay for performance' approach, people are given money or other rewards if they carry out a particular task or meet a particular target. Pay for performance is usually directed at health workers or healthcare facilities. The health workers or healthcare facilities are rewarded if they offer particular services or deliver care that is of a certain quality, or if their patients use particular services and achieve better health as a result.
Pay for performance can be used to target specific health problems and services that need improvement. But pay for performance could also affect other services that are not specifically targeted. For instance, it could lead health workers to improve the quality of the other services they deliver. But it could also lead them to avoid services that don’t lead to extra payment. To find out more, the review authors assessed the effects of paying for performance on both targeted and untargeted services. This included looking for any unintended effects.
What are the main results of the review?
The review included 59 relevant studies. Most were from sub‐Saharan Africa and Asia. Most of the pay for performance schemes in the studies were funded by national Ministries of Health, also with support of the World Bank.
Forty‐nine studies compared health facilities that used pay for performance with health facilities that were doing business as usual. Seventeen studies compared health facilities that used pay for performance with facilities that used other approaches. In most of these studies, these approaches involved giving similar amount of funds but without insisting on a pay for performance element.
The effects of paying for performance compared to business as usual
For health services that are specifically targeted, pay for performance:
‐ may improve some health outcomes, may improve service quality and probably increase the availability of health workers, medicines and well‐functioning infrastructure and equipment; but
‐ may have both positive and negative effects on the delivery and use of health services.
For health services that are untargeted, pay for performance:
‐ probably improves some health outcomes;
‐ may improve the delivery, use and quality of some health services but may make little or no difference to others; and
‐ may have few or no unintended effects.
We don’t know what the effects of pay for performance are on the availability of medicines and other resources because the evidence was of very low certainty
The effects of paying for performance compared to other approaches
For health outcomes and services that are specifically targeted, pay for performance:
‐ may improve service quality;
‐ may make little or no difference to health outcomes; and
‐ may have both positive and negative on the delivery and use of health services and on the availability of equipment and medicines.
For health outcomes and services that are untargeted, pay for performance:
‐ may make little or no difference to health outcomes and to the delivery and use of health services.
We don’t know what the effects of pay for performance are on service quality, on the availability of resources, and on unintended effects because the evidence was missing or of very low certainty
How up to date is this review?
The review authors included studies that had been published up to April 2018.
Summary of findings
Background
Description of the condition
Improving the performance of healthcare delivery systems is an important objective, both in high‐income settings and, even more critically, in low‐ and middle‐income country (LMIC) settings, where resources for health are much more constrained. Performance‐based payment (paying for performance; P4P) has received increased attention as a strategy for improving the performance of healthcare providers, organizations and governments since the early 2010s. It is also promoted as an important tool for wider health system reforms (Meessen 2011; Soucat 2017). However, the last Cochrane Review found limited rigorous evidence on its effectiveness (Witter 2012), and, while there has been a growth in studies of P4P since that review, there is a gap in relation to synthesised evidence of its effectiveness in different contexts and for different services in LMICs.
Description of the intervention
P4P refers to the transfer of money or material goods conditional on taking a measurable action or achieving a predetermined performance target (Eichler 2006). P4P is also referred to as results‐based funding (RBF), performance‐based funding (PBF) and output‐based aid (OBA). While P4P is a relatively simple concept, it includes a wide range of interventions that vary with respect to the level at which the incentives are targeted (recipients of health care, individual providers of health care, healthcare facilities, private sector organizations, public sector organizations and national or subnational levels) and the type of reward (payment based on fee‐for‐service, other monetary payments and non‐monetary rewards) (Musgrove 2011). P4P interventions can also reward a wide range of measurable actions, including health outcomes, delivery of effective interventions (e.g. immunization), utilization of services (such as antenatal visits or births at an accredited facility) and quality of care. P4P interventions typically also includes ancillary components such as increasing the availability of resources to health care, education, supplies, technical support or training, monitoring and feedback, increasing health worker pay, construction of new facilities, improvements in planning and management, or information systems (Oxman 2008).
While it is conceivable that pay increases designed to increase motivation and retention of staff might fall within this definition, in this review we focused on reforms that are explicitly linked to changing patterns of activity, output or outcome indicators (thus excluding routine changes to pay or public funding flows, or user fee regimens). Another systematic review has addressed the use of conditional cash transfers for service users (demand‐side P4P) for improving the uptake of health interventions in LMICs (Lagarde 2011, currently being updated). Therefore, our review focuses on updating the evidence originally appraised by Witter and colleagues in 2012 of the impacts of supply‐side P4P aimed at improving the delivery of health interventions (Witter 2012). In this review, P4P includes both P4P schemes (including ancillary components) and P4P per se (where any ancillary components are controlled for).
How the intervention might work
P4P by individuals is not new – it has taken the form of user fees, and in many LMICs it remains one of the main forms of health financing. However, public funding for health has commonly taken the form of budget flows, which are linked to indicators such as staffing levels or bed numbers (for facilities), inputs (such as estimated drug needs), population numbers (for regions and districts, in some cases) and also historical trends in expenditure (all modified by overall budget constraints).
These bureaucratic mechanisms offer the advantage of stability and predictability, and rely on local clinical judgement as to how and what services to offer. However, the disadvantage is that health systems based on budget funding and salaried staff can lack incentives to improve quality, increase outputs and improve outcomes. P4P aims to reintroduce those incentives by linking pay (at individual or facility level) to desired activities or outcome indicators, or both. It may in addition increase resources (by providing supplementary funding) or may be an alternative mechanism for channelling existing funding resources (substituting for existing funds).
In Organisation for Economic Co‐operation and Development (OECD) countries, P4P is generally described as a tool for improving performance and accountability (Cashin 2014; Christianson 2007). However, in LMICs, it can have wider objectives (Witter 2009; Witter 2013). These include:
increasing the allocative efficiency of health services (by encouraging the provision of high‐priority and cost‐effective services);
increasing the technical efficiency (by making better use of existing resources such as health staff);
improving equity of outcomes (e.g. by encouraging expansion of services to difficult‐to‐reach groups).
Other researchers emphasise the potential of P4P to transform health sectors, introducing client‐oriented public finance models inspired by the new public management mode (Meessen 2011). A review of the potential mechanisms of change for P4P emphasises their complexity, the lack of consensus on how P4P might work, and the importance of local norms and values in how P4P will function (Renmans 2016).
Paying providers for performance is clearly premised on the assumption that a change in behaviour on the provider side is required for allocative and technical efficiency and equity of outcomes to change. However, if substantive demand‐side barriers exist (such as low affordability of services), then P4P for providers alone will not be effective.
Paying providers for performance in LMICs can operate at several levels. It can be offered directly to community health workers or to professional health workers (in public, private or private not‐for‐profit sectors) or to facilities. It can be used to set budgets or supplement budgets at higher organizational units, such as health districts or regions. It can also be used at national level, in particular by donor organizations negotiating aid to a national health sector. Clearly, incentives would be expected to operate differently at these different levels: incentives to individuals are likely to be more directly motivating (incentives to organizations only affect behaviour indirectly, if passed on in some way to individuals), but may undermine co‐operation (unlike organizational incentives, which might be expected to reinforce co‐operation).
It seems intuitive that paying more money for the delivery of effective services will improve health care, but health care does not operate like a classic free market. Human behaviour is complex and there are many theories that attempt to explain both health behaviour and professional behaviour. The principal‐agent theory addresses relationships where one individual (the patient) cannot directly observe or know the level of skill or effort expended by the other individual (the professional) doing the contracted work. Patients do not have perfect knowledge of their medical condition, their need for care or the expected outcome of healthcare services. Therefore, they are willing to have healthcare professionals act as their agents in providing information and services and patient demand for health care may be unresponsive to technical quality. One theoretical advantage of performance pay is that explicit financial incentives are provided even when patient demand for health care is unresponsive to quality. In other words, professional effort in providing high quality is rewarded, regardless of whether patients recognize it. This theoretical advantage relies, however, on a host of assumptions, including the ability to assess quality, the linkage of P4P systems with quality measures and the absence of adverse consequences. Moreover, in LMICs in particular, P4P is being deployed for a wide range of reasons other than improving quality. It is envisaged more ambitiously as a tool to increase the responsiveness of staff and the health system generally to priority areas, and in some settings is the main funding mechanism for primary care (Witter 2019a).
It is also important to note that although financial incentives and healthcare payment systems are likely to have an important influence on professional behaviour, this influence is far from exclusive. In economic terms, professionals are viewed as maximizing their utility function (i.e. their well‐being). Important factors in their utility function, besides income, include professional and social status (or self‐image), altruism (doing what they perceive to be best for their patients), the burden of efforts to change their behaviour and their uncertainty about the benefits of changing their behaviour. Moreover, there may be other barriers to changing professional behaviour, even when professionals are motivated, including patient factors, lack of time, lack of technical skills, lack of resources and organizational constraints.
It is generally accepted that professionals are motivated by the satisfaction of doing their jobs well (intrinsic motivation). Indeed, it is doubtful whether some valued but difficult‐to‐observe dimensions of quality (such as empathy or listening in the medical encounter) would be provided at all if physicians were solely interested in income. Therefore, health professionals have both monetary and non‐monetary incentives, all of which affect their performance. It is possible that financial incentives may dilute professionals' intrinsic motivation and this is the subject of widespread debate around public sector motivation in higher‐income countries (Marquand 2004). Psychological studies also highlight the risks to intrinsic motivation of extrinsic rewards (Deci 1999). The risk of coercion for patients – for example, when specific family planning methods are incentivized – is also highlighted by some studies (e.g. Blacklock 2016). In contrast, where health workers' pay is low in absolute terms, incentives may be an important channel to improve motivation through increasing their income levels. There is a small but growing literature on the effects of P4P on provider motivation, the results of which are so far ambiguous (e.g. Dale 2014), highlighting the importance of understanding different contexts and models.
The timescale of evaluation is another important consideration. Financial incentives might be effective in the short run for simple and distinct, well‐defined behavioural goals, but these are not necessarily sustained in the longer term. Some studies have now focused on the period after the end of P4P programmes, giving a longer‐term perspective on their effects (Huillery 2014). P4P schemes are often accompanied by ancillary features, such as training initiatives and enhanced supervision arrangements. When P4P schemes including these features are compared to no intervention, it may be impossible to disentangle the impact of P4P per se from the impact of these ancillary components. It is also important to capture systemic effects, where possible: P4P is increasingly recognized to be a complex package of measures, influenced by and potentially influencing the wider health system (Witter 2013).
Why it is important to do this review
The first systematic review of the impacts of supply‐side P4P in LMICs was published in 2012, and found the evidence base to be weak (Witter 2012). Since then, the number of P4P programmes in LMICs has expanded considerably, as have the number of studies examining different aspects of these programmes. In particular, the World Bank‐managed Health Results Innovation Trust Fund has spent USD 307.1 million on programmes in 28 countries and supported 24 impact evaluations alongside these programmes (RBF Health 2020). With this growth in interest, funding and potentially robust studies, it is timely to review the evidence base.
While reviews of schemes in high‐income countries can help to inform decisions in LMICs, there are several reasons for undertaking a review of the impacts of P4P in LMICs specifically. The potential benefits, harms and costs of P4P may be greater in LMICs, where there are fewer resources than in high‐income countries, weak health systems, inadequate supplies, facilities and human resources, and greater inequities, and where P4P schemes are often introduced by donors and include ancillary components, such as increased resources and technical support.
P4P is a complex intervention with uncertain benefits and potential harms. It may, for example, lead to the concentration of resources in areas where targets are easier to meet (which typically are better served areas), thus increasing inequity of provision, or lead to neglect of unincentivized services. The extent to which benefits attributed to P4P in LMICs are attributable to conditionality (versus ancillary components of P4P schemes in LMICs, such as increased resources and technical support) is also uncertain. P4P may not be a good use of resources, even when it is effective, due to potentially small effects and high costs. For these reasons, an updated systematic review of evaluations of the impacts of P4P is needed to inform decisions about whether and when to use P4P, how to design these schemes, and how to monitor and evaluate them in LMICs.
Objectives
To assess the effects of paying for performance on the provision of health care and health outcomes in low‐ and middle‐income countries.
Methods
Criteria for considering studies for this review
Types of studies
A brief outline of inclusion and exclusion criteria follows; a full list of exclusion reasons is available in Appendix 3.
The review includes:
randomized trials;
non‐randomized trials (experimental studies in which people were allocated to different interventions using methods that were not random);
-
controlled before‐after (CBA) studies where:
at least two clusters were included in each comparison group;
pre‐ and postintervention periods for study and control groups were the same;
choice of the control site was appropriate (i.e. sites had similar socioeconomic characteristics or there were no major differences evident in the baseline groups, or both);
interrupted time series (ITS) studies with at least three measurements before and after introducing the intervention.
Well‐designed cluster‐randomized trials protect against selection bias and are likely to provide the most rigorous estimates of the impacts of P4P schemes. However, cluster‐randomized trials may not be practical for evaluating some P4P schemes (e.g. when there is simultaneous system‐wide implementation). Although CBA studies are often at high risk of bias, we believe it is important, at least at this time, to include these studies. ITS studies may be problematic due to changes in information systems and the reliability of information systems used in P4P schemes in LMICs. However, they potentially have a lower risk of bias than CBA studies. Other study designs may provide useful information about acceptability, potential effects or explanations for observed effects of P4P, but are unlikely to provide useful estimates of the impact of P4P on the main outcomes of this review.
Types of participants
Participants in P4P schemes include providers of healthcare services (health workers and facilities), subnational organizations (health administrations, non‐governmental organizations or local governments), national governments and combinations of these. We included all sectors (public, private and private not‐for‐profit) in the review.
Types of interventions
P4P takes three main forms.
Conditional cash payment.
Conditional provision of material goods.
Target payments (payments for reaching a certain level of coverage, which can be defined in absolute terms or relative to a starting point).
We have included evaluations of P4P schemes (including ancillary components) compared to any alternative (including non‐conditional financial incentives and different levels of conditional financial incentives). We have included comparisons with alternatives where there may be differences in ancillary components, such as increased resources, as well as differences in P4P.
We excluded studies in which:
the primary focus of the financing scheme was the demand‐side of healthcare (e.g. conditional cash transfers targeted at specific population groups) or where demand‐side interventions were purposefully run concurrently with a P4P intervention but effects of the latter could not be untangled;
payment to health workers or facilities not explicitly linked to changing patterns of performance (e.g. for coming to work; salary increases; routine increases in activity‐based payments such as diagnosis‐related groups (DRGs) or fees for service; or changes to budget flows that were routine or intended to motivate, but without being conditional on specific activity or output measures).
We listed studies for which full‐texts could not be obtained under Studies awaiting classification.
Types of outcome measures
Primary outcomes
To be included, a study must have reported at least one of the following outcomes:
patient health outcomes (e.g. mortality rates, treatment success);
changes in targeted measures of provider performance, such as the utilization, delivery or quality of healthcare services;
unintended effects, including motivating unintended behaviours, distortions (ignoring important tasks that were not rewarded with incentives), 'cherry‐picking'/'cream‐skimming' (prioritizing patients that were most profitable over those who released fewer financial rewards), gaming (improving or cheating on reporting rather than improving performance), increased inequities and dependency on financial incentives;
changes in resource use, including for incentives, administration and services.
Secondary outcomes
We included the following outcomes if reported in included studies or in publications or reports ancillary to the main impact evaluation:
impacts on provider motivation, satisfaction, absenteeism and acceptability;
impacts on patient satisfaction and acceptability (such as satisfaction scores);
impacts on overall financing or resource allocation;
impacts on management or information systems (if not a targeted measure of performance);
equity consideration: evidence of differential impact on different parts of the population.
Given the focus on effectiveness, we excluded the results of qualitative studies conducted alongside impact evaluations. However, we included estimates of health economic evaluations conducted alongside impact evaluations as they report on changes in resource use linked to P4P schemes.
Search methods for identification of studies
Electronic searches
We conducted searches for all studies between April 2018 and June 2018 and updated them in 2020. Studies from the initial 2018 search are incorporated in this review. Studies identified in subsequent search updates have been marked as relevant and are listed under Studies awaiting classification.
We searched the following electronic databases.
The Cochrane Central Register of Controlled Trials (CENTRAL) 2018, Issue 3, part of the Cochrane Library (searched 10 April 2018);
MEDLINE Epub Ahead of Print, In‐Process & Other Non‐Indexed Citations, MEDLINE Daily and MEDLINE 1946 to present, Ovid (searched10 April 2018);
Embase 1974 to 2018 April 09, Ovid (searched 10 April 2018);
PsycINFO 1806 to April Week 1 2018, Ovid (searched 10 April 2018);
EconLit 1886 to present, EBSCOhost (searched 27 April 2018);
LILACS, Virtual Health Library (VHL) (searched 10 April 2018);
WHOLIS, Virtual Health Library (VHL) (searched 10 April 2018).
We revised the original review protocol to expand the number of databases searched. For this review update, we also searched:
CINAHL 1981 to present, EBSCOhost (searched 10 April 2018);
3ie Database of Impact Evaluations (searched 7 June 2018);
BLDS British Library for Development Studies (searched 18 June 2018);
Global Health 1973 to present, Ovid (searched 27 April 2018).
We searched two grey literature databases in June 2018:
The Grey Literature Report (www.greylit.org/);
OpenGrey (www.opengrey.eu/).
We searched two trial registries in June 2018:
International Clinical Trials Registry Platform (ICTRP), World Health Organization (WHO) (www.who.int/ictrp/en/);
ClinicalTrials.gov, US National Institutes of Health (NIH) (clinicaltrials.gov/).
We did not search International Pharmaceutical Abstracts, so it is possible that studies relating to pharmaceuticals were missed. However, the general searches, including in websites focused on this topic, did not suggest that we had missed any relevant studies.
We developed strategies that incorporated the methodological component of the Effective Practice and Organisation of Care (EPOC) search strategy combined with selected index terms and free‐text terms. The updated search strategy incorporated new terms recently cited in the literature to describe pay for performance interventions. We placed no language or date restrictions on the search strategy. We translated the MEDLINE search strategy into the other databases using the appropriate controlled vocabulary and applied filters related to study design and setting (LMICs).
See Appendix 4 for the full search strategies for all databases.
Searching other resources
We contacted international experts in the field, including the authors of relevant articles that were retrieved. We asked them to identify additional websites, experts, academic (or other) institutions active in this field, as well as additional relevant studies.
In addition, we searched the websites of organizations likely to be active in the field in May 2018 and June 2018 (and checked for update in November to December 2020), including: the World Bank; RBF Health; the African Development Bank; the Inter‐American Development Bank; US Agency for International Development (USAID); CORDAID; Management Sciences for Health (MSH); Centre for Global Development; WHO; Swiss Tropical and Public Health Institute (Swiss TPH); Deutsche Gesellschaft für Technische Zusammenarbeit (GTZ); KfW Entwicklungsbank; Department for International Development (DFID); The Global Alliance for Vaccines and Immunization (GAVI); The Global Fund to Fight AIDS, Tuberculosis and Malaria; Asian Development Bank and Pan American Health Organization (PAHO).
In 2018 (and for the 2020 update), we additionally searched the websites of academic institutions active in this field, such as the London School of Hygiene and Tropical Medicine, the Harvard School of Public Health, University of Cape Town, Institute of Policy Studies of Sri Lanka (IPS), the Kenya Institute of Policy Analysis and Research (IPAR) and Institute of Tropical Medicine, Belgium. Given the sparse results obtained from these sources, we revised the list of websites to be searched for updates in December 2019. Updated searches included websites of the University of Heidelberg, University of Bergen and University of Rotterdam.
We additionally conducted a Web of Science citation search in June 2019 for the studies included in the review and checked references from included studies and other relevant articles, to identify other relevant studies that met the inclusion criteria.
Data collection and analysis
Selection of studies
Two review authors independently screened abstracts to identify studies that met the inclusion criteria. We retrieved the full‐text of studies selected as meeting or possibly meeting the criteria and two review authors independently rechecked them and produced a final list of included studies.
Data extraction and management
One review author carried out data extraction using a modified version of the Cochrane EPOC Group data collection checklist; a second review author independently verified all extractions. We resolved disagreements by discussion.
Appendix 5 shows the data extraction template. Among others, we extracted data on: the PBF scheme (including P4P scheme type, targeted sectors and levels, scope and funding source of the scheme, relative and absolute magnitude of incentives, verification mechanisms and ancillary components), study design and setting, study participants, study methods (including units of allocation and analysis, data sources, power calculations, analytic methods), outcome measures (as prespecified under Primary outcomes and Secondary outcomes) and associated results, and comments by authors on interpretation of findings.
Assessment of risk of bias in included studies
Two review authors independently used criteria recommended by the Cochrane EPOC Group to assess the risk of bias for each main outcome in all studies included in the review (EPOC 2017a).
Measures of treatment effect
For randomized trials, non‐randomized trials and CBA studies, we recorded the effect estimates reported by the investigators. Most commonly reported were the relative effects of the intervention obtained from difference‐in‐difference regression models adjusting for multiple covariates and confounders. These relative effects were reported in the form of regression betas. For all such betas, we opted to recalculate a more easily interpretable relative effect measure denoting the effect that the authors of the included studies attributed to the intervention (i.e. the percentage change in an outcome indicator associated with the intervention), in comparison to the control group baseline mean. To calculate this, we divided the effect estimate beta by the control group mean and multiplied by 100 to obtain a percentage change in outcome attributable to the intervention. Therefore, we reported this relative effect measure throughout the review, rather than absolute percentage point differences. Precision measures (confidence intervals, standard errors or deviations) were frequently not reported across studies; we did not calculate or impute these and instead focused our reporting on the effect measure noted above.
If papers with CBA design did not provide an appropriate analysis or reporting of results, but presented the data for each district/ region in the intervention and control groups respectively, we reanalyzed the data using a difference‐in‐difference design. We created a dataset with the same number of events and non‐events per district/region before and after intervention as reported in the paper. We estimated the postintervention relative risk for the event (intervention relative to control), adjusted for the difference in risk between intervention and control preintervention, and pre‐ versus postintervention (underlying trend). In line with the above, we estimated the relative effect of the intervention.
For ITS studies, we recorded changes in level and slope. If studies with ITS design did not provide an appropriate analysis or reporting of results, but presented the data points in a graph or table that could be scanned or filed as supplied by authors, we reanalyzed the data using methods described in the Cochrane EPOC Group guidance (EPOC 2017b). Specifically, we used piecewise linear regression and estimated postinterruption changes in level and slope using the ITSA add‐on command for STATA 15. For multiple‐group designs, we adjusted as per Linden 2015. For all models fitted, we conducted robustness checks to assess whether autocorrelation considerably affected findings; if this was the case, we reported adjusted values of the ITS analyses. We used STATA 15 to conduct analyses and included results in 'Summary of findings' tables. All calculations use raw data as presented in reviewed studies.
Unit of analysis issues
For cluster‐randomized trials and CBA studies, we appraised whether an appropriate analysis had been done that adjusted for clustering in calculating confidence intervals or P values. If the analysis did not appear to have adjusted for clustering appropriately, we considered whether the effect estimate was likely to be affected by such issues and appropriately noted this as a potential source of bias relating to the outcome in question.
Dealing with missing data
We contacted the authors of included studies where there were substantive concerns over missing data. We gave authors two weeks to reply and supply data for reanalysis; if we did not hear back from authors, we attempted to contact them a second time. If this was also unsuccessful, we did not include data provided by the study in our 'Summary of findings' tables but included the study in the review and described the study and intervention in principal descriptive tables.
Assessment of heterogeneity
Upon completion of data extraction, the author group considered the diversity in intervention designs and also the clinical and methodological diversity across studies as per the Cochrane Handbook for Systematic Reviews of Interventions (Deeks 2019). We noted high levels of diversity (see Description of studies) and also considered the limitations as a consequence of how data were reported in the studies (effect estimates not being accompanied by measures of precision). As we judged it to be uninformative to conduct statistical pooling of results across studies (see Data synthesis), it was not possible to conduct any statistical assessments of heterogeneity.
Assessment of reporting biases
Selective outcome reporting is a risk for P4P studies, where information on many indicators was recorded as being part of the intervention, but not all indicators were then reported in the studies. We assessed risks qualitatively: for each study, we considered the outcomes incentivized by P4P schemes, noted which outcomes were captured by the evaluations and identified outcomes that were not reported on. We additionally compared the stated aims of each evaluation with the outcomes reported on. If we suspected reporting bias, we logged this as appropriate in our assessment.
We also assessed publication bias qualitatively for each outcome and indicator reviewed, based on the results and characteristics of the included studies, including the extent to which only effects in favour of the intervention were reported, the extent to which funders or investigators were advocates of P4P or had a vested interest in the results, and the extent to which the authors' interpretations of the results were supported by the actual results.
Data synthesis
Studies of P4P are heterogeneous in relation to context, study design, characteristics of the participants and the interventions, follow‐up periods and outcome measures. Therefore, we judged it to be uninformative to calculate mean effects across studies. We additionally noted substantive gaps in data reported by study authors, principally relating to precision measures (standard errors, standard deviation and confidence intervals), thus precluding any potential for data pooling or meta‐analysis. Therefore, we decided to use a narrative synthesis and reported on this as per the SWiM (Synthesis Without Meta‐analysis) guidelines (Campbell 2020).
Grouping of studies for main comparison
We aimed to review the evidence on P4P against the primary and secondary outcomes as formulated; however, upon initial review of included studies noted two sources of diversity that had not been prespecified in the study protocol (Witter 2009b), and which required us to deviate from initially specified analyses approaches.
Identifying main comparisons
First, some studies assessed intervention effects against either a standard care or status quo control group, whereas others assessed effects against a comparator intervention (usually enhanced financing). Other studies assessed effects against both a control and comparator. Therefore, we chose to report on P4P effects against control and P4P effects against comparator interventions, drawing on the information and effect data reported by studies against each comparison as relevant.
Defining level of synthesis
Second, effects of the intervention were reported at more granular level than anticipated. For example, we aimed to consider effects on utilization and delivery of care services; however, numerous individual indicators relating to this outcome were reported on, including: utilization of one or more antenatal care (ANC) visits, delivery of HIV testing and delivery of modern family services.
Therefore, we extracted data on each of these more granular indicators and established that when synthesizing and presenting evidence, we would do so at different hierarchical levels.
Specifically, we aimed to present the effects of P4P against a control or comparator at:
indicator level: that is, summarizing range of effects for each indicator which was formulated and assessed in a comparable manner across studies (see Criteria used to prioritize results for synthesis below);
clinical area level: that is, grouping clinically similar indicators to summarize the effects of the intervention on a clinical area (e.g. reviewing and grouping individual vaccination indicators for BCG (Bacillus Calmette–Guérin), DTP (diphtheria‐tetanus‐pertussis) and tetanus and narratively summarizing evidence against the area of vaccinations);
outcome level: that is, reviewing effects across the different individual indicators and emerging patterns by clinical areas, summarizing how the intervention affects the macro‐level outcomes as formulated in our initial study protocol.
Distinguishing between targeted and untargeted effects
At any of the above levels, and as per our original review protocol (Witter 2009b), we aimed to distinguish between effects of the intervention on targeted versus untargeted indicators. The need to distinguish between such effects relates to debates around the broader theory of change for the intervention. On the one hand, should P4P schemes directly incentivize an indicator, that is, by making payments conditional upon achieving a specified target or otherwise we would expect health professionals to change their practice and performance around this indicator to respond favourably. On the other hand, depending on design, overall budgets involved and wider inclusion of quality of carer indicators, P4P schemes are likely to contribute to broader health system strengthening, thus creating an environment where other indicators – even not targeted – respond positively.
Given the above, we decided to summarize intervention effects across targeted and untargeted indicators separately. Targeted specifically relate to indicators that P4P schemes include in their designs; that is, payments made to facilities and health workers are conditional based on performance for these specific indicators. We defined an indicator to be targeted if it was directly included among indicators specified by the scheme design, or indirectly targeted (e.g. if a scheme rewards four or more antenatal consultations, we considered the first three antenatal consultations were also targeted).
Indicators that are not targeted were those that were assessed by the evaluation and defined by authors of reviewed studies as not targeted or identified by the review team as not relating to targeted indicators.
For details on how we grouped studies and synthesized information for subgroup and sensitivity analyses, see Subgroup analysis and investigation of heterogeneity and Sensitivity analysis.
Standardized metric
At any of the above levels, we did not generate pooled estimates, given limited reporting of precision estimates, but instead reported the range of relative effects noted across reviewed studies. See Measures of treatment effect for further details.
Criteria used to prioritize results for synthesis
Given the volume of data retrieved and need to systematically and meaningfully compare effects, we restricted our synthesis only to those indicators that were comparable and reported in two or more studies. To be deemed comparable, indicators needed to be similarly specified (in terms of measurement instruments and time points) and appraised via similar means (in terms of data collection mechanisms).
Synthesis method and presentation of findings
For each comparison (P4P against control or comparator), and for each indicator, we reviewed the effect sizes noted to identify the range of relative effects of the intervention, noting at the same time whether these are predominantly suggestive of desirable, neutral, undesirable or uncertain effects. We presented this detailed information by indicator and clinical area‐specific 'Summary of findings' tables in Appendix 1 and Appendix 2.
For each indicator, we deemed effects predominantly suggestive of benefits of introducing the intervention as desirable. This meant reviewing all the effects contributing to a comparison against a specific indicator and judging whether effects were consistently positive, or in cases where there were negative effects, whether these were small (under 5%) and presented in a minority of cases only. We judged undesirable effects as those where studies predominantly suggested the intervention may have implied more harms than benefits: this meant that effects were predominantly negative and positive effects relatively small (under 5%). To judge effects as suggestive of neutral, we applied a contextualized judgement dependent on outcome, however generally considered effects under 5% to be of this nature. For some indicators, where both the range of effects identified were suggestive of both potential benefit and harm, and were beyond 5%, we classified the overarching effect of the intervention as uncertain.
To prepare summaries of findings across main outcomes – as presented in the main 'Summary of findings' tables – we first created meta‐summary graphs, summarizing desirable, undesirable or neutral effects and certainty of the evidence against each indicator. We further summarized information narratively across all indicators associated with a specific outcome, offering a general overview of effects, commenting on whether these changes were based on whether indicators were targeted or not. We reached an overarching judgement on the certainty of the evidence against each outcome by considering the relative distribution of certainty ratings across an outcome.
Subgroup analysis and investigation of heterogeneity
For both comparisons of P4P effects against control and those against comparator interventions, we stated that we would explore the extent to which the magnitude of incentives or ancillary components (or both) might explain differences in the impacts of P4P, along with the level at which they were paid (Witter 2012). However, studies did not consistently report the magnitude of incentives and the presence of ancillary components. It was, therefore, impossible to conduct subgroup analyses based on magnitude of incentives.
However, we did conduct a subgroup analysis by level at which performance was assessed and paid, which links to the P4P scheme design and mechanism. We classified all studies according to their broad scheme design – distinguishing, for example, between performance‐related pay, payment per output and target payments. For each of the indicators assessed (whether targeted or untargeted), we then set a minimum certainty threshold (i.e. we restricted subgroup analyses to indicators for which certainty in the evidence was assessed as being no less than 'low' across both targeted and untargeted outcomes). We then assessed whether the range of effects reported in the reviewed studies varied by classification of the P4P scheme. Against each indicator, we thus assessed whether any pattern was evident in relation to the scheme designs contributing information to the comparison. We noted indicators for which no pattern was evident and for those indicators where a pattern was distinguishable, we assigned the best‐performing scheme (schemes securing positive and relatively high magnitude of effect) a rank of 1 and second‐best performing scheme a rank 2 and so forth. We thus reached a qualitative judgement on the relative performance of diverse schemes types in comparison to one another. To comment on broader patterns across outcomes of the review, we then calculated a median rank for each scheme design, across the indicators associated with each outcome, to establish an overarching relative rank for each type of P4P scheme design. We then further reviewed the ranking patterns across schemes and commented on these.
Sensitivity analysis
For all indicators, we presented summaries across the whole body of evidence and separately summarized the evidence from randomized trials in the comments section and additional tables to probe whether results differed if less robust studies were excluded.
Summary of findings and assessment of the certainty of the evidence
We summarized the effects of P4P for each indicator and against each of the above comparators (control and comparator) in 'Summary of findings' tables, distinguishing principally between whether indicators were targeted or not, and further summarized interpretation of results against review outcomes in meta‐summary tables and the overarching 'Summary of findings' tables. We provided the range of effects corresponding to intervention impacts noted across studies against each indicator. However, we did not calculate a single effect estimate of the intervention against either control or comparators.
We assessed the certainty of the evidence (high, moderate, low and very low) using the five GRADE considerations (risk of bias, inconsistency of results, imprecision, indirectness and publication bias) as per Section 77.6 and Chapter 14 of the Cochrane Handbook for Systematic Reviews of interventions (Higgins 2019), and the EPOC worksheets (EPOC 2017c). Given the absence of meta‐estimates, our GRADE assessment corresponded to an assessment of certainty in the overall direction of effect of the intervention. We presented the range of effects noted by study authors across the reviewed literature and used the approach noted by Murad 2017 to consider methodological limitations of studies, issues of indirectness, imprecision, inconsistency, likelihood of publication bias and appropriateness of raising certainty ratings. Alongside 'Summary of findings' tables, we provided justification for decisions to downgrade or upgrade the ratings using notes in the table and make comments to aid readers' understanding of the review where necessary.
As per ongoing research and recommendations (Hultcrantz 2017), we assessed certainty in whether the intervention had a desirable (positive), neutral, undesirable (negative) or uncertain effect (see Data synthesis), and further referred readers to the identified range of effect sizes for interpretation (Hultcrantz 2017). To reach a judgement on certainty we proceeded stepwise. First, we considered all evidence to be of high quality (four‐point GRADE rating). Second, we systematically appraised the evidence collated against each outcome in light of the five GRADE criteria, downgrading evidence as appropriate (EPOC 2017c; Higgins 2019). In relation to risk of bias criteria specifically and as per Murad 2017, this implied downgrading evidence by two points for indicators where the majority of evidence was from CBAs. In addition to the criteria listed, we further downgraded evidence provided by one study only (by one point). Third, we proceeded to upgrade evidence by one point if the magnitude of effect was particularly large (i.e. corresponding to a risk ratio of two or above) (as per Section 5.3.1 in Schünemann 2013). Fourth, we consistently reviewed judgements made on effects (whether they were desirable, undesirable, neutral or uncertain) in light of GRADE ratings. For all indicators where certainty of the evidence was deemed very low, we revised our assessment and noted effects as uncertain.
Given the diversity of study designs, we further reviewed the evidence across randomized trials only (see Sensitivity analysis) and applied GRADE again as per the above principles.
Two review authors independently performed GRADE assessments, with disagreements being resolved by discussion and in consultation with a third review author.
Results
Description of studies
Results of the search
Searches yielded 11,535 unique references (see Figure 1). We excluded 10,623 records as irrelevant after reading the titles and abstracts, and retrieved the full text of 912 potentially relevant articles. We excluded 807 articles with reasons, including a sample of them in the Characteristics of excluded studies table. We included 59 studies in the review.
1.

PRISMA flow chart. LMIC: low‐ to‐ middle‐income countries; P4P: paying for performance.
We reran all search strategies in 2020 and identified additional studies not incorporated in this review. These are listed under Studies awaiting classification and will be incorporated in the next review update.
Included studies
We included 59 studies (see Characteristics of included studies table; Table 5; and Table 6). Most studies assessed the effects of P4P against a control group. Fourteen (24%) were RCTs, 16 (27%) were non‐randomized trials, 19 (32%) were CBAs, nine (15%) were ITS, and one included both an ITS and CBA analysis. Most studies followed up and assessed the effects of P4P schemes three years after initiation; however, this varied considerably across the reviewed literature, with some evaluations being conducted as soon as one‐year after scheme start and others following up trends as long as 17 years after initial implementation.
3. Characteristics of included studies – table A.
| Country | Study design | Study ID | Aim | Funders of study | Location of care | Urban or rural areas | Study population | Sample details | Intervention: type of P4P |
| Afghanistan | RCT | Engineer 2016 | To evaluate the effectiveness of P4P on MCH | Ministry of Health Afghanistan and third party evaluation by John Hopkins | Mixed – inpatient and outpatient | Unclear | Women and children | Intervention group endline (baseline comparable): 81 facilities for exit interviews (727 patients), overall 285 health workers, 72 facilities for household interviews (3421 households). Control group: 81 facilities for exit interviews (727), overall 285 health workers, 71 facilities for household surveys (3427 households) | Payment per output modified by quality score |
| Witvorapong 2016 | To evaluate the impacts of P4P on non‐targeted services | Unclear | Community based care | Rural | Women of reproductive age who had institutional delivery or brought a child to a BPHS facility for DPT‐3 vaccination, and their families | Across all 4 study arms, 6649 women and their households. In the intervention group (CHW arm) 1556 women; in the control group 1571 women. Number of CHWs not specified | Payment per output | ||
| Argentina | CBA | Gertler 2013 | To evaluate the impacts of P4P on birth outcomes and neonatal mortality | WB | Mixed – inpatient and outpatient | Unclear | Pregnant women, mothers and children | Varied across outcomes. Sample size from 108,535 for tetanus toxoid vaccine, to 282,042 for caesarean section. Sample constructed from medical records of beneficiaries and non‐beneficiaries of Plan Nacer, across Argentina | Target payment |
| RCT | Celhay 2015 | To evaluate the effects of P4P on early initiation of ANC | WB | Outpatient | Unclear | Pregnant women accessing care in facilities in Misiones, who were beneficiaries of Plan Nacer at the time of their first visit | 37 clinics including 1240 pregnant women accessing care | Payment per output | |
| Benin | Quasi/non‐randomized trial | Lagarde 2015 | To identify causal pathways of how P4Pmay work and evaluate impacts on range of outcomes | WB | Mixed – inpatient and outpatient | Mixed – urban and rural | Patient groups affected – appeared to be patients using RMCH services and other curative services (includes curative consultations, HIV treatment, TB detection and treatment) | 135 health facilities including 433 providers and 3331 patients | Payment per output modified by quality score |
| Brazil | ITS | Viñuela 2015 | To explore if any systematic change in outcome measures can be attributed to P4P | WB | Unclear | Mixed – urban and rural | Neonates | 27 states plus the federal district. Other sample details unclear | Performance‐related pay |
| Burkina Faso | CBA | Steenland 2017 | To examine the effect of P4P pilot 2011–2013 in Burkina Faso | WB, through the Health Results Innovation Trust Fund | Mixed – inpatient and outpatient | Rural | Women accessing antenatal and postnatal care | 186 health providers in the 3 districts, 8074 women in the analytic sample | Payment per output modified by quality and equity score |
| Burundi | CBA | Bonfrer 2014a | To examine the staggered rollout of P4P in Burundi | Unclear | Mixed – in and outpatient | Unclear | Women, infants and households; observations of care‐seeking episodes | For studying incentivized outcomes, the population under study consists: phase 1 – 274 women who delivered in the preceding year, 265 infants, 1329 women 15–49 accessing FP, 1000 households, 49 health facilities; Phase 2: 715 women who delivered in the preceding year, 712 infants, 3690 women 15–49 accessing FP, 2700 households 130 health facilities; pooled: 845 women who delivered in the preceding year, 835 infants, 4341 women 15–49 accessing FP, 3200 households, 159 health facilities. For studying non‐incentivized outcomes: phase 1: 1000 households, 1440 episodes of illness and 1291–1300 episodes of illness appraised for care; phase 2: 2700 households, 3770 illness episodes, between 3237–3259 episodes appraised for care; pooled: 3200 households, 4555 episodes of illness and 3928–3950 illness episodes appraised for care | Payment per output modified by quality score |
| Bonfrer 2014b | To examine the effect of P4P on utilization and quality of maternity care in Burundi | Unclear | Mixed – inpatient and outpatient | Unclear | Women accessing antenatal, MCH care services | 4916 women, representative sample nationally overall: 3603 in no P4P, 1299 in P4P group | Payment per output modified by quality score | ||
| Falisse 2015 | To examine the effect of P4P on the use of health care services | CORDAID | Mixed – inpatient and outpatient | Mixed – urban and rural | Women accessing antenatal, MCH care services | 68 (reported per 10,000) | Payment per output modified by quality score | ||
| Rudasingwa 2014 | To examine the effect of P4P on the quality of selected health services | CORDAID | Mixed – inpatient and outpatient | Unclear | Women accessing antenatal, MCH care services | 16 facilities with P4P and 13 without – quality of care assessment | Payment per output modified by quality score | ||
| Cambodia | CBA | Van de Poel 2016 | To identify the effect of P4P on utilization of MCH | EU Research Grant | Mixed – inpatient and outpatient | Mixed – urban and rural | Mothers and children – focus of most of the schemes | In 2010, 45 operational districts with no experience of P4P and 32 operational districts exposed to P4P | Performance‐based contracting |
| ITS | Ir 2015 | To examine the effects of the Government Midwifery Incentive Scheme on deliveries | Funding from the Belgian Technical Cooperation and the Institute of Tropical Medicine in Antwerp. 2 co‐authors benefited from the support of the Health Equity and Financial Protection in Asia project funded by the Seventh Framework Programme of the European Commission | Inpatient | Mixed – urban and rural | Women giving birth at institutions | Nationwide rollout | Payment per output | |
| Khim 2018a | To compare the effects and process of P4P implementation in 3 areas | The AusAid Australian Leadership Award Scholarship programme | Mixed – inpatient and outpatient | Rural | Patient groups affected are outpatients at primary care facilities, children aged < 1 year, newborns, and pregnant women | 72 data points. No further information available | Performance‐based service agreements | ||
| Matsuoka 2014 | To examine the effect of P4P in achieving intended goals | JICA | Mixed – in and outpatient | Unclear | Population coverage | Unclear | Payment per output | ||
| Cameroon | Quasi/non‐randomized trial | de Walque 2017 | To estimate impact of P4P on MCH service coverage, quality of services | WB | Mixed – inpatient and outpatient | Mixed – urban and rural | Pregnant women and mothers, children aged < 5 years | 434 facilities, with 185 children, 187 caretakers and 258 pregnant women | Payment per output modified by quality and equity score |
| CBA | Zang 2015 | To explore the effects of the P4P scheme in Littoral region | WB | Mixed – inpatient and outpatient | Mixed – urban and rural | Health facilities and pregnant women and children aged < 5 years – unclear if further inclusion/exclusion criteria apply | 40 health facilities out of 52 | Payment per output modified by quality and equity score | |
| China | CBA | Yao 2008 | To examine the effects of P4P on TB case detection and treatment | COMDIS – DfID | Outpatient | Rural | People with TB – suspected and diagnosed depending on outcome | Total sample not reported. New smear‐positive cases in intervention group 3190 at baseline and 5449 during intervention. In control group, 1864 at baseline, and 3745 during intervention | Payment per output |
| ITS | Chang 2017 | To assess the effects of P4P on adverse drug reaction reporting | No funding | Inpatient | Unclear | All patients admitted to First Affiliated Hospital of Zhengzhou University (Henan Province) | Total patient reports included 2882. 128 in pre‐intervention period (2006–2009); 753 in first intervention (2009–2011); 2001 in second intervention (2012–2014) | Payment per output | |
| Wu 2014 | To examine the effects of P4P (with mismeasurement) in China | Unclear | Mixed – inpatient and outpatient | Urban | Patients attending the hospital under study | 10 wards with 142 physicians and 5230 patients | Target payment | ||
| Liu 2005 | To assess the effects of P4P on productivity, cost recovery and hospital revenue | UNDP/WB/WHO Special Programme for Research and Training in Tropical Diseases + DfID | Inpatient | Unclear | People with appendicitis and pneumonia | 6 hospitals, 2303 patients (1161 with appendicitis and 1142 with pneumonia) | Payment per output | ||
| Quasi/non‐randomized trial | Powell-Jackson 2014 | To assess the impacts of a P4P policy experiment in Ningxia | Bill and Melinda Gates Foundation and EC grant | Mixed – in and outpatient | Rural | Patients, no further details | 75 towns, 917 villages, 357,400 households and 30, 393 individuals included in surveys | Payment per output and for target | |
| Sun 2016 | To test alternatives to fee‐for‐service to inform policy | EU Research Grant | Outpatient | Rural | Patients attending village clinics and township health centres | 29 township health centres (14 intervention, 15 control); 3162 prescriptions (intervention: 572 township health centres, and 1040 village clinics; control: 527 township health centres, and 1023 village clinics) | Capitation and P4P | ||
| RCT | Yip 2014 | To assess the effects of reforming provider payments from fee‐for‐service to capitation with P4P on prescribing, health expenditure, outpatient visits and patient satisfaction | Bill and Melinda Gates Foundation; EU Health‐F2‐2009‐223166‐HEFPA; WB Strategic Impact Evaluation Fund provided seed funding at planning stage | Mixed – inpatient and outpatient | Rural | All patients requiring antibiotic‐based care | 16,866 patients, with 44,0473 episodes of care at township health centres, and 714,661 episodes of care at village posts | Capitation and P4P | |
| Congo, Republic of the | CBA | Zeng 2018 | To evaluate the impacts of P4P on reproductive, maternal and childcare | WB | Mixed – inpatient and outpatient | Mixed – urban and rural | Mothers with children aged < 2 years | 100 enumeration zones, with 1325 households, 1307 mothers and 1859 children at endline (1349 households, 1344 mothers and 1841 children at baseline) | Payment per output modified by quality score |
| Congo, Democratic Republic of the | CBA | Soeters 2011 | To explore changes due to P4P in indicators between 2005 and 2008 in the control and intervention groups | Unclear | Mixed – inpatient and outpatient | Unclear | Mothers and young children | 240 households in intervention group and 200 in control group at baseline | Payment per output modified by quality score |
| RCT | Huillery 2017 | To evaluate impact of P4P scheme on utilization, efficiency | Unclear | Mixed – inpatient and outpatient | Mixed – urban and rural | Women and children | 87 health areas, 123 facilities, 332 facility staff, 1014 patients and 9234 households | Payment per output | |
| El Salvador | CBA | Bernal 2018 | To identify the impacts of results‐based aid on delivery of services and effectiveness | IADB | Mixed – inpatient and outpatient | Unclear | Low‐income mothers and children | Unclear | Results‐based aid |
| Haiti | CBA | Zeng 2013 | To assess the impacts and costs of P4P delivery | MSH and USAID | Mixed – inpatient and outpatient | Unclear | Assumed patients using services at health facilities in study | 4 departments, which covered 217 health facilities (of which 15 were implementing P4P) | Performance‐based contracting |
| India | RCT | Mohanan 2017 | To estimate impacts of different incentive models on maternal care | Unclear | Inpatient | Rural | Women who had recently given birth, and their newborns | 135 providers (53 in output arm; 38 in input arm; 44 in control arm), and 2895 patients | Target payment or payment per input |
| Kenya | RCT | Menya 2015 | To estimate the impacts of P4P on malaria prevention and care | National Institute of Health US | Outpatient | Unclear | Patients with a laboratory test for malaria, or who received artemether‐lumefantrine | 14,939 patient observations | Target payment |
| Malawi | CBA and ITS | McMahon 2016 | To assess the fidelity and impacts of the P4P strategy in Malawi | USAID | Mixed – inpatient and outpatient | Unclear | Patients attending reproductive and child health services | 17 health facilities in intervention group and 17 health facilities in control group | Payment per output modified by quality score |
| Multiple – Burkina Faso, Ghana and Tanzania | CBA | Duysburgh 2016 | To document the effects of P4P on quality of antenatal and childcare | EU | Mixed – inpatient and outpatient | Rural | Mothers and neonates | Unclear | Financial and non‐financial incentives + clinical decision guide |
| Peru | Quasi/non‐randomized trial | Cruzado de la Vega 2017 | To estimate the effects of P4P on indicators of health service coverage and nutritional status in children | Self‐funded | Outpatient | Unclear | Children aged 0–59 months; depending on the indicator in question, restricted to 0–36 months and 0–24 months, or pregnant women during 2010–2014 | 3 regions and 54 districts, no more detail provided | Payment per output and for target |
| Philippines | RCT | Peabody 2011a | To examine the effect of bonus payments on quality of care | US National Institutes of Health through an R01 grant (No. HD042117) | Inpatient | Unclear | Physicians active at hospitals in study – about 3 per hospital | 30 hospitals overall in the study | Target payment |
| Quimbo 2016 | To investigate long‐term effects of the QIDS intervention on quality of care | US National Institutes of Health through an R01 grant (No. HD042117) | Inpatient | Unclear | Health providers engaged in QIDS | 81/89 doctors who previously participated, including 43 new doctors | Target payment | ||
| Wagner 2018a | To estimate effect of QIDS bonus payment intervention in comparison to an increased access intervention and to a control | US National Institute for Child Health and Human Development | Inpatient | Unclear | Children affected by pneumonia and diarrhoea, followed up | 3121 children affected, treated at 1 of the 30 facilities (10 per intervention and control) within. Study included 479 children in bonus intervention arm, 447 in expanded intervention and 467 in control | Target payment | ||
| Peabody 2014 | To assess the impact of a P4P programme on paediatric health outcomes in the Philippines | US National Institutes of Health through an R01 grant (No. HD042117) | Inpatient | Unclear | All (caregiver consenting) children aged < 5 years treated at hospitals in study and discharged. Intervention group: 61 physicians at baseline and follow‐up; 496 children at baseline and 596 at follow‐up. In control group: 58 physicians, 501 children at baseline and 560 at follow‐up | 30 hospitals overall in the study | Target payment | ||
| Rwanda | ITS | Rusa 2009a | To evaluate the effect of P4P on healthcare worker performance from 2005 to 2007 | Unclear | Outpatient | Rural | Differed by indicator – women and children and those accessing curative consultations | 6 districts initially rolling out in pilot, remaining districts in country later on | Payment per output modified by quality score |
| Quasi/non‐randomized trial | Basinga 2011 | To assess the effect of performance‐based payment of healthcare providers (P4P) on use and quality of child and maternal care services in healthcare facilities in Rwanda | WB, Bank of Netherlands Partnership Program, the British Economic and Social Research Council, the Government of Rwanda, and the WB's Spanish Impact Evaluation Fund | Mixed – inpatient and outpatient | Mixed – predominantly rural | Households with children aged < 5, for health facilities all 166 facilities | 166 health facilities in 19 districts, allocated to intervention (80 facilities, 12 districts) vs control (86 facilities, 7 districts) and conducting household surveys: intervention: 1002 at baseline vs 1007 at follow‐up; control: 1114 at baseline and 1115 at follow‐up | Payment per output modified by quality score | |
| Lannes 2016 | To examine distributional impacts of P4P in Rwanda | WB, Bank of Netherlands Partnership Program, the British Economic and Social Research Council, the Government of Rwanda, and the WB's Spanish Impact Evaluation Fund | Mixed – inpatient and outpatient | Mixed – predominantly rural | Households with children aged < 5 years, for health facilities all 166 facilities | 166 health facilities, 2145 households and person observations for 3 populations, which feed into diverse analyses: married women (aged 15–49 years) for FP analysis, women with pregnancies in last 2 years for maternal service analysis, children aged ≤ 5 years for child health services | Payment per output modified by quality score | ||
| Priedeman Skiles 2013 | To examine the effects of P4P on equity in maternal health service use | Unclear | Mixed – inpatient and outpatient | Mixed – predominantly rural | Women aged 18–49 years | 7899 women aged 15–49 years; 4477 in intervention group and 3422 in control group, across 12 intervention and 7 control districts, clustered into 86 intervention clusters and 64 control clusters | Payment per output modified by quality score | ||
| Priedeman Skiles 2015 | To estimate the effects of Rwanda's P4P programme on the prevalence of childhood illness, care‐seeking behaviours and treatments delivered | Unclear | Outpatient | Mixed – predominantly rural | Children aged < 5 years | 5781 children aged < 5 years at the time of each survey who lived in either an intervention (3307) or comparison district (2474) | Payment per output modified by quality score | ||
| Sherry 2017 | To estimate the impacts of P4P scheme in Rwanda | Unclear | Mixed – inpatient and outpatient | Mixed – predominantly rural | Women and children utilizing RMCH services | Across 19 districts (12 intervention and 7 control), 10,272 households at baseline and 7377 at endline, including data of 11,321 women at baseline and 7313 at endline | Payment per output modified by quality score | ||
| Lannes 2015 | To study the effects of P4P on patient satisfaction regarding quality assurance | Unclear | Unclear | Rural | Pregnant women and adults seeking care for themselves/children | Across 157 primary care facilities (77 intervention, 80 control) patients attending for ANC, child curative and adult curative care | Payment per output modified by quality score | ||
| Gertler 2013 | To provide evidence on the effect of incentives on provider productivity and on health outcomes in Rwanda | WB, Bank of Netherlands Partnership Program, the British Economic and Social Research Council, the Government of Rwanda and the WB's Spanish Impact Evaluation Fund | Mixed – inpatient and outpatient | Mixed – urban and rural | Women giving birth during study periods and their children; health providers involved in study | Unclear | Payment per output modified by quality score | ||
| de Walque 2015 | To evaluate the impact of Rwanda's national P4P scheme on individual and couple HIV testing and counselling | WB, Bank of Netherlands Partnership Program, the British Economic and Social Research Council, the Government of Rwanda, and the WB's Spanish Impact Evaluation Fund | Outpatient | Mixed – urban and rural | Facilities, households of HIV + patients and their couples tested for HIV and households randomly sampled from neighbour households in the catchment area of the facility | Across 9 intervention districts and 7 controls: 24 facilities in total (10 intervention, 14 control) associated with 675 households in intervention, 705 in control. Total number of observations: 1075 for individual testing and 287 observations for couple testing (intervention arm) and 1140 observations for individual and 285 observations for couple testing (comparator arm) | Target payment | ||
| RCT | Shapira 2017 | To evaluate the impact of tying payments to performance | WB | Mixed – community and health facility | Mixed – urban and rural | Mothers and CHWs | Baseline sample 2005 CHWs (84% of target). 2200 CHW at follow‐up and 197 co‐operative presidents. Baseline household sample 2376, follow‐up sample included 2157 of original sample and additional 2343 newly sampled women with recent births or pregnancy in the village | Payment per output | |
| Swaziland | Quasi/non‐randomized trial | Kliner 2015 | Compare outcomes for patients with a treatment supported receiving incentives vs those patients with a non‐incentivized supported | Global Fund, COMDIS, DfID | Community‐based care | Rural | People with TB | 1077 people with TB (161 in intervention and 916 in control) diagnosed between study dates and living in the communities of treatment supporters | Payment per output |
| Tanzania | CBA | Binyaruka 2015 | To examine the effect of a government P4P scheme on utilization, quality and user costs of health services in Tanzania | Government of Norway, grant numbers: TAN‐3108 and TAN 13/0005 | Mixed – inpatient and outpatient | Mixed – urban and rural | Patients and households of women accessing care in study health facilities | 1500 patients and 3000 households surveyed across 11 districts, 150 health facilities | Target payment |
| Binyaruka 2017 | To evaluate the effects of P4P on the availability and stockout rate of RMNCH medical commodities in Tanzania and assess distributional effects | Government of Norway and the Research Council of Norway and the UK DfID as part of the Consortium for Research on Resilient and Responsive Health Systems supported the funding of the authors' time undertaking data analysis and writing | Mixed – inpatient and outpatient | Mixed – urban and rural | Health facilities | 75 intervention and 75 control facilities (in each arm: 6 hospitals, 16 health centres and 53 dispensaries) | Target payment | ||
| Binyaruka 2018b | To examine the heterogeneity of P4P effects on service utilization across population subgroups and its implications for inequalities in Tanzania | Government of Norway | Mixed – inpatient and outpatient | Mixed – urban and rural | Women having given birth in the last 12 months in catchment areas of included facilities | 75 intervention and 75 control facilities (in each arm: 6 hospitals, 16 health centres and 53 dispensaries). 3000 households surveys of women giving birth in the last 12 months at baseline and follow‐up | Target payment | ||
| Mayumana 2017 | To determine whether P4P improves internal and external accountability mechanisms | Government of Norway (research) and DfID RESYST consortium (publication) | Mixed – inpatient and outpatient | Mixed – urban and rural | Health facilities | 75 intervention and 75 control facilities (in each arm: 6 hospitals, 16 health centres and 53 dispensaries) | Target payment | ||
| Quasi/non‐randomized trial | Brock 2018 | To compare the value of non‐monetary gifts (immediate unconditional, delayed unconditional, conditional) to improve health worker performance | Maryland Agricultural extension station grant – Government of Norway, WB | Outpatient | Urban | Health providers engaged in study and patients treated | Intervention group: 21 providers and 940 patients; unconditional gift: 23 providers, 1155 patients; delayed unconditional gift: 25 providers and 1167 patients; control: 25 providers and 1176 patients | Conditional provision of material goods | |
| Zambia | ITS | Chansa 2015 | To evaluate the effects of the P4P prepilot in Katete district | WB | Mixed – inpatient and outpatient | Mixed – urban and rural | Women accessing RMNCH services and children | 25 health facilities, including 6 health posts, 18 rural health centres and 1 urban health centre | Payment per output modified by quality score |
| RCT | Friedman 2016a | To provide an estimate of P4P impacts vs input financing vs pure control | WB | Mixed – inpatient and outpatient | Unclear | Differed by outcome – mothers or children | 10 P4P intervention districts, 10 matched financing and equipment districts, and 10 control districts | Payment per output modified by quality score | |
| Shen 2017 | To estimate effects of P4P scheme on health worker motivation, job satisfaction and staff attrition | WB | Unclear | Unclear | 3 different groups of providers: those in the P4P facilities, those in enhanced financing control and the pure control. Patients affected would be those attending the participating facilities | 186 health centres (86 in P4P group, 49 in enhanced‐financing group and 51 in pure control group) and 683 staff in total (baseline: 147 in P4P group, 87 in enhanced‐finance group, 92 in pure control group; endline: 166 in P4P group, 92 in enhanced‐financing group, 99 in pure control group) | Payment per output modified by quality score | ||
| Zimbabwe | CBA | Das 2017 | To establish impact of P4P on ANC service and process outcomes | No funding | Mixed – inpatient and outpatient | Rural | Mothers to be in facilities selected | 705 total facilities (374 intervention: 105 baseline, 116 follow‐up; 331 control: 84 baseline, 82 follow‐up) and research set in 41 facilities in panel intervention, 36 facilities in panel control. 1011 clients total (intervention: 565 baseline, 414 follow‐up; control: 446 baseline, 336 follow‐up) and research set: intervention: 208 baseline, 200 follow‐up; control: 177 baseline and 174 follow‐up | Payment per output modified by quality and satisfaction score |
| Quasi/non‐randomized trial | Friedman 2016b | To identify the effects of the RBF pilot programme on the utilization and quality of MCH services and its effects on health system functioning | WB | Mixed – inpatient and outpatient | Unclear | Households and patients seeking RMCH care | 197 health facilities at baseline, 222 at follow‐up. 597 health worker interviews at baseline, 415 at follow‐up. Patient exit interviews: for ANC: 1864 at baseline and 550 at follow‐up; for child health: 1865 at baseline and 844 at follow‐up. 1610 household surveys at baseline and 1836 at follow‐up | Payment per output modified by quality and equity score |
ANC: antenatal care; BPHS: Basic Package of Health Services; CBA: controlled before‐after; CHW: community health worker; COMDIS: https://comdis-hsd.leeds.ac.uk/; DfID: Department for International Development; DPT: diphtheria‐tetanus‐pertussis; FP: family planning; IADB: Inter‐American Development Bank; ITS: interrupted time series; JICA: Japan International Cooperation Agency; MCH: maternal and child health; MSH: Management Sciences for Health; P4P: paying for performance; QIDS: Quality Improvement Demonstration Study; RCT: randomized controlled trial; RESYST: https://resyst.lshtm.ac.uk/; RMCH: reproductive, maternal and child health; RMNCH: reproductive, maternal, newborn and child health; TB: tuberculosis; UNDP: United Nations Development Programme; USAID: United States Agency for International Development; WB: World Bank; WHO: World Health Organization.
4. Characteristics of included studies – table B.
| Country | Study design | Study ID | Intervention: type of P4P | Control or comparator intervention | Data collection methods | Time period | Analysis | Outcomes reported |
| Afghanistan | RCT | Engineer 2016 | Payment per output modified by quality score | Control: standard care or status quo | Household surveys, health facility surveys, balanced scorecard assessments. Data collected by trained interviewers and data collection teams | Baseline: 2010. Endline: 2012. Follow‐up: 23–25 months after initial rollout of P4P | ITT (Wilcoxon signed rank matched pair) and DID models as extended analyses. DID available for this outcome | 28 outcomes reported – around RMNCH utilization and delivery, and quality of care |
| Witvorapong 2016 | Payment per output | Control: standard care or status quo | Surveys (assumed household). Collected by HOPE Worldwide | Baseline: 2009. Endline: 2011. Follow‐up: unclear | Regression analysis (4 probit models). Sample‐level analysis, exogeneity model, reported here. Control variables include wealth quartiles, age, race, ability to read, number of children, proportion of children still alive, proportion of children still alive and female, proportion of children delivered at facility, proportion of children having had DPT, distance to nearest BPHS facility, whether the respondent felt safe going to facility, awareness of reproductive health education programmes and of family planning programmes) | 2 outcomes around unintended effects | ||
| Argentina | CBA | Gertler 2014 | Target payment | Control: standard care or status quo | Database completed using birth and medical records, beneficiary status, pharmaceutical records, administrative records, population census | Baseline: 2004. Endline: 2008. Follow‐up: NA | DID models – 1 ITT to estimate effect of Plan Nacer on all patients in relevant hospitals, the either treatment‐on‐treated to estimate effect on the beneficiaries only, or treatment‐on‐treated with spill over to estimate effect on beneficiaries AND non‐beneficiaries. All models control for clinic fixed effects, time‐province fixed effects, maternal age and number of previous births. SEs clustered at clinic level. ITT results extracted | 6 RMCH outcomes and 9 further health economic outcomes |
| RCT | Celhay 2015 | Payment per output | Comparator: standard care under Plan Nacer | Patient records from clinics and hospitals | Baseline: 16‐month preintervention period from January 2009 to April 2010, 8‐month intervention period from May 2010 to December 2010, 15‐month 'postintervention period I' from January 2011 to March 2012 and 9‐month 'post‐intervention period II' from April 2012 to December 2012. Endline: 15 months after intervention and further 9 months. Follow‐up: 24 months | ITT but reporting based on local average treatment. Clustered at the health clinic level. Given small number of clusters, Wild bootstrap method used, as a method that is robust to randomized assignment of treatment among a small number of clusters | 7 outcomes around RMNCH utilization and delivery, RMNCH health outcomes, and unintended effects of incentives on immunizations and overall visits | |
| Benin | Quasi/non‐randomized trial | Lagarde 2015 | Payment per output modified by quality score | Control and comparator. Control: standard care or status quo. Comparator: additional funding matching core elements of P4P | Facility surveys, person questionnaires and exit interviews. Data collected by study fieldworkers | Baseline: 2011. Endline: 2015. Follow‐up: 4 years | Econometric model. Health worker control variables covered role, level of experience, primary household income and household wealth. Facility control variables covered other nearby facilities, rural or non‐rural, qualified staff, facility size and access to electricity | 38 individual outcomes assessed against control and 28 against alternative comparator; covering quality of care, utilization and delivery, and facility management/resources |
| Brazil | ITS | Viñuela 2015 | Performance‐related pay | Over time: comparison over time | National registry data, obtained from routine sources | Baseline: 2002. Endline: 2011. Follow‐up: 9 years | Regression models. Model without control variables, and model with control variables: state management reforms, sector expenditure per capita, poverty rate and GDP per capita, GDP per square kilometre, and population density | 1 health outcome reported on child mortality |
| Burkina Faso | CBA | Steenland 2017 | Payment per output modified by quality and equity score | Control: standard care or status quo | Data from HMIS. | Baseline: data set extracted started from January 2009. P4P was started in April 2011. Endline: extracted data ended in December 2012. Follow‐up: April 2011 to December 2012 | DID controlling for time trends, seasonal effects and clustering | 4 utilization and delivery outcomes around RMNCH |
| Burundi | CBA | Bonfrer 2014a | Payment per output modified by quality score | Control: standard care or status quo | Household surveys. Unclear who collected the data | Baseline: 2006. Endline: 2010. Follow‐up: 4 years | DID controlling for time trends, seasonal effects and clustering; Bonferroni corrections applied | 15 outcomes – utilization and delivery outcomes around RMNCH and immunizations; quality of care outcomes and health outcomes |
| Bonfrer 2014b | Payment per output modified by quality score | Control: standard care or status quo | Data from Burundi Demographic and Health Survey 2010 | Baseline: 2005. Endline: 2010. Follow‐up: 5 years | DIDs. Investigating the effect of whether a province had or did not have P4P when an individual child was born. SEs were adjusted for at the province level. Control variable household size, wealth quintiles, whether child is first born, mother age at birth, age of household head in year, mother having primary education, male household head, access to safe drinking water, household having electricity. Robustness confirmed using ordinary least squares regression | 11 outcomes on utilization and delivery of RMNCH, including RMNCH immunizations | ||
| Falisse 2015 | Payment per output modified by quality score | Control: standard care or status quo | Data from National Health Information System, and from CORDAID and the EU, who implemented P4P in 7 provinces | Baseline: 2005. Endline: 2009. Follow‐up: 3 years | DID controlling for province and year trends, but no controls. A second model included controls; however, problematic as 32% missingness registered there, so more conservative model reported | 12 outcomes, primarily around utilization and delivery of RMNCH and vaccinations, plus outpatient and malaria visits; 1 of these outcomes was perinatal deaths | ||
| Rudasingwa 2014 | Payment per output modified by quality score | Control: standard care or status quo | Administrative data review, medical records review, documents and records review, direct observation. Data obtained from CORDAID Netherlands | Baseline: 2006. Endline: 2008. Follow‐up: 2 years | Differences in scores between 2006 and 2008 explored through descriptive statistics, paired non‐parametric Wilcoxon Signed Ranks test and DID analysis at a significance level of 5% | 8 general quality of care outcomes | ||
| Cambodia | CBA | Van de Poel 2016 | Performance‐based contracting | Comparator: unclear | Cambodian DHS surveys. Data collected by national authorities | Baseline: 2000. Endline: 2005 and 2010. Follow‐up: 5 and 10 years | DID. SE adjusted for clustering at the OD level (model 1). Extended model (model 2 – focused on in the results) also accounts for geographic variation in access to public services, which may constrain extent to which even incentivized providers can influence utilization rates. Covariates included in the model which contain child, mother and household characteristics such as birth interval < 24 months; mother's age at birth < 20 years; education level of mother and wealth index (see table II of Van de Poel 2016 for complete list) | 5 RMCH outcomes |
| ITS | Ir 2015 | Payment per output | Over time: comparison over time | Data from existing National Health Information System database and DHS data | Baseline: January 2006. Endline: December 2011. Follow‐up: 4 years and 3 months | Segmented linear regression to identify both level and trend changes, accounting for autocorrelation | 1 principal outcome reported on | |
| Khim 2018a | Performance‐based service agreements | Over time: comparison over time | Data exported from HMISs | Baseline: 2006. Endline: 2012. Follow‐up: 2 or 3 years | ITS, using segmented linear regression, which estimated preintervention trend and level, and postintervention trend for each indicator. Changes in level and slope were calculated, controlling for preintervention level, trend, and autocorrelation. Autocorrelation and serial correlation corrected using Prais‐Wisten transformation | 4 RMCH outcomes | ||
| Matsuoka 2014 | Payment per output | Over time: comparison over time | Data review of existing records obtained from Kroch Chhmar OD (health administration) office; interviews; focus groups; health centre visits. Data collected by study team | Baseline: January 2006/2007. Endline: June 2009. Follow‐up: depending – 2 or 3 years | Descriptive data analysis. Outcomes compared before and after intervention using the Chi² test where appropriate | 2 ANC and immunization indicators | ||
| Cameroon | Quasi/non‐randomized trial | de Walque 2017 | Payment per output modified by quality and equity score | Control: standard care or status quo | Interviews with household members, facility‐based survey, patient‐provider observations and client exit interviews. Data collected by Institut de Formation et de Recherche Démographiques and research team | Baseline: unclear – pre P4P start. Endline: 3 years. Follow‐up: unclear | DID. Regression models adjusted for control variables. Facility level controls included type of health facility (public/religious/private) and location of health facility (urban/rural). Household level control variables included number of individuals in the household, housing type, house ownership, water source and type of sanitation. Individual level controls included age, marital status, education level, religion, ethnicity, working status and type of work | 102 outcomes, around RMNCH, vaccination, HIV, malaria, financing, patient and provider satisfaction, equipment and medicine availability, and quality of care |
| CBA | Zang 2015 | Payment per output modified by quality and equity score | Control: standard care or status quo | Household and facility surveys | Baseline: January 2011. Endline: February 2013. Follow‐up: unclear | Propensity score matching for (catchment area population size, square of catchment area population size, number of qualified health personnel, square of number of qualified health personnel and number of qualified health personnel to catchment area population size) and DID | 21 outcomes. 9 around quality of care; 4 around number of staff; 6 around RMNCH utilization and delivery; 2 around utilization of outpatient consultations, and drug availability | |
| China | CBA | Yao 2008 | Payment per output | Control: standard care or status quo | Data from county‐based TB reporting data collected by healthcare workers | Baseline: January‐September 2004. Endline: January‐September 2005. Follow‐up: 1 year | Comparison of proportions and "Descriptive analyses of independent t‐tests, χ2 test and Kruskal‐Wallis rank test were used when appropriate" | 2 outcomes: treatment success and case notification |
| ITS | Chang 2017 | Payment per output | Over time: comparison over time | Adverse drug reaction reports from hospital pharmacovigilance programme database, collected from pharmacists and admissions | Baseline: 2006. Endline: 2014. Follow‐up: 5 years | Time series analysis using autoregressive integrated moving average models | 3 outcomes on adverse drug reactions | |
| Wu 2014 | Target payment | Over time: comparison over time | Routine data from tertiary general hospital dataset | Baseline: July 2004. Endline: May 2006. Follow‐up: about 2 years | DID and regression analysis to check for trends. All regressions control for patient age, gender, marriage, number of conditions, a dummy variable for whether the patient was in severe condition, length of stay and a set of principal diagnosis fixed effects | 4 outcomes on expenditure and length of stay | ||
| Liu 2005 | Payment per output | Over time: comparison over time | Inpatient records from the 6 panel hospitals. Data collected by study team | Baseline: 1978. Endline: 1997. Follow‐up: 17 years (first bonus payment made 1981) | Trend analysis, correlation and regression analysis; stepwise regression, with the following indicators entered in: "besides indicators of revenue, cost recovery, unnecessary care and productivity, the year, names of hospitals and bonus type were put into the regression models as independent variables" | 4 revenue‐ and productivity‐related outcomes | ||
| Quasi/non‐randomized trial | Powell-Jackson 2014 | Payment per output and for target | Control: standard care or status quo | 2 rounds of household survey. Data collected by research teams | Baseline: February 2009. Endline: early 2011. Follow‐up: about 2 years | DID approach – regression with treatment effects estimated by ordinary least squares, with clustered nature of data accounted for by clustering SEs at village level. Analysis controlled for individual chronic disease, age, age squared, gender, gender of the household head, household size, asset wealth, education, distance from the nearest health facility of each type, ethnicity, whether the individual is the household head and migrant status | 14 outcomes on inpatient and outpatient care and processes | |
| Sun 2016 | Capitation and P4P | Control: status quo (global capitated budget) | Routine monitoring and study‐specific surveys. Data collected by study team | Baseline: April 2011. Endline: April 2012. Follow‐up: 1 year | DID, fixed‐effects, controlling for sex and gender | 8 prescription and cost outcomes | ||
| RCT | Yip 2014 | Capitation and P4P | Control: standard care or status quo | Data from electronic management information system; household survey; township health centre and village after survey | Baseline: unclear. Endline: 30 January 2012. Follow‐up: unclear | Logistic regression and least squares regressions for binary and continuous outcomes; report unadjusted estimates and those adjusted for sex, age and dummy variable for cluster‐paired fixed effects. SE at town level. Subgroup analysis by sex. Also for patients with a cold for antibiotic use | 11 prescription outcomes including expenditure per visits | |
| Congo, Republic of the | CBA | Zeng 2018 | Payment per output modified by quality score | Control: standard care or status quo | Household and health facility surveys. Data collected by study teams | Baseline: March 2012. Endline: March 2014. Follow‐up: 2 years | DID – multivariate regression model, which controlled for characteristics which "measured financial and physical accessibility of households and respondents' awareness of and education on health care," which included the location of households, house ownership, household size, mother's age, education, status of living with a partner, status of having a regular job and distance of households from health facilities. Models adjusted for clustering at the village level. Results from model without village fixed effects. Bonferroni correction included | 22 variables around utilization of RMNCH, immunizations and quality of care |
| Congo, Democratic Republic of the | CBA | Soeters 2011 | Payment per output modified by quality score | Comparator: in‐kind medicine and equipment donation, fixed bonuses | Stratified household cluster survey | Baseline: November 2005. Endline: February 2008. Follow‐up: 2 years 2 months | DID. Logistic regression models; unclear whether adjusted | 26 outcomes: RMNCH, quality of care, patient satisfaction, financial |
| RCT | Huillery 2017 | Payment per output | Control: other (some payment to facilities made based on staff numbers) | Surveys. Collected by study team | Baseline: September and November 2009. Endline: December 2012 and February 2013. Follow‐up: 30 months | Regression model. "In all regressions we control for the health zone, and for whether the health facility is rural or urban, religious or non‐religious, private or public, health post or health centre. At the individual level, we add controls for the sex and age of the individual, grade and experience if the respondent is a health worker, reason for visiting if the respondent is a patient, and whether the individual is literate if the respondent is an adult household member" | 77 outcomes around general utilization and delivery, RMNCH, quality of care, patient satisfaction and provider motivation | |
| El Salvador | CBA | Bernal 2018 | Results‐based aid | Control: standard care or status quo | Extraction from routine data sources; health visits; hospitals data; family records. Collected by hospitals and health workers | Baseline: depending on source – for health visits 2009; hospitals from 2005 and family records from 2010. Endline: depending on source – for health visits 2015, for hospitals 2015, for family records 2013. Follow‐up: 3–6 years | DID – linear regression with time fixed effects, municipality fixed effects, and unobservable characteristics that vary within municipality and across time | 36 outcomes. General utilization including preventive, curative, outpatient and family planning visits; plus outcomes around human resources |
| Haiti | CBA | Zeng 2013 | Performance‐based contracting | Control: standard care or status quo | Routine health information system data. Collected by health workers | Baseline: 2008. Endline: 2010. Follow‐up: 2 years | Random‐effects regression model using quarterly observations and controlling for time effects + DID | 7 outcomes around consultations for incentivized and non‐incentivized services among different patient groups |
| India | RCT | Mohanan 2017 | Target payment or payment per input | Control: other (payment for participation in study) | Interviews; provider and patient records. Data collected by study team | Baseline: 1st precontract data collection (provider and personnel surveys) October 2012 to January 2013. Endline: Postcontract visit 2 between August and November 2014. Follow‐up: 19 months between introduction of intervention and beginning of postcontract visit 2 | Regression analysis clustering at provider level. P values adjusted for multiple hypotheses tested and calculated using the free stepdown resampling method. Models include district and enumerator fixed effects. Models given with and without household‐level control variables (mother's age and education; household's caste and house type; head of household's religion; mother's history of hypertension, diabetes, asthma, hyperthyroidism or hypothyroidism, and convulsions; whether mother has had a previous stomach surgery; whether it is the mother's first pregnancy, number of previous pregnancies, whether the mother has had a stillbirth or abortion, and number of previous children birthed; whether the household owns land, has no literate adults, and owns a Below Poverty Line care) and provider‐level controls (primary provider's gender, professional qualifications, number of years in practice, and number of years that the facility has been in operation | 18 RMCH outcomes |
| Kenya | RCT | Menya 2015 | Target payment | Control: standard care or status quo | Data from facility registers | Baseline: September 2012 to October 2012. Endline: October 2012 to November 2013. Follow‐up: 1 year | Mixed‐effects logistic regression model of individual patients with random intercepts for each facility. Adjusted for quarter, age category (except for stratified analysis), gender, mode of diagnosis (rapid diagnostic test or microscopy), transmission zone (except for stratified analysis) and mean monthly volume of slides read in the facility in the preceding year |
2 malaria‐specific outcomes |
| Malawi | CBA and ITS | McMahon 2016 | Payment per output modified by quality score | Control: standard care or status quo | Data from HMISs, President's Emergency Plan for AIDS Relief, Service Provision Assessment, and primary data collection | Baseline: "Performance‐Based Incentive program officially started in August 2014". Primary data collected March 2016; secondary data collection began in Autumn 2015. Endline: unclear. Follow‐up: 18 months | ITS analysis and DID analysis. Not specified whether analyses adjusted | 17 outcomes around RMNCH, HIV and vaccination |
| Multiple – Burkina Faso, Ghana and Tanzania | CBA | Duysburgh 2016 | Financial and non‐financial incentives + clinical decision guide | Control: standard care or status quo | Health facility surveys; observation; patient satisfaction surveys; patient records review. Data collected by study team | Baseline: 2010. Endline: late 2013/early 2014. Follow‐up: 4 years | Testing for pre–post via Wilcoxon Mann Whitney when comparing intervention with control and then for intervention and non‐intervention paired signed rank when comparing at same facility | 32 outcomes on antenatal and childbirth quality of care, including management of comorbidities and complications |
| Peru | Quasi/non‐randomized trial | Cruzado de la Vega 2017 | Payment per output and for target | Control: regions without the P4P support programme, but in a similar poverty quintile | Demographic and Family Health Survey 2008–2014 data | Baseline: 2008 and 2009. Endline: intervention in place between 2010 and 2012. Follow‐up: 2013–2014 | DID of the mean treatment effect of the treated | 24 RMNCH outcomes, particularly around child vaccination, growth and malnutrition |
| Philippine | RCT | Peabody 2011a | Target payment | Control: standard care or status quo | Clinical performance vignette assessments; physician survey. Collected by study teams | Baseline: 2003. Endline: 2007. Follow‐up: 3 years (intervention introduced in 2004) | Descriptive statistics and DID models testing for intervention effects controlling for clustering at hospital level and size of facility; as relevant also for repeat testing and physician characteristics (age, gender, specialization) | 4 outcomes: quality scores for 4 age groups |
| Quimbo 2016 | Target payment | Control: standard care or status quo | Clinical performance vignette assessments; physician survey. Collected by study teams | Baseline: 2003. Endline: 2013. Follow‐up: 9 years (intervention introduced in 2004) | DID model across the 8 study periods, random effects, adjusting for clustering | 1 quality score outcome | ||
| Wagner 2018a | Target payment | Control: standard care or status quo | Patient exit survey; follow‐home survey (4‐ to 6‐weeks after discharge). Collected by QIDS investigators | Baseline: 2003/2004. Endline: 2007/2008. Follow‐up: 2 years | Comparison of means and multivariate models (DID), including facility fixed effects and control variables. Include dependents (0–14 ratio, and 65+ ratio), duration of stay, child having pneumonia/diarrhoea, child being female, age. Of child, maternal education, per capita monthly income and household size | 6 outcomes on medical expenditures | ||
| Peabody 2014 | Target payment | Control: standard care or status quo | Household surveys. Data collected by independent interview teams | Baseline: 2003. Endline: 2007. Follow‐up: 3 years (intervention introduced in 2004) | Logistic difference in difference models adjusting for PhilHealth (insurance) membership, age of child (months), mother's education (years of schooling), household income (PhP), initially visited a lower‐level facility prior to hospitalization and length of stay in hospital. The individual effects control for individual, household and area specific factors that are fixed over time. Clustering by facility | 4 general health outcomes | ||
| Rwanda | ITS | Rusa 2009a | Payment per output modified by quality score | Over time: comparison over time | Routine health facilities reports and supervision logs | Baseline: 2005 (monthly basis). Endline: December 2007. Follow‐up: depending on start – in pilot districts 3 years | Descriptive – graph only. Additional data requested; no data provided | 8 outcomes around RMNCH and vaccinations – regarding utilization and delivery and quality of care |
| Quasi/non‐randomized trial | Basinga 2011 | Payment per output modified by quality score | Comparator: traditional input‐based budgets allocated to the facilities in the control group were increased by the mean amount of P4P payments that facilities in the intervention group received every 3 months during the 23‐month assessment window | Facility survey; household survey. Collected by trained enumerators hired by external firms | Baseline: unclear – P4P started in 2006. Endline: 25 months after baseline survey. Follow‐up: maximum 25 months | Multivariate regression specification of the DID model in which an individual's outcome was regressed against a dummy variable, indicating whether the facility received P4P that year, a facility fixed effect, a year indicator, and a series of individual and household characteristics. Robust SEs, clustered at the district by year level to correct for correlation of the error terms across facilities within districts | 8 RMNCH outcomes: 6 relating to utilization and delivery, and 2 to quality of care | |
| Lannes 2016 | Payment per output modified by quality score | Comparator: traditional input‐based budgets allocated to the facilities in the control group were increased by the mean amount of P4P payments that facilities in the intervention group received every 3 months during the 23‐month assessment window | Household survey. Database obtained from Basinga 2011 | Baseline: 2006. Endline: 2008. Follow‐up: 2 years (23 months) | Clustered T‐tests and difference in difference models (linear probability, SURE, robustness checks with fixed effects and clustering) – reporting here on clustered fixed effects models | 6 outcomes on equity of RMNCH services across different parts of the population | ||
| Priedeman Skiles 2013 | Payment per output modified by quality score | Comparator: traditional input‐based budgets allocated to the facilities in the control group were increased by the mean amount of P4P payments that facilities in the intervention group received every 3 months during the 23‐month assessment window | Survey. DHS data | Baseline: 2005. Endline: 2007–2008. Follow‐up: 18 months | Bivariate descriptive analyses for outcomes by year/wealth quintile to capture inequity; difference in difference models. Cluster‐robust SEs. Community fixed effects to control for time invariant unobserved community differences. For ANC visits, covariates included age, education, marital status, parity, insurance and prior facility birth. For facility delivery, covariates included education, marital status, parity, insurance, prior facility births and ANC. For modern contraception, covariates included age, education, marital status, parity, insurance, prior facility birth and previous child death | 12 outcomes: RMNCH regarding utilization of services, with additional equity considerations | ||
| Priedeman Skiles 2015 | Payment per output modified by quality score | Comparator: traditional input‐based budgets allocated to the facilities in the control group were increased by the mean amount of P4P payments that facilities in the intervention group received every 3 months during the 23‐month assessment window | Collation of survey data from DHS survey | Baseline: 2005. Endline: 2008. Follow‐up: between 1‐2 years (early implementation between January 2006 and November 2007) | DID, fixed effects, and SEs clustered at district level. Reported illnesses DID adjusts for: child's age, birth order, gender and facility birth; mother's age, education, marital status; household wealth, toilet facilities, drinking water source and bednet use. Facility care‐seeking and treatment received DIDs adjust for child's age, birth order, gender and facility birth; mother's age, education, marital status; household wealth, insurance status and previous child death (page 7) | 10 outcomes: RMNCH regarding reporting of illness, care‐seeking and treatment | ||
| Sherry 2017 | Payment per output modified by quality score | Comparator: traditional input‐based budgets allocated to the facilities in the control group were increased by the mean amount of P4P payments that facilities in the intervention group received every 3 months during the 23‐month assessment window | Routine DHS data | Baseline: February and July 2005. Endline: December 2007 and April 2008. Follow‐up: 18–22 months after rollout | DID analysis among ITT lines, including adjustment for household and individual level control variables and fixed effects (including for birth years), SEs clustered at district levels | 26 outcomes around RMNCH and vaccination, health outcomes, utilization and delivery outcomes and quality of care | ||
| Lannes 2015 | Payment per output modified by quality score | Comparator: traditional input‐based budgets allocated to the facilities in the control group were increased by the mean amount of P4P payments that facilities in the intervention group received every 3 months during the 23‐month assessment window | Data from original Basinga 2011 dataset | Baseline: 2006. Endline: 2008. Follow‐up: varied scheme follow‐up, maximum 23 months | Derivation of satisfaction measures using polychoric correlation; ordinary least squares regression used to regress satisfaction index on each sample | 12 outcomes around satisfaction of care around curative, antenatal, and child curative services | ||
| Gertler 2013 | Payment per output modified by quality score | Comparator: traditional input‐based budgets allocated to the facilities in the control group were increased by the mean amount of P4P payments that facilities in the intervention group received every 3 months during the 23‐month assessment window | Surveys, conducted independently from the P4P programme | Baseline: 2006. Endline: 23 months later. Follow‐up: maximum 18 months | DID methods including individual controls and facility fixed effects. Considered 2 age groups: children aged 0–11 months at endline, and children aged 24–47 months at endline. "We estimated 2 versions of equation (6): one without controls and a second with controls. The controls included the child's age and sex, maternal height, mother's age, whether the mother had completed primary school, whether the father lived in the household, whether the family was a member of a Mutuelle (health insurance fund), total number of household members, number of household members under the age of 6 years, whether the household owned land, and dummy variables for quartiles of the household asset value. The child's age was entered as a series of dummy variables that represent one‐month increments" | 7 RMNCH outcomes around growth, quality of care and efficiency | ||
| de Walque 2015 | Target payment | Comparator: traditional input‐based budgets allocated to the facilities in the control group were increased by the mean amount of P4P payments that facilities in the intervention group received every 3 months during the 23‐month assessment window | Facility survey; household surveys. Collected by University of Rwanda School of Public Health | Baseline: August–November 2006. Endline: April–July 2008. Follow‐up: unclear | Repeated cross‐sections using DID analysis, facility fixed effects. "We compute robust standard errors using multiway cluster‐adjustment by districts, survey year and their intersection following the method developed by Cameron et al. (2011) to account for potential correlation of the error terms at both the cross‐section and the temporal level" | 7 outcomes around utilization and delivery of HIV testing and counselling | ||
| RCT | Shapira 2018 | Payment per output | Comparator: standard care – co‐operatives were paid for reporting only, this was the background P4P programme | Household surveys. Surveys by CHWs | Baseline: February–May 2010. Endline: November 2013 to June 2014. Follow‐up: payment started in October 2010, and continued until after follow‐up survey, suggesting minimum 3.5 years' follow‐up | Regression model including outcomes measured (either by woman, CHW or co‐operative), sector assignment and error term clustering at the sector level | 27 outcomes focused on utilization and delivery, co‐operative functioning | |
| Swaziland | Quasi/non‐randomized trial | Kliner 2015 | Payment per output | Control: standard care or status quo | Extraction from TB registry. Collected by study authors | Baseline: 1 January 2010. Endline: 30 September 2011. Follow‐up: 21 months | Logistic regression with stepwise selection of covariates into models (age (0–14, 15–24 vs over 35 years reference category), TB (any new case or previously treated/TB with meningitis) with children under 8 years as reference), HIV status, being on ART) | 8 TB‐specific outcomes |
| Tanzania | CBA | Binyaruka 2015 | Target payment | Control: standard care or status quo | Household surveys; exit interviews; facility surveys. Collection by study authors | Baseline: January 2012 (after P4P training took place in second half of 2011). Endline: March 2013. Follow‐up: 13 months | DID, ordinary least squares, clustered at facility level or facility catchment area. Controlling for individual level characteristics (education, religion, marital status, occupation, age, number of pregnancies) and household characteristics (insurance, number of household members, household head education, wealth based on ownership of household assets and housing particulars) | 146 outcomes around medicine and equipment resources, cost of care, patient satisfaction and RMNCH services |
| Binyaruka 2017 | Target payment | Control: standard care or status quo | Health facility surveys; household survey. Unclear who collected data | Baseline: January 2012. Endline: March 2013. Follow‐up: 13 months | DID regression models controlling for time invariant determinants, facility fixed effects | 103 outcomes around medicine and equipment resources, including equity consideration | ||
| Binyaruka 2018b | Target payment | Control: standard care or status quo | Household surveys. Unclear who collected data | Baseline: January 2012. Endline: February 2013. Follow‐up: 13 months | DID model controlling for time invariant characteristics including facility fixed effects and individual and household characteristics | 20 outcomes around equity of immunization and RMNCH services | ||
| Mayumana 2017 | Target payment | Control: standard care or status quo | Interviews; focus group discussions; quantitative surveys at facility and health worker levels. Data collected by study team | Baseline: January 2012. Endline: February 2013. Follow‐up: 13 months | DID, adjusted models for facility fixed effects | 38 outcomes looking at management, medicine and equipment, and utilization and delivery of general outpatient services | ||
| Quasi/non‐randomized trial | Brock 2018 | Conditional provision of material goods | Comparator: unconditional gifts (either immediate or delayed) as alternative interventions and control (all receive a standard encouragement intervention) | Patient survey. Data collected by study team | Baseline: November 2008. Endline: August 2010. Follow‐up: 22 months | Multilevel regression models with nested random effects at patient and clinician level | 1 quality of care outcome | |
| Zambia | ITS | Chansa 2015 | Payment per output modified by quality score | Over time: comparison over time | HMIS data export by study team | Baseline: January 2006. Endline: March 2012. Follow‐up: 14 quarters (3.5 years) | ITS – simulated modelling analysis | 4 outcomes looking at utilization and delivery of immunization, RMNCH and outpatient services |
| RCT | Friedman 2016a | Payment per output modified by quality score | Control and comparator. Control: standard care or status quo. Comparator: matched financing and equipment | Household and health facility surveys; process evaluation data; counter external evaluation. Enumerators hired as part of impact evaluation | Baseline: October–November 2011. Endline: November 2014 to January 2015. Follow‐up: 3 years | DID and regression models – dependent on outcome, controls for district stratification or at province level, and errors clustered at the Primary Sampling Unit or district level | 386 outcomes around staff satisfaction, management, patient satisfaction, quality of RMNCH care, utilization of RMNCH services, medicine and equipment resources, curative visits and immunization | |
| Shen 2017 | Payment per output modified by quality score | Control and comparator. Control: standard care or status quo. Comparator: enhanced financing | Health worker surveys. Unclear who collected data | Baseline: October–November 2011. Endline: September–November 2014. Follow‐up: 3 years | DID, facility fixed effects, with SEs clustered at district level. District grouping taken into account using stratification controls | 38 outcomes around staff satisfaction and human resources | ||
| Zimbabwe | CBA | Das 2017 | Payment per output modified by quality and satisfaction score | Control: standard care or status quo | Health facility assessments; patient exit interviews. Data collected by survey teams from local research firm | Baseline: December 2011 to February 2012. Endline: May–August 2014. Follow‐up: 2.5 years of implementation | ITT with difference in difference estimates (through multilevel linear regression). Multilevel regression models accounted for clustered data | 176 outcomes around total quality and patient satisfaction, with equity considered across subgroups. Included individual quality items, structural quality indices plus a composite structural quality index, process quality indices and a composite process quality index, individual satisfaction items and composite satisfaction index. Also above subgrouped by facility ownership, facility type, provider cadre, provider gender, patient characteristics and wealth quintile |
| Quasi/non‐randomized trial | Friedman 2016b | Payment per output modified by quality and equity score | Control: standard care or status quo | Facility and household surveys; direct observations. Data from MoH, HMIS, DHS and collected by study team | Baseline: December 2011 to February 2012. Endline: Midline: May–August 2014. Follow‐up: 2.5–3 years | DID and regression models – dependent on outcome, controls for district stratification or at province level, and errors clustered at the district level | 354 outcomes including utilization outcomes, quality of care, facility management, patient and staff satisfaction |
ANC: antenatal care; ART: antiretroviral therapy; BPHS: Basic Package of Health Services; CBA: controlled before‐after; CHW: community health worker; DHS: Demographic and Health Survey; DID: difference‐in‐difference; DPT: diphtheria‐tetanus‐pertussis; GDP: gross domestic product; HMIS: Health Management Information System; ITS: interrupted time series; ITT: intention to treat; MoH: Ministry of Health; NA: not available; OD: operational district ; P4P: paying for performance; P4P: paying for performance; RCT: randomized controlled trial; RMCH: reproductive, maternal and child health; RMNCH: reproductive, maternal, newborn and child health; SE: standard error; SURE: seemingly unrelated regression equations; TB: tuberculosis.
Intervention characteristics
Geography, context and location of care
Interventions were implemented across 25 countries overall (see Characteristics of interventions Table 7 and Table 8); however, most studies were impact evaluations focused on the P4P schemes implemented in Rwanda (10 studies; 17%), China (seven studies; 12%) and Tanzania (five studies; 8.4%).
5. Characteristics of interventions – table A.
| Country | Study ID | Intervention – P4P type | Scale | Source of funding for P4P scheme | Purchasing arrangement | Sectors contracted | Primary clinical or population group targeted | Level at which P4P performance was assessed and paid | Indicators incentivized |
| Afghanistan | Engineer 2016 | Payment per output modified by quality score | 11/34 provinces | World Bank | NGOs managing facilities were contracted by the MOPH to provide services. Funds channelled to health workers through the NGOs, whose central offices retained 10% of performance payment | Public and NGO | RMCH | Facilities | 9 performance indicators incentivized, and 20 quality indicators included on Balanced Scorecard, along with contraceptive prevalence rates as an additional measure of equity |
| Witvorapong 2016 | Payment per output | 4 rural provinces in the North and Central region | MOPH and GAVI | Unclear | Public | RMCH | Community health workers | 2 indicators: institutional delivery and third dose of DPT‐3 vaccination | |
| Argentina | Celhay 2015 | Payment per output | 1 province (for this experiment) | Plan Nacer – national insurer | Integrated – Plan Nacer | Public | RMCH | Facilities | 1 – early initiation of ANC |
| Gertler 2014 | Target payment | National rollout | National MoH | Integrated – Plan Nacer | Public | RMCH | Province | 10 indicators focused on reproductive maternal and child health and inclusion of indigenous populations | |
| Benin | Lagarde 2015 | Payment per output modified by quality score | 8/34 districts | World Bank | Integrated – MoH | Public and not‐for‐profit (including faith‐based) | RMCH | Facilities | 28 service indicators around RMCH and other curative services (HIV/TB) and quality of care indicators (124 items) |
| Brazil | Viñuela 2015 | Performance‐related pay | 2 states within the country | Federal/local government | Unclear – appeared integrated | Public | RMCH | Facility‐ or team‐based for assessment but paid to staff | Unclear – depended on mutually agreed targets |
| Burkina Faso | Steenland 2017 | Payment per output modified by quality and equity score | 3 districts | World Bank | Integrated – health facilities signed contracts with the central level of the Ministry to provide packages of services in line with incentivized targets | Public | RMCH; HIV/TB | Facilities | 17 indicators incentivized for primary care facilities; 21 for secondary care facilities; 7 for community health workers. Indicators primarily focused on RMNCH and TB/HIV |
| Burundi | Bonfrer 2014a | Payment per output modified by quality score | 3 provinces in 2006; 6 more in 2008; further 9 in 2014. As of 2014, implemented in almost 700 health facilities | Unclear | Management responsibility transitioning out from NGO to Ministry | Public and not‐for‐profit (including faith‐based) | RMCH | Facilities | Quantity measured through 23 output indicators, focused on RMNCH, TB/HIV and malaria. Quality checklist included 220 items |
| Bonfrer 2014b | Payment per output modified by quality score | 3 provinces in 2006; 6 more in 2008; further 9 in 2014. As of 2014, implemented in almost 700 health facilities | Unclear | Management responsibility transitioning out from NGO to Ministry | Public and not‐for‐profit (including faith‐based) | RMCH | Facilities | Quantity measured through 23 output indicators, focused on RMNCH, TB/HIV and malaria. Quality checklist included 220 items (from Bonfrer 2014a) | |
| Falisse 2015 | Payment per output modified by quality score | 17 provinces of Burundi | MoH in collaboration with international NGOs, such as CORDAID and HealthNet TPO | Management responsibility transitioning out from NGO to Ministry | Public and not‐for‐profit (including faith‐based) | RMCH | Facilities | Noted that over 42 different indicators were used (Table 1 listed 18 key indicators around curative services, reproductive health, preventive health and HIV/AIDS) | |
| Rudasingwa 2014 | Payment per output modified by quality score | Unclear | MoH in collaboration with international NGOs, such as CORDAID and HealthNet TPO | Management responsibility transitioning out from NGO to Ministry | Public and not‐for‐profit (including faith‐based) | General | Facilities | Example of 20 output indicators covering RMCH, TB, HIV and malaria and noted that 58 indicators for quality assessment were used | |
| Cambodia | Ir 2015 | Payment per output | National rollout from October 2007 | Royal Government of Cambodia | Integrated – MoH | Public | RMCH | Health workers | 10 RMCH indicators |
| Khim 2018a | Performance‐based service agreements | National rollout | Unclear | External contracting with aid agencies | Public | General; RMCH | Facilities | 4 RMCH indicators | |
| Matsuoka 2014 | Payment per output | 10 districts | GAVI | External contracting with GAVI and internal purchasing supplementing | Public | RMCH | Facilities | 2 ANC and immunization indicators | |
| Van de Poel 2016 | Performance‐based contracting | Depended on period of rollout – most of Cambodia | Unclear | Management responsibility transitioning out from NGO to Ministry | Public | RMCH | District | Unclear – different types of targets noted for the different schemes | |
| Cameroon | Zang 2015 | Payment per output modified by quality and equity score | 1 region | World Bank | Unclear – precursor of programme de Walque assesses, so likely similar purchasing through autonomous purchasing agencies | Unclear | Unclear | Health workers | Unclear |
| de Walque 2017 | Payment per output modified by quality and equity score | 26 districts | World Bank | Autonomous purchasing agencies with contractual agreement to MoH and government | Public | Unclear | Facilities | 23 indicators; 7 around curative care; 10 around preventive services – vaccinations, HIV and TB, STIs etc.; 6 around reproductive health | |
| China | Chang 2017 | Payment per output | Hospital | Unclear | Integrated – hospital level | Public | General | Health workers and facilities | Reporting of adverse drug reactions |
| Yao 2008 | Payment per output | 1 province | Fidelis project | Integrated – MoH | Public | TB | Health workers and village leaders | 2 TB outcomes | |
| Powell‐Jackson 2014 | Payment per output and for target | 1 region – Ningxia province | Unclear | Integrated – MoH | Public | Unclear | Facilities | Multiple antibiotic prescription indicators, patient satisfaction indicators and process of care measures for common acute and chronic conditions | |
| Yip 2014 | Capitation and P4P | 1 region | New Cooperative Medical Scheme | Integrated – MoH | Public | General | Facilities | Unclear – see Powell‐Jackson 2014 | |
| Wu 2014 | Target payment | Hospital | Unclear | Integrated – hospital level | Public | General | Health workers | 1 drug sale ratio to revenue related indicator | |
| Liu 2005 | Payment per output | National rollout | MoH | Integrated – MoH | Public | General | Health workers | Under flat bonus – no indicators incentivized. Under quantity‐related bonus 7 indicator areas around service provision. Under revenue‐related bonus, bonus for revenue over a revenue target (revenue from provision of services and drugs) | |
| Sun 2016 | Capitation and P4P | 2 provinces | New Cooperative Medical Scheme | Integrated – MoH | Public | General | Facilities | 10 prescription‐related quality of care indicators | |
| Congo, Republic of the | Zeng 2018 | Payment per output modified by quality score | 3 regions | World Bank | External purchaser – CORDAID | Unclear | General | Facilities and district | 25 indicators covering general population services, HIV/AIDS, RMNCH |
| Congo, Democratic Republic of the | Huillery 2017 | Payment per output | Unclear | Unclear | Integrated – MoH | Mixed – public, private and faith‐based | RMCH | Facilities | 10 RMCH indicators |
| Soeters 2011 | Payment per output modified by quality score | 2 districts | CORDAID | Unclear | Public and not‐for‐profit (including faith‐based) | RMCH | Facilities | Unclear – appeared 9 indicators for RMCH and malaria | |
| El Salvador | Bernal 2018 | Results‐based aid | 14 municipalities | Salud MesoAmericana | External purchaser – Salud Mesoamericana, via MoH channels | Public | RMCH | Municipality | 10 or 11 indicators on delivery of RMCH care and quality |
| Haiti | Zeng 2013 | Performance‐based contracting | All NGOs supported by USAID | USAID via MSH | External NGO management and purchasing | NGO | RMCH; HIV/TB | Facilities | 14 potential indicators covering RMCH, TB/HIV services and their quality |
| India | Mohanan 2017 | Target payment or payment per input | Karnataka state | Unclear | External – study authors | Private | RMCH | Health workers | Inputs for offering care or 4 outputs related to minimizing adverse events during pregnancy/child birth |
| Kenya | Menya 2015 | Target payment | 1 city and 18 health centres | Unclear | Unclear – presumably via routine mechanism | Public | RMCH | Facilities | 7 malaria‐specific indicators |
| Malawi | McMahon 2016 | Payment per output modified by quality score | 3 districts | USAID, with JPHIEGO as implementer | Integrated – MoH | Public | RMCH; HIV/TB | Facilities | 13 RMCH indicators and 13 quality dimensions |
| Multiple – Burkina Faso, Ghana and Tanzania | Duysburgh 2016 | Financial and non‐financial incentives + clinical decision guide | 6 rural districts, 2 each of 2 countries | Unclear | Unclear | Unclear | RMCH | Book awards to health workers; health facilities received money (Burkina); others were unclear | Unclear – likely to differ by country |
| Peru | Cruzado de la Vega 2017 | Payment per output and for target | Subnational 3 regions in Peru with the highest rates of chronic malnutrition in children in 2008 – apurimac, Ayacucho and Huancavelica | Peruvian government | Integrated nationally – contracting with regional governments and Ministry of Finance | Public | RMCH | Subnational organizations (health administrations, NGOs or local governments) | 12 RMCH indicators, focus on child health |
| Philippines | Peabody 2011a | Target payment | 10 hospitals | PhilHealth | Integrated – National Health Insurance | Public | RMCH | Facilities | Vignette scores focused on common childhood conditions |
| Quimbo 2016 | Target payment | 10 hospitals | PhilHealth | Integrated – National Health Insurance | Public | RMCH | Facilities | Vignette scores focused on common childhood conditions | |
| Wagner 2018a | Target payment | 10 hospitals | PhilHealth | Integrated – National Health Insurance | Public | RMCH | Facilities | Vignette scores focused on common childhood conditions | |
| Peabody 2014 | Target payment | 10 hospitals | PhilHealth | Integrated – National Health Insurance | Public | RMCH | Facilities | Vignette scores focused on common childhood conditions | |
| Rwanda | Basinga 2011 | Payment per output modified by quality score | National rollout (expansion to 19 districts which did not have P4P yet) | Governmental organization | Integrated – MoH | Public and not‐for‐profit (including faith‐based) | RMCH | Facilities | 7 outreach indicators, 7 content of care indicators, 13 quality domains |
| Lannes 2016 | Payment per output modified by quality score | National rollout (expansion to 19 districts which did not have P4P yet) | Governmental organization | Integrated – MoH | Public and not‐for‐profit (including faith‐based) | RMCH | Facilities | 7 outreach indicators, 7 content of care indicators, 13 quality domains | |
| Priedeman Skiles 2013 | Payment per output modified by quality score | National rollout (expansion to 19 districts which did not have P4P yet) | Governmental organization | Integrated – MoH | Public and not‐for‐profit (including faith‐based) | RMCH | Facilities | 7 outreach indicators, 7 content of care indicators, 13 quality domains | |
| Priedeman Skiles 2015 | Payment per output modified by quality score | National rollout (expansion to 19 districts which did not have P4P yet) | Governmental organization | Integrated – MoH | Public and not‐for‐profit (including faith‐based) | RMCH | Facilities | 7 outreach indicators, 7 content of care indicators, 13 quality domains | |
| Sherry 2017 | Payment per output modified by quality score | National rollout (expansion to 19 districts which did not have P4P yet) | Governmental organization | Integrated – MoH | Public and not‐for‐profit (including faith‐based) | RMCH | Facilities | 7 outreach indicators, 7 content of care indicators, 13 quality domains | |
| Lannes 2015 | Payment per output modified by quality score | National rollout (expansion to 19 districts which did not have P4P yet) | Governmental organization | Integrated – MoH | Public and not‐for‐profit (including faith‐based) | RMCH | Facilities | 7 outreach indicators, 7 content of care indicators, 13 quality domains | |
| Shapira 2018 | Payment per output | 19 districts | MoH | Integrated – MoH | Public and not‐for‐profit (including faith‐based) | RMCH | Co‐operatives and community health workers | 5 RMCH indicators as primary focus of scheme, later supplemented with HIV/TB indicators | |
| Rusa 2009a | Payment per output modified by quality score | Eventual national rollout, reporting here on pilot in 5 rural and 1 semi‐rural district | MoH in Rwanda and the Belgian Technical Cooperation | External NGO management and purchasing | Public | RMCH | Facilities | 6 RMCH indicators | |
| Gertler 2013 | Payment per output modified by quality score | National rollout | MoH | Integrated – MoH | Public | RMCH | Facilities | 7 outreach indicators, 7 content of care indicators, 13 quality domains | |
| de Walque 2015 | Target payment | National rollout | MoH | Integrated – MoH | Public and not‐for‐profit (including faith‐based) | RMNCH; HIV/TB | Facilities | 10 HIV‐specific indicators | |
| Swaziland | Kliner 2015 | Payment per output | Hospital | Unclear | Integrated – National TB programme | Public | TB | Community health workers | Support of directly observed treatment |
| Tanzania | Brock 2018 | Conditional provision of material goods | 1 region | Unclear | External – study authors | Mixed – public, private and faith‐based | General | Health workers | Adherence to guidelines |
| Binyaruka 2015 | Target payment | 1 region | Government of Norway | Integrated – MoH | Public and not‐for‐profit (including faith‐based) | RMCH | Facilities and district | 7 outreach indicators, 7 content of care indicators, 13 quality domains | |
| Binyaruka 2017 | Target payment | 1 region | Government of Norway | Integrated – MoH | Public and not‐for‐profit (including faith‐based) | RMCH | Facilities and district | 7 outreach indicators, 7 content of care indicators, 13 quality domains | |
| Binyaruka 2018b | Target payment | 1 region | Government of Norway | Integrated – MoH | Public and not‐for‐profit (including faith‐based) | RMCH | Facilities and district | 7 outreach indicators, 7 content of care indicators, 13 quality domains | |
| Mayumana 2017 | Target payment | 1 region | Government of Norway | Integrated – MoH | Public and not‐for‐profit (including faith‐based) | RMCH | Facilities and district | 7 outreach indicators, 7 content of care indicators, 13 quality domains | |
| Zambia | Friedman 2016a | Payment per output modified by quality score | Prepilot in 1 district; following this P4P expanded to 10 additional districts. By end of project, 203 health centres covered | World Bank – Health Results Innovation Trust Fund | Integrated – MoH | Public | RMCH | Facilities and district | 9 directly incentivized services via unit payments (RMCH indicators) and 10 areas for quality assessment (RMCH care, HIV services, general management and information systems, community participation) |
| Shen 2017 | Payment per output modified by quality score | Prepilot in 1 district; following this P4P expanded to 10 additional districts. By end of project, 203 health centres covered | World Bank – Health Results Innovation Trust Fund | Integrated – MoH | Public | RMCH | Facilities and district | 9 directly incentivized services via unit payments (RMCH indicators) and 10 areas for quality assessment (RMCH care, HIV services, general management and information systems, community participation) | |
| Chansa 2015 | Payment per output modified by quality score | Katete district prepilot | World Bank through the Health Results Innovation Trust Fund | Integrated – MoH | Public | RMCH | Facilities | 9 indicators incentivized around RMCH, and 10 incentivized areas for quality assessment | |
| Zimbabwe | Friedman 2016b | Payment per output modified by quality and equity score | Initially in 2 districts in 26 RHCs, then scaled up to 18 districts | World Bank and cofunding from the Ministry of Finance and Economic Development | Integrated into MoH, with CORDAID technical support | Public and not‐for‐profit (including faith‐based) | RMCH | Facilities + district + provincial | 17 indicators in rural health centres and 6 in hospitals, focused on RMCH; quality scorecard |
| Das 2017 | Payment per output modified by quality and satisfaction score | 18 districts | World Bank and cofunding from the Ministry of Finance and Economic Development | Integrated – MoH | Public and not‐for‐profit (including faith‐based) | RMCH | Facilities + district + provincial | 17 indicators overall for facilities and 134 quality indicators |
ANC: antenatal care; DPT: diphtheria‐tetanus‐pertussis; MoH: Ministry of Health; MOPH: Ministry of Public Health; MSH: Management Sciences for Health; NGO: non‐governmental organization; P4P: paying for performance; RMCH: reproductive, maternal and child health; RMNCH: reproductive, maternal, newborn and child health; STI: sexually transmitted infection; TB: tuberculosis; USAID: United States Agency for International Development.
6. Characteristics of interventions – table B.
| Country | Study ID | Design of P4P scheme | How are the P4P incentives used and cascaded? | Who set the target and how were the targets set? | Measurement of targets: how and where from? Verification procedures | Magnitude of incentives | Relative size of incentive | Are bonuses additional to normal wages or funding? |
| Afghanistan | Engineer 2016 | Payment per output modified by quality score (payment per output, additional payment based on balanced scorecard and contraceptive prevalence rates, all adjusted by a quality score – details of adjustment not provided) | Bonuses quarterly to health workers, based on volume of 9 health services. Additional annual payments based on quality, equity and contraceptive prevalence rates. Health workers funds channelled through NGOs. Total payments adjusted by quality score | Unclear though negotiation of targets allowed for balanced scorecard. NGOs and MOPH negotiated to adjust payments taking into account baseline conditions and expected improvements | Monthly reports from health facilities verified quarterly by independent monitors, record‐matching and random patient home visits | USD 1.30–10.37 per unit (initial); USD 2.67–35.63 per unit (revised) | 6–11% above salary (2011), increasing to 14–28% (cadre dependent) | Yes |
| Witvorapong 2016 | Payment per output | Unclear | Unclear | Unclear | AFN 150 (about USD 3) per referral | Unclear | Unclear | |
| Argentina | Celhay 2015 | Payment per output – in addition to Plan Nacer, the experiment pays financial incentives to clinics at 200% premium for early initiation (pre‐13 weeks) of ANC | Bonuses to providers set by national government according to services in the benefits package. Health facilities choose how to use revenues – some pay bonuses to personnel | National government according to clinical guidelines based on international evidence | Electronic record management system | Unclear | Unclear | Unclear |
| Gertler 2014 | Target payments for enrolments and specific indicators, including health outcomes | National government reimburses provinces every 4 months, on per capita basis, to maximum USD 8 per person per month – USD 5 per eligible individual enrolled in Plan Nacer, plus USD 3 if health targets achieved. Provinces pay clinics for RMCH services on fee‐for‐service basis. Payments used at discretion of providers, within guidelines | Targets set with provinces in annual agreements between parties, based on indicators from best practice clinical protocols | National statistics resources | Unclear | 1.4–3.5% increase in public health expenditure | Yes | |
| Benin | Lagarde 2015 | Payment per output modified by quality score (quality score index with 124 quality criteria bounded between 0 and 1) | Unclear | Unclear | Facility reports subject to verification by MoH | From 340 CFA francs (malaria cases detected and treated with RDT in children aged < 5 years) to 19,250 CFA francs (HIV‐positive children initiated on ARV in last month) | Unclear | Yes |
| Brazil | Viñuela 2015 | Performance‐related pay (results‐based management) involving different types of agreement. In Minais Gerais between governor and secretaries to follow strategic priorities of multiannual plans and second‐level agreements between secretaries and implementing teams with self‐defined targets. Bonuses constitute sizeable incentives, up to 1‐month salary. In Pernambuco description not available | In relation to health sector, rewards group based at level of the hospital. Portion of employees pay lined to achievement of goal set for the group | Targets set by level, in discussion, and based on priorities | Unclear | Unclear | As large or higher than 1 month's salary (per year) | Yes |
| Burkina Faso | Steenland 2017 | Payment per output modified by quality (range 0–1) and equity adjustment (range 1–1.75) – all multiplicative | 60% of payment given to healthcare providers, 40% for facility improvements. Allocation of payments between staff was weighted according to level of responsibility, training, absenteeism and individual evaluation | Unclear | Teams performed quarterly site visits | Primary care facilities: XOF 75 (well‐child visits for children aged < 5 years) to XOF 1000 (children aged < 5 years with malnutrition) per service. Secondary care facilities: XOF 1125 (smear‐positive TB cases treated) to XOF 20,000 (caesarean sections) per service. Community health workers: XOF –50 (number of patients who did not return to facility for vaccination) and XOF 400 (number of patients diagnosed with malaria referred to CSPS) | For nurses, about 16% of mean government salary. Otherwise unclear | Unclear |
| Burundi | Bonfrer 2014a | Payment per output and quality adjustment (range 1–1.25) – multiplicative | Payments made to facilities | Unclear | Health facilities report monthly to MoH. Local regulatory authorities did quarterly checks of quality on a random day | From USD 0.05 (per child receiving vitamin A) to USD 20 (per person with TB correctly treated for 6 months) | About 40% of the total health facility budget | Yes |
| Bonfrer 2014b | Payment per output and quality adjustment (ranges 1 – 1.25) – multiplicative | Health facilities allocate P4P revenue between staff remuneration (up to 50%) and service quality improvements | Presumed MoH | Health facilities report monthly to MoH. Local regulatory authorities did quarterly checks of quality on a random day | From USD 0.05 (per child receiving vitamin A) to USD 20 (per person with TB correctly treated for 6 months) | About 40% of the total health facility budget | Yes | |
| Falisse 2015 | Payment per output and quality adjustment (range 1–1.25) – multiplicative | Unclear | Appeared to be set by NGOs or MoH | Unclear | Unclear | Unclear | Yes | |
| Rudasingwa 2014 | Payment per output and quality adjustment (range 1–1.25) – multiplicative | Facility managers distributed bonuses to staff of facilities included in P4P scheme, based on profile and performance criteria of each staff member, e.g. qualifications, experience, years of employment, responsibility and worked hours | Unclear | Quality assessed quarterly by evaluation team from district and provincial health authorities | From USD 0.05 (per child receiving vitamin A) to USD 20 (person with TB correctly treated for 6 months) | About 20% of health facilities total revenues | Yes | |
| Cambodia | Ir 2015 | Payment per output | Incentives paid to health facility through public financial reimbursement channels, who then distributed to midwives, physicians and other trained health personnel attending deliveries in public health facilities. Of this up to 30% had to be shared further with other health personnel in the facility, and workers such as traditional birth attendants | Set by government (MoH) | Monthly reports from health facility through routine health information system | USD 15 (per live birth attended in health centre) and USD 10 (per live birth in hospitals) | Unclear | Yes |
| Khim 2018a | P4P (other) – service agreement | Unclear | Initially meant to be performance agreements between MoH and PHD, service delivery agreement between PHD and SOAs, and agreements between Director of SOA, heads of facilities and individual staff members. However, enforcement was actually weak, so this did not happen | Unclear | USD 1.18–1.24 (district dependent) per capita Service Delivery Grant allocation | Unclear | Yes | |
| Matsuoka 2014 | Payment per output | Unclear | Unclear | Appeared to be nationwide statistics | USD 0.5 (per outpatient consultation visit to each health centre), USD 1 (per ANC visit; per immunization dose) | Unclear | Yes | |
| Van de Poel 2016 | Performance‐based contracting | Unclear | Appeared to be donor and government | Unclear | Unclear | Unclear | Yes | |
| Cameroon | Zang 2015 | P4P (unclear) – though the same scheme was covered by de Walque 2017 | Unclear | Unclear | Unclear | Unclear | Unclear | Unclear |
| de Walque 2017 | P4P (combined CCP and quality bonus and equity adjustment) | Payment at discretion of facility | Unclear | Facility reports submitted, and then verified by purchasing agency; purchaser and district assess quality scores | From 20 CFA francs (distribution of vitamin A supplementation) to 20,000 CFA francs (cases of TB treated and healed) | Unclear | Yes | |
| China | Chang 2017 | Payment per output (income withheld) | Bonuses were paid for reporting of adverse drug reactions, fines if reports withheld; bonuses applied to both physicians and wards but unclear how distributed to each | Unclear | Routine retrospective review of charts by pharmacists | RMB 20 for a spontaneous adverse drug reaction report; fine of RMB 5 for a withheld report | < 1% of physician's salary | Unclear |
| Yao 2008 | Payment per output | Incentives provided to doctors, and to village leaders for disseminating TB knowledge – further details not specified | Unclear | Appeared to be routine data | USD 3 (for doctors for referral of new smear‐positive person with TB), USD 8 (for village doctors for DOT for 6 months to new smear‐positive patient), USD 1 (village leaders to disseminate TB knowledge) | Unclear | Yes (assessed by review authors but not explicitly stated) | |
| Powell‐Jackson 2014 | Payment reform: CCP and target payment | Unclear, however Yip 2014 suggested that the health centres were paid and they then cascaded payments to village clinics | Appeared to be researchers with Ningxia province decision makers | Unclear | RMB 2 (for village doctors per visit at clinic) or RMB 4 (per home visit). Amounted to mean 12,000 per village doctor | Unclear | Yes (assessed by review authors but not explicitly stated) | |
| Yip 2014 | Payment reform to capitation with P4P) | Township health centres and village posts underwent performance assessments twice yearly – NCMS dispersed 70% of budget to health centres based at the beginning of the year and withheld the remaining 30% pending the results of these assessments. Health centres disbursed a share of this funding to village posts. Centres obtaining higher than average performance scores received more than the 30% of the budget that had been withheld; centres scoring below average received less than this 30%. Village post performance affected health centre performance | Targets set by NCMS | Representatives of the supervising township health centre, the county department of health and the county NCMS office | Unclear | Unclear | Yes | |
| Wu 2014 | Target payment (negative) | Specialties required to keep drug percentage below a certain threshold. Physician's compensation was deducted if their drug percentage exceeded the threshold, with greater excess resulting in greater punishment. If exceeded threshold by < 20%, deduction of CNY 100 (about USD 15) per percentage point over threshold; if exceeded threshold by > 20%, punishment was CNY 150 (about USD 22) per percentage point over. No financial reward for being below threshold | Initially Chinese government, as well as hospital from July 2004 to May 2005 | Hospital records | Deduction of CNY 100 (USD 15) per percentage point over threshold if actual drug percentage exceeded threshold by < 20%; Deduction of CNY 150 (about USD 22) per percentage point over threshold if actual drug percentage exceeded threshold by > 20% | About 2.5% decrease in attending physician's official income (1.4% decrease in total income) for each percentage above drug prescription threshold | No | |
| Liu 2005 | Payment per output (including revenue) | 3 types of bonus system: 1. Flat bonus distributed among hospital staff about equally, with the amount depending on overall financial status of hospital; 2. quantity‐related bonus according to quantity of services provided, usually with a target above which the bonus was paid; 3. revenue‐related bonus, depending on revenue generated by doctors through provision of services and drugs over a revenue target | Unclear | Unclear | Unclear | About 10% of salary | Yes | |
| Sun 2016 | Payment reform: capitation with negative performance payments | Township health centres received 80% of CGB quarterly. Quality of care assessment taken at beginning of next quarter, and report sent to payer – portion of remaining 20% of CGB paid based on assessment performance | Appeared to have been set through discussions between providers, research team, provincial and county officials, and NCMS officials | Study team via structured observation | Unclear | 20% of operating budget of clinic | No | |
| Congo, Republic of the | Zeng 2018 | Payment per output modified by quality score | Unclear | Unclear | Facility registers, with verification by CORDAID, who also carried out quarterly quality checks | From USD 0.40 (curative visits; HIV/AIDS cases with opportunistic infections treated), to USD 60 (TB and leprosy cases cured) | Unclear | Yes |
| Congo, Democratic Republic of the | Huillery 2017 | CCP | Unclear | Unclear | Facility registers | From USD 0.6 (curative care visit) to USD 5 (complex case referral) | Total incentives represented about half of facilities' budget | Yes (assessed by review authors but not explicitly stated) |
| Soeters 2011 | Payment per output modified by quality score | Unclear | Targets appeared to have been set by external consultants. Health facilities submitted business plans quarterly outlining strategies for delivering health packages | Unclear | USD 200–4000 per facility per month – variation between facilities according to quality and remoteness | Unclear | Yes (assessed by review authors but not explicitly stated) | |
| El Salvador | Bernal 2018 | P4P (fixed element alongside a targeted element) | Specification that 25% bonus received upon achieving a weighted 80% of targets was to be spent in the health sector | Targets agreed between government and Salud Mesoamerica Initiative based on indicators around inputs and quality of care, service utilization and health outcomes | Independent third‐party household survey | Total incentive trance USD 1,625,000 for first phase | 25% of total value of funding envelope offered to governments | Yes |
| Haiti | Zeng 2013 | Performance‐based contracting, with indicators for performance chosen at year end to avoid distortion | Facility given autonomy on use of money | MSH worked to set targets with NGO each year based on historical performance | Monthly reports by health facility | Unclear | 5–10% of budget, depending on performance | Yes |
| India | Mohanan 2017 | Payment for health outcome targets (combining negative target payments and incremental payments for lower levels of maternal mortality from specific causes); second arm tested payment for adherence to WHO protocols for maternal health care (payment according to score against 5 domains of care) | 2 payment mechanisms in intervention arms. In both arms, providers given incentive payment only at end of study period, with no interim payments. For output‐based arm, payment based on rewards for each of 4 outcomes. For input‐based arm, payment based on rewards for each of 5 domains of care | All incentives and contracts were set to allow equal maximum level of payment + to ensure that the project could afford it all | Experimental setting; measured through household surveys and repeated provider surveys | Maximum of INR 150,000 (USD 2700 at time of contract) for doctors | About 15% of specialist doctor salary | Yes |
| Kenya | Menya 2015 | Target payments (positive and negative) | Intervention facilities received payments based on 7 performance indicators. Incentives had to be used for equipment, supplies, repairs and basic labour, rather than payments to employees or clinicians | Study team – to foster co‐operation between departments and harmonize their working | Appeared to be from facility registers during study team visits | Maximum USD 1175 (KES 100,000) per quarter per facility | About equivalent to money saved if overuse of ACT curbed | Yes |
| Malawi | McMahon 2016 | Payment per output modified by quality score | Rewards paid to facilities based on achievement of set targets. Rewards used for facility improvements or other strategies outlined in annual business plans developed by facility staff and Support for Service Delivery Integration staff. Rewards could not be redistributed to health workers as performance bonuses | Unclear | Quality was measured by communities and patient interviews. Further details unclear | Unclear | Unclear | Yes |
| Multiple – Burkina Faso, Ghana and Tanzania | Duysburgh 2016 | Clinical decision guide + P4P (financial and non‐financial incentives) | Unclear | Based on qualitative research with stakeholders involved, for instance health workers and policy makers | Emphasis on routine measurement of indicators | Unclear | Unclear | Unclear |
| Peru | Cruzado de la Vega 2017 | Appeared to be a mix of CCP and target payment | Agreements used to transfer resources to the budgets of these regions with the condition of fulfilling management commitments and coverage goals with a view toward improving the nutritional status of children | Programme based on agreement made between the national and regional governments | Unclear | Unclear | Unclear | Unclear |
| Philippines | Peabody 2011a | Target payment (quality scores) | The total bonus payments received by the hospital were distributed among physicians and other hospital staff and were paid quarterly | Unclear | Measured using CPV scores (focused on dermatitis, diarrhoea and pneumonia) plus quarterly caseload scores and patient satisfaction scores. Biannually 2 trained physician abstractors scored 3 CPVs from randomly selected physicians at each hospital | PHP 100 (USD 49 in 2006) per patient per day of confinement (eligible intervention B hospitals) | 5% of total physician salaries | Yes |
| Quimbo 2016 | Target payment (quality scores) | The total bonus payments received by the hospital were distributed among physicians and other hospital staff and were paid quarterly | Unclear | Measured using CPV scores (focussed on dermatitis, diarrhoea and pneumonia) plus quarterly caseload scores and patient satisfaction scores. Biannually 2 trained physician abstractors scored 3 CPVs from randomly selected physicians at each hospital | PHP 100 (USD 49 in 2006) per patient per day of confinement (eligible intervention B hospitals) | 5% of total physician salaries | Yes | |
| Wagner 2018a | Target payment (quality scores) | The total bonus payments received by the hospital were distributed among physicians and other hospital staff and were paid quarterly | Unclear | Measured using CPV scores (focussed on dermatitis, diarrhoea and pneumonia) plus quarterly caseload scores and patient satisfaction scores. Biannually 2 trained physician abstractors scored 3 CPVs from randomly selected physicians at each hospital | PHP 100 (USD 49 in 2006) per patient per day of confinement (eligible intervention B hospitals) | 5% of total physician salaries | Yes | |
| Peabody 2014 | Target payment (quality scores) | The total bonus payments received by the hospital were distributed among physicians and other hospital staff and were paid quarterly | Unclear | Measured using CPV scores (focussed on dermatitis, diarrhoea and pneumonia) plus quarterly caseload scores and patient satisfaction scores. Biannually 2 trained physician abstractors scored 3 CPVs from randomly selected physicians at each hospital | PHP 100 (USD 49 in 2006) per patient per day of confinement (eligible intervention B hospitals) | 5% of total physician salaries | Yes | |
| Rwanda | Basinga 2011 | Payment per output modified by quality score (range 0–1) | Payments made directly to facilities and used at each facility's discretion. On average, facilities in intervention group allocated 77% of funds to increase personnel compensation; facilities in control group allocated 73% of the additional input‐based funds to increase personnel compensation | Unclear | Facilities submitted monthly reports and quarterly requests for payment to district P4P steering committee. Verification by steering committee | From USD 0.09 (number of first ANC visit) to USD 4.59 (number of deliveries in facility; number of emergency transfers to hospital for obstetric care during delivery) | Unclear | Yes |
| Lannes 2016 | Payment per output modified by quality score (range 0–1) | Payments made directly to facilities and are used at each facility's discretion. On average, facilities in intervention group allocated 77% of funds to increase personnel compensation; facilities in control group allocated 73% of the additional input‐based funds to increase personnel compensation | Unclear | Facilities submitted monthly reports and quarterly requests for payment to district P4P steering committee. Verification by steering committee | From USD 0.09 (number of first ANC visit) to USD 4.59 (number of deliveries in facility; number of emergency transfers to hospital for obstetric care during delivery) | Unclear | Yes | |
| Priedeman Skiles 2013 | Payment per output modified by quality score (range 0–1) | Payments made directly to facilities and used at each facility's discretion. On average, facilities in intervention group allocated 77% of funds to increase personnel compensation; facilities in control group allocated 73% of the additional input‐based funds to increase personnel compensation | Unclear | Facilities submitted monthly reports and quarterly requests for payment to district P4P steering committee. Verification by steering committee | From USD 0.09 (number of first ANC visit) to USD 4.59 (number of deliveries in facility; number of emergency transfers to hospital for obstetric care during delivery) | Unclear | Yes | |
| Priedeman Skiles 2015 | Payment per output modified by quality score (range 0–1) | Payments made directly to facilities and used at each facility's discretion. On average, facilities in intervention group allocated 77% of funds to increase personnel compensation; facilities in control group allocated 73% of the additional input‐based funds to increase personnel compensation | Unclear | Facilities submitted monthly reports and quarterly requests for payment to district P4P steering committee. Verification by steering committee | From USD 0.09 (number of first ANC visit) to USD 4.59 (number of deliveries in facility; number of emergency transfers to hospital for obstetric care during delivery) | Unclear | Yes | |
| Sherry 2017 | Payment per output modified by quality score (range 0–1) | Payments made directly to facilities and used at each facility's discretion. On average, facilities in intervention group allocated 77% of funds to increase personnel compensation; facilities in control group allocated 73% of the additional input‐based funds to increase personnel compensation | Unclear | Facilities submitted monthly reports and quarterly requests for payment to district P4P steering committee. Verification by steering committee | From USD 0.09 (number of first ANC visit) to USD 4.59 (number of deliveries in facility; number of emergency transfers to hospital for obstetric care during delivery) | Unclear | Yes | |
| Lannes 2015 | Payment per output modified by quality score (range 0–1) | Payments made directly to facilities and used at each facility's discretion. On average, facilities in intervention group allocated 77% of funds to increase personnel compensation; facilities in control group allocated 73% of the additional input‐based funds to increase personnel compensation | Unclear | Facilities submitted monthly reports and quarterly requests for payment to district P4P steering committee. Verification by steering committee | From USD 0.09 (number of first ANC visit) to USD 4.59 (number of deliveries in facility; number of emergency transfers to hospital for obstetric care during delivery) | Unclear | Yes | |
| Shapira 2018 | CCP to community co‐operatives | Indication was that the extra P4P programme operated similarly to the background P4P programme operational since 2009; however, implementers themselves were noted to have been confused: 30% of the co‐operative payments under the usual P4P scheme could be given to members; 70% minimum had to be reinvested in the co‐operative | Unclear | Co‐operative reporting (incentivized as part of a background P4P programme) | Varied 2010–2014. 2010: from USD 2.11 (per regular family planning user) to USD 3.24 (per child monitored for nutritional status). 2014: from USD 0.43 (per child monitored for nutritional status) to USD 1.05 (per new family planning user) | About 1% of gross national income (USD 7.3 on average, compared to gross national income USD 690/capita) | Yes | |
| Rusa 2009a | Payment per output modified by quality score (quality score could only decrease the payment) | Unclear | Unclear who set targets – presumed MoH with support of Belgian Technical Cooperation. Indicators linked to services delivered and service quality | District supervisors collected monthly data on quantity and quality of services. Verification by 2 supervisors trained by central level supervisors | RWF 100–2500 (USD 0.18–4.5) per unit for basic activities | Subsidy/salary ratio 39% in 2005, 84% in 2006, 40% in 2007 (all personnel confounded). About 32–78% of the base salary of an auxiliary nurse A2 | Yes | |
| Gertler 2013 | Payment per output modified by quality score (range 0–1) | Payments made directly to facilities and used at each facility's discretion. On average, facilities in intervention group allocated 77% of funds to increase personnel compensation; facilities in control group allocated 73% of the additional input‐based funds to increase personnel compensation | Unclear | Facilities submitted monthly reports and quarterly requests for payment to district P4P steering committee. Verification by steering committee | From USD 0.18 (e.g. per curative care visit) to USD 4.59 (e.g. per delivery in the facility) | 24.6% increase in funding above the base budget | Yes | |
| de Walque 2015 | Payment per output | Payments made directly to facilities and used at each facility's discretion. On average, facilities in intervention group allocated 60–80% of funds to increase personnel compensation | MoH | Facilities submitted monthly reports and quarterly requests for payment to district P4P steering committee. Verification by steering committee | From USD 0.46 (per HIV‐positive patient treated with co‐trimoxazole each month) to USD 9.17 (per infant born to HIV‐positive mothers tested) | 14% of overall expenditures in 2007 | Yes | |
| Swaziland | Kliner 2015 | Payment per output | CSWs given monthly financial incentives to cover travel to the clinic with (or on behalf of) the patient, and cover other supplies for the patient | Unclear | Appeared to be TB register | USD 5.75 per month/per patient plus USD 34.40 per patient who completed treatment or was cured after 6 months | Unclear | Yes (assessed by review authors but not explicitly stated) |
| Tanzania | Brock 2018 | P4P (conditional provision of material goods) | Not applicable – this was about receiving gifts both conditional or not | Study team | Study team | Book | Not applicable (incentive was a book) | Yes |
| Binyaruka 2015 | P4P (target payment) | Full payment made to facilities if 100% of target achieved. If < 100% but ≥ 75% of targets achieved, 50% of payment was made. 75% of bonus payments distributed among health workers. Remaining 25% retained by facility – used for drugs, supplies, renovations | Unclear | National HMIS | Maximum USD 820 for dispensaries; USD 3220 for health centres; and USD 6790 for hospitals. | About 10% of health worker monthly salary | Yes | |
| Binyaruka 2017 | P4P (target payment) | Full payment made to facilities if 100% of target achieved. If < 100% but ≥ 75% of targets achieved, 50% of payment was made. 75% of bonus payments distributed among health workers. Remaining 25% retained by facility – used for drugs, supplies, renovations | Unclear | National HMIS | Maximum USD 820 for dispensaries; USD 3220 for health centres; and USD 6790 for hospitals | About 10% of health worker monthly salary | Yes | |
| Binyaruka 2018b | P4P (target payment) | Full payment made to facilities if 100% of target achieved. If < 100% but ≥ 75% of targets achieved, 50% of payment was made. 75% of bonus payments distributed among health workers. Remaining 25% retained by facility – used for drugs, supplies, renovations | Unclear | National HMIS | Maximum USD 820 for dispensaries; USD 3220 for health centres; and USD 6790 for hospitals | About 10% of health worker monthly salary | Yes | |
| Mayumana 2017 | P4P (target payment) | Full payment made to facilities if 100% of target achieved. If < 100% but ≥ 75% of targets achieved, 50% of payment was made. 75% of bonus payments distributed among health workers. Remaining 25% retained by facility – used for drugs, supplies, renovations | Unclear | National HMIS | Maximum USD 820 for dispensaries; USD 3220 for health centres; and USD 6790 for hospitals | About 10% of health worker monthly salary | Yes | |
| Zambia | Friedman 2016a | Conditional payment with quality adjustment (based on thresholds for quality scores of ≥ 61%. Quality scores additional to quantity. Contracting done by provincial steering committees | Health facilities authorized to use ≥ 40% of P4P payments for operational activities, and to increase service delivery. Up to 60% of payments could be used for staff motivation bonuses | Assumed MoH and RBF Steering Committees | Measurement through facility level data. Verification by DMOs (on quantity indicators) and District (General) Hospitals (on quality). Additional verification by District RBF Steering Committees | From USD 0.2 (curative consultation) to USD 6.4 (institutional deliveries by skilled birth attendant) | 10% of staff salaries | Yes |
| Shen 2017 | Conditional payment with quality adjustment (based on thresholds for quality scores of ≥ 61%. Quality scores additional to quantity. Contracting done by provincial steering committees | Health facilities authorized to use ≥ 40% of P4P payments for operational activities, and to increase service delivery. Up to 60% of payments could be used for staff motivation bonuses | Assumed MoH and RBF Steering Committees | Measurement through facility level data. Verification by DMOs (on quantity indicators) and District (General) Hospitals (on quality). Additional verification by District RBF Steering Committees | From USD 0.2 (curative consultation) to USD 6.4 (institutional deliveries by skilled birth attendant) | 10% of staff salaries | Yes | |
| Chansa 2015 | CCP + quality adjustment (multiplicative, not additional) | Unclear | Price of each indicator set based on baseline coverage, MoH targets and complexity of delivery | Measured via HMIS. Verification by a hospital contracted by the DMO; DMO verified self‐reporting of facilities into HMIS; University of Zambia conducted external quality audits | From USD 0.2 (curative consultation) to USD 6.4 (institutional deliveries by skilled birth attendant) | 2–56% of staff salary, dependent on area | Yes | |
| Zimbabwe | Friedman 2016b | Combination of CCP (payment per targeted service) and quality adjustment (quality per service additional to the main CCP, capped at 25% of the main CCP, scores were scaled and quality score > 50% to receive minimum 15%). Additional remoteness bonus for facilities | According to Government's guidelines, facilities could share maximum of 25% of P4P income among staff as salary supplements. Remaining 75% spent on improving facility working conditions, such as infrastructure, supplies, and equipment | Set by programme based on priorities for improvement | Facility records verified by MoH and implementing NGOs and University of Zimbabwe | From USD 0.05 (new OPD consultation) to USD 140 (caesarean section) | Unclear | Yes |
| Das 2017 | Combination of CCP + addition of quality (weighted 75%) and patient satisfaction (weighted 25%) bonus | According to Government's guidelines, facilities could share maximum of 25% of P4P income among staff as salary supplements. Remaining 75% spent on improving facility working conditions, such as infrastructure, supplies and equipment | Set by programme based on priorities for improvement | Facility records verified by MoH and implementing NGOs and University of Zimbabwe | Unclear | Unclear | Yes |
ANC: antenatal care; ARV: antiretroviral therapy; CGB: capitated global budget; CCP: conditional cash payment; CPV: clinical performance vignette; CSPS: care health and social promotion centre; CSW: community support worker; DMO: district medical officer; DOT: directly observed treatment; HMIS: Health Management Information System; MoH: Ministry of Health; MOPH: Ministry of Public Health; MSH: Management Sciences for Health; NCMS: New Cooperative Medical Scheme; NGO: non‐governmental organization; P4P: paying for performance; P4P: paying for performance; PHD: Provincial Health Department; RBF: results‐based funding; RDT: rapid diagnostic test; SOA: Special Operating Agencies; TB: tuberculosis.
Studies predominantly considered interventions implemented across both urban and rural locations (18 studies; 29%); however, two focused specifically only on urban environments (Brock 2018; Wu 2014). Twenty‐four studies (37%) provided no precise description of locations.
Over half of the reviewed studies described P4P schemes focused on reproductive, maternal and child health services only; eight schemes were more focused in relation to clinical area (e.g. as in Kliner 2015 and Yao 2008 where the focus was on tuberculosis).
Thirty‐six studies (61%) reported on schemes operating at both inpatient and outpatient levels, nine (15%) focused on outpatient care, nine (15%) focused on inpatient care and two studies on community‐based care exclusively (Kliner 2015; Witvorapong 2016).
Participants
Fifty‐four studies (91%) reported on P4P schemes involving public or not‐for‐profit facilities (usually faith‐based). Two studies included a mix of public, private and not‐for‐profit (Brock 2018; Huillery 2017), and one study focused on private health providers exclusively (Mohanan 2017).
Scheme funders
Overall, 22 studies described schemes funded by national governments or Ministries of Health, 20 studies described schemes funded by external agencies and 4 studies described schemes funded by external agencies in partnership with national entities. In the case of 14 studies, funding arrangements were unclear. As per Table 8 , none of the schemes were funded without some level of national support; no schemes were funded only by subnational or local funds. Three further studies (5%) noted that schemes were cofinanced by national governments and external donors or non‐governmental organizations, and 13 studies (22%) provided no clear details on scheme funders. Across schemes funded by external agencies, the World Bank and Government of Norway were the main funders, having supported 11 (19%; the World Bank) and 5 (7%; Government of Norway) schemes. These were also the main funders of the impact evaluations included in the review (the World Bank contributed to about 17 (29%) studies and the Government of Norway five (10%)). Four studies (7%) were further funded by the US National Institute of Health and the remainder by a varied mix of funders, including the Bill and Melinda Gates Foundation, CORDAID and the EU.
Scale of intervention
The scale of implementation differed by country. Twenty‐six studies (42%) focused on studying intervention effects across a range of districts (e.g. as de Walque 2017 in Cameroon). Twelve studies (20%) focused on one particular province (e.g. Yip 2014), eight studies (13%) on a particular facility (e.g. Wu 2014), 13 studies (21%) on national level rollout and implementation of P4P (e.g. Gertler 2013). For the majority of P4P schemes described across 45 studies (76%), purchasing arrangements were integrated into the national purchasing functions of the relevant Ministry of Health.
Target setting and incentive payments
Schemes targeted a wide range of indicators, which varied in number among schemes. Very few schemes focused on one indicator only (e.g. Celhay 2015, Argentina), while others noted that schemes had used as many as 42 indicators (e.g. as in Burundi as reported by Falisse 2015). On average, schemes targeted approximately eight to 12 core indicators, which related to the delivery or utilization of services.
Thirty‐three studies (57%) included no details on why and how indicators were chosen and set. Studies which included details on these processes suggested that consultative processes between national Ministry of Health actors, non‐governmental and aid organizations were employed to set targets based on emerging priorities or in line with best locally or internationally available evidence.
Magnitude of incentives
The absolute magnitude of incentives appeared to range between USD 0.5 and USD 10 per indicator. However, for some indicators that required repeat contact with the health service, or implied specialist skills, studies used capita costs. These were consistently priced at higher rates (e.g. correct tuberculosis patient management and skilled birth attendance were incentivized at USD 20/patient in Bonfrer 2014a and at USD 35.63 in Engineer 2016).
Thirty‐two studies (54%) reported the relative magnitude of incentives. Of these, 10 studies noted the relative magnitude of incentives in relation to facility funding; most studies estimate that P4P incentives equated to 14% to 50% of funds available to facilities overall. Fourteen studies further noted the relative magnitude of incentives in relation to health worker salaries; incentives were estimated to equate to 1% to 78% of health worker salaries; however, most studies reported incentives equal to approximately 10% of overall annual pay.
Measurement and verification of performance
Thirty‐eight studies (61%) assessed performance against incentivized indicators using data routinely reported by health facilities. Ten studies (16%) similarly noted using data captured by the national health management information systems or equivalent electronic health record systems as the basis for performance measurement. Thirty‐two of these studies additionally described verification procedures, which included assessments by district level management teams, study teams active in assessing the effectiveness of P4P schemes or by teams including community and purchaser representatives.
Four studies (6.4%) described verification via national level statistics or via bespoke community and household surveys.
In 10 studies (16%) it was unclear how they measured and verified performance.
Assessment and purchasing arrangements
Thirty‐three studies (55%) focused scheme assessment and payment at health facility level, seven studies at both district and health facility levels, and six studies at health worker level directly.
Fifty studies (85%) reported that P4P payments were additional to normal wages or funding received. Only two studies conducted in China, both focused on containment of unnecessary health‐related services and expenditures, reported on schemes whereby health facilities or health workers may have been penalized (i.e. fines would need to be paid if outcomes were not achieved) as a result of P4P schemes.
Predominantly payments appear to be made to health facilities directly, which then cascaded payments to healthcare workers as agreed in the setup of the P4P scheme. This may have been at the discretion of the facility (e.g. as in Zeng 2013 in Haiti) or may have been according to an agreed principle whereby a proportion of the overall bonus was shared with staff and the remainder was reinvested (e.g. as in Steenland 2017 in Burkina Faso).
Intervention classification
Schemes operated according to an assortment of designs (see Intervention classification Table 9 and Table 10). Most schemes focused on assessing performance at facility level and on providing a payment per incentivized indicator. However, even within this group, some schemes focused on incentivizing both the volume and quality of outputs, while others focused on incentivizing outputs only. Other schemes operated on a payment to target principle; while in most cases this meant that bonuses were released upon targets being met, one scheme applied penalties if targets were not achieved and consequently withheld income (Wu 2014). A minority of studies focused on schemes that included assessments of performance at district or national levels. Only one study focused on assessing the effects of results‐based aid (Bernal 2018).
7. Intervention classification – table A.
| Scheme classification (as based on descriptions provided in reviewed documents) | Details on scheme | Number of studies | Studies reporting | Countries included (number) | Study types (number) | Comparators against which scheme impacts assessed (number) |
| Capitation and P4P | Payment reforms including capitation and P4P elements | 2 | Sun 2016; Yip 2014 | China (2) | RCT (1) and quasi‐non randomized trial (1) | Fee for service (1) and global capitated budget only (1) |
| Conditional provision of material goods | Conditional provision of material goods alongside supervision and quality improvement strategies | 1 | Brock 2018 | Tanzania (1) | Quasi‐non randomized trial (1) | Unconditional gifts (either immediate or delayed) as alternative interventions and control (all received a standard encouragement intervention) (1) |
| Financial and non‐financial incentives + clinical decision guide | Mix of financial and non‐financial incentives, alongside clinical decision guide and supervision/technical support | 1 | Duysburgh 2016 | Burkina Faso, Ghana and Tanzania (all in 1) | CBA (1) | Control as standard care (1) |
| Performance‐related pay | Performance‐related pay (results‐based management) involving different types of agreement according to province implemented (ranging from multilevel agreements with strategic targets to not specified) | 1 | Viñuela 2015 | Brazil (1) | ITS (1) | Comparison of impact over time in implementing provinces (1) |
| Performance‐based contracting or service agreements | Service agreements introduced as part of reform and in case of contracting, with indicators for performance chosen at year end to avoid distortion | 3 | Khim 2018a; Van de Poel 2016; Zeng 2013 | Cambodia (2), Haiti (1) | CBA (2), ITS (1) | Routine practice as control (2) and comparison of indicators over time (1) |
| Hybrid scheme | Payment per output and for target | 2 | Cruzado de la Vega 2017; Powell‐Jackson 2014 | China (1), Peru (1) | Quasi/non‐randomized trials (2) | Control as standard care (2) |
| Results‐based aid | Fixed element alongside a targeted element as part of results‐based aid | 1 | Bernal 2018 | El‐Salvador (1) | CBA (1) | Control as status quo (1) |
CBA: controlled before‐after study; ITS: interrupted time series study; P4P: paying for performance; RCT: randomized controlled trial.
8. Intervention classification – table B.
| Scheme classification (as based on descriptions provided in reviewed documents) | Details on scheme | Number of Studies | Studies | Countries included (number) | Study types (number) | Comparators against which scheme impacts assessed (number) | |
| Payment per output | Payment per output | Payment for each output | 9 | Celhay 2015; de Walque 2015; Huillery 2017; Ir 2015; Kliner 2015; Matsuoka 2014; Shapira 2017; Witvorapong 2016; Yao 2008 | Afghanistan (1), Argentina (1), China (1), Cambodia (2), Democratic Republic of the Congo (1), Swaziland (1), Rwanda (2) | RCT (4), quasi/non‐randomized (2), ITS (2), CBA (1) | Control as status quo/standard care (4), comparison over time in implementing locations (2), comparator of matched funding or background P4P programmes into which experiments nested (3) |
| Payment per output with income potentially withheld | 1 | Chang 2017 | China (1) | ITS (1) | Comparison of impact over time in implementing hospital (1) | ||
| Payment per output including revenue | 1 | Liu 2005 | China (1) | ITS (1) | Comparison over time in implementing provinces (1) | ||
| Payment per output modified by quality score | Payment per output with quality as multiplicative adjuster (0–1) | 11 | Basinga 2011; Chansa 2015; Gertler 2013; Lagarde 2015; Lannes 2015; Lannes 2016; Priedeman Skiles 2013; Priedeman Skiles 2015; Rusa 2009a; Sherry 2017; Zeng 2018 | Republic of the Congo (1), Zambia (1), Benin (1), Rwanda (8) | Quasi/non‐randomized trial (8), CBA (1), ITS (2) | Control with standard care (2), over time comparison in implementation areas (2), comparator of matched funding (7) | |
| Payment per output with quality bonuses (quality adjuster an additional but not detracting component) | 7 | Bonfrer 2014a; Bonfrer 2014b; Falisse 2015; Friedman 2016a; Rudasingwa 2014; Shen 2017 | Burundi (4), Zambia (2) | RCT (2) and CBA (4) | Control as standard care (5), comparator of enhanced matched financing (2) | ||
| No description of payment equation – quality adjustment noted | 1 | Engineer 2016 | Afghanistan (1) | RCT (1) | Control with standard care (1) | ||
| Payment per output modified by quality and equity score | Modification to payment equation based on population equity or remoteness of facilities | 5 | de Walque 2017; Friedman 2016b; Soeters 2011; Steenland 2017; Zang 2015 | Burkina Faso (1), Cameroon (2), Democratic Republic of the Congo (1), Zimbabwe (1) | Quasi/non‐randomized trials (2), CBA (3) | Control as standard care (4) and comparator including equipment and other in kind support (1) | |
| Payment per output modified by quality and satisfaction score | Modification to payment including bonuses for enhanced patient satisfaction | 2 | Das 2017; McMahon 2016 | Malawi (1), Zimbabwe (1) | CBA (2) and ITS (1) (1 study had both) | Control as standard care (2) | |
| Target payment | Target payment | Potential for income gain only | 12 | Binyaruka 2015; Binyaruka 2017; Binyaruka 2018b; Gertler 2014; Mayumana 2017; Menya 2015; Peabody 2011a; Peabody 2014; Quimbo 2016; Wagner 2018a | Argentina (1), Kenya (1), Philippines (4), Tanzania (4) | RCT (5), CBA (5) | Control as standard care/status quo (12) |
| Potential for income withheld | 1 | Wu 2014 | China (1) | ITS (1) | Over time (1) | ||
| Target payment or payment per input | 1 | Mohanan 2017 | India (1) | RCT (1) | Control as status quo (1) | ||
CBA: controlled before‐after study; ITS: interrupted time series study; P4P: paying for performance.
Ancillary components
A third of all studies reported that P4P schemes had no ancillary outcomes. However, most schemes included multiple ancillary components. Among these, quality improvement strategies, training, enhanced supervision activities and technical support were noted most commonly. Other components, such as receiving additional funding or in‐kind support (e.g. supplies), or putting in place strategies for consultation with other stakeholders to enhance the efficacy of processes needed to support P4P, were mentioned infrequently.
Comparator characteristics
Forty‐two studies focused on assessing P4P against a control, usually described as standard care within the respective country and health facilities. Other studies reported against comparator interventions predominantly focused on providing facilities with enhanced financing (i.e. funding matched to what facilities in the P4P arm were due to receive was disbursed to comparator facilities to isolate the effect of incentivization and performance assessment; e.g. as in Friedman 2016a). In other cases, comparators included an existing P4P scheme (e.g. as in Celhay 2015 or Shapira 2017) or provision of in‐kind support (e.g. as in Soeters 2011).
Outcomes reported
Schemes may target an indicator both directly, such as utilization of four or more ANC visits, as well as indirectly (e.g. by incentivizing four or more ANC visits, the area of ANC and care quality in general may in practice be incentivized). Therefore, studies predominantly reported on a range of both directly and indirectly targeted indicators to assess the effects of P4P. Some studies additionally focused on assessing the effects of P4P on explicitly untargeted indicators (e.g. Binyaruka 2015). Overall, studies reported a range of indicators; some reported specifically on one primary indicator (e.g. as Celhay 2015), while others included data on up to 386 indicators (e.g. as in Friedman 2016a).
Sources of heterogeneity and diversity
There were substantial sources of diversity in relation to study designs, clinical areas, patient groups studied, intervention designs and outcomes assessed. Because of this diversity, we did not conduct statistical pooling of results or formally assess statistical heterogeneity.
Excluded studies
We excluded 807 studies. A list of all excluded studies can be obtained from the authors upon request. A total of 402 studies was excluded due to study design issues. Full references of the 36 studies excluded due to other reasons are included in the Characteristics of excluded studies table.
Studies awaiting classification
We identified 60 studies (see Characteristics of studies awaiting classification table).
Ongoing studies
We identified 17 ongoing studies (see Characteristics of ongoing studies table).
Risk of bias in included studies
Drawing on assessments outlined in Appendix 6, we present a summary of the risk of bias assessment in the 'Risk of bias' graph (Figure 2) and in the 'Risk of bias' summary (Figure 3). While multiple studies may have reported on the same scheme, studies themselves frequently included diverse populations and we, therefore, assessed the risk of bias for each study. As expected, CBAs were at higher risk of bias than other study designs, particularly due to lacking randomization and allocation concealment. However, some RCTs were also downgraded on specific risk of bias criteria, predominantly due to differences in the baseline characteristics of P4P‐implementing areas versus control sites. ITS studies provided insufficient information (or attempted to control for) other concurrent changes going on in the countries or sites where P4P was implemented.
2.
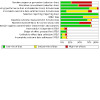
Risk of bias graph.
3.

Risk of bias summary.
Overall, we noted that selective outcome reporting was low: study authors consistently reported the effects of P4P on the outcomes identified at the outset of their impact evaluations. However, most authors failed to provide clear reports on how missing or incomplete data were handled during their studies or analyses.
Other potential sources of bias
We considered the potential bias introduced by unit of analysis issues, more specifically where studies did not adjust for clustering or adjusted for clustering at a level different to allocation (e.g. clustering by region when allocation was at facility level). Most studies reported facility level clustered difference‐in‐difference regression models, thus appropriately accounting for unit of analysis issues. However, for a few studies, we noted potential high risk of bias due to clustering at different levels (see Appendix 6 for detailed judgements on risk of bias assessments).
Effects of interventions
Summary of findings 1. Comparison 1: summary of findings on effects of paying for performance against standard care.
| Outcome | Summary of impacts | Certainty of the evidence (GRADE)a |
| Primary outcomes | ||
| Health outcomes | When targeted, P4P may (low‐certainty evidence):
When not targeted, P4P probably slightly reduces child mortality, and the proportions of children with anaemia and with wasting (moderate‐certainty evidence). |
⊕⊕⊖⊖ Low |
| Delivery and utilization of health services | When targeted, the effects of P4P on the delivery and utilization of services was inconsistent: the intervention may improve some delivery and utilization indicators but may lead to poorer results for other indicators. Specifically:
When not targeted, the effects may be inconsistent (low‐certainty evidence). |
⊕⊕⊖⊖ Low |
| Quality of care | Overall, P4P may improve the quality of targeted services (low‐certainty evidence). In addition, P4P probably (moderate‐certainty evidence):
We are uncertain of the effects of P4P on procedural quality of care as the certainty of the evidence was very low. P4P may make little or no difference to staff knowledge and skills (low‐certainty evidence), and its effects on staff responsiveness were uncertain overall (very low‐certainty evidence). When not targeted, the effects may be inconsistent (low‐certainty evidence). |
⊕⊕⊖⊖ Low |
| Unintended effects | P4P may have few or no distorting unintended effects on outcomes that were not targeted (low‐certainty evidence). | ⊕⊕⊖⊖ Low |
| Resource use | Overall, P4P may have desirable effects on resource use when targeted (low‐certainty evidence). In addition, P4P probably (moderate‐certainty evidence):
When not targeted, we are uncertain of the effects as the certainty of the evidence was very low. |
⊕⊕⊖⊖ Low |
| Secondary outcomes | ||
| Provider motivation, satisfaction, absenteeism and acceptability | When targeted, P4P probably makes little or no difference to provider absenteeism (range: 0.7–2%; moderate‐certainty evidence) and may make little or no difference to overall motivation scores and satisfaction (low‐certainty evidence). When not targeted, the intervention may have desirable effects (low‐certainty evidence). |
⊕⊕⊖⊖ Low |
| Patient satisfaction and acceptability | When targeted, P4P may have desirable effects, with only two outcomes (satisfaction with care quality and provider communication) showing little to no difference in response to P4P (low‐certainty evidence). When not targeted, P4P may have desirable effects, except for satisfaction with provider–patient contact time and facility opening hours (low‐certainty evidence). |
⊕⊕⊖⊖ Low |
| Impacts on management or information systems (if not a targeted measure of performance) | When targeted, P4P may positively affect facility managerial autonomy (low‐certainty evidence), but probably makes little to no difference to management quality or facility governance (moderate‐certainty evidence). When not targeted, effects are inconsistent. |
⊕⊕⊖⊖ Low |
| Equity considerations: evidence of differential impacts on different parts of the population | When targeted, P4P may increase the proportion of poor people utilizing child immunization services, but may decrease the proportion of poor people utilizing antenatal care. P4P may make little to no difference to the utilization of institutional deliveries by the poorest groups (all low‐certainty evidence). When not targeted, effects are inconsistent. |
⊕⊕⊖⊖ Low |
|
GRADE Working Group grades of evidence High certainty: This research provides a very good indication of the likely effect. The likelihood that the effect will be substantially different* is low. Moderate certainty: This research provides a good indication of the likely effect. The likelihood that the effect will be substantially different* is moderate. Low certainty: This research provides some indication of the likely effect. However, the likelihood that it will be substantially different* is high. Very low certainty: This research does not provide a reliable indication of the likely effect. The likelihood that the effect will be substantially different** is very high. * Substantially different = a large enough difference that it might affect a decision | ||
ART: antiretroviral therapy; P4P: paying for performance; PMTCT: prevention of mother‐to‐child transmission.
aGRADE assessments refer to summative judgements of the review authors across multiple outcomes. See Table 2 for a detailed account of all outcomes and relevant GRADE assessments.
A meta‐summary for each outcome of the contributing indicators, including the direction of effect and certainty of the evidence, is available in Table 2.
The detailed data underlying these tables are available in Appendix 1.
Summary of findings 2. Comparison 2: summary of findings on effects of paying for performance against comparator interventions.
| Outcome | Summary of impacts | Certainty of the evidence (GRADE)a |
| Primary outcomes | ||
| Health outcomes | P4P may make little to no difference to health outcomes, both when targeted and when not targeted (low‐certainty evidence). | ⊕⊕⊖⊖ Low |
| Delivery and utilization of health services | When targeted, P4P may (low‐certainty evidence):
Evidence on the effects of P4P on non‐targeted utilization outcomes was sparse, and the available evidence suggests it may make little or no difference (low‐certainty evidence). |
⊕⊕⊖⊖ Low |
| Quality of care | When targeted, P4P may (low‐certainty evidence):
When not targeted, we are uncertain of the effects as the certainty of the evidence was very low. |
⊕⊕⊖⊖ Low |
| Unintended effects | No studies reported evidence on distorting unintended effects. | |
| Changes in resource use | When targeted, P4P may have mixed effects (low‐certainty evidence): it may increase equipment availability by 75% but may reduce medicine availability by up to 160%. When not targeted, we are uncertain of the effects as the certainty of the evidence was very low. |
⊕⊕⊖⊖ Low |
| Secondary outcomes | ||
| Provider motivation, satisfaction, absenteeism and acceptability | No studies assessed directly targeted indicators for provider motivation, satisfaction, absenteeism and acceptability. When not targeted, P4P may make little or no difference to these outcomes (low‐certainty evidence). |
⊕⊕⊖⊖ Low |
| Patient satisfaction and acceptability | No studies assessed directly targeted indicators for patient satisfaction and acceptability. When not targeted, P4P may have desirable effects (e.g., on cleanliness, waiting and contact time indicators), but may make little to no difference to overall patient satisfaction scores (low‐certainty evidence). |
⊕⊕⊖⊖ Low |
| Impacts on management or information systems (if not a targeted measure of performance) | When targeted, P4P may have desirable effects (low‐certainty evidence). When not targeted, we are uncertain of the impacts as the certainty of the evidence was very low. |
⊕⊕⊖⊖ Low |
| Equity considerations: evidence of differential impacts on different parts of the population | When targeted, P4P may make little or no difference to equity, or may worsen equity (low‐certainty evidence). For example, P4P may increase utilization of family planning services and institutional deliveries among wealthier population groups. No studies assessed equity considerations for non‐targeted outcomes. |
⊕⊕⊖⊖ Low |
|
GRADE Working Group grades of evidence High certainty: This research provides a very good indication of the likely effect. The likelihood that the effect will be substantially different* is low. Moderate certainty: This research provides a good indication of the likely effect. The likelihood that the effect will be substantially different* is moderate. Low certainty: This research provides some indication of the likely effect. However, the likelihood that it will be substantially different* is high. Very low certainty: This research does not provide a reliable indication of the likely effect. The likelihood that the effect will be substantially different** is very high. * Substantially different = a large enough difference that it might affect a decision | ||
P4P: paying for performance.
aGRADE assessments here refer to summative judgements of the authors across multiple outcomes. See Table 4 for a detailed account of all outcomes and relevant GRADE assessments.
A meta‐summary for each outcome of the contributing indicators, including the direction of effect and certainty of the evidence, is available in Table 4.
The detailed data underlying these tables are available in Appendix 2.
Within the 59 studies included in this review update, 42 reported the effects of P4P against a standard care or status quo control group, 13 reported the effects against an enhanced financing control or alternative financing intervention and four reported effects against both a control and matched or otherwise enhanced financing comparator. Forty‐one studies noted that P4P schemes were accompanied by a diverse range of ancillary components. Predominantly these components focused on training and supervision initiatives and, in some cases, increases in overall resources allocated to facilities to assist with the rollout of P4P schemes. Therefore, this must be considered when interpreting the estimates of the impact of P4P. We have highlighted differences in context, intervention design, resourcing and ancillary components in the Discussion.
Comparison 1: paying for performance versus standard care
Overarching trends
A meta‐summary of the effects of P4P on individual indicators assessed against standard care, grouped by each of the primary outcomes of the review, is presented in Table 2 (Meta‐summary: effects of P4P versus control) and Table 1. All individual 'Summary of findings' tables, by outcome, are available in Appendix 1. We extracted effects on indicators directly targeted by P4P schemes (see Appendix 1: Tables 1 to 23) and indicators not explicitly targeted (see Appendix 1: tables 24 to 45). It should be noted that the same indicator may have been directly targeted in one study but not explicitly targeted in another study. Some of the same indicators therefore appear below under both 'Effects on targeted outcomes' and 'Effects on untargeted outcomes.'
1. Meta‐summary: effects of paying for performance versus control.
| Outcome | Indicator | Direction of relative effect and GRADE assessment for targeted and un‐targeted outcomes | |||
| Targeted outcomes | Untargeted outcomes | ||||
| Direction of effect | Certainty of the evidence | Direction of effect | Certainty of the evidence | ||
| Primary: health outcomes | Child mortality (per 1000 children born alive) | ▲ | ⊕⊕⊖⊖ | ▲ | ⊕⊕⊕⊖ |
| Neonatal mortality (rate) | □ | ⊕⊕⊖⊖ | ▬ | ⊕⊕⊕⊖ | |
| Incidence of sickness | No evidence | ▲ | ⊕⊕⊖⊖ | ||
| Child wasting (%) | No evidence | ▲ | ⊕⊕⊕⊖ | ||
| Unwanted pregnancy rate (targeted); overall pregnancy rate (non‐targeted) | □ | ⊕⊖⊖⊖ | ▬ | ⊕⊕⊕⊖ | |
| Reported illness in children: anaemia (%) | ▲ | ⊕⊕⊖⊖ | ▲ | ⊕⊕⊕⊖ | |
| TB treatment success rate | ▲ | ⊕⊕⊖⊖ | No evidence | ||
| Primary: utilization and delivery | Provision of HIV testing (%) | ▲ | ⊕⊕⊖⊖ | ▲ | ⊕⊕⊖⊖ |
| Provision of ART services (%) | ▼ | ⊕⊕⊖⊖ | No evidence | ||
| Provision of PMTCT (%) | ▲ | ⊕⊕⊖⊖ | No evidence | ||
| Bednet use (% of children and households using bednets) | ▼ | ⊕⊕⊖⊖ | ▬ | ⊕⊕⊕⊖ | |
| TB adherence rate | □ | ⊕⊖⊖⊖ | No evidence | ||
| Child immunization: % ≥ 1 vaccine | ▬ | ⊕⊕⊖⊖ | No evidence | ||
| Child immunization: % fully vaccinate | □ | ⊕⊕⊖⊖ | No evidence | ||
| Child immunization: % receiving BCG | ▲ | ⊕⊕⊖⊖ | No evidence | ||
| Child immunization: % receiving DTP | ▼ | ⊕⊕⊖⊖ | No evidence | ||
| Child immunization: % receiving measles vaccine | ▲ | ⊕⊕⊖⊖ | No evidence | ||
| Child immunization: % receiving polio vaccine | ▲ | ⊕⊕⊖⊖ | No evidence | ||
| Child immunization: % receiving pentavalent vaccine | ▬ | ⊕⊕⊖⊖ | No evidence | ||
| Mothers receiving immunizations (%) | ▲ | ⊕⊕⊖⊖ | No evidence | ||
| Probability of any utilization (%) | ▬ | ⊕⊕⊖⊖ | ▬ | ⊕⊕⊖⊖ | |
| Frequency of curative utilization (%) | ▲ | ⊕⊕⊖⊖ | □ | ⊕⊖⊖⊖ | |
| Frequency of outpatient utilization (%) | ▲ | ⊕⊕⊖⊖ | ▬ | ⊕⊕⊖⊖ | |
| Frequency – all visits (number of visits) | ▬ | ⊕⊕⊖⊖ | ▬ | ⊕⊕⊖⊖ | |
| Frequency – elderly visits | No evidence | ▬ | ⊕⊕⊖⊖ | ||
| ANC (% of women utilizing ANC) | ▲ | ⊕⊕⊖⊖ | ▬ | ⊕⊕⊖⊖ | |
| Total number ANC visits | □ | ⊕⊕⊖⊖ | No evidence | ||
| ≥ 1 ANC (utilization rates) | ▲ | ⊕⊕⊖⊖ | □ | ⊕⊖⊖⊖ | |
| ≥ 2 ANC (utilization rates) | ▬ | ⊕⊕⊖⊖ | □ | ⊕⊖⊖⊖ | |
| ≥ 4 ANC (utilization rates) | ▲ | ⊕⊕⊖⊖ | □ | ⊕⊖⊖⊖ | |
| ANC from qualified provider (utilization rate) | ▬ | ⊕⊕⊖⊖ | No evidence | ||
| Delivery of iron supplementation during ANC (% women receiving) | ▼ | ⊕⊕⊖⊖ | No evidence | ||
| Women accessing ANC in first trimester (% women receiving) | ▲ | ⊕⊕⊖⊖ | ▲ | ⊕⊕⊖⊖ | |
| Family planning (% using of any method) | □ | ⊕⊕⊖⊖ | No evidence | ||
| Family planning (% women utilizing modern methods) | □ | ⊕⊕⊖⊖ | ▬ | ⊕⊕⊕⊖ | |
| Family planning (% of services delivered) | ▲ | ⊕⊕⊕⊖ | ▲ | ⊕⊕⊖⊖ | |
| Institutional delivery (rates or coverage) | □ | ⊕⊖⊖⊖ | ▬ | ⊕⊕⊖⊖ | |
| Institutional delivery: caesarean section (%) | ▲ | ⊕⊕⊖⊖ | □ | ⊕⊖⊖⊖ | |
| Institutional delivery: skilled attendance | ▲ | ⊕⊕⊖⊖ | No evidence | ||
| Delivery and coverage of PNC | ▲ | ⊕⊕⊖⊖ | ▲ | ⊕⊕⊖⊖ | |
| PNC (overall utilization rate) | ▲ | ⊕⊕⊖⊖ | ▼ | ⊕⊕⊕⊖ | |
| PNC: skilled attendance (% women receiving) | ▲ | ⊕⊕⊖⊖ | No evidence | ||
| PNC: timely access (% women receiving) | ▲ | ⊕⊕⊖⊖ | ▲ | ⊕⊕⊖⊖ | |
| Utilization rate of consultations in children | ▲ | ⊕⊕⊖⊖ | □ | ⊕⊖⊖⊖ | |
| Utilization rate of curative consultations in children | ▼ | ⊕⊕⊖⊖ | No evidence | ||
| Vitamin A supplementation in children (rate) | ▲ | ⊕⊕⊖⊖ | No evidence | ||
| Primary: quality of care | Background and physical assessment (scores general, across ANC, PNC, childcare and for other consultations) | □ | ⊕⊖⊖⊖ | No evidence | |
| Correct patient management by healthcare providers (scores in relation to ANC, childcare and PNC) | □ | ⊕⊖⊖⊖ | ▬ | ⊕⊕⊕⊖ | |
| Patient counselling (scores on ANC‐ and PNC‐related counselling) | □ | ⊕⊖⊖⊖ | No evidence | ||
| Immunizations (score for receiving any tetanus and number of tetanus vaccinations) | ▲ | ⊕⊕⊖⊖ | ▲ | ⊕⊕⊖⊖ | |
| Women in ANC given or prescribed folic acid/iron | ▲ | ⊕⊕⊖⊖ | No evidence | ||
| Prescription quality of care (index score when targeted, % women receiving correct prescription in case of illness for non‐targeted) | ▲ | ⊕⊕⊖⊖ | No evidence | ||
| Staff knowledge and skills (scores) | ▬ | ⊕⊕⊖⊖ | ▬ | ⊕⊕⊖⊖ | |
| Staff responsiveness (scores) | ▲ | ⊕⊖⊖⊖ | No evidence | ||
| Patient knowledge (score) | ▲ | ⊕⊕⊖⊖ | ▬ | ⊕⊕⊕⊖ | |
| Contact time (% change) | ▬ | ⊕⊕⊖⊖ | ▬ | ⊕⊕⊖⊖ | |
| Waiting time (% change) | ▼ | ⊕⊕⊖⊖ | □ | ⊕⊖⊖⊖ | |
| Length of stay (% change) | No evidence | ▼ | ⊕⊕⊖⊖ | ||
| Overall composite quality of care score | ▲ | ⊕⊕⊖⊖ | ▼ | ⊕⊕⊕⊖ | |
| Quality family planning (score) | ▲ | ⊕⊕⊖⊖ | No evidence | ||
| Quality of ANC (score) | □ | ⊕⊕⊖⊖ | No evidence | ||
| Quality maternity care (score) | ▲ | ⊕⊕⊖⊖ | □ | ⊕⊖⊖⊖ | |
| Quality of child health care (score) | ▲ | ⊕⊕⊕⊖ | No evidence | ||
| Quality of outpatient services (score) | □ | ⊕⊖⊖⊖ | □ | ⊕⊖⊖⊖ | |
| Quality of medicine and equipment (score) | ▲ | ⊕⊕⊕⊖ | □ | ⊕⊖⊖⊖ | |
| Quality by department or service, or both (score) | ▲ | ⊕⊕⊕⊖ | No evidence | ||
| Primary: unintended effects | Overall impacts on free riding and task shifting | No evidence | ▬ | ⊕⊕⊖⊖ | |
| Primary: changes in resource use | Human resource availability (people available) | ▲ | ⊕⊕⊕⊖ | □ | ⊕⊖⊖⊖ |
| Curative health visits per healthcare professional | □ | ⊕⊖⊖⊖ | □ | ⊕⊖⊖⊖ | |
| Equipment availability (index) | ▲ | ⊕⊕⊖⊖ | □ | ⊕⊖⊖⊖ | |
| Equipment functionality (index) | ▬ | ⊕⊕⊖⊖ | □ | ⊕⊖⊖⊖ | |
| Infrastructure functionality (index) | ▲ | ⊕⊕⊖⊖ | ▬ | ⊕⊕⊖⊖ | |
| Medicine availability (index) | ▲ | ⊕⊕⊖⊖ | ▲ | ⊕⊕⊖⊖ | |
| Vaccine availability (index) | □ | ⊕⊕⊖⊖ | □ | ⊕⊖⊖⊖ | |
| Stockout of equipment | ▲ | ⊕⊕⊖⊖ | □ | ⊕⊖⊖⊖ | |
| Stockout of medicines | No evidence | □ | ⊕⊖⊖⊖ | ||
| Stockout of vaccines | ▲ | ⊕⊕⊖⊖ | No evidence | ||
| Secondary: provider motivation, satisfaction, absenteeism and acceptability | Provider absenteeism (%) | ▬ | ⊕⊕⊖⊖ | ▲ | ⊕⊕⊕⊖ |
| Provider motivation (score) | ▬ | ⊕⊕⊕⊖ | ▲ | ⊕⊕⊖⊖ | |
| Provider satisfaction (score) | ▬ | ⊕⊕⊕⊖ | □ | ⊕⊕⊖⊖ | |
| Secondary: patient satisfaction and acceptability (satisfaction scores) | Patient satisfaction with facility cleanliness (score) | ▲ | ⊕⊕⊖⊖ | □ | ⊕⊕⊖⊖ |
| Patient satisfaction with contact time (score) | □ | ⊕⊖⊖⊖ | ▼ | ⊕⊕⊖⊖ | |
| Patient satisfaction with opening hours (score) | ▲ | ⊕⊕⊖⊖ | ▼ | ⊕⊕⊖⊖ | |
| Patient satisfaction with waiting time (score) | □ | ⊕⊖⊖⊖ | □ | ⊕⊕⊖⊖ | |
| Patient satisfaction with privacy (score) | ▲ | ⊕⊕⊖⊖ | No evidence | ||
| Overall patient satisfaction with quality of care (score) | ▬ | ⊕⊕⊖⊖ | ▲ | ⊕⊕⊖⊖ | |
| Overall patient satisfaction with welcome and reception at facility (score) | No evidence | ▲ | ⊕⊕⊖⊖ | ||
| Patient satisfaction with staff: communication (score) | ▬ | ⊕⊕⊖⊖ | ▲ | ⊕⊕⊖⊖ | |
| Patient satisfaction with staff: trust (score) | No evidence | ▲ | ⊕⊕⊖⊖ | ||
| Patient satisfaction with staff: attitude (score) | ▲ | ⊕⊕⊖⊖ | ▲ | ⊕⊕⊖⊖ | |
| Overall satisfaction (score) | ▲ | ⊕⊕⊖⊖ | ▲ | ⊕⊕⊕⊖ | |
| Secondary: impacts on overall financing or resource allocation | Fees | No evidence | ▼ | ⊕⊕⊖⊖ | |
| Expenditure on medicine and equipment | ▬ | ⊕⊕⊖⊖ | ▬ | ⊕⊕⊕⊖ | |
| Probability of payment for users | No evidence | □ | ⊕⊕⊖⊖ | ||
| Secondary: impacts on management or information systems (if not a targeted measure of performance) | Facility or managerial autonomy | ▲ | ⊕⊕⊖⊖ | ▲ | ⊕⊕⊖⊖ |
| Facility governance | ▬ | ⊕⊕⊖⊖ | ▼ | ⊕⊕⊖⊖ | |
| Quality of management | ▬ | ⊕⊕⊖⊖ | ▼ | ⊕⊕⊖⊖ | |
| Secondary: equity‐consideration: evidence of differential impact on different parts of the population | Equity of child immunization delivery (wealth‐related) | ▲ | ⊕⊕⊖⊖ | □ | ⊕⊖⊖⊖ |
| Equity in ANC delivery (wealth‐related) | ▼ | ⊕⊕⊖⊖ | No evidence | ||
| Equity in institutional delivery (wealth‐related) | ▬ | ⊕⊕⊖⊖ | ▼ | ⊕⊕⊖⊖ | |
| Equity in institutional delivery (by educational status of mother) | ▬ | ⊕⊕⊖⊖ | □ | ⊕⊖⊖⊖ | |
ANC: antenatal care; ART: antiretroviral therapy; BCG: Bacillus Calmette–Guérin; DTP: diphtheria‐tetanus‐pertussis; PMTCT: prevention of mother‐to‐child transmission; PNC: postnatal care; TB: tuberculosis.
Direction of effect key
▲: desirable; ▼: non‐desirable; ▬: neutral; □: uncertain
Certainty of the evidence key
⊕⊕⊕⊖: moderate; ⊕⊕⊖⊖: low; ⊕⊖⊖⊖: very low
Data availability: for each of the above outcomes, details of the contributing studies and assessments are available in the secondary 'Summary of findings' tables in Appendix 1, as follows.
- Targeted health outcomes: Section 1.1.
- Targeted measures of provider performance (utilization and delivery, and quality of care): Section 1.2.
- Targeted changes in resource use: Section 1.3.
- Targeted secondary outcomes: Section 1.4.
- Untargeted measures of provider performance (utilization and delivery, and quality of care): Section 1.5.
- Untargeted health outcomes: Section 1.6.
- Unintended effects: Section 1.7.
- Untargeted resource use: Section 1.8.
- Untargeted secondary outcomes: Section 1.9.
Comparison 1a: effects on targeted outcomes
Summary of findings tables 1 to 24 in Appendix 1 present the evidence collated for each of the primary and secondary outcomes.
1.1. Health outcomes
Few studies focused on assessing health outcomes. The available evidence suggests that overall P4P may improve some health outcomes (Table 2; Appendix 1: Tables 1 to 4):
child mortality: P4P may reduce child mortality (range: 0.2–6.5%; low‐certainty evidence; Appendix 1: Table 2);
anaemia in children: P4P may lead to a modest reduction of 2% to 3% in the proportion of children with reported anaemia (low‐certainty evidence; Appendix 1: Table 3);
the likelihood of tuberculosis treatment success (range: 12% to 20% improvement in treatment success; low‐certainty evidence; Appendix 1: Table 4).
Evidence of neonatal mortality was inconsistent: P4P may have desirable effects and ensure reduction in neonatal mortality in implementing clinics by up to 22% in one study; however, another study identified increases of about 6.5% across catchment areas of P4P incentivized providers (low‐certainty evidence; Appendix 1: Table 2).
The effects of the intervention on outcomes such as unwanted pregnancies were uncertain because the certainty of the evidence was very low (Appendix 1: Table 3).
1.2. Targeted measures of provider performance
1.2.1. Utilization and delivery of services
Evidence on the effects of P4P on the utilization and delivery of services (Table 2; Appendix 1: Tables 5 to 12) was largely inconsistent across the indicators reviewed: the intervention may improve some utilization and delivery indicators but may lead to poorer results for other indicators (overall low‐certainty evidence).
Effects on HIV/AIDS, malaria and tuberculosis services were overall mixed (low‐certainty evidence; Appendix 1: Table 5): HIV testing and prevention of mother‐to‐child transmission delivery may be positively affected, however ART delivery may decline. P4P may have negative effects on the proportion of children and households protected by bednets (low‐certainty evidence), and effects on tuberculosis treatment adherence were uncertain (very low‐certainty evidence).
There was moderate‐certainty evidence for improvements in indicators for the delivery of family planning services by health providers. P4P probably improves the number of outreach activities on family planning services offered by health providers and probably increases the likelihood of providers supplying contraception to clients (effects ranging between 10% and 300%, Appendix 1: Table 8).
There were undesirable effects for a minority of utilization and delivery indicators (low‐certainty evidence).
Findings were inconsistent overall for two of the areas of service utilization and delivery most commonly targeted by P4P schemes: mother and child immunizations (Appendix 1: Table 6) and ANC (Appendix 1: Table 9) (low‐certainty evidence).
1.2.2. Quality of care
Overall, the evidence suggests that quality of care indicators may improve where P4P is implemented (see Table 2 and Appendix 1: Tables 13 to 16). Across the indicators for which evidence was available, there were improvements for most and only one indicator suggested that quality of care may decrease (this was in relation to waiting times). Generally the evidence for this outcome was of low certainty. Further, the methods for quality of care assessment were inconsistent across studies; however, data were sourced predominantly from direct observation by scheme supervision teams or data collectors. In some cases (e.g. quality of child health care or quality of service by specific service area), data from structured patient exit interviews were also used.
Indicators for which there was moderate‐certainty evidence included:
quality of child health care: P4P probably improves quality of care scores (range: 6.1% to 300% relative increases; Appendix 1: Table 16);
quality of medicine and equipment: P4P probably improves the quality scores of available medicine and equipment (range: 2.7% to 220%; Appendix 1: Table 16);
quality of service by specific departmental area/service: P4P probably improves the mean quality of service scores in specific targeted areas (range: 39% to 15‐fold increase in scores; Appendix 1: Table 16).
In general, the effects of P4P schemes on a range of procedural quality of care indicators was uncertain, including the likelihood of providers carrying out background and physical assessments, managing patients correctly or counselling patients appropriately (very low‐certainty evidence; Appendix 1: Table 13). However, P4P may improve specific aspects of the quality of ANC, particularly the likelihood of receiving immunizations or being prescribed iron or folic acid in pregnancy (low‐certainty evidence).
The intervention may make little or no difference to staff knowledge and skills (low‐certainty evidence; Appendix 1: Table 14), and its effects on staff responsiveness (as observed by researchers/P4P scheme verifiers) were uncertain overall (range: –2% to 49% change in responsiveness; very low‐certainty evidence).
1.3. Resource use
In relation to resource use, the intervention seems to predominantly affect indicators positively (Table 2; Appendix 1: Tables 17 and 18). P4P probably has a positive effect on human resource availability (range: 19% to 44%; moderate‐certainty evidence; Appendix 1: Table 17). Effects on curative visits logged per healthcare professional are uncertain (very low‐certainty evidence; Appendix 1: Table 17). P4P probably affects infrastructure functionality and medicine availability positively (moderate‐certainty evidence; Appendix 1: Table 18).
1.4. Secondary outcomes
P4P may have neutral or positive effects on secondary outcomes (low‐certainty evidence; Table 2; Appendix 1: Tables 19 to 23).
P4P probably makes little or no difference to provider absenteeism (range: 0.7% to 2%; low‐certainty evidence; Appendix 1: Table 19). Effects on overall motivation scores and satisfaction are largely neutral (low‐certainty evidence; Appendix 1: Table 19).
Overall, P4P may have little to no or positive impacts on measures of patient satisfaction (low‐certainty evidence; Appendix 1: Table 20).
In relation to impacts on financing, there was limited evidence and all was sourced from one study exploring the impacts of a P4P scheme where income may have been withheld if targets were not achieved (Appendix 1: Table 21). Patient expenditure on medicine and equipment may increase by an estimated 2.5% for insured patients, but may decrease by an estimated 0.9% for uninsured patients, suggesting small positive redistributive effects (low‐certainty evidence).
P4P may positively affect facility managerial autonomy (low‐certainty evidence; Appendix 1: Table 22). However, the intervention probably makes little to no difference to management quality or facility governance, using the number of staff meetings held in the last three months as a proxy (low certainty evidence).
Effects on indicators focused on assessing care equity are predominantly neutral (Appendix 1: Table 23). P4P may increase the proportion of poor people utilizing child immunization services (low‐certainty evidence); however, the intervention may potentially decrease the proportion of poor people utilizing ANC (low‐certainty evidence). P4P may make little to no difference to the utilization of institutional deliveries by poorest groups (low‐certainty evidence).
Comparison 1b: effects on untargeted outcomes
Evidence on the effects of P4P on untargeted outcomes is presented in Appendix 1: Tables 24 to 45 and Table 2 (Meta‐summary: effects of P4P against control).
1.5. Untargeted health outcomes
The effects of P4P on health outcomes are largely consistent with those reported when indicators are targeted (moderate‐certainty evidence; Table 2; Appendix 1: Tables 24 and 25). Moderate‐certainty evidence suggests that P4P probably:
reduces child mortality by up to 1% (Appendix 1: Table 24);
reduces the proportion of children with anaemia (about 5%; Appendix 1: Table 25);
reduces the proportion of children with wasting (range: 5.9–9.25%; Appendix 1: Table 25).
P4P probably has no important effect on the incidence of neonatal mortality or pregnancies recorded (effects under 1%, moderate‐certainty evidence; Appendix 1: Tables 24 and 25).
1.6. Changes in untargeted measures of provider performance
1.6.1. Untargeted utilization and delivery
In relation to service utilization (Table 2; Appendix 1: Tables 26 to 32), P4P may improve the rate of HIV testing (low‐certainty evidence), however probably has no important effect on bednet use (moderate‐certainty evidence) (Appendix 1: Table 27). The former finding is inconsistent with when the same indicator was targeted; in the latter case, P4P had negative effects.
We further note that P4P:
may make little to no difference to the probability of services being utilized and frequency of visits by elderly populations in particular (low‐certainty evidence; Appendix 1: Table 27);
has uncertain effects on the frequency of outpatient consultations overall (low‐certainty evidence; Appendix 1: Table 27);
probably makes little or no difference to utilization of modern family planning methods (moderate‐certainty evidence), however may increase the rate of family planning outreach delivery by up to 10% (low‐certainty evidence) (Appendix 1: Table 28);
may have little to no effect on utilization of ANC (up to 5%; low‐certainty evidence), with most other effects on ANC being uncertain (Appendix 1: Table 29);
may have little to no effect on institutional deliveries (low‐certainty evidence); effects on the delivery of caesarean sections are uncertain (very low‐certainty evidence) (Appendix 1: Table 30);
has overarchingly inconsistent effects on postnatal care: P4P may improve the delivery and coverage of postnatal care (low‐certainty evidence), however probably slightly decreases the overall utilization of such services (moderate‐certainty evidence) and may have desirable effects on the timeliness of postnatal care utilization (low‐certainty evidence) (Appendix 1: Table 31).
Effects on untargeted delivery of child consultations (in under 5s) are uncertain (very low certainty evidence)(Appendix 1: Table 32)
1.6.2. Untargeted quality of care
Overall, estimates presented on quality of care (Table 2; Appendix 1: Tables 33 to 37) indicate P4P may have neutral or uncertain impacts, suggesting that quality of care indicators must be explicitly targeted for outcomes to be achieved (overarching low‐certainty evidence). Effects on total care quality scores are uncertain in relation to maternity care, outpatient services, and medicine and equipment quality, however P4P probably has negative effects on general quality of care scores when such indicators are not explicitly targeted (moderate‐certainty evidence).
1.7. Unintended effects
P4P may have little to no distorting unintended effects (Table 2; Appendix 1, Table 38), with studies suggesting that free riding and unwanted task shifting were slightly lowered (low‐certainty evidence).
1.8. Untargeted resource use
Effects of P4P on non‐targeted resource use indicators appear largely uncertain (very low‐certainty evidence; Table 2; Appendix 1: Tables 39 and 40).
1.9. Untargeted secondary outcomes
Effects on the majority of secondary untargeted indicators are largely inconsistent (Table 2; Appendix 1: Tables 41 to 45). However, P4P may positively affect patient satisfaction scores on quality of care and provider communication, despite indicators not being directly targeted (low‐certainty evidence). P4P probably has little to no impact on expenditure related to medicines and equipment (moderate‐certainty evidence), however impacts on out‐of‐pocket payments are inconsistent across service areas (low‐certainty evidence; Appendix 1: Table 43). In relation to impacts on facility governance and equity promoting distributive effects, evidence is overarchingly inconsistent (low‐certainty evidence; Appendix 1: Tables 44 and 45).
Comparison 2: effects of P4P versus comparator interventions
Overarching trends
Table 4 (Effects of P4P versus comparator) and Table 3 outline the effects of P4P on individual indicators assessed against comparator interventions. Individual 'Summary of findings' tables by indicator are available in Appendix 2. Comparator interventions predominantly consisted of enhanced financing interventions within which comparator health facilities received funding matched to P4P groups. It should be noted that the same indicator may have been directly targeted in one study but not explicitly targeted in another study. Some of the same indicators therefore appear below under both 'Effects on targeted outcomes' and 'Effects on untargeted outcomes.'
2. Meta‐summary: effects of paying for performance against comparator.
| Outcome | Indicator | Direction of effect and GRADE rating for targeted and untargeted outcomes | |||
| Targeted | GRADE rating | Not‐targeted | GRADE rating | ||
| Primary: health outcomes | Proportion of women breastfeeding | ▬ | ⊕⊕⊖⊖ | ▬ | ⊕⊕⊖⊖ |
| Reported illness in children (%) | No evidence | ▲ | ⊕⊕⊖⊖ | ||
| Primary: utilization and delivery | Child immunization (likelihood of being vaccinated) | □ | ⊕⊕⊖⊖ | No evidence | |
| Child immunization: % receiving BCG | ▬ | ⊕⊕⊖⊖ | No evidence | ||
| Child immunization: % receiving DTP | ▬ | ⊕⊕⊖⊖ | No evidence | ||
| Child immunization: % fully vaccinated | □ | ⊕⊕⊖⊖ | No evidence | ||
| Immunization during ANC: % receiving tetanus injection | ▲ | ⊕⊕⊖⊖ | ▬ | ⊕⊕⊕⊖ | |
| Probability of any utilization (generic) | ▲ | ⊕⊕⊖⊖ | No evidence | ||
| ANC: % receiving ≥ 1 ANC | ▬ | ⊕⊕⊖⊖ | No evidence | ||
| ANC: % receiving ≥ 4 ANC | ▬ | ⊕⊕⊖⊖ | No evidence | ||
| ANC: % receiving ANC in first trimester | ▲ | ⊕⊕⊖⊖ | No evidence | ||
| Child (aged < 5 years) curative visits (rates) | ▬ | ⊕⊕⊖⊖ | No evidence | ||
| Family planning: % using any method | ▬ | ⊕⊕⊖⊖ | No evidence | ||
| Family planning: % using modern methods | ▬ | ⊕⊕⊖⊖ | No evidence | ||
| Institutional delivery (rates and coverage) | □ | ⊕⊕⊖⊖ | No evidence | ||
| Postnatal care (rates and coverage) | ▼ | ⊕⊕⊖⊖ | ▬ | ⊕⊕⊖⊖ | |
| Primary: changes in resource use | Equipment availability (composite score) | ▲ | ⊕⊕⊖⊖ | □ | ⊕⊖⊖⊖ |
| Medicine availability (composite score) | ▼ | ⊕⊕⊖⊖ | □ | ⊕⊖⊖⊖ | |
| Primary: quality of care | Background and physical assessment (score) | ▲ | ⊕⊕⊖⊖ | No evidence | |
| Knowledge outcomes (index) | ▲ | ⊕⊕⊖⊖ | No evidence | ||
| Counselling (score) | □ | ⊕⊕⊖⊖ | No evidence | ||
| Immunizations quality (score) | ▲ | ⊕⊕⊖⊖ | No evidence | ||
| Staff knowledge and skills (score) | ▲ | ⊕⊕⊖⊖ | □ | ⊕⊖⊖⊖ | |
| Total quality family planning (score) | ▲ | ⊕⊕⊕⊖ | No evidence | ||
| Total quality ANC (score) | ▲ | ⊕⊕⊕⊖ | No evidence | ||
| Total quality composite (score) | ▲ | ⊕⊕⊖⊖ | No evidence | ||
| Secondary: equity‐consideration: evidence of differential impact on different parts of the population | Wealth related: ANC (utilization) | ▬ | ⊕⊕⊖⊖ | No evidence | |
| Wealth related: Curative visits (utilization) | ▬ | ⊕⊕⊖⊖ | No evidence | ||
| Wealth related: Family planning (utilization) | ▼ | ⊕⊕⊖⊖ | No evidence | ||
| Wealth related: Institutional delivery (utilization) | ▼ | ⊕⊕⊖⊖ | No evidence | ||
| Secondary: impacts on management or information systems (if not a targeted measure of performance) | Facility and managerial autonomy (score) | ▲ | ⊕⊕⊖⊖ | □ | ⊕⊖⊖⊖ |
| Secondary: patient satisfaction and acceptability | Cleanliness | No evidence | ▲ | ⊕⊕⊖⊖ | |
| Contact time | No evidence | ▲ | ⊕⊕⊖⊖ | ||
| Waiting time | □ | ⊕⊖⊖⊖ | ▲ | ⊕⊕⊖⊖ | |
| Patient satisfaction with staff communication (index) | □ | ⊕⊖⊖⊖ | ▬ | ⊕⊕⊖⊖ | |
| Secondary: provider motivation, satisfaction, absenteeism and acceptability | Motivation (score) | No evidence | ▬ | ⊕⊕⊖⊖ | |
| Satisfaction (score) | No evidence | ▬ | ⊕⊕⊖⊖ | ||
ANC: antenatal care; BCG: Bacillus Calmette–Guérin; DTP: diphtheria‐tetanus‐pertussis.
Direction of effect key
▲: desirable; ▼: non‐desirable; ▬: neutral; □: uncertain
Certainty of the evidence key
⊕⊕⊕⊖: moderate; ⊕⊕⊖⊖: low; ⊕⊖⊖⊖: very low
Data availability: for each of the above outcomes, details of the contributing studies and assessments are available in the secondary 'Summary of findings' tables in Appendix 2, as follows.
- Targeted health outcomes: Section 2.1.
- Targeted measures of provider performance: Section 2.2.
- Targeted changes in resource use: Section 2.3.
- Targeted secondary outcomes: Section 2.4.
- Untargeted measures of provider performance: Section 2.5.
- Untargeted health outcomes: Section 2.6.
- Untargeted resource use: Section 2.7.
- Untargeted secondary outcomes: Section 2.8.
Comparison 2a: effects on targeted outcomes
2.1. Health outcomes
Effects on health outcomes are suggestive of little or no impact (Table 4; Appendix 2: Table 46). P4P may have little to no impact on the proportion of breastfeeding among mothers seeking care in P4P implementing facilities versus comparator facilities (low‐certainty evidence).
2.2. Targeted measures of provider performance
2.2.1. Utilization and delivery
In contrast to the findings on the effects of P4P against a pure control, P4P has largely neutral or desirable effects on utilization and delivery indicators (Table 4; Appendix 2: Tables 47 to 51).
P4P may positively affect the probability of people utilizing care (range: 1.5% to 10%; low‐certainty evidence; Appendix 2: Table 51), however, evidence on immunization utilization is indicative of little to no effect or uncertain (Appendix 2: Table 47).
Evidence on family planning is largely consistent with that presented on the effects of P4P against standard care (Appendix 2: Table 48): P4P may have little to no important effect on the utilization of any family planning services (low‐certainty evidence).
Effects on the overall rates of ANC utilization are indicative of little to no important effect (Appendix 2: Table 49), however, P4P may positively affect the timeliness of ANC care‐seeking (range: 1.3% to 10% women accessing care earlier; low‐certainty evidence).
Evidence on the effects of P4P on percentage of women utilizing institutional deliveries is mixed (range: –8.7% to 23.2%, low‐certainty evidence, Table 50). However, P4P may have negative effects on postnatal care utilization (low‐certainty evidence, Table 50).
2.2.2. Quality of care
Evidence on the effects of P4P on quality of care indicators is largely positive for specific clinical areas and overall quality (Table 4; Appendix 2: Tables 52 to 54). P4P probably leads to improved quality of care in relation to family planning or ANC (moderate‐certainty evidence; Appendix 2: Table 54). P4P may also have positive effects on care processes, such as leading to increases in the proportion of staff conducting appropriate patient background and physical assessments during consultations, however effects on quality of counselling during consultations are uncertain (low‐certainty evidence; Appendix 2: Table 52). P4P may slightly increase the quality of care of immunizations as well as staff knowledge and skills, however impacts on patient knowledge outcomes are uncertain (low‐certainty evidence; Appendix 2: Table 53).
2.3. Resource use
In relation to resource‐use indicators, the evidence is mixed (low‐certainty evidence; Table 4; Appendix 2: Table 55). While P4P may increase equipment availability by 75%, medicine availability may be reduced by up to 160%. The latter effect is likely due to scheme design, as the Zambia scheme offered supplies as an ancillary component of the intervention but not medication.
2.4. Secondary outcomes
P4P seems to have mixed effects on secondary outcome indicators (Table 4; Appendix 2: Tables 56 to 58). Similar to the effects of P4P against a pure control, P4P may positively affect facility autonomy (low‐certainty evidence; Appendix 2: Table 56); however, impacts on patient satisfaction and acceptability are uncertain (very low‐certainty evidence; Appendix 2: table 57). P4P may have little to no effect on the equitable utilization of curative and ANC visits (low‐certainty evidence), however may have negative redistributive effects in relation to institutional delivery utilization (i.e. utilization appears to increase in least‐poor groups) and family planning (low‐certainty evidence; Appendix 2: Table 58).
Comparison 2b: effects on untargeted outcomes
2.5. Untargeted health outcomes
In relation to untargeted health outcomes, P4P may have little to no effect on the proportion of women breastfeeding (low‐certainty evidence; Table 4; Appendix 2: Table 59). P4P may positively affect the incidence of reported illness in children (range: –5% to 10.5%; low‐certainty evidence).
2.6. Untargeted measures of provider performance
2.6.1. Untargeted utilization and delivery
Evidence on the effects of P4P on untargeted utilization is only available for two indicators (Table 4; Appendix 2: Tables 60 and 61). For both, the evidence suggests P4P may make little to no difference (low‐certainty evidence).
2.6.2. Quality of care
Effects of P4P on untargeted quality of care appear uncertain due to very low‐certainty evidence (Appendix 2: Table 62).
2.7. Unintended effects
No study reported evidence on distorting unintended effects.
2.8. Untargeted resource use
In relation to both equipment and medicine availability, certainty of the evidence is very low and effects are therefore uncertain (Table 4; Appendix 2: Table 63).
2.9. Untargeted secondary outcomes
In relation to secondary outcomes, limited evidence is available (Table 4; Appendix 2: Tables 64 to 66). Effects of P4P on facility and managerial autonomy are uncertain (very low‐certainty evidence; Appendix 2: Table 64). P4P may have largely positive effects on patient satisfaction and acceptability even when indicators are not explicitly targeted (low‐certainty evidence; Appendix 2: Table 65). However, there may be little to no effect on staff motivation or satisfaction when not targeted (low‐certainty evidence; Appendix 2: Table 66).
Sensitivity analyses
Across 'Summary of findings' Tables 1 to 66 in Appendix 1 and Appendix 2, we include comments on the range of the intervention's effects on each of the reviewed indicators based on RCTs only; where relevant, these findings are assessed using GRADE separately.
For a more complete overview, the sensitivity analyses summary tables illustrate the effects recorded in RCTs (Table 11; Table 12). Overall, the certainty of the evidence reviewed is assessed as low to moderate. Concerns over the risk of bias in individual studies and the limited availability of studies, with most indicators being reported on in only one study, were the primary reasons for downgrading evidence to 'low.'
9. Sensitivity analyses against control: direction of relative effect and GRADE rating for targeted outcomes across randomized controlled trials only.
| Direction of relative effect and GRADE rating for targeted outcomes across RCT studies only | ||||
| Outcome | Indicator (if indicator not named, no RCT evidence available) | Comment on effect (desirable, undesirable, neutral or uncertain) | Certainty of the evidence | Commentary on intervention effect |
| Primary: health outcomes | Neonatal mortality | ▬ | ⊕⊕⊕⊖ | P4P probably has no significant impact on neonatal mortality (0.03%) |
| Primary: utilization and delivery | Child immunization: receiving ≥ 1 vaccine | ▬ | ⊕⊕⊕⊖ | P4P probably has no important effect on outcome (1%) |
| Child immunization: fully vaccinated | ▲ | ⊕⊕⊖⊖ | P4P may lead to higher rate of full vaccination (16.1%) | |
| Child immunization: receiving BCG | ▲ | ⊕⊕⊖⊖ | P4P may lead to higher rate of BCG vaccination (range 1–7%) | |
| Child immunization: receiving DTP | ▲ | ⊕⊕⊖⊖ | P4P may lead to higher rate of DTP vaccination (6.1%) | |
| Child immunization: measles | ▬ | ⊕⊕⊖⊖ | P4P may have little to no important effect on measles vaccination rates (–3.6%) | |
| Child immunization: polio | ▲ | ⊕⊕⊖⊖ | P4P may lead to higher rate of polio vaccination (21%) | |
| Child immunization: pentavalent | ▼ | ⊕⊕⊕⊖ | P4P reduces the pentavalent immunization rate (–5.7%) | |
| Probability of any utilization (% utilizing) | ▬ | ⊕⊕⊖⊖ | P4P may have slight positive effects on overall utilization of services (4.2%) | |
| ANC (utilization and delivery rates overall) | ▬ | ⊕⊕⊖⊖ | P4P may have a slight positive effect on the ANC utilization rate (4%) | |
| Total number ANC visits | ▼ | ⊕⊕⊖⊖ | P4P may lead to a decrease in the total number of ANC visits (range estimated at –35% to –4.60%) | |
| ≥ 1 ANC (utilization rates) | ▼ | ⊕⊕⊕⊖ | P4P probably leads to a reduction in the utilization of at least 1 ANC visit (range –10% to –1.5%) | |
| ≥ 4 ANC (utilization rates) | ▼ | ⊕⊕⊖⊖ | P4P may leads to a decrease in rate of women utilizing ≥ 4 ANC sessions (–5.4%) | |
| ANC from qualified provider (% receiving) | ▬ | ⊕⊕⊖⊖ | P4P may lead to an increase in the delivery of ANC by a qualified provider (4.7%) | |
| Family planning (% using any method) | ▼ | ⊕⊕⊖⊖ | P4P may have slight negative or no impact on family planning utilization (range –6.3% to null effect) | |
| Family planning (% using modern methods) | ▬ | ⊕⊕⊖⊖ | P4P may have no important effect on utilization of modern family planning (0.2%) | |
| Institutional delivery (rates or coverage) | ▲ | ⊕⊕⊕⊖ | P4P probably has positive effects on the rate of institutional deliveries (range –3% to 18.1%, but were predominantly positive) | |
| Institutional delivery (% using caesarean section) | ▬ | ⊕⊕⊕⊖ | P4P probably has limited effect on the rate of caesarean sections within the institutional deliveries (2%) | |
| Institutional delivery: likelihood of skilled attendance at birth | ▲ | ⊕⊕⊕⊖ | P4P probably improves the likelihood of having a skilled birth attender (range 4–16.2%) | |
| PNC (overall utilization rate) | ▲ | ⊕⊕⊕⊖ | P4P probably has positive impacts on PNC utilization (range –2% to 10.8%, predominantly positive) | |
| PNC: likelihood of skilled attendance | ▲ | ⊕⊕⊖⊖ | P4P may have a positive effect on skilled attendance during PNC (15.79%) | |
| PNC (% receiving timely access) | ▬ | ⊕⊕⊕⊖ | P4P has no important effect on % of women receiving timely access (0.8%) | |
| Curative consultations in children (rates) | ▼ | ⊕⊕⊖⊖ | P4P may reduce the utilization of curative care visits for children by up to 10.9% | |
| Primary: quality of care | Background and physical assessment (scores general, across ANC, PNC, childcare and for other consultations) | ▼ | ⊕⊕⊖⊖ | P4P may have negative effects on quality of care scores associated with background and physical assessments (range –17% to 4%, predominantly negative) |
| Correct patient management by healthcare providers (scores in relation to ANC, childcare and PNC) | ▬ | ⊕⊕⊕⊖ | P4P probably has no effect on quality of care scores associated with correct patient management (0.03%) | |
| Patient counselling (scores on ANC‐ and PNC‐related counselling) | □ | ⊕⊕⊖⊖ | P4P effects on quality of care scores range between –37% to 6% | |
| Immunizations (score for receiving any tetanus and number of tetanus vaccinations) | ▬ | ⊕⊕⊖⊖ | P4P may have little to no important effect on quality of care relating to immunizations (2.25%) | |
| Women in ANC being given or prescribed folic acid/iron (%) | ▲ | ⊕⊕⊖⊖ | P4P may improve the likelihood of being prescribed folic acid/iron during ANC by up to 5.5% | |
| Staff knowledge and skills (score) | ▬ | ⊕⊕⊖⊖ | P4P may have little to no effect on staff knowledge and skills | |
| Patient knowledge (score) | ▲ | ⊕⊕⊖⊖ | P4P may have positive effects on patient knowledge (range –3% to 116%, overall positive) | |
| Contact time | ▬ | ⊕⊕⊕⊖ | P4P probably has no significant impact upon contact time (2.5%) | |
| Overall composite quality of care (score) | ▬ | ⊕⊕⊕⊖ | P4P probably has little to no effect on overall care quality scores (range 1.6–4%) | |
| Quality of ANC (score) | ▬ | ⊕⊕⊖⊖ | P4P may have slight positive effects on quality of ANC (2%) | |
| Quality of child health (score) | ▲ | ⊕⊕⊕⊖ | P4P probably has positive effects on the quality of child health scores (300%) | |
| Quality of medicine and equipment (score) | ▲ | ⊕⊕⊕⊖ | P4P probably increases the quality of medicines and equipment by up to 220% | |
| Quality by department/service (score) | ▲ | ⊕⊕⊕⊖ | P4P probably increases the quality of specific departments and services up to 15 fold | |
| Primary: unintended effects | Overall impacts on free riding and task shifting | ▬ | ⊕⊕⊖⊖ | P4P may have few distorting effects |
| Primary: changes in resource use | Equipment availability (index) | ▲ | ⊕⊕⊕⊖ | P4P probably increases equipment availability by up to 300% |
| Equipment functionality (index) | ▬ | ⊕⊕⊕⊖ | P4P probably has little to no effect on equipment functionality (1.4%) | |
| Infrastructure functionality (index) | ▲ | ⊕⊕⊕⊖ | P4P probably leads to improvements in infrastructure functionality scores by up to 345% | |
| Medicine availability (index) | ▲ | ⊕⊕⊕⊖ | P4P probably has positive impacts on medicine availability by up to 200% | |
| Vaccine availability (index) | ▲ | ⊕⊕⊖⊖ | P4P may have positive effects on vaccine availability (21.95%) | |
| Secondary: provider motivation, satisfaction, absenteeism and acceptability | Provider motivation (score) | ▬ | ⊕⊕⊕⊖ | P4P probably has no important effect on provider motivation |
| Provider satisfaction (score) | ▬ | ⊕⊕⊕⊖ | P4P probably has no important effect on provider satisfaction | |
| Secondary: patient satisfaction and acceptability (satisfaction scores) | Overall patient satisfaction with quality of care (score) | ▬ | ⊕⊕⊕⊖ | P4P probably has no important effect on overall satisfaction with quality of care |
| Overall satisfaction (score) | ▬ | ⊕⊕⊕⊖ | P4P probably has no important effect on overall satisfaction | |
| Secondary: impacts on management or information system (if not a targeted measure of performance) | Facility or managerial autonomy (score) | ▲ | ⊕⊕⊖⊖ | P4P may have positive impacts on facility autonomy (score increases up to 146%) |
| Facility governance (score) | ▬ | ⊕⊕⊖⊖ | P4P may have little to no effect on facility governance score | |
| Quality of management (score) | ▬ | ⊕⊕⊖⊖ | P4P may have little to no effect on quality of management score | |
ANC: antenatal care; Bacillus Calmette–Guérin; DTP: diphtheria‐tetanus‐pertussis; P4P: paying for performance; PNC: postnatal care; RCT: randomized controlled trial.
Direction of effect key
▲: desirable; ▼: non‐desirable; ▬: neutral; □: uncertain
Certainty of the evidence key
⊕⊕⊕⊖: moderate; ⊕⊕⊖⊖: low.
10. Sensitivity analyses against comparator: direction of relative effect and GRADE rating for targeted outcomes across randomized controlled trials only.
| Direction of relative effect and GRADE rating for targeted outcomes across RCT studies only | ||||
| Outcome | Indicator (if indicator not named, no RCT evidence available) | Comment on effect desirable, undesirable, neutral or uncertain) | Certainty of the evidence | Commentary on intervention effect |
| Primary: health outcomes | Likelihood of women breastfeeding | ▬ | ⊕⊕⊖⊖ | P4P may have little to no effect on the likelihood of women breastfeeding |
| Primary: utilization and delivery | Child immunization | ▼ | ⊕⊕⊖⊖ | P4P may decrease the likelihood of children being immunized by up to 7.4% |
| Child immunization: BCG | ▬ | ⊕⊕⊖⊖ | P4P may have little to no effect on utilization of BCG vaccination (3.1%) | |
| Child immunization: DTP | ▬ | ⊕⊕⊖⊖ | P4P may have little to no effect on utilization of DTP vaccination (–1%) | |
| Child immunization: fully vaccinated | ▲ | ⊕⊕⊖⊖ | P4P may have positive effects on the likelihood of children being fully vaccinated (39.8%) | |
| Probability of any utilization | ▲ | ⊕⊕⊖⊖ | P4P may have slight positive effects on probability of care‐seeking (8.3%) but overall other effects were inconsistent | |
| Family planning (% utilizing any) | ▬ | ⊕⊕⊖⊖ | P4P may have little to no effect on the utilization of family planning services | |
| ANC (% utilizing ≥ 1 ANC) | ▬ | ⊕⊕⊖⊖ | P4P may have little to no effect on utilization of ANC (–1.5%) | |
| ANC (% utilizing ≥ 4 ANC) | ▬ | ⊕⊕⊖⊖ | P4P may have little to no effect on utilization of ≥ 4 ANC appointments (–0.6%) | |
| ANC (% accessing ANC in first trimester) | ▲ | ⊕⊕⊕⊖ | P4P may have a positive effect on timely care initiation by women (range 1–10% initiating care earlier, about 1 month earlier) | |
| Utilization of curative services in children | ▬ | ⊕⊕⊖⊖ | P4P may have little to no effect on utilization of curative visits for children (–3.1%) | |
| Institutional delivery (utilization rate) | ▼ | ⊕⊕⊖⊖ | P4P may have negative effects on the utilization of institutional deliveries (–8.7%) | |
| PNC (utilization rate) | ▼ | ⊕⊕⊖⊖ | P4P may have negative effects on the utilization of PNC (–10%) | |
| Primary: changes in resource use | Equipment availability (composite score) | ▲ | ⊕⊕⊖⊖ | P4P may improve equipment availability scores by up to 75% |
| Medicine availability (composite score) | ▼ | ⊕⊕⊖⊖ | P4P may decrease medicine availability scores by up to 160% | |
| Primary: quality of care | Background and physical assessment (score) | ▼ | ⊕⊕⊖⊖ | P4P may decrease the likelihood of providers conducting background and physical assessments by up to 5.4% |
| Counselling (score) | ▼ | ⊕⊕⊖⊖ | P4P may have negative effects on providers counselling patients appropriately (–40%) | |
| Immunizations quality (score) | ▲ | ⊕⊕⊖⊖ | P4P may have slight positive effects on immunization quality (5.2%) | |
| Knowledge outcomes (score) | ▼ | ⊕⊕⊕⊖ | P4P may have slight negative effects on patient knowledge outcomes (range –5.4% to –2.4%) | |
| Total quality family planning (score) | ▲ | ⊕⊕⊕⊖ | P4P probably has positive effects on the quality of family planning (500%) | |
| Total quality ANC (score) | ▲ | ⊕⊕⊖⊖ | P4P may have positive effects on ANC quality scores (40%) | |
| Secondary: impacts on management or information systems (if not a targeted measure of performance) | Facility and managerial autonomy (score) | ▲ | ⊕⊕⊖⊖ | P4P may increase facility and managerial autonomy scores by up to 46% |
ANC: antenatal care; Bacillus Calmette–Guérin; DTP: diphtheria‐tetanus‐pertussis; P4P: paying for performance; PNC: postnatal care; RCT: randomized controlled trial.
Direction of effect key
▲: desirable; ▼: non‐desirable; ▬: neutral; □: uncertain
Certainty of the evidence key
⊕⊕⊕⊖: moderate; ⊕⊕⊖⊖: low
Table 11 illustrates and comments on effects of P4P against a status quo control. Overall, effects were largely consistent, however some deviations were notable when appraising the effects of P4P against a control in relation to utilization and quality of care indicators (Table 11). In particular, effects on specific immunization and quality of care indicators are now more clearly distinguishable (and appear largely positive). However, in relation to ANC, the evidence from RCTs seems to indicate that P4P may have negative effects on utilization of such services. Only one study appraised a health outcome indicator, and here we note that P4P may have a very slight effect only. Further, RCT evidence suggests P4P may have only limited (less than 5%) effects on secondary outcomes such as provider motivation and patient satisfaction.
In relation to the effects of P4P as assessed against comparator interventions, there was relatively limited evidence, most of which was low certainty (Table 12). In relation to service utilization and delivery a mixed picture emerges. Evidence suggests effects on immunization are overall inconsistent, effects on utilization overall appear neutral, and effects on institutional delivery and postnatal care utilization seem negative. In relation to quality of care, mixed effects are also notable.
Subgroup analyses
Upon reviewing the characteristics of interventions in detail, we further classified the P4P schemes according to the design reported in reviewed documents (Table 9; Table 10; note that to ensure consistency, we chose to classify all studies based on descriptions provided in the reviewed documents). To investigate differences in impacts by scheme design, we reviewed Tables 1 to 45 of Appendix 1 given that most studies assessed effects of P4P against control designs.
Results of the subgroup analyses are presented in Table 13. Overall, results‐based aid appears to be one of the top‐performing scheme designs, however we noted that only a minority of studies used this design, so the effects observed may be spurious.
11. Subgroup analyses: median rank by outcome of scheme designs against control.
| Findings of subgroup analysis P4P against control | |||||||||
| Scheme design | Median rank by outcomea | ||||||||
| P: health outcomes | P: utilization and delivery | P: quality of care | P: changes in resource use | S: provider motivation, satisfaction absenteeism and acceptability | S: patient satisfaction and acceptability (satisfaction scores) | S: impacts on overall financing or resource allocation | S: impacts on management or information systems (if not a targeted measure of performance) | S: equity‐consideration: evidence of differential impact on different parts of the population | |
| Capitation and P4P | NA | NA | NA | NA | NA | 3 | 2 | NA | NA |
| Financial and non‐financial incentives + decision guide | NA | NA | 3 | NA | NA | NA | NA | NA | NA |
| Performance‐based contracting or service agreements | NA | 1.5 | NA | NA | NA | NA | NA | NA | NA |
| Payment per output | NA | 2 | 2 | NA | 2 | 2 | NA | NA | NA |
| Payment per output (quality adjusted) | 1 | 1 | 1 | 1.5 | 2 | 1 | 3 | 1 | 2 |
| Payment per output (quality and equity adjusted) | 2 | 1.5 | 1 | 1.5 | 1 | 2 | 1.5 | 2 | 1 |
| Payment per output (quality and patient satisfaction adjusted) | NA | NA | 3 | NA | NA | 1 | NA | NA | NA |
| Payment per output and for target | 2 | 1.5 | NA | NA | NA | NA | NA | NA | 2 |
| Target payment | 1 | 2.5 | 2.5 | 3 | 3 | NA | 1 | 3 | 2 |
| Results‐based aid | NA | 1 | NA | NA | NA | NA | NA | NA | NA |
NA: not applicable; P: primary outcome; P4P: paying for performance; S: secondary outcome.
aA lower ranking indicates better performance.
Payment per output designs were most commonly implemented, however, and clear patterns in relation to the relative effects of such schemes emerged. Overall, schemes adjusting both for quality of service as well as those rewarding equitable delivery of that service appeared to perform best, particularly in relation to service utilization and quality outcomes. Similarly, schemes employing payments per output with a quality adjustment, or combining a payment per output and target payment, appeared to outperform the simpler payment per output and target payment designs.
Differential effects by outcome were evident (Table 13): health outcome indicators, for example, appeared to respond best to target payment, and payment per output designs where adjustments for quality scoring took place. However, we caution that health outcome indicators were appraised in a minority of reviewed studies, therefore patterns observed here may be due to chance.
Discussion
In recent years, the literature on the theory, effects and implementation of P4P programmes has expanded dramatically. Our search strategies retrieved over 11,000 results, of which 10% were of potential relevance to this review.
Increasingly, P4P is being framed not as one intervention, but as a class of interventions using a collection of mechanisms (Renmans 2016). Our intervention classification illustrates that a wide range of scheme designs are used with the fundamental idea to align the incentives of providers with those of the commissioners of care. However, our typology is necessarily simplified and the details and mechanisms by which results are achieved (or not) will vary. The effects and impacts of P4P likely depend on a range of factors, including how and why schemes are designed, the degree of participation in setting targets, what targets are used, how they are measured, the level of rewards they attract and by the context in which the schemes take place, including the efficiency of implementation systems and underlying factors such as starting levels of pay and funding. For that reason, this review has presented considerable detail on the design and implementation of the P4P schemes, as these factors are key to interpreting results. Considering the intervention Complexity Assessment Tool for Systematic Reviews (Lewin 2017), P4P scores highly in every domain.
We note that while many details of schemes (e.g. funders, verification processes among others) are consistently reported on, some critical reporting gaps in relation to scheme design exist. For example, only 40% of studies described the location of care provision and a minority of studies reported on scheme costs. Further, explicit theories of change or programme theories detailing how and why schemes are designed, and how they are fit for specific contexts are often not provided. To illustrate this point, it is often unclear how schemes set their targets or choose indicators, including why some schemes would incorporate over 200 quality of care markers for assessment, while others include under 100. Similarly, it is not always clear what aspects of schemes are core mechanisms versus additional features (e.g. it is often unclear whether auditing processes and procedures are designed for verification only, as opposed to wider initiatives intended to strengthen managerial capacity and oversight). Setting of 'prices' of indicators is another area lacking clarity in relation to how these were calculated, and based on what rationale (e.g. to replace user fee revenues, or based on an understanding of facility cost structures, to give just two possible examples).
Summary of main results
This review included 59 studies for which evidence was of low‐to‐moderate certainty. Increasingly however, more robust study designs are being used to assess the effects of P4P, including, for example, controlled ITS and cluster‐RCTs.
Findings identify some evidence of scheme success as well as evidence on some areas and indicators which appear to be less responsive to P4P. However, findings additionally indicate that the choice of comparator intervention (whether control or a different comparator intervention) and scheme design are critical in interpreting results.
In relation to utilization and service delivery outcomes, we identified inconsistent effects overall. P4P may have differential desirable and undesirable effects (e.g. while indicators relating to HIV testing, family planning and postnatal care appear to be positively impacted, evidence on the effects of P4P on indicators such as ART, ANC or immunization utilization is mixed). These findings are surprising as ANC and immunization are frequently targeted by P4P schemes. However, we noted that in the case of immunization, these effects may be due to broader circumstances surrounding vaccine availability. Overall, we noted that performance‐based contracting, results‐based aid and P4P designs including both payment per output and quality and equity adjustments performed best in relation to securing increased service utilization and delivery.
While health outcomes were appraised in a minority of studies, we noted interesting effects in relation to these. Whether targeted or not, P4P may have slight positive impacts on health outcomes appraised against a pure control or standard care; however, when compared against other interventions, such as enhanced financing, limited to no impacts were identifiable.
P4P probably increases quality of care overall, especially when directly targeted. However, indicators that are clinical‐area specific (e.g. quality of ANC consultations) or that are broadly related to medicine and equipment quality appear to respond best. We noted limited to uncertain effects on general quality of care indicators such as providers conducting background or physical assessments, or people receiving counselling.
Further, P4P schemes may have positive impacts overall on the availability (and as relevant functionality) of medicines, equipment and infrastructure, and probably have limited to no negative distorting unintended effects.
In relation to secondary outcomes, we identified surprising results. The effects of P4P on provider satisfaction and motivation were overall mixed; however, the evidence suggests the intervention may increase managerial autonomy, but have limited effects on quality of management or governance in general. Equity effects are also uncertain: when assessed against a pure control, P4P may have largely beneficial redistributive effects, but when assessed against a comparator, the evidence appears mixed. We identified little to no effect or uncertain effects on user fees, which is disappointing as this is an important intended mechanism of change for P4P schemes.
Subgroup analyses
Subgroup analyses suggest that different scheme designs may be more effective than others in securing effects against assessed outcomes. Among promising scheme designs, we noted payment per output with quality or equity adjustment (or both) and results‐based aid. We caution, however, that only one case implemented and studied results‐based aid, therefore, effects observed may be due to contextual differences and drivers rather than scheme design.
We had expected to conduct subgroup analyses by magnitude of incentive (either absolute or relative) and to attempt to isolate the effects of ancillary components (such as supervision). However, given limited reporting on these characteristics, we were unable to conduct such analyses.
Overall completeness and applicability of evidence
This is an update of the original review published in 2012 on the effects of P4P in LMICs and, therefore, capitalizes on the additional research carried out between 2012 and 2019. As noted previously, this research area has seen an exponential increase in interest and the evidence base overall has been strengthened.
In comparison to the original review, which included nine studies, we included 59 studies. While the predominant focus of evaluations remains on the schemes from Rwanda, Tanzania and China, a broader range of country settings are represented, including increasingly studies from Latin America. Most studies continue to focus on schemes targeted at strengthening reproductive, maternal and child health services, but increasingly evidence on schemes focused on other areas, such as HIV and tuberculosis, is becoming available.
Overall, we noted a clear focus on evidence reflecting the effects of P4P implementation in the public sector; only one of the studies focused on the private sector only. However, we note a more heterogeneous picture emerging in terms of the types of P4P schemes being assessed (although we only found one eligible study on the effects of results‐based aid), as well as the study types, comparators and time frames of assessment. While these developments are encouraging, and suggestive of a broader interest in P4P effects, both in the short‐ and long‐term and on targeted and not‐targeted outcomes, they imply added complexity for the synthesis of evidence and interpretation of effects. Further, both the proliferation and heterogeneity of evidence available makes it difficult to detect publication bias. Given that most studies reported more than 10 core outcomes each, from schemes that may target even more indicators (as illustrated in Josephson 2017), within varying population groups or clinical areas, it is difficult to assess whether reporting is purposefully restricted to positive effects or pragmatically restricted to indicators where data are available and analysable.
During searches we identified health economic evaluations estimating costs of P4P schemes in Tanzania (Borghi 2015), the Philippines (Peabody 2017), and Zambia (Zeng 2018a). These studies were not included in the review, however we present a brief overview of findings. Alongside information presented in Gertler 2014, these studies estimated the approximate expenditure per capita of the P4P programme to be USD 7 to USD 10; total costs per programme varied widely between approximately USD 2.6 million (2012) in Tanzania to USD 20.45 million in Argentina. We noted that when comparing the costs associated with intervention implementation, P4P appeared to incur slightly higher facility level costs compared to enhanced financing interventions. The increment ranged from USD 0.57 extra for consumables to 10% higher expenditure in the P4P groups (Lagarde 2015; Zeng 2018a). The only two studies providing a comprehensive breakdown of implementation expenditure within the P4P scheme indicated that 22% of scheme costs were spent on bonus payments in Tanzania and 52% in the Philippines (Borghi 2015; Peabody 2017). In Tanzania specifically, 37% of costs were spent on data generation, and 28% on management of the scheme, highlighting potentially high health system costs for implementation. Gertler 2014 estimated the cost‐utility of programmes at USD 814 (ranging from USD 442 to USD 5086)/DALY averted and Peabody 2017 at 1.58 DALY/USD spent, further highlighting potentially high variability in cost‐utility of schemes.
Similar to other research on the cost‐effectiveness of P4P schemes (Turcotte‐Tremblay 2016), we concluded that evidence on the costs and health economic impacts of P4P schemes is relatively scarce; this is something that other evaluators and future review updates should carefully consider. Similarly, evidence on health outcomes is also sparse (as also noted in .
Certainty of the evidence
The certainty of reviewed evidence differed by indicator; however, across most indicators, we downgraded evidence due to concerns related to risk of bias, indirectness or imprecision. In relation to risk of bias, we noted that most available studies were still of a CBA or quasi‐randomized design. Across this body of evidence, lack of randomization and allocation concealment were the primary reasons for downgrading the quality of evidence. However, the increased availability of RCT and ITS designs meant the certainty of the evidence could be judged as moderate for a greater number of indicators in comparison to the original 2012 review (Witter 2012).
Potential biases in the review process
We identify two biases in the review process. First, given the volume of studies and indicators evaluated, we had to restrict the focus of the review and only report on those indicators that were comparable and assessed across two or more studies. Comparability of indicators is a subjective judgement, and while two review authors conducted this process and submitted all materials for review by the wider group, researcher bias may be present. We further noted that this will remain a potentially problematic area unless there is harmonization in reported indicators.
Second, we restrict reporting to relative effects and acknowledge a major limitation in being unable to supplement this with information on absolute effects. Most reviewed studies restricted their reporting to beta coefficients obtained from clustered regression, accounting for multiple covariates associated with both intervention and population characteristics. Given the clustered nature of the data and lack of reporting on cluster characteristics overall (e.g. coefficients of variation of cluster sizes and intracluster correlation coefficients), we could not redo analyses and instead opted to use the relative effect measures (as provided by study authors themselves, or recalculated).
Several other external limitations applied. First, we noted substantive lack of harmonization across schemes (e.g. several child immunization indicators were reported on, however utilization rates referred to different age groups), making synthesis difficult. Second, the assessment of effects on health outcomes is a clear gap area: it is unclear why such outcomes were assessed across a minority of studies, when data should have been more generally available given the wide range of indicators targeted. Third, we were unable to produce a meta‐estimate on the effects of P4P against each of the assessed indicators as we judged this uninformative given the aforementioned comparability issues. While the studies used similar analyses techniques (principally difference‐in‐difference analyses), the effect estimates derived from equations adjusting for multiple covariates could not be meaningfully synthesized. Additionally, studies did not consistently report on measures of precision, thus precluding the possibility of comprehensively attempting pooling of estimates.
Fourth, we noted two further areas that demanded exploration via analyses which accounted for the inherent complexity of P4P scheme design. One area concerned itself with how P4P may have interacted with other ongoing interventions (e.g. the expansion of health insurance coverage); another related to accounting for the implementation of ancillary components alongside the main P4P scheme. To adequately assess the impacts of both of these on P4P effects, as well as impact of diverse contexts and scheme designs, complexity science methods may be required. Further, we restricted this review to evidence collated in quantitative impact evaluations only; qualitative and health economic studies conducted alongside these evaluations would need to be consulted to appropriately investigate variations in scheme design, rollouts and further implementation as well as explore how schemes were received by health and allied professionals at different system levels.
Fifth, we noted that it was difficult to conduct a comprehensive subgroup analysis given the data volume available and multitude of scheme designs implemented. We urge readers to consider our attempt here cautiously.
Last, we updated searches for this review in 2020; these identified a further 63 studies that may be eligible and are awaiting classification, although it is likely that the final number of new eligible studies will be smaller than this. Due to resource limitations, it was not possible to further screen these studies and incorporate them into the review update. These additional studies may lead to some changes in the review findings at a future update, but the current findings are a substantial step forward in understanding the impacts of pay for performance initiatives.
Agreements and disagreements with other studies or reviews
Several findings are of particular interest when compared with the original 2012 review on this topic (Witter 2012), and to other available evidence on the effects of P4P. First, in relation to the original 2012 review, we noted that available evidence has multiplied and somewhat improved in quality.
Our findings differed across several of the outcomes assessed. In the original review, evidence on quality of care was mixed; however, we currently assessed that P4P may have positive impacts on this outcome. This is particularly interesting as the general debate in the P4P community has focused on how to shift from volume to effective quality measures (Josephson 2017). A priori, we would, therefore, have expected the opposite patterns from the findings of this review, with utilization indicators responding more than quality ones. While the quality of care indicators assessed were numerous and diverse (Josephson 2017), and included both structural and process quality measures, we generally noted findings similar to those of Das, Gopalan and Chandramohan in their 2016 review on the topic (Das 2016).
Our findings suggest that P4P may have positive effects on health outcomes (relative to pure controls, if not matched comparators, similar to Ogundeji 2016) and on some utilization indicators, such as those related to modern family planning (Blacklock 2016), and postnatal care, which were previously noted to be unresponsive. In relation to the effects of P4P on the more commonly targeted utilization outcomes such as ANC and institutional deliveries, our findings were largely consistent with the 2012 review (Witter 2012).
In relation to motivation and satisfaction, we noted findings similar to those of Dale 2014. However, we acknowledged particular methodological challenges surrounding the appraisal of this evidence: certainty in our findings may be compromised by indirectness in particular. As Dale 2014 noted, motivation is often assessed and measured using different scales. Indeed, in our review, we attempted to synthesize information across a range of different outcomes and measurements.
Authors' conclusions
Implications for practice.
The evidence around paying for performance (P4P) has grown considerably since the last review (Witter 2012), with researchers and practitioners gradually focused on unpacking the wider health system effects and impacts of P4P schemes. Study quality has gradually improved, with more use of randomized controlled trial (RCT) designs; however, the overarching evidence base to date is still dominated by controlled before‐after studies. This, alongside the heterogeneity of schemes implemented and reviewed here, makes any conclusions and implications tentative.
Overall, this review suggests that, in comparison to a status quo control, P4P may have some positive effects on service utilization and delivery, for example in relation to family planning; however, impacts on other service areas (e.g. antenatal care, immunization, institutional delivery) may be difficult to secure. P4P may also have positive effects on health outcomes when compared to a status quo control, however limited evidence on health outcomes is available from comparisons of P4P against other interventions such as matched financing. We further note that technical inputs (e.g. infrastructure functionality, equipment and medicine availability) may be positively affected by the introduction of P4P schemes; facility autonomy may be fostered as well, although effects on procedural care and governance are uncertain.
Few studies focused on assessing P4P impacts against a comparator intervention, however our findings to date tentatively suggest that some indicators react to the influx of funding itself and not the performance‐related conditionality of payment. Subgroup analyses additionally suggest that specific scheme designs may perform better at achieving targeted outcomes. For example, target payments outperformed other scheme designs in relation to health outcomes in particular (e.g. payments being conditional on tuberculosis success rates), whereas utilization and delivery outcomes seemed to increase most in schemes adjusting for both service quality and equity.
Implications for research.
We acknowledge the exponential growth in studies focused on assessing and exploring the impacts of P4P schemes since the publication of the last review (Witter 2012). Conclusions presented here are limited as we focused on quantitative impact evaluations only; however, these are presented as complementary to the work of other groups focused, for example, on conducting realist syntheses of P4P schemes (Singh 2020a).
The evidence base has expanded to consider a greater range of P4P scheme designs and modalities, covering diverse scales of magnitude, levels of implementation within the health system, types of services and providers, comparator groups and contexts. Increasingly, cluster RCTs are used to assess the effects of P4P schemes: this is a welcome development; however, we caution that such studies must be complemented by thorough theory‐based evaluations to understand how the schemes were designed (and by whom) and their ex ante (i.e. before the event) theory of change, compared with the mechanisms that were triggered ex post (i.e. after the event). It is also important to document the interaction of P4P with the wider health system (Witter 2013), how it affects components such as supervision, referrals and health information systems, and is affected by them in turn.
Multiarm or stepped wedge RCT designs, as well as controlled interrupted time series, may be needed to additionally unpack the effects of diverse P4P implementation pathways or alternative scheme designs going forward. This implies a shift in focus from research assessing whether P4P may or may not work, to research focused on both establishing P4P effects and identifying, understanding and unpacking the contextualized pathways to scheme impact, using dynamic approaches.
Longer time frames of inquiry and diverse and alternative comparator groups would also be of particular interest. The evidence base on impacts of P4P is still dominated by studies assessing impacts after approximately three years. However, little is known on how schemes change once they are embedded in systems, how they are affected by their coherence (or lack of it) with wider health financing policies, and on whether they are sustainable and maintain impacts long term.
Few studies to date explored the equity effects of schemes and heterogeneity of P4P results for different provider types, areas and populations subgroups; when this was done, studies noted challenges in relation to study design and power as restricting their conclusions (e.g. as in Binyaruka 2018a).
Further, few studies to date purposefully assessed effects against a realistic enhanced financing comparator (such as direct facility financing embedded in routine planning and reporting systems) or demand‐side interventions; given the drive to expand universal health coverage, these types of studies – when robustly designed and allowing for the isolation of P4P effects – are greatly needed.
Another important area for future research is that of the cost‐effectiveness of P4P schemes. We have identified a small number of studies focused on this, which we have not been able to review; however, a comprehensive search for such evidence will be warranted in future. Similarly, the sustainability of schemes, as well as cost and budgetary implications, remains an under‐researched topic.
To fully explore the impacts of P4P schemes, evaluations should continue to adopt rigorous research designs and take a broad perspective in considering wider intended or unintended system effects; the focus for research going forward should be on identifying for whom, under what conditions, via what mechanism, at what cost and compared to what other interventions does P4P work?
What's new
| Date | Event | Description |
|---|---|---|
| 10 May 2021 | Amended | Correction to characteristics of included study |
History
Protocol first published: Issue 3, 2009 Review first published: Issue 2, 2012
| Date | Event | Description |
|---|---|---|
| 16 December 2020 | Feedback has been incorporated | Addressed reviewer comments. |
| 12 March 2020 | New search has been performed | This is the first update of the Cochrane review published in 2012. We have conducted a new search and have updated other content. |
| 12 March 2020 | New citation required and conclusions have changed | This update includes 59 new studies. Previous study inclusion criteria have changed and we have excluded 9 studies previously included in the review from this update; changes to results and conclusions, summary of findings tables, GRADE. New review authors have contributed to this update. |
| 13 February 2012 | Amended | Minor edits |
Acknowledgements
We gratefully acknowledge the help of Marit Johansen and Lara Christianson in developing and implementing the search strategies, of Nicole Vidal for assisting with data extraction and of Stefan Lhachimi for his inputs in the initial phases of the review. We also acknowledge the helpfulness of the original study authors in providing additional data and information. We further extend our gratitude to the Institute for Global Health and Development at Queen Margaret University for funding the staff time necessary to complete this review and to the Norwegian EPOC satellite for funding meetings between review authors. We would also like to thank the following editors and peer referees who provided comments to improve the review: Simon Lewin (editor), Denny John (editor), Chris Rose (editor), Claire Glenton (PLS editor), Blake Angell (peer referee), Lumbwe Chola (peer referee), and Elizabeth Royle and the Copy Edit Support team for copy‐editing the review.
The Norwegian Satellite of the EPOC Group receives funding from the Norwegian Agency for Development Cooperation (Norad), via the Norwegian Institute of Public Health to support review authors in the production of their reviews.
This Cochrane Review is associated with the Research, Evidence and Development Initiative (READ‐It). READ‐It (project number 300342‐104) is funded by UK aid from the UK government; however, the views expressed do not necessarily reflect the UK government’s official policies.
Appendices
Appendix 1. Comparison 1: secondary 'Summary of findings' tables 1 to 45
1.1. Targeted health outcomes
Table 1. Burden of disease measures
| Health outcomes: burden of disease measures | ||||
|
Patient group: mothers and children Comparison: pure control group (standard practice, status quo, no additional financing) Intervention: any type of P4P Settings: Argentina | ||||
| Outcome | Impact summary | Number of studies | Certainty of the evidence | Comments |
| DALY | P4P may avert 25,401 DALY (95% confidence region 4064 to 46,738) (due to a mix of neonatal mortality and low‐birth weight reduction). | 1 (Gertler 2014) | Lowa | No RCT reported this outcome for this comparison. |
DALY: disability adjusted life‐years; P4P: paying for performance. aCritical concerns over three risk of bias criteria.
Table 2. Mortality and incidence of sickness
| Health outcomes: mortality and incidence of sickness | ||||
|
Patient group: mothers and children Comparison: pure control group (standard practice, status quo, no additional financing) Intervention: any type of P4P Settings: Argentina, Brazil, India | ||||
| Outcome | Impact summary | Number of studies | Certainty of the evidence | Comments |
| Child mortality (per 1000 children born alive) | P4P may have desirable effects; reduction in mortality ranging from 0.2% to 6.5%. | 1 (Viñuela 2015) | Lowa | ITS. |
| Neonatal mortality (see text) | P4P effects are inconsistent: P4P may have desirable effects and ensure reduction in neonatal mortality in implementing clinics by up to 22%. However, another study identified increase in region of 6.5% across catchment areas of P4P incentivized providers. | 2 (Gertler 2014; Mohanan 2017) | Lowb | Sensitivity analysis: RCT showed slight increase in neonatal mortality estimated beta of 0.0079 increase (standard error 0.0067; recalculated effect 6.5%), moderate‐certainty evidence (1 study only, no substantive concerns). |
| Summary | Low‐certainty evidence, suggestive of desirable effects. | |||
ITS: interrupted time series; P4P: paying for performance. aConcerns over risk of bias, one study only. bConcerns over risk of bias.
Table 3. Reproductive maternal and child health outcomes
| Health outcomes: RMNCH outcomes | ||||
|
Patient group: mothers and children Comparison: pure control group (standard practice, status quo, no additional financing) Intervention: any type of P4P Settings: Cameroon, Peru | ||||
| Outcome | Impact summary | Number of studies | Certainty of the evidence | Comments |
| Unwanted pregnancy (rate) | Effects of the intervention are uncertain. Noted an increase of 1% in unwanted pregnancies. | 1 (Zang 2015) | Verylowa | No RCT reported this outcome for this comparison. |
| Reported anaemia in children (%) | P4P may have desirable effects, ranging from 2% to 3% reduction in children with anaemia. | 1 (Cruzado de la Vega 2017) | Lowb | No RCT reported this outcome for this comparison. |
| Summary | Overall, inconsistent impacts – relatively small increase in unwanted pregnancies (very low‐certainty evidence) but positive impacts on reported anaemia in children (reduction of 2–3% with low certainty). | |||
P4P: paying for performance; RCT: randomized controlled trial; RMNCH: reproductive, maternal, newborn and child health. aSerious concerns over the risk of bias criteria, one study only). bConcerns over risk of bias, one study only).
Table 4. Tuberculosis treatment success
| Health outcomes: tuberculosis treatment success | ||||
|
Patient group: people with tuberculosis Comparison: pure control group (standard practice, status quo, no additional financing) Intervention: any type of P4P Settings: China, Swaziland | ||||
| Outcome | Impact summary | Number of studies | Certainty of the evidence (GRADE) | Comments |
| Tuberculosis treatment success rate | P4P may have desirable effects, treatment success in PBF districts increased by 12–20% in comparison to controls. | 2 (Kliner 2015; Yao 2008) | Lowa | No RCT reported this outcome for this comparison. |
| Summary | Limited‐certainty evidence; however, indicative of desirable effects. | |||
P4P: paying for performance; RCT: randomized controlled trial. aSerious concerns over the risk of bias criteria.
1.2. Targeted measures of provider performance
1.2.1. Utilization and delivery
Table 5. Utilization and delivery of HIV‐AIDS, malaria and TB services
| Utilization and delivery: HIV‐AIDS, malaria and TB | ||||
|
Patient group: households and patients exposed to HIV/TB/malaria and seeking care at health facilities Comparison: pure control group (standard practice, status quo, no additional financing) Intervention: any type of P4P Settings: Burundi, Cameroon, China, Democratic Republic of the Congo, Swaziland, Tanzania | ||||
| Outcome | Impact summary | Number of studies | Certainty of the evidence (GRADE) | Comments |
| Provision of HIV testing (% of people tested) | P4P may have a desirable effect on the % of people tested for HIV, with relative increases in testing rates of 6–600%. | 3 (de Walque 2017; McMahon 2016; Zeng 2018) | Lowa | Indicators assessed differently and over the course of different time points: de Walque 2017 provision of HIV testing from facility registers, Zeng 2018 % of patients receiving test when offered and McMahon 2016 considered different populations (males, females – both pregnant and not); effects consistent at endpoints of studies. No RCT reported this outcome for this comparison. |
| Provision of ART (% of people receiving) | P4P may have undesirable effects: ART provision in the general population declined by 121%; in pregnant women, effects on utilization and delivery of ART at health centres estimated at 0%, at hospitals –13%. | 2 (de Walque 2017; McMahon 2016) | Lowb | Indicators differed, and there was inconsistency over time in impacts. No RCT reported this outcome for this comparison. |
| Provision of PMTCT (% of women receiving) | P4P may have desirable effects: the % of women receiving PMTCT ranging from –3.8% to 21%. | 2 (Binyaruka 2015; de Walque 2017) | Lowc | Indicators differed: Binyaruka 2015 assessed PMTCT in ANC clients only, de Walque 2017 at facility levels. No RCT reported this outcome for this comparison. |
| Bednet use (% children and households using bednets) | P4P may have undesirable effects: the effect of P4P on the % of children or households using bednets (ranging from 0% to –7.3%). | 2 (Bonfrer 2014a; Zeng 2018) | Lowd | 2 distinct criteria, though targeting same concept so no indirectness suspected. Authors of 1 paper noted ceiling effects. No RCT reported this outcome for this comparison. |
| TB adherence rate (%) | The effects of the intervention on TB adherence were uncertain: we noted inconsistent effects, ranging from a positive effect (–2% reduction in loss to follow‐up compared to control) in all patients; to 62% increase in loss to follow‐up in smear‐positive patients. | 2 (Kliner 2015; Yao 2008) |
Verylowe | Indicators differed: 1 assessed defaulting in general and the other in smear‐positive patients. No RCT reported this outcome for this comparison. |
| Summary | Overall, low‐certainty evidence; P4P may have desirable effects on the proportion of people undergoing HIV testing and PMTCT. However, it may worsen ART delivery. | |||
ANC: antenatal care; ART: antiretroviral therapy; P4P: paying for performance; PMTCT: prevention of mother‐to‐child transmission; RCT: randomized controlled trial; TB: tuberculosis. aMost studies with limitations for one or more criteria in risk of bias and indirectness. bLimitations for one or more criteria in risk of bias and inconsistency of indicators. cLimitations for one or more criteria in risk of bias and indirectness. dCritical limitations for one or more criteria in risk of bias. eCritical limitations for one or more criteria risk of bias and indirectness.
Table 6. Utilization and delivery of immunizations
| Utilization and delivery: immunizations | ||||
|
Patient group: children and mothers undergoing vaccinations, reports for different age groups Comparison: pure control group (standard practice, status quo, no additional financing) Intervention: any type of P4P Settings: Afghanistan, Argentina, Burundi, Cambodia, Cameroon, Democratic Republic of the Congo, Malawi, Peru, Zambia, Zimbabwe | ||||
| Outcome | Impact summary | Number of studies | Certainty of the evidence (GRADE) | Comments |
| Child immunization: % receiving ≥ 1 vaccine | P4P may make little to no difference to outcome: effects inconsistent of small magnitude, ranging from –1 to 1%. | 2 (Bonfrer 2014a; Huillery 2017) | Lowa | Indicators assessed across different age groups, 1 in children and 1 in infants. Sensitivity analysis: 1 RCT reported positive effect 1%, moderate‐certainty evidence (1 study only). |
| Children fully vaccinated (%) | Effects of the intervention are uncertain: literature noted effect sizes ranging from –18% to 38.9%. | 8 (Bonfrer 2014b; Chansa 2015; Cruzado de la Vega 2017; de Walque 2017; Friedman 2016a; Friedman 2016b; McMahon 2016; Zeng 2018) | Lowb | Exact indicators differed across population groups assessed (age groups) and ITS slope and level change captured within range. Sensitivity analysis: 1 RCT estimated at 16.1%, low‐certainty evidence (serious concerns over ≥ 2 risk of bias criteria, 1 study only). |
| Children receiving BCG (%) | P4P may have small desirable effects: effects ranging from small negative effects (–3.4%) to positive (7%) | 8 (Bonfrer 2014a; Bonfrer 2014b; Falisse 2015; Friedman 2016a; Friedman 2016b; Huillery 2017; Zeng 2013, Zeng 2018) | Lowa | Exact indicators differed, summary over indicators in coverage, children aged 12–24 months and different time points. Sensitivity analysis: RCT evidence was 1–7% (2 studies); low‐certainty evidence (critical limitations risk of bias and indirectness). |
| Children receiving DTP (%) | P4P may have undesirable effects, ranging from –19.7% to +9% | 6 (Bonfrer 2014b; Falisse 2015; Friedman 2016a;Friedman 2016b; Matsuoka 2014; Zeng 2018) | Lowc | Exact indicators differed, summary drew on data across coverage and % indicators for children of different age groups receiving DTP 1, 2, 3 and ITS slope and level change captured within range. Sensitivity analysis: RCT effect was 6.1%; low‐certainty evidence (1 study, concerns over risk of bias). |
| Children receiving measles vaccination (%) | P4P may have desirable effects, ranging from –5% to 18.7% | 6 (Binyaruka 2015; Bonfrer 2014b; de Walque 2017; Friedman 2016a; Friedman 2016b; Matsuoka 2014) | Lowc | Indirectness likely as indicators assessed across different populations and ITS slope and level change captured within range. Sensitivity analysis: RCT effect was –3.6%; low‐certainty evidence (1 study, risk of bias concerns). |
| Children receiving polio vaccination (%) | P4P may have desirable effects, ranging from –7.1% to +23% | 7 (Binyaruka 2015; Bonfrer 2014b; de Walque 2017; Falisse 2015; Friedman 2016a; Friedman 2016b; McMahon 2016) | Lowa | Indicators different, ranging from coverage to % receiving specified number of doses. Sensitivity analysis: RCT effect was 21% (low‐certainty evidence; concerns over 1 criterion among risk of bias and 1 study only) |
| Children receiving pentavalent vaccination (%) | P4P may make little to no difference to the outcome, with effects ranging from –5.7% to 3.1% | 3 (Binyaruka 2015; Engineer 2016; McMahon 2016) | Lowa | Sensitivity analysis: RCT effect was –5.7%; moderate‐certainty evidence (downgraded, as 1 study only). |
| Mothers receiving immunizations (%) | P4P may have desirable effects, ranging from –2.2% to 65.5% | 9 (Binyaruka 2015; Bonfrer 2014a; Bonfrer 2014b; de Walque 2017; Falisse 2015; Gertler 2014; McMahon 2016; Zang 2015; Zeng 2018) | Lowd | Indicators were substantively different, ranging from coverage rates, to % of women vaccinated at facilities, to % of women giving birth who had received vaccine. No RCT reported this outcome for this comparison. |
| Summary | Effects on overarching likelihood of children being vaccinated appeared inconsistent; some vaccinations such as polio, measles and BCG may be positively affected, while others such as DTP may be negatively affected. Low‐certainty evidence. | |||
BCG: Bacillus Calmette–Guérin; DTP: diphtheria‐tetanus‐pertussis; ITS: interrupted time series; P4P: paying for performance; RCT: randomized controlled trial. aLimitations for one or more criteria in risk of bias and indirectness. bLimitations for one or more criteria in risk of bias and indirectness, upgraded for appreciable benefit. cLimitations for one or more criteria in risk of bias and indirectness, one study reanalyzed). dCritical limitations for one or more criteria in risk of bias and noted indirectness, +1 for potential of large effect, –1 for suspected publication bias)
Table 7. General service utilization and delivery (any, curative, outpatient)
| Utilization and delivery: general | ||||
|
Patient group: overall patients utilizing clinics Comparison: pure control group (standard practice, status quo, no additional financing) Intervention: any type of P4P Settings: Burundi, Cameroon, China, Democratic Republic of the Congo, Zambia | ||||
| Outcome | Impact summary | Number of studies | Certainty of the evidence (GRADE) | Comments |
| Probability of any utilization (% rate) | P4P may make little to no difference to the outcome, effects noted were consistently positive ranging from 2% to 4.2%. | 2 (Bonfrer 2014a; Friedman 2016a) | Lowa | Sensitivity analysis: RCT suggested impacts around 4.2%; low‐certainty evidence (concerns over risk of bias criteria, 1 study only). |
| Frequency of curative utilization (% rate) | P4P may have desirable effects: literature noted 83% increase in utilization. | 1 (Zeng 2018) | Lowb | No RCT reported this outcome for this comparison. |
| Frequency of outpatient utilization (% rate) | P4P may have desirable effects, ranging from –3% to 15% | 3 (Chansa 2015; Falisse 2015; Zang 2015) | Lowa | ITS slope and level change captured within range. No RCT reported this outcome for this comparison. |
| Frequency of all visits (number of visits) | P4P may have little to no impact on the outcome of interest, with effects in number of total visits in ranging from 0.8% to 3.6% | 1 (Powell‐Jackson 2014) | Lowc | No RCT reported this outcome for this comparison. |
| Summary | P4P may have desirable effects of curative and outpatient utilization; however, appears to make little to no different to utilization or frequency of visits overall. Low‐certainty evidence. | |||
ITS: interrupted time series; P4P: paying for performance; RCT: randomized controlled trial. aCritical limitations for two risk of bias criteria. bConcerns over two or more risk of bias criteria and suspected publication bias, one study only, upgraded for large effect. cCritical concerns over one risk of bias criterion, one study only.
Table 8. Utilization and delivery of family planning services
| Utilization and delivery: RMNCH – family planning | ||||
|
Patient group: women of reproductive age (15–49 years) in study districts Comparison: pure control group (standard practice, status quo, no additional financing) Intervention: any type of P4P Settings: Burundi, Cameroon, Democratic Republic of the Congo, Zambia, Zimbabwe | ||||
| Outcome | Impact summary | Number of studies | Certainty of the evidence | Comments |
| Any family planning (% people using any method) | Effects of the intervention were uncertain: inconsistent effects on the utilization rate of any contraceptives, ranging from –6.37% to 6.7% overall. | 5 (Binyaruka 2015; Friedman 2016a; Friedman 2016b; Huillery 2017; Zeng 2018) | Lowa | Sensitivity analysis: 2 RCTs reported estimates suggestive of no or negative impacts ranging from –6.3% to 0%; low‐certainty evidence (concerns over risk of bias, 2 studies). |
| Modern family planning utilization (% women utilizing modern methods) | Overarchingly, effects of the intervention are uncertain. P4P may have positive effects on the coverage of modern family planning services, with effects ranging from 3.6% to 19.5%. However, effects of the intervention on facility utilization rates are uncertain: effects ranging from –20.5% to 36%. | 7 (Bonfrer 2014a; de Walque 2017; Falisse 2015; Friedman 2016a; Friedman 2016b; Zang 2015; Zeng 2018) | Lowa | Sensitivity analysis: RCT estimated relative effect of 0.2% in household survey; low‐certainty evidence (1 study, risk of bias concerns). |
| Family planning (% of services delivered) | P4P probably improves the delivery of family planning services, with effects ranging from 10% to 300% increase in delivery of family planning services at health facility. | 2 (de Walque 2017; Friedman 2016b) | Moderateb | No RCT reported this outcome for this comparison. |
| Summary | Moderate‐certainty evidence that delivery of family planning services is increasing, consistent with the positive effects noted in relation to utilization of modern family planning methods among women (low‐certainty evidence). Low‐certainty evidence on the use of any family planning method, however. | |||
P4P: paying for performance; RCT: randomized controlled trial; RMNCH: reproductive, maternal, newborn and child health. aCritical limitations over two or more risk of bias criteria. bCritical risk of bias limitation on one criterion, study design plus large effect in large sample size.
Table 9. Utilization and delivery of antenatal care
| Utilization and delivery: RMNCH – aNC | ||||
|
Patient group: pregnant women enrolled in study within specified time frames Comparison: pure control group (standard practice, status quo, no additional financing) Intervention: any type of P4P Settings: Afghanistan, Benin, Burkina Faso, Burundi, Cambodia, Cameroon, Democratic Republic of the Congo, El‐Salvador, India, Malawi, Peru, Rwanda, Zambia, Zimbabwe | ||||
| Outcomes | Impact summary | Number of studies | Certainty of the evidence (GRADE) | Comments |
| ANC (% of women utilizing ANC) | P4P may have desirable effects, ranging from –4.9% to 15%. | 5 (Chansa 2015; de Walque 2017; Friedman 2016b; Mohanan 2017; Zeng 2018) | Lowa | Indicators overall consistent. ITS slope and level change captured within range. Sensitivity analysis: RCT estimates 4%, low‐certainty evidence (concerns over risk of bias limited information and 1 study only). |
| Total number of ANC visits | Effects of the intervention are uncertain: relative effects ranging from –16.4% to 37.6%. | 7 (Bernal 2018; Friedman 2016a; Friedman 2016b; Gertler 2014; Huillery 2017; Lagarde 2015; Matsuoka 2014) | Lowa | Some differences in indicator specifications and populations data collected in. ITS slope and level change captured within range. Sensitivity analysis: RCT estimates ranging from –35% to –4.6%; low‐certainty evidence (critical limitations risk of bias criteria for 1 study, 2 studies overall). |
| ≥ 1 ANC (utilization rates) | P4P may have desirable effects, ranging from –1.5% to 26.9% (median 1.1%, interquartile range 3). | 9 (Bernal 2018; Bonfrer 2014a; Bonfrer 2014b; Engineer 2016; Falisse 2015; Friedman 2016a; Friedman 2016b; Huillery 2017; Matsuoka 2014) | Lowb | Differences in specification of indicators, though not substantive. ITS slope and level change captured within range. Sensitivity analysis: 3 RCTs suggested effects ranging from –10% to –1.5%; moderate‐certainty evidence (limitations for risk of bias criteria). |
| ≥ 2 ANC (utilization rates) | P4P may make little to no difference on utilization of ≥ 2 ANC visits (effects ranging from –1.1% to 1.1%). | 3 (de Walque 2017; Matsuoka 2014; Zang 2015) | Lowc | No RCT reported this outcome for this comparison. |
| ≥ 4 ANC (utilization rates) | P4P may have desirable effects, ranging from –5.4% to 27% overall (though short‐term impacts estimated to be higher in some cases). | 4 (Friedman 2016a; Matsuoka 2014; McMahon 2016; Steenland 2017) | Lowa | ITS slope and level change captured within range. Sensitivity analysis: RCT estimate was –5.4%; low‐certainty evidence (concerns over risk of bias, 1 study only). |
| ANC from qualified provider (utilization rates) | P4P may make little to no difference on utilization of ANC from a qualified provider, effects ranging from 2.5% to 4.7%. | 2 (Friedman 2016a; Friedman 2016b) | Lowa | Sensitivity analysis: RCT estimated 4.7%; low‐certainty evidence (concerns over risk of bias, 1 study only). |
| Delivery of iron supplementation during ANC (% women receiving) | P4P may have undesirable effects, differing over the time‐span of assessment and by facility type; effects ranging from –109% to 6%. | 2 (Cruzado de la Vega 2017; McMahon 2016) | Lowb | No RCT reported this outcome for this comparison. |
| Women accessing care in first trimester (% women receiving) | P4P may have desirable effects, ranging from –0.1% to 37.7% | 4 (Bernal 2018; Friedman 2016b; McMahon 2016; Steenland 2017) | Lowa | No RCT reported this outcome for this comparison. |
| Summary | Low‐certainty evidence overall; however, it appears P4P may have positive effects on accessing ANC in general. | |||
ANC: antenatal care; ITS: interrupted time series; P4P: paying for performance; RCT: randomized controlled trial; RMNCH: reproductive, maternal, newborn and child health. aCritical limitations over two or more risk of bias criteria. bCritical limitations over two or more risk of bias criteria and indirectness. cSerious limitations over one criteria and lack of information in ITS.
Table 10. Utilization and delivery of institutional deliveries
| Utilization and delivery: RMNCH – institutional deliveries | ||||
|
Patient group: women giving birth in study periods Comparison: pure control group (standard practice, status quo, no additional financing) Intervention: any type of P4P Settings: Afghanistan, Burkina Faso, Burundi, Cambodia, Cameroon, Democratic Republic of the Congo, India, Malawi, Tanzania, Zambia, Zimbabwe | ||||
| Outcome | Impact summary | Number of studies | Certainty of the evidence | Comments |
| Institutional delivery utilization (utilization rate) | Effects of the intervention are uncertain ranging from –3% to 27% (median 9.45%, interquartile range 17.5%); most studies reported positive effects on utilization or coverage rates overall. | 13 (Binyaruka 2015; Bonfrer 2014a; Bonfrer 2014b; Chansa 2015; Falisse 2015; Friedman 2016a; Friedman 2016b; Huillery 2017; Ir 2015; Mohanan 2017; Steenland 2017; Zang 2015; Zeng 2018) | Verylowa | Indicators specified differently, which introduces issues with interpretation. ITS slope and level change captured within range. Sensitivity analysis: 3 RCTs provided estimates that are inconsistent but P4P may have desirable effects, ranging from –3% to 18.1%; moderate‐certainty evidence (concerns over risk of bias). |
| Institutional delivery: caesarean section (utilization rate) | P4P may have desirable effects, ranging from 2% to 146%. | 2 (Friedman 2016b; Huillery 2017) | Lowb | Sensitivity analysis: RCT estimate is 2%; moderate‐certainty evidence (1 study only). |
| Institutional delivery: skilled attendance (utilization rate) | P4P may have desirable effects, ranging from –5% to 42%. | 6 (de Walque 2017; Engineer 2016; Friedman 2016a; Friedman 2016b; McMahon 2016; Zeng 2018) | Lowc | Sensitivity analysis: effects positive across the 2 RCTs (ranging from 4% to 16.2%); low‐certainty evidence (risk of bias concerns). |
| Summary | Very low to low certainty in results surrounding overall utilization of institutional deliveries and skilled attendance at these, suggestive of potential desirable effects on caesarean section delivery and skilled attendance at deliveries. | |||
ANC: antenatal care; ITS: interrupted time series; P4P: paying for performance; RCT: randomized controlled trial; RMNCH: reproductive, maternal, newborn and child health. aSerious concerns over risk of bias, indirectness and suspected publication bias. bSerious concerns over risk of bias criteria. cConcerns over more than two risk of bias criteria.
Table 11. Utilization and delivery of postnatal care
| Utilization and delivery: RMNCH – postnatal care | ||||
|
Patient group: women who have given birth in enrolled facilities Comparison: pure control group (standard practice, status quo, no additional financing) Intervention: any type of P4P Settings: Afghanistan, Burkina Faso, Democratic Republic of the Congo, India, Malawi, Tanzania, Zambia, Zimbabwe | ||||
| Outcome | Impact summary | Number of studies | Certainty of the evidence | Comments |
| Postnatal care: overall utilization rate | P4P may have desirable effects, ranging from –2.88% to 25% overall. | 5 (Friedman 2016a; Friedman 2016b; Huillery 2017; Mohanan 2017; Steenland 2017) | Lowa | Sensitivity analysis: 3 studies were RCTs with estimates ranging from –2% to 10.8%; moderate‐certainty evidence (serious concerns over 2 risk of bias criteria in 1 study). |
| Postnatal care: proportion of women receiving skilled attendance | P4P may have desirable effects, ranging from 15.79% to 26.4%. | 2 (Friedman 2016a; Friedman 2016b) | Lowa | Sensitivity analysis: RCT estimate was 15.79%; low‐certainty evidence (risk of bias concerns and 1 study only). |
| Postnatal care: proportion of women with timely access | P4P may have desirable effects, ranging from –3% to 25%. | 4 (Binyaruka 2015; Engineer 2016; Friedman 2016b; McMahon 2016) | Lowb | Comparability of indicators compromised; some estimate at facility level and other household and for different time frames. Sensitivity analysis: RCT results suggestive of no impact (–0.8%); moderate‐certainty evidence (1 study only). |
| Summary | Low‐certainty evidence overall; however, indicative of potential positive effects of P4P on postnatal care. | |||
P4P: paying for performance; RCT: randomized controlled trial; RMNCH: reproductive, maternal, newborn and child health. aSerious concerns over risk of bias criteria. bSerious concerns over risk of bias criteria and indirectness.
Table 12. Utilization and delivery of childcare
| Utilization and delivery: childcare | ||||
|
Patient group: households with children in study catchment areas Comparison: pure control group (standard practice, status quo, no additional financing) Intervention: any type of P4P Settings: Democratic Republic of the Congo, Haiti, Malawi, Zambia | ||||
| Outcome | Impact summary | Number of studies | Certainty of the evidence | Comments |
| Utilization rate of consultations in children | Effects of the intervention are uncertain: consultation rates for children aged < 1 year increasing by 9.4%, and for those aged 1–4 years by 5.7%. | 1 (Zeng 2013) | Verylowa | No RCT reported this outcome for this comparison. |
| Utilization rate of curative consultations in children | P4P may have slight undesirable effects: estimated at 10.9% reduction in utilization. | 1 (Friedman 2016a) | Lowb | RCT. |
| Vitamin A supplementation in children (rate) | P4P may have desirable effects: consistently positive impacts on children receiving vitamin A supplementation; impact on rates ranging between 50% and 155%. | 2 (McMahon 2016; Zeng 2018) | Lowb | Indicators not directly comparable, given different estimation (by facility or population). No RCT reported this outcome for this comparison. |
| Summary | Overall inconsistent effects: evidence of desirable impacts for vitamin A supplementation, however, uncertain and undesirable effects for utilization of child consultations. | |||
P4P: paying for performance; RCT: randomized controlled trial. aSerious concerns over two or more risk of bias criteria, one study only. bSerious concerns over two or more risk of bias criteria.
1.2.2. Quality of care
Table 13. Adherence to procedures and guidelines and adverse drug reaction management
| Quality of care: adherence to procedures and guidelines and adverse drug reaction management | ||||
|
Patient group: predominantly mothers and children seeking care or living in the districts where assessments occurred Comparison: pure control group (standard practice, status quo, no additional financing) Intervention: any type of P4P Settings: Afghanistan, Benin, Burundi, Zambia, Zimbabwe, Multiple | ||||
| Outcome | Impact summary | Number of studies | Certainty of the evidence | Comments |
| Background and physical assessment (scores general, across ANC, PNC, childcare and for other consultations) | Effects of the intervention are uncertain, ranging from –17% to 23% change in scores. | 7 (Bonfrer 2014b; Das 2017; Duysburgh 2016; Engineer 2016; Friedman 2016a; Friedman 2016b; Lagarde 2015) | Verylowa | Substantial variation in specified indicators, calculated means across a range of measures, which may not be directly comparable but used same underlying concept. Sensitivity analysis: 2 RCTs suggest impacts range from –17% to 4%, low‐certainty evidence (serious concerns over risk of bias). |
| Correct patient management by healthcare providers (scores in relation to ANC, childcare and PNC) | Effects of the intervention are uncertain: Engineer 2016 estimated difference to be minor at 0.8%, Friedman 2016b observed differences across diverse items ranging from –75% (for management of children with anaemia) to 225% for management of a child with HIV; Duysburgh 2016 noted similar differences from –12% to 26% change in scores. | 3 (Duysburgh 2016; Engineer 2016; Friedman 2016b) | Verylowa | Sensitivity analysis: RCT estimated impact at 0.6%, moderate‐certainty evidence (1 study only, no other concerns). |
| Patient counselling (scores on ANC‐ and PNC‐related counselling) | Effects of the intervention are uncertain, ranging from –37% to 17.25% change in scores, depending on the service and type of patient counselling conducted. High levels of heterogeneity in the way indicators were specified. | 6 (Das 2017; Duysburgh 2016; Engineer 2016; Friedman 2016a; Friedman 2016b; Lagarde 2015) | Verylowa | Sensitivity analysis: RCT estimates suggest impacts between –37% and 6%, low‐certainty evidence (serious concerns over risk of bias, indirectness). |
| Quality of care in delivery of immunizations in ANC (%) | P4P may have desirable effects, ranging from 2.25% to 14% change in scores overall. | 2 (Friedman 2016a; Friedman 2016b) | Lowb | Sensitivity analysis: RCT estimated 2.25% on average; low‐certainty evidence (serious risk of bias concerns, 1 study only). |
| Women in ANC given or prescribed folic acid or iron or both (%) | P4P may have desirable effects, ranging from 5.5% to 19.2% change in scores. | 2 (Friedman 2016a; Friedman 2016b) | Lowb | Sensitivity analysis: RCT estimated 5.5%, low‐certainty evidence (serious risk of bias concerns, 1 study only). |
| Prescription quality of care (index score) | P4P may have desirable effects, effects on scores in PBF groups estimated at 7% change in score compared to control. | 1 (Das 2017) | Lowb | No RCT reported this outcome for this comparison. |
| Summary | Very low to limited certainty in results across this area – indictors on quality of care for ANC and prescriptions responded positively, across 3 other areas effects were inconsistent though to be expected given indirectness. | |||
ANC: antenatal care; P4P: paying for performance; PBF: performance‐based funding; PNC: postnatal care; RCT: randomized controlled trial. aSerious concerns over the risk of bias and indirectness. bConcerns over risk of bias criteria.
Table 14. Human resource skills and responsiveness
| Quality of care: human resource inputs | ||||
|
Patient group: predominantly patients using RMCH and curative care services at targeted health facilities Comparison: pure control group (standard practice, status quo, no additional financing) Intervention: any type of P4P Settings: Afghanistan, Benin, Burundi | ||||
| Outcome | Impact summary | Number of studies | Certainty of the evidence | Comments |
| Staff knowledge and skills (score) | P4P may make little to no difference, effect estimated at 0.2% difference in knowledge scores. | 1 (Engineer 2016) | Lowa | RCT. |
| Staff responsiveness (score) | P4P may have desirable effects, ranging from –2% to 49% | 2 (Bonfrer 2014a, Lagarde 2015) | Verylowb | No RCT reported this outcome for this comparison. |
| Summary | Overall very low‐ to low‐certainty evidence; however, suggestive of desirable effects in relation to staff responsiveness. | |||
P4P: paying for performance; RCT: randomized controlled trial; RMCH: reproductive, maternal and child health. aNo concerns over risk of bias but imprecision likely, one study only. bSerious concerns over risk of bias criteria and indirectness.
Table 15. Patient knowledge outcomes and perceptions
| Quality of care: patient outcomes and perceptions and contact and waiting time | ||||
|
Patient group: predominantly women and households accessing care in facilities included in studies Comparison: pure control group (standard practice, status quo, no additional financing) Intervention: any type of P4P Settings: Afghanistan, Benin, Burundi, Tanzania, Zambia | ||||
| Outcome | Impact summary | Number of studies | Certainty of the evidence | Comments |
| Patient knowledge (score) | P4P may have desirable effects, ranging from –3% to 116%; however, majority was positive. Mean across area was 37%. | 1 (Friedman 2016a) | Lowa | RCT. |
| Contact time | P4P may make little to no difference to indicator, effects ranging from –5.1% to 5.9%. | 3 (Binyaruka 2015; Engineer 2016; Lagarde 2015) | Lowb | Sensitivity analysis: RCT estimates at 2.5%; moderate‐certainty evidence (1 study only) |
| Waiting time | P4P may have undesirable effects, as increases in dissatisfaction with waiting times ranging from 10.8% to 12%. | 2 (Binyaruka 2015; Bonfrer 2014a) | Lowc | No RCT reported this outcome for this comparison. |
| Summary | Low‐certainty evidence overall; however, indicative of desirable effects on patient knowledge, limited to negative effects on contact and waiting time. | |||
P4P: paying for performance; RCT: randomized controlled trial. aConcerns over risk of bias criteria, one study only. bSerious concerns over risk of bias and indirectness. cSerious concerns over risk of bias.
Table 16. Quality scores
| Quality of care: quality composite scores (assessed via a mix of direct observation and patient exit interviews) | ||||
|
Patient group: mixed groups – varied according to study and scheme Comparison: pure control group (standard practice, status quo, no additional financing) Intervention: any type of P4P Settings: Afghanistan, Burundi, Cameroon, Philippines, Tanzania, Zambia, Zimbabwe, Multiple | ||||
| Outcome | Impact summary | Number of studies | Certainty of the evidence | Comments |
| Overall composite quality of care score | P4P may have desirable effects, ranging from –4% to 20% change in scores in most studies, 1 study noted outlier of 15 times increase. | 8 (Bonfrer 2014a; Das 2017; de Walque 2017; Engineer 2016; Friedman 2016b; Peabody 2011a; Quimbo 2016; Zang 2015) | Lowa | Sensitivity analysis: 2 RCTs suggested impacts of 1.6% to 4%; moderate‐certainty evidence (some concerns over risk of bias). |
| Quality family planning (score) | P4P may improve the quality of family planning services (range 9–32% change in score increased in quality of family planning scores). | 3 (Rudasingwa 2014; Zang 2015, Friedman 2016a) | Lowb | No RCT reported this outcome for this comparison. |
| Quality of ANC (score) | Effects of the intervention are uncertain, ranging from –11.3% to 27.3% change in scores. | 6 (Binyaruka 2015; de Walque 2017; Duysburgh 2016; Friedman 2016a; Friedman 2016b; Zang 2015) | Lowc | Sensitivity analysis: RCT estimated increase of 4%; low‐certainty evidence (1 study, concerns over risk of bias). |
| Quality maternity care (score) | P4P may have desirable effects, ranging from 6.4% to 31% change in scores. | 2 (Friedman 2016b; Zang 2015) | Lowb | No RCT reported this outcome for this comparison. |
| Quality of child health care (score) | P4P probably improves quality of child healthcare scores, relative impact on scores ranging from 6.1% to 300% change in scores. | 3 (Duysburgh 2016; Friedman 2016a; Friedman 2016b) | Moderated | Sensitivity analysis: RCT suggested 300%; moderate‐certainty evidence (downgraded 2 levels for risk of bias concerns and 1 study, and upgraded 1 level for effect). |
| Quality of outpatient services (score) | Effects of the intervention are uncertain, relative effect was 23% change in score. | 1 (Zang 2015) | Verylowe | No RCT reported this outcome for this comparison. |
| Quality of medicine and equipment (score) | P4P probably improves quality of medicine and equipment scores, effects ranging from 2.7% to 220% change in scores overall. | 5 (Bonfrer 2014a; Das 2017; Duysburgh 2016; Friedman 2016a; Friedman 2016b) | Moderatef | Sensitivity analysis: RCT suggested 220%; moderate‐certainty evidence (downgraded 2 levels for risk of bias concerns and 1 study, and upgraded 1 level for effect). |
| Quality by department and/or service (score) | P4P probably improves quality of care scores by department, relative effects vary from increases of 39% to 15‐fold change in score increases in the indices across outpatient care, delivery room, referral services, infection prevention and control, and waste management. | 3 (Das 2017; Friedman 2016a; Friedman 2016b) | Moderatef | Sensitivity analysis: RCT impact suggested 15‐fold increase; moderate‐certainty evidence (downgraded 2 levels for risk of bias concerns and 1 study, and upgraded 1 level for effect). |
| Summary | Family planning, maternal and child health, medicine and equipment, and department quality appeared to respond positively; however, ANC effects were mixed. Overall, moderate‐certainty evidence for few indicators only. | |||
ANC: antenatal care; P4P: paying for performance; RCT: randomized controlled trial. aSerious concerns over risk of bias, indirectness and potential publication bias, upgraded for large effect. bSerious concerns over risk of bias criteria. cSerious concerns over risk of bias criteria and indirectness. dSerious concerns over risk of bias but upgraded for large effect. eSerious concerns over risk of bias criteria, one study only. fSerious concerns over risk of bias and indirectness, but upgraded for large effect.
1.3. Targeted changes in resource use
Table 17. Human resource inputs
| Changes in resource use: human resources | ||||
|
Patient group: schemes targeting maternal and child health Comparison: pure control group (standard practice, status quo, no additional financing) Intervention: any type of P4P Settings: Cameroon, El Salvador | ||||
| Outcome | Impact summary | Number of studies | Certainty of the evidence | Comments |
| Human resource availability | P4P probably has desirable effects on nurse availability, about 1–2 extra nurses in absolute numbers, increasing proportion of qualified staff by 19–44%. | 2 (de Walque 2017; Zang 2015) | Moderatea | No RCT reported this outcome for this comparison. |
| Curative health visits per healthcare professional | Effects of the intervention are uncertain, there was an estimated decrease of 66%. | 1 (Bernal 2018) | Verylowb | No RCT reported this outcome for this comparison. |
| Summary | Human resource availability appears to increase if targeted (moderate‐certainty evidence); limited certainty in estimates on curative health visits/health professional ratio. | |||
P4P: paying for performance; RCT: randomized controlled trial. aSome limitations for risk of bias across one study and imprecision. bSerious limitations for risk of bias and for imprecision, one study only.
Table 18. Medicine and equipment availability
| Changes in resource use: medicine and equipment | ||||
|
Patient group: schemes targeting maternal and child health predominantly Comparison: pure control group (standard practice, status quo, no additional financing) Intervention: any type of P4P Settings: Afghanistan, Cameroon, Tanzania, Zambia, Zimbabwe | ||||
| Outcome | Impact summary | Number of studies | Certainty of the evidence | Comments |
| Equipment availability (index) | P4P may have desirable effects, ranging in magnitude from about 3–308%. | 4 (Binyaruka 2017; de Walque 2017; Friedman 2016a; Friedman 2016b) | Lowa | Sensitivity analysis: RCT estimate was 308%; low‐certainty evidence (downgraded 2 level for risk of bias concerns). |
| Equipment functionality (index) | P4P may have little to no impact on the indicator, slight positive effect (range 1.4%) difference in equipment functionality compared to control. | 1 (Engineer 2016) | Lowb | RCT. |
| Infrastructure functionality (index) | P4P may have desirable effects, ranging from 4.5% to 345%. | 3 (Engineer 2016; Friedman 2016a; Friedman 2016b) | Lowa | Sensitivity analysis: 2 RCTs suggested impacts between 4.5% and 345%; low‐certainty evidence (downgraded due to risk of bias). |
| Medicine availability (index) | P4P may have desirable effects, ranging from 4.3 to 977%. | 4 (de Walque 2017; Engineer 2016; Friedman 2016a; Friedman 2016b; Zang 2015) | Lowa | Sensitivity analysis: 2 RCT provide estimates from 0.6% to 200%; low‐certainty evidence (downgraded due to risk of bias). |
| Vaccine availability (index) | Effects of the intervention are uncertain, ranging from –89% to 24.7%. | 4 (Binyaruka 2017; de Walque 2017; Friedman 2016a; Friedman 2016b) | Lowc | Sensitivity analysis: RCT estimate was 21.95%; low‐certainty evidence (risk of bias concerns, 1 study). |
| Stockout equipment | P4P may have desirable effects, reduction of stockout estimated at 33%. | 1 (Binyaruka 2017) | Lowd | No RCT reported this outcome for this comparison. |
| Stockout vaccines | P4P may have desirable effects, reduction of stockouts estimated at 47.4%. | 1 (Binyaruka 2017) | Lowd | No RCT reported this outcome for this comparison. |
| Summary | Low‐certainty evidence; however, generally suggestive of desirable effects. | |||
P4P: paying for performance; RCT: randomized controlled trial. aSerious concerns over risk of bias and imprecision. bConcern over imprecision, one study only. cSerious concerns over risk of bias and imprecision, indirectness. dSerious concerns over risk of bias and imprecision, indirectness, one study only.
1.4. Targeted secondary outcomes
Table 19. Provider motivation, satisfaction, absenteeism and acceptability
| Provider motivation, satisfaction, absenteeism and acceptability | ||||
|
Participants: healthcare workers at the facilities where studies conducted Comparison: pure control group (standard practice, status quo, no additional financing) Intervention: any type of P4P Settings: Afghanistan, Benin | ||||
| Outcome | Impact summary | Number of studies | Certainty of the evidence | Comments |
| Provider absenteeism (%) | P4P may have little to no effect on indicator, estimated range of 0.7–2% increases in absenteeism rate. | 1 (Lagarde 2015) | Lowa | No RCT reported this outcome for this comparison. |
| Provider motivation (score) | P4P probably has little to no effect on indicator. | 1 (Engineer 2016) | Moderateb | RCT. |
| Provider satisfaction (score) | P4P probably has little to no effect on indicator. | 1 (Engineer 2016) | Moderateb | RCT. |
| Summary | Low‐ to moderate‐certainty evidence, relative effects suggestive of neutral effects overall. | |||
P4P: paying for performance; RCT: randomized controlled trial. aSerious concerns over risk of bias and imprecision, one study only. bOne study only, no other concerns.
Table 20. Patient satisfaction and acceptability
| Patient satisfaction and acceptability (satisfaction scores) | ||||
|
Patient group: patients that had accessed ANC, child or curative care at study facilities Comparison: pure control group (standard practice, status quo, no additional financing) Intervention: any type of P4P Settings: Afghanistan, Benin, Cameroon, China, Tanzania, Zimbabwe | ||||
| Outcome | Impact summary | Number of studies | Certainty of the evidence | Comments |
| Patient satisfaction with facility cleanliness (score) | P4P may have desirable effects, ranging from 19.5% to 30%. | 2 (Das 2017; de Walque 2017) | Lowa | No RCT reported this outcome for this comparison. |
| Patient satisfaction with contact time (score) | Effects of the intervention are uncertain: positive impacts (about 2.25%) in satisfaction score with consultation times. | 1 (Das 2017) | Verylowb | No RCT reported this outcome for this comparison. |
| Patient satisfaction with opening hours (score) | P4P may have desirable effects, ranging from under 1–17.11% (for the opening hours for ANC consultations). | 2 (Das 2017; de Walque 2017) | Lowa | No RCT reported this outcome for this comparison. |
| Patient satisfaction with waiting time (score) | Effects of the intervention are uncertain, positive effect estimated at 32%. | 1 (Das 2017) | Verylowb | No RCT reported this outcome for this comparison. |
| Patient satisfaction with privacy (score) | P4P may have desirable effects, ranging from 4.6% to 44.6%. | 2 (Das 2017; de Walque 2017) | Lowa | No RCT reported this outcome for this comparison. |
| Overall patient satisfaction with quality of care (score) | P4P may have little to no effect (estimated at 0.4%). | 1 (Engineer 2016) | Lowb | RCT |
| Patient satisfaction with staff: communication (score) | P4P may have little to no effect on the indicator: mean effects ranging from 0.2% to 5.3% in comparison to control (politeness of staff during ANC and childcare and communication during delivery). | 2 (Binyaruka 2015; Lagarde 2015) | Lowa | No RCT reported this outcome for this comparison. |
| Patient satisfaction with staff: attitude (score) | P4P may have desirable effects, ranging from 3.3% to 13.3% (for ANC and curative care). | 2 (Das 2017; Lagarde 2015) | Lowa | No RCT reported this outcome for this comparison. |
| Overall satisfaction (score) | P4P may have desirable effects, ranging from –0.05 to absolute increase in scores in range of 0.6 standard deviations. | 2 (Das 2017; Yip 2014) | Lowa | Sensitivity analysis: RCT estimated between negative 0.03% and 0.1%, both crossing no effect line; moderate‐certainty evidence (1 study only, no other concerns). |
| Summary | Overall, low‐certainty evidence; however, evidence suggestive of some desirable effects. | |||
ANC: antenatal care; P4P: paying for performance; RCT: randomized controlled trial. aConcerns over risk of bias criteria. bConcerns over risk of bias criteria, one study only.
Table 21. Impacts on overall financing and resource allocation
| Impacts on overall financing or resource allocation | ||||
|
Patient group: households accessing care (except for remuneration, for which healthcare workers were reporting) Comparison: pure control group (standard practice, status quo, no additional financing) Intervention: any type of PBF Settings: China | ||||
| Outcome | Impact summary | Number of studies | Certainty of the evidence | Comments |
| Expenditure on medicine and equipment | P4P may have little to no effect on drug expenditures for insured patients rising by 2.5%, dropping for uninsured by 0.9%. | 1 (Wu 2014) | Lowa | ITS. No RCT reported this outcome for this comparison. |
| Summary | Low‐certainty evidence; however, suggestive of slight desirable effects. | |||
ITS: interrupted time series; PBF: performance‐based funding; RCT: randomized controlled study. aSome limited concerns over generalizability and risk of bias, one study only.
Table 22. Management or information systems
| Impacts on management or information systems | ||||
|
Patient group: healthcare workers and management staff in PBF and control facilities Comparison: pure control group (standard practice, status quo, no additional financing) Intervention: any type of PBF Settings: Afghanistan, Zambia | ||||
| Outcome | Impact summary | Number of studies | Certainty of the evidence | Comments |
| Facility or managerial autonomy (index) | P4P may have desirable effects, estimate on autonomy index 136%. | 1 (Friedman 2016a) | Lowa | RCT. |
| Facility governance (index) | P4P may have little to no effect on the indicator, intervention group had lower mean than control group, difference of 0.7%. | 1 (Engineer 2016) | Lowb | RCT. |
| Quality of management (index) | P4P may have little to no effect on the indicator, impacts on management functionality index was positive, about 0.6%. | 1 (Engineer 2016) | Lowb | RCT. |
| Summary | Low‐certainty evidence; however, suggestive of desirable effects on managerial autonomy, little to no effect on governance and quality of management. | |||
P4P: paying for performance; PBF: performance‐based funding; RCT: randomized controlled study. aDowngraded for risk of bias, imprecision, one study only, upgraded for large effects. bDowngraded for imprecision, one study only.
Table 23. Equity impacts
| Equity‐consideration: evidence of differential impact on different parts of the population | ||||
|
Patient group: same as for main utilization outcomes; primarily mothers and children in PBF and control districts Comparison: pure control group (standard practice, status quo, no additional financing) Intervention: any type of PBF Settings: Peru, Zimbabwe | ||||
| Outcome | Impact summary | Number of studies | Certainty of the evidence | Comments |
| Equity of child immunization delivery (wealth related) | P4P may have desirable effects that are pro poor, ranging from increasing utilization of immunizations by 4.5% to 42% among the poorest groups in comparison to wealthiest. | 2 (Cruzado de la Vega 2017; Friedman 2016b) | Lowa | No RCT reported this outcome for this comparison. |
| Equity in ANC delivery (wealth related) | P4P may have undesirable effects: impacts suggest households below median wealth/poorest households benefited less in ANC utilization compared to those of median wealth. | 2 (Cruzado de la Vega 2017; Friedman 2016b) | Lowa | No RCT reported this outcome for this comparison. |
| Equity in institutional delivery (wealth related) | P4P may have little to no effect, estimate suggestive of slight pro‐poor effect (< 2% compared to above median wealth group). | 1 (Friedman 2016b) | Lowb | No RCT reported this outcome for this comparison. |
| Equity in institutional delivery (by educational status of mother) | P4P may have little to no effect: 0.3% more institutional deliveries among mothers with primary education or less compared to mothers with secondary education or above. | 1 (Friedman 2016b) | Lowb | No RCT reported this outcome for this comparison. |
| Summary | Mixed picture in relation to equity effects overall; however, some desirable effects in relation to child immunization, undesirable in relation to ANC. | |||
ANC: antenatal care; P4P: paying for performance; PBF: performance‐based funding; RCT: randomized controlled study. aConcerns over consistent risk of bias and imprecision. bConcerns over risk of bias, one study only.
1.5. Untargeted health outcomes
Table 24. mortality and incidence of sickness
| Health outcomes: mortality and incidence of sickness | ||||
|
Patient group: mothers and children Comparison: pure control group (standard practice, status quo, no additional financing) Intervention: any type of PBF Settings: Democratic Republic of the Congo, India, Zambia, Zimbabwe | ||||
| Outcome | Impact summary | Number of studies | Certainty of the evidence | Comments |
| Child mortality (% of children alive still from mothers giving birth in study period) | P4P probably has a desirable effect, achieving a reduction of approximately 1%. | 1 (Huillery 2017) | Moderatea | RCT. |
| Neonatal mortality rate | P4P probably has little to no effect: small reduction in neonatal mortality 0.07%; however, model with controls suggest possible increase 0.3%. | 1 (Mohanan 2017) | Moderatea | RCT. |
| Incidence of sickness | P4P may have desirable effects: consistent reduction in incidence of sickness, ranging from –4% to –29% on average. | 2 (Friedman 2016a; Friedman 2016b) | Lowb | Sensitivity analysis: RCT estimates 4% reduction, low‐certainty evidence. (risk of bias criteria, 1 study only). |
| Summary | Moderate‐certainty evidence suggestive of reductions in child mortality, and low certainty in reduction of incidence of sickness. | |||
P4P: paying for performance; PBF: performance‐based funding; RCT: randomized controlled trial. aNo serious concerns, one study only. bSerious concerns over three risk of bias criteria.
Table 25. Reproductive maternal and child health outcomes
| Health outcomes: RMNCH outcomes | ||||
|
Patient group: mothers and children Comparison: pure control group (standard practice, status quo, no additional financing) Intervention: any type of PBF Settings: Cameroon, Democratic Republic of the Congo, Philippines | ||||
| Outcome | Impact summary | Number of studies | Certainty of the evidence | Comments |
| Child wasting (%) | P4P probably has a desirable effect, signalling a reduction in wasting from 5.9% to 9.25%. | 2 (de Walque 2017; Peabody 2014) | Moderatea | Sensitivity analysis: RCT estimated a 9.25% increase in likelihood of children not wasting; low‐certainty evidence (1 study only, risk of bias significant concerns around this outcome). |
| Incidence of pregnancy (%) | P4P probably has little to no effect: small reduction (1%) in pregnancies. | 1 (Huillery 2017) | Moderateb | RCT. |
| Reported anaemia in children (%) | P4P probably has a desirable effect, about 5% reduction in anaemic children. | 1 (Peabody 2014) | Moderateb | RCT. |
| Summary | Moderate‐certainty evidence suggestive of desirable effects on health outcomes, despite not being targeted. | |||
P4P: paying for performance; PBF: performance‐based funding; RCT: randomized controlled trial; RMNCH: reproductive, maternal, newborn and child health. aCritical concerns over one risk of bias criterion. bNo serious concerns, one study only.
1.6. Changes in untargeted measures of provider performance
1.6.1. Untargeted utilization and delivery
Table 26. Utilization and delivery of HIV‐AIDS, malaria and tuberculous services
| Utilization and delivery: HIV‐AIDS, malaria and TB | ||||
|
Patient group: households and patients exposed to HIV/TB/malaria and seeking care at health facilities Comparison: pure control group (standard practice, status quo, no additional financing) Intervention: any type of PBF Settings: Cameroon, Malawi | ||||
| Outcome | Impact summary | Number of studies | Certainty of the evidence | Comments |
| Provision of HIV testing (%) | P4P may have desirable effects, ranging from long term (–2 to 15%), though consistently positive at hospital levels in the range of 12–15%. | 1 (McMahon 2016) | Lowa | Indicators assessed at different time points and different health facility types. No RCT reported this outcome for this comparison. |
| Bednet use (% children and households) | P4P probably has little to no impact on the outcome, effect estimated at 0.12%. |
1 (de Walque 2017) | Moderateb | Indicator concerns children sleeping under a bednet. No RCT reported this outcome for this comparison. |
| Summary | Limited influence on bednet use; however, may have desirable effects on provision of HIV testing. | |||
P4P: paying for performance; PBF: performance‐based funding; RCT: randomized controlled trial. aNon‐critical limitations for one or more criteria in risk of bias, one study only. bNo substantive concerns, one study only.
Table 27. Untargeted delivery of services (generic)
| Utilization and delivery: general | ||||
|
Patient group: overall patients utilizing clinics Comparison: pure control group (standard practice, status quo, no additional financing) Intervention: any type of PBF Settings: Cambodia, China, Democratic Republic of the Congo, El‐Salvador, Haiti, Tanzania | ||||
| Outcome | Impact summary | Number of studies | Certainty of the evidence | Comments |
| Probability of any utilization (%) | P4P may have little to no effect, impacts inconsistent across studies, ranging from –6 to 2.4% overall. | 2 (Huillery 2017; Powell‐Jackson 2014) | Lowa | Sensitivity analysis: RCT estimate is –6%; moderate‐certainty evidence (1 study only, no further concerns). |
| Frequency of curative utilization (%) | Effects of the intervention are uncertain: decrease overall (range 2%) and in women aged 15–49 years (0.2%); non‐significant increase in children aged < 5 years (0.06%). | 1 (Bernal 2018) | Verylowb | No RCT reported this outcome for this comparison. |
| Frequency of outpatient utilization (%) | P4P may have little to no effect, range –4% to 6.7% overall, but likely small effects over longer time periods. | 4 (Bernal 2018; Binyaruka 2015; Khim 2018a; Yip 2014) | Lowc | Differences exist in indicator specification – e.g. visits per day/month. Sensitivity analysis: RCT evaluation suggested negative effects, reduction in absolute number of patients per day range of 1%; moderate‐certainty evidence (1 study only, no further concerns). |
| Frequency – all visits (number of visits) | P4P may have little to no effect, 2.7% increase in consultations for non‐incentivized services noted. | 1 (Zeng 2013) | Lowc | No RCT reported this outcome for this comparison. |
| Frequency – elderly visits (number of visits) | P4P may have little to no effect, increases in visits in range of 2.8–5.7%. | 2 (Bernal 2018; Zeng 2013) | Lowc | No RCT reported this outcome for this comparison. |
| Summary | If not targeted, impacts as to be expected, P4P may have little to no effect. | |||
P4P: paying for performance; PBF: performance‐based funding; RCT: randomized controlled trial. aConcerns over lack of comparability between indicators and risk of bias criteria. bConcerns over risk of bias criteria and potential for imprecision, one study only. cConcerns over risk of bias criteria.
Table 28. Untargeted delivery of reproductive maternal and child health
| Utilization and delivery: RMNCH – family planning | ||||
|
Patient group: women of reproductive age (15–49 years) in study districts Comparison: pure control group (standard practice, status quo, no additional financing) Intervention: any type of PBF Settings: Afghanistan, Zambia | ||||
| Outcome | Impact summary | Number of studies | Certainty of the evidence | Comments |
| Family planning (% women utilizing modern methods) | P4P probably has little to no effect on the outcome. Negative effect, estimated at –0.1%. | 1 (Engineer 2016) | Moderatea | RCT. |
| Family planning (% services delivered) | P4P may have desirable effects, noted a 9.7% increase in the range of services delivered. | 1 (Friedman 2016a) | Lowb | RCT. |
| Summary | Non‐targeted effects largely consistent with effects noted as when targeted. | |||
P4P: paying for performance; PBF: performance‐based funding; RCT: randomized controlled trial; RMNCH: reproductive, maternal, newborn and child health. aNo serious limitations, one study only. bLimitations in risk of bias, one study only.
Table 29. Untargeted utilization and delivery of antenatal care
| Utilization and delivery: RMNCH – aNC | ||||
|
Patient group: pregnant women enrolled in study within specified time frames Comparison: pure control group (standard practice, status quo, no additional financing) Intervention: any type of PBF Settings: Burundi, Cameroon, India, Tanzania, Zambia | ||||
| Outcome | Impact summary | Number of studies | Certainty of the evidence | Comments |
| Antenatal care (utilization rate) | P4P may make little to no difference to the outcome: small, but not significant, reduction in P4P group compared to control (under 5%). | 1 (Mohanan 2017) | Lowa | RCT. |
| ≥ 1 ANC (utilization rates) | Effects of the intervention are uncertain: positive impact, estimated at 3.4%. | 1 (Binyaruka 2015) | Verylowb | No RCT reported this outcome for this comparison. |
| ≥ 2 ANC (utilization rates) | Effects of the intervention are uncertain: both substantial level and trend increases and decreases noted across different districts. | 1 (Khim 2018a) | Verylowb | Authors attributed changes more to increased financing availability throughout country. No RCT reported this outcome for this comparison. |
| ≥ 4 ANC (utilization rates) | Effects of the intervention are uncertain: effect estimated at 6%. | 1 (Binyaruka 2015) | Verylowb | No RCT reported this outcome for this comparison. |
| Women accessing care in first trimester (% women receiving) | P4P may have desirable effects, ranging between 1.4% and 12%. | 2 (Bonfrer 2014b; Friedman 2016a) | Lowc | Sensitivity analysis: RCT estimate at 12% reduction in time of first ANC visit; GRADE at 2 (concerns over 2 risk of bias criteria, 1 study only). |
| Summary | Overall largely uncertain effects, however timeliness of ANC care‐seeking may be positively affected. | |||
P4P: paying for performance; PBF: performance‐based funding; RCT: randomized controlled trial; RMNCH: reproductive, maternal, newborn and child health. aConcerns over risk of bias, one study only. bCritical concerns over more than two criteria, one study only. cCritical concerns over more than two criteria.
Table 30. Untargeted delivery of institutional deliveries
| Utilization and delivery: RMNCH – institutional deliveries | ||||
|
Patient group: women giving birth in study periods Comparison: pure control group (standard practice, status quo, no additional financing) Intervention: any type of PBF Settings: India, Rwanda | ||||
| Outcome | Impact summary | Number of studies | Certainty of the evidence | Comments |
| Institutional delivery utilization or coverage rates | P4P may make little to no difference to the outcome of interest, impact (–2%) overall. | 1 (Mohanan 2017) | Lowa | RCT. |
| Institutional delivery: caesarean section (%) | Effects of the intervention are uncertain; utilization of caesarean sections decreased by 21%. | 1 (Gertler 2014) | Verylowb | No RCT reported this outcome for this comparison. |
| Summary | Very low‐certainty evidence on the impacts on institutional delivery utilization (consistent with when outcome was targeted), utilization of caesarean sections noted to be decreasing from a mean of 26% to 5%, though unclear if impacts positive. | |||
P4P: paying for performance; PBF: performance‐based funding; RCT: randomized controlled trial; RMNCH: reproductive, maternal, newborn and child health. aMinor risk of bias concerns across two or more criteria, one study. bSerious concerns over two or more criteria, one study only.
Table 31. Untargeted delivery of postnatal care
| Utilization and delivery: RMNCH – postnatal care | ||||
|
Patient group: women who have given birth in enrolled facilities Comparison: pure control group (standard practice, status quo, no additional financing) Intervention: any type of PBF Settings: Burundi, Cameroon, Democratic Republic of the Congo, El‐Salvador, India, Tanzania | ||||
| Outcome | Impact summary | Number of studies | Certainty of the evidence | Comments |
| Delivery and coverage of postnatal care | P4P may have desirable effects, ranging from 7.2 to 85%. | 3 (de Walque 2017; Falisse 2015; Zeng 2018) | Lowa | No RCT reported this outcome for this comparison. |
| Postnatal care (overall utilization rate) | P4P probably has undesirable effects, ranging from –8.9 to –0.02%. | 3 (de Walque 2017; Huillery 2017; Mohanan 2017) | Moderateb | Sensitivity analysis: 2 RCTs estimate impact ranging from –2% to –1.4%; moderate‐certainty evidence (some concerns over risk of bias). |
| Postnatal care: timely access (% women receiving) | P4P may have desirable effects, ranging from –5.8 to 49.45%. | 2 (Bernal 2018; Binyaruka 2015) | Lowc | No RCT reported this outcome for this comparison. |
| Summary | Inconsistent effects noted across this area; moderate‐certainty evidence. | |||
P4P: paying for performance; PBF: performance‐based funding; RCT: randomized controlled trial; RMNCH: reproductive, maternal, newborn and child health. aConcerns over more than two criteria in risk of bias and imprecision, two of three studies non‐RCT, upgraded due to large effect. bDowngraded for indirectness. cConcerns over risk of bias and indirectness.
Table 32. Untargeted delivery of childcare
| Utilization and delivery: childcare | ||||
|
Patient group: households with children in study catchment areas Comparison: pure control group (standard practice, status quo, no additional financing) Intervention: any type of PBF Settings: Tanzania | ||||
| Outcome | Impact summary | Number of studies | Certainty of the evidence | Comments |
| Utilization rate of consultations in children | Effects of the intervention are uncertain: Impacts on child consultations (aged < 5 years) –18.4% in Tanzania. | 1 (Binyaruka 2015) | Verylowa | No RCT reported this outcome for this comparison. |
| Summary | Negative impacts on overall utilization of child consultations, suggesting outcome must be targeted to achieve impacts; very low‐certainty evidence. | |||
PBF: performance‐based funding; RCT: randomized controlled trial. aSerious concerns over two or more risk of bias criteria, one study only.
1.6.2. Untargeted quality of care
Table 33. Adherence to procedures and guidelines and adverse drug reaction management
| Quality of care: adherence to procedures and guidelines and adverse drug reaction management | ||||
|
Patient group: predominantly mothers and children seeking care or living in the districts where assessments occurred Comparison: pure control group (standard practice, status quo, no additional financing) Intervention: any type of PBF Settings: Democratic Republic of the Congo | ||||
| Outcome | Impact summary | Number of studies | Certainty of the evidence | Comments |
| Correct patient management by healthcare providers (scores in relation to ANC, childcare and PNC) | P4P probably makes little to no difference to the outcome, effects ranging from –1% to 4% on items assessing compliance with desired postnatal care procedures. | 1 (Huillery 2017) | Moderatea | RCT |
| Prescription quality of care: women receiving medication via prescription in case of illness (%) | P4P may have desirable effects, ranging from –8 to 20%. | 2 (Huillery 2017; Zeng 2018) | Lowb | Sensitivity analysis: RCT suggested negative effect (–8%), moderate‐certainty evidence (1 study only). |
| Summary | Probably little to no effect on correct patient management, may have desirable effects on prescription quality of care. | |||
ANC: antenatal care; PBF: performance‐based funding; PNC: postnatal care; RCT: randomized controlled trial. aNo serious concerns, one study only. bConcerns over risk of bias.
Table 34. Human resource inputs
| Quality of care: human resource inputs | ||||
|
Patient group: predominantly patients using RMCH and curative care services at targeted health facilities Comparison: pure control group (standard practice, status quo, no additional financing) Intervention: any type of PBF Settings: Benin | ||||
| Outcome | Impact summary | Number of studies | Certainty of the evidence | Comments |
| Staff knowledge and skills (score) | P4P may have little to no effect: positive on clinical knowledge of staff but unclear if clinically relevant (2.3% increase in vignette test scores). | 1 (Lagarde 2015) | Lowa | No RCT reported this outcome for this comparison. |
| Summary | Effects on staff knowledge consistent with when outcomes were targeted, but limited certainty. | |||
PBF: performance‐based funding; RCT: randomized controlled trial; RMCH: reproductive, maternal and child health. aSerious concerns over risk of bias.
Table 35. Patient outcomes and perceptions
| Quality of care: patient outcomes and perceptions | ||||
|
Patient group: predominantly pregnant women Comparison: pure control group (standard practice, status quo, no additional financing) Intervention: any type of PBF Settings: Democratic Republic of the Congo | ||||
| Outcome | Impact summary | Number of studies | Certainty of the evidence | Comments |
| Patient knowledge (scores) | P4P probably has little to no effect on patient knowledge scores: impacts ranging from –5% to 2% in regard to indicators on patient knowledge of diagnosis, danger signs and medication adherence. | 1 (Huillery 2017) | Moderatea | RCT. |
| Summary | Consistent with impacts on the targeted outcomes. | |||
PBF: performance‐based funding; RCT: randomized controlled trial. aNo serious concerns, one study only.
Table 36. Contact and waiting time
| Quality of care: contact and waiting time | ||||
|
Patient group: predominantly women and children using RMCH services at facilities Comparison: pure control group (standard practice, status quo, no additional financing) Intervention: any type of PBF Settings: China, Democratic Republic of the Congo, Tanzania | ||||
| Outcome | Impact summary | Number of studies | Certainty of the evidence | Comments |
| Contact time (% change) | P4P may have little to no effect on the outcome: effects ranging from –2.2% to 1.79%. | 2 (Binyaruka 2015; Huillery 2017) | Lowa | Sensitivity analysis: RCT suggested positive effects only, ranging from 1.03 to 2.55; moderate‐certainty evidence (no serious concerns, 1 study only). |
| Waiting time (% change) | Effects of the intervention are uncertain: 20% reduction in waiting time of untargeted services. | 1 (Binyaruka 2015) | Verylowb | No RCT reported this outcome for this comparison. |
| Length of stay (% change) | P4P may have undesirable effects, extending length of stay relatively by 0.05–16% (depending on insurance status of population). | 2 (Huillery 2017; Wu 2014) | Lowc | Sensitivity analysis: RCT estimates 5% increase in length of stay; low‐certainty evidence (no serious concerns, but likely imprecision and 1 study only). |
| Summary | Similarly inconsistent effects on contact times as when indicators were targeted; however, suggestive of positive effects on waiting time (i.e. waiting time was reduced) and negative effects on length of stay (i.e. this increases). | |||
P4P: paying for performance; PBF: performance‐based funding; RCT: randomized controlled trial; RMCH: reproductive, maternal and child health. aSerious concerns over risk of bias and indirectness. bSerious concerns over risk of bias criteria, one study only. cSome concerns over several risk of bias criteria.
Table 37. Composite quality of care scores
| Quality of care: quality composite scores | ||||
|
Patient group: mixed groups – varies according to study and scheme Comparison: pure control group (standard practice, status quo, no additional financing) Intervention: any type of PBF Settings: Burundi, Democratic Republic of the Congo | ||||
| Outcome | Impact summary | Number of studies | Certainty of the evidence | Comments |
| Overall composite quality of care score | P4P probably has undesirable effects, estimated at 52%. | 1 (Huillery 2017) | Moderatea | RCT. |
| Quality maternity care (score) | Effects of the intervention are uncertain: 45.6% increase in score, statistically significant. | 1 (Rudasingwa 2014) | Verylowb | No RCT reported this outcome for this comparison. |
| Quality of outpatient services (score) | Effects of the intervention are uncertain: impact indicated at 38%. | 1 (Rudasingwa 2014) | Verylowb | No RCT reported this outcome for this comparison. |
| Quality of medicine and equipment (score) | Effects of the intervention are uncertain: ranging from –14% (material management) to 8.8% (laboratory care) impacts on scores. | 1 (Rudasingwa 2014) | Verylowb | No RCT reported this outcome for this comparison. |
| Summary | Overall, composite score was negative, suggesting quality must be targeted to achieve impacts. Other effects are uncertain. | |||
P4P: paying for performance; PBF: performance‐based funding; RCT: randomized controlled trial. aConcerns over imprecision of estimate, one study only; however, magnitude high so upgraded. bSerious concerns over risk of bias and generalizability, one study only.
1.7. Unintended effects
Table 38. Unintended effects
| Unintended effects | ||||
|
Patient group: differed by study Comparison: pure control group (standard practice, status quo, no additional financing) Intervention: any type of PBF Settings: China, Democratic Republic of the Congo | ||||
| Outcome | Impact summary | Number of studies | Certainty of the evidence | Comments |
| Overall impacts on free riding and task shifting | P4P may make little to no difference to the outcome: no effects or differences noted between PBF groups and control. | 2 (Huillery 2017; Yip 2014) | Lowa | Both were RCTs in different populations: women and children vs all patients requiring antibiotic‐based care. |
| Summary | Certain that no unintended effects such as free‐riding or task‐shifting occurred; consistent with findings when targeted. | |||
P4P: paying for performance; PBF: performance‐based funding; RCT: randomized controlled trial. aConcerns over imprecision and limited comparability of indicators.
1.8. Untargeted resource use
Table 39. Human resources
| Changes in resource use: human resources | ||||
|
Patient group: schemes targeting maternal and child health Comparison: pure control group (standard practice, status quo, no additional financing) Intervention: any type of PBF Settings: Benin | ||||
| Outcome | Impact summary | Number of studies | Certainty of the evidence | Comments |
| Human resource availability (people available) | Effects of the intervention are uncertain: no increase in number of qualified staff available per facility was noted. | 1 (Lagarde 2015) | Verylowa | No RCT reported this outcome for this comparison. |
| Curative health visits per healthcare professional | Effects of the intervention are uncertain: estimated increase of 52%. | 1 (Lagarde 2015) | Verylowb | No RCT reported this outcome for this comparison. |
| Summary | Effects of the intervention are uncertain. | |||
P4P: paying for performance; PBF: performance‐based funding; RCT: randomized controlled trial. aSerious limitations for risk of bias, one study only. bSerious limitations for risk of bias and imprecision.
Table 40. Medicine and equipment availability and functionality
| Changes in resource use: medicine and equipment | ||||
|
Patient group: predominantly across RMNCH schemes Comparison: pure control group (standard practice, status quo, no additional financing) Intervention: any type of PBF Settings: Benin, Democratic Republic of the Congo, Tanzania | ||||
| Outcome | Impact summary | Number of studies | Certainty of the evidence | Comments |
| Equipment availability (index) | Effects of the intervention are uncertain: ranging from –6.4% to 6.9%. | 3 (Binyaruka 2017; Huillery 2017; Lagarde 2015) | Verylowa | Sensitivity analysis: RCT suggested –64%; low‐certainty evidence (some concerns over risk of bias and imprecision, 1 study only). |
| Equipment functionality (index) | Effects of the intervention are uncertain: small (3%) positive effect. | 1 (Mayumana 2017) | Verylowa | No RCT reported this outcome for this comparison. |
| Infrastructure functionality (index) | P4P may have little to no effect: small increase in infrastructure functionality (magnitude not interpretable), but authors noted no relevant difference to control. | 1 (Huillery 2017) | Lowb | RCT. |
| Medicine availability (index) | P4P may have desirable effects: ranging from 0.6% to 13.8% increases in comparison to control. | 2 (Lagarde 2015, Binyaruka 2017) | Lowa | No RCT reported this outcome for this comparison. |
| Vaccine availability (%) | Effects of the intervention are uncertain: estimated at 5.6%. | 1 (Binyaruka 2017) | Verylowa | No RCT reported this outcome for this comparison. |
| Stockout equipment | Effects of the intervention are uncertain: positive effect in reducing stockouts (15%). | 1 (Mayumana 2017) | Verylowa | No RCT reported this outcome for this comparison. |
| Stockout medicines | Effects of the intervention are uncertain: positive effect in reducing stockouts (16–30%). | 2 (Mayumana 2017, Binyaruka 2017) | Verylowa | No RCT reported this outcome for this comparison. |
| Stockout vaccines | P4P may have desirable effects: reducing stockouts (10–60%). | 2 (Mayumana 2017, Binyaruka 2017) | Lowc | No RCT reported this outcome for this comparison. |
| Summary | Evidence largely consistent with when indicators were targeted, though smaller magnitude and overall weaker evidence base. | |||
P4P: paying for performance; PBF: performance‐based funding; RCT: randomized controlled trial; RMNCH: reproductive, maternal, newborn and child health. aSerious concerns over risk of bias and imprecision. bConcerns over imprecision, one study only. cSerious concerns over risk of bias and imprecision, upgrade for effect.
1.9. Untargeted secondary outcomes
Table 41. Provider motivation, satisfaction, absenteeism and acceptability
| Provider motivation, satisfaction, absenteeism and acceptability | ||||
|
Participants: healthcare workers at the facilities where studies conducted Comparison: pure control group (standard practice, status quo, no additional financing) Intervention: any type of PBF Settings: Benin, Cameroon, Democratic Republic of the Congo, Zambia, Zimbabwe | ||||
| Outcome | Impact summary | Number of studies | Certainty of the evidence | Comments |
| Provider attendance (%) | P4P probably has a desirable effect, estimated at 7%, though similar to control sites. | 1 (Huillery 2017) | Moderatea | RCT. |
| Provider motivation (score) | P4P may have a desirable effect, estimated at 0.7% to 8%; however, noted to be largely similar to controls across studies. | 4 (Friedman 2016a; Huillery 2017; Lagarde 2015; Shen 2017) | Lowb | Sensitivity analysis: RCT estimated range between 1% and 6.9%; low‐certainty evidence (concerns over risk of bias). |
| Provider satisfaction (score) | Effects are uncertain ranging from –81% to 31%. | 7 (de Walque 2017; Friedman 2016a; Friedman 2016b; Huillery 2017; Lagarde 2015; Shen 2017) | Lowb | Sensitivity analysis: 2 RCT estimates were inconsistent overall, ranging from –81% to 5%; low‐certainty evidence (concerns over risk of bias and imprecision). |
| Summary | If not targeted, provider attendance appears to increase. | |||
P4P: paying for performance; PBF: performance‐based funding; RCT: randomized controlled trial. aNo serious concerns, one study only. bSerious concerns over risk of bias and indirectness.
Table 42. Patient satisfaction and acceptability (satisfaction scores)
| Patient satisfaction and acceptability (satisfaction scores) | ||||
|
Patient group: patients who had accessed ANC, child or curative care at study facilities Comparison: pure control group (standard practice, status quo, no additional financing) Intervention: any type of PBF Settings: Cameroon, Democratic Republic of the Congo, Zambia, Zimbabwe | ||||
| Outcome | Impact summary | Number of studies | Certainty of the evidence | Comments |
| Patient satisfaction with facility cleanliness (scores) | Effects of the intervention are uncertain: impacts on satisfaction scores ranging from –21.9% to 12.5%. | 3 (Friedman 2016a; Friedman 2016b; Zeng 2018) | Lowa | Sensitivity analysis: RCT estimate –22%; low‐certainty evidence (1 study, risk of bias concerns). |
| Patient satisfaction with contact time (score) | P4P may have undesirable effects: impacts on satisfaction relating to the time healthcare workers spent on ANC consults, ranging from –5% to 0.3%; for childcare consults ranging from –11.3% to 4.7%. | 2 (Friedman 2016a; Friedman 2016b) | Lowa | Sensitivity analysis: RCT estimate 1.2%; low‐certainty evidence (1 study, risk of bias concerns). |
| Patient satisfaction with opening hours (score) | P4P may have undesirable effects: impacts on satisfaction scores associated with facility opening hours for ANC care ranging from –11% to 9%; for childcare ranging from –19.3% to 1.2%. | 2 (Friedman 2016a; Friedman 2016b) | Lowa | Sensitivity analysis: RCT estimate –15%; low‐certainty evidence (1 study, risk of bias concerns). |
| Patient satisfaction with waiting time (score) | Effects of the intervention are uncertain: impacts on the acceptability of waiting times for ANC appointments are consistently positive and higher in the PBF group, ranging from 10.5% to 21.8%; for child health consultations they ranged from –8.3% to 11.6%. | 3 (de Walque 2017; Friedman 2016a; Friedman 2016b) | Lowa | Sensitivity analysis: RCT estimate 1.9%; low‐certainty evidence (1 study, risk of bias concerns). |
| Overall patient satisfaction with quality of care (score) | P4P may have desirable effects in relation to patients' satisfaction with quality of care, ranging from 0% to 7.4%. | 2 (Huillery 2017; Zeng 2018) | Lowb | Sensitivity analysis: RCT estimate –1%, low‐certainty evidence (concerns over indirectness and precision, 1 study only). |
| Overall patient satisfaction with welcome and reception at facility (score) | P4P may have desirable effects ranging from –3% to 11.7% satisfaction with welcome quality at health facilities. | 2 (Huillery 2017; Zeng 2018) | Lowb | Sensitivity analysis: RCT estimates –3% or 0; low‐certainty evidence (concerns over indirectness and precision, 1 study only). |
| Patient satisfaction with staff: communication (score) | P4P may have desirable effects, ranging from –2.2% to 7.45% on average in relation to communication satisfaction for ANC; largely positive for childcare, ranging from 1.85% to 7.1% on average. | 3 (de Walque 2017; Friedman 2016a; Friedman 2016b) | Lowa | Sensitivity analysis: RCT estimate 2.45%; low‐certainty evidence (1 study, risk of bias concerns). |
| Patient satisfaction with staff: trust (score) | P4P may have desirable effects, ranging from –0.25% to 23.75% on average for scores reflecting trust in the skills of healthcare providers. | 2 (Friedman 2016a; Friedman 2016b) | Lowa | Sensitivity analysis: RCT estimate 24%; low‐certainty evidence (1 study, risk of bias concerns). |
| Overall satisfaction (score) | P4P probably has desirable effects: impacts on overall patient satisfaction scores ranging from 1% to 88.5% on average across ANC and child health care. | 4 (de Walque 2017; Friedman 2016a; Friedman 2016b; Huillery 2017) | Moderatec | Sensitivity analysis: 2 RCTs estimates between 1% and 88%; low‐certainty evidence (risk of bias concerns). |
| Summary | When indicators not targeted, very inconsistent impacts across most indicators in area. Low‐certainty evidence overall. | |||
ANC: antenatal care; P4P: paying for performance; PBF: performance‐based funding; RCT: randomized controlled trial. aConcerns over risk of bias criteria. bSerious concerns over risk of bias. cSome concerns over risk of bias and large effect.
Table 43. Impacts on overall financing or resource allocation
| Impacts on overall financing or resource allocation | ||||
|
Patient group: households accessing care (except for remuneration, for which healthcare workers were reporting) Comparison: pure control group (standard practice, status quo, no additional financing) Intervention: any type of PBF Settings: Benin, Cameroon, Tanzania, Zimbabwe | ||||
| Outcome | Impact summary | Number of studies | Certainty of the evidence | Comments |
| Out of pocket payments – user fees | P4P may have undesirable effects: impacts on user fees for consultations ranging from –15% to 63%; most impacts were negative (i.e. user fees increased). | 4 (Binyaruka 2015; de Walque 2017; Friedman 2016b; Lagarde 2015) | Lowa | No RCT reported this outcome for this comparison. |
| Expenditure on medicine and equipment | P4P probably has little to no effect on the outcome: impacts on drug expenditure at township health centres and health centres ranging from –2.1% to –4.7%. | 1 (Yip 2014) | Moderateb | RCT. |
| Probability of payment for users | Effects of the intervention are uncertain. Probability of paying for antenatal care decreased, ranging from 15.28% to 33.3%; effect on delivery payments were inconsistent though likely largely positive, reported to range between 30.3% reduction and 1.5% increase in probability of payment. Probability of payment for postnatal care appeared to have increased consistently ranging from 35% to 61%. | 2 (Binyaruka 2015; Friedman 2016b) | Lowa | No RCT reported this outcome for this comparison. |
| Summary | Inconsistent impacts on user fees and expenditures on medicine and equipment, suggesting these need to be targeted to be influenced; probability of payments for users decreased for some services on outpatient basis but not for postnatal care, which may require inpatient care. | |||
P4P: paying for performance; PBF: performance‐based funding; RCT: randomized controlled trial. aConcerns over risk of bias criteria. bNo serious concerns, one study only.
Table 44. Impacts on management or information systems
| Impacts on management or information systems | ||||
|
Patient group: healthcare workers and management staff in PBF and control facilities Comparison: pure control group (standard practice, status quo, no additional financing) Intervention: any type of PBF Settings: Benin, Cameroon, Tanzania, Zambia, Zimbabwe | ||||
| Outcome | Impact summary | Number of studies | Certainty of the evidence | Comments |
| Facility or managerial autonomy (score) | P4P may have desirable effects, ranging from 144% to 188% overall. | 2 (Lagarde 2015; Friedman 2016b) | Lowa | No RCT reported this outcome for this comparison. |
| Facility governance (score) | P4P may have undesirable effects, in relation to the number of governance meetings held at facility in last 90 days, ranging from –10.2% to –5.5%. | 2 (Friedman 2016a; Friedman 2016b; Mayumana 2017) | Lowb | Sensitivity analysis: RCT estimates –10.2%; low certainty evidence (1 study only, risk of bias concerns). |
| Quality of management (score) | P4P may have undesirable effects, staff rating of management quality in facility was negatively impacted (–15%). | 1 (de Walque 2017) | Lowc | No RCT reported this outcome for this comparison. |
| Summary | Overall effects on autonomy are sustained as when indicator is targeted, governance is not responsive; however quality of management is negatively affected. | |||
P4P: paying for performance; PBF: performance‐based funding; RCT: randomized controlled trial. aDowngraded for risk of bias, imprecision, upgraded for large effects. bDowngraded for risk of bias and imprecision. cDowngraded for imprecision, one study only.
Table 45. Equity‐consideration: evidence of differential impact on different parts of the population
| Equity‐consideration: evidence of differential impact on different parts of the population | ||||
|
Patient group: same as for main utilization outcomes; primarily mothers and children in PBF and control districts Comparison: pure control group (standard practice, status quo, no additional financing) Intervention: any type of PBF Settings: Afghanistan, Tanzania | ||||
| Outcome | Impact summary | Number of studies | Certainty of the evidence | Comments |
| Equity of child immunization delivery (wealth related) | Effects of the intervention are uncertain: effects towards poorest, approximately 0.4% in comparison to less poor. | 1 (Binyaruka 2015) | Verylowa | No RCT reported this outcome for this comparison. |
| Equity in institutional delivery (wealth related) | P4P may have undesirable effects: studies suggested increased inequality among patients among PBF facilities; impacts on patients were higher in mid‐wealth quintiles. | 2 (Engineer 2016, Binyaruka 2015) | Lowb | Sensitivity analysis: RCT estimate also supported that wealthier women were likelier to receive institutional deliveries; moderate‐certainty evidence (1 study only, no substantial concerns). |
| Equity in institutional delivery (by educational status of mother) | Effects of the intervention are uncertain: more institutional deliveries recorded among mothers with basic education rather than none/illiterate (effect estimated 3%). | 1 (Binyaruka 2018b) | Verylowa | No RCT reported this outcome for this comparison. |
| Summary | Overall estimates supportive of effects as when targeted, except for institutional deliveries where there was a negative effect if not targeted. | |||
P4P: paying for performance; PBF: performance‐based funding; RCT: randomized controlled trial. aConcerns over risk of bias and imprecision, one study only. bConcerns over risk of bias and imprecision.
Appendix 2. Comparison 2: secondary 'Summary of findings' tables 46 to 66
2.1. Targeted health outcomes
Table 46. Reproductive maternal and child health outcomes
| Health outcomes: RMNCH outcomes | ||||
|
Patient group: pregnant women and children Comparison: comparator groups (matched financing or inputs) Intervention: any type of P4P Settings: Zambia | ||||
| Outcome | Impact summary | Number of studies | Certainty of the evidence | Comments |
| Proportion of women breastfeeding | P4P may have little to no effect, no impacts noted. | 1 (Friedman 2016a) | Lowa | RCT. |
| Summary | P4P may have no effect. | |||
P4P: paying for performance; RCT: randomized controlled trial; RMNCH: reproductive, maternal, newborn and child health. aConcerns over risk of bias criteria, one study only.
2.2. Targeted measures of provider performance
2.2.1. Utilization and delivery
Table 47. Utilization of mother and child immunization
| Utilization: mother and child immunization | ||||
|
Patient group: mother and children accessing health services Comparison: comparator groups (matched financing or inputs) Intervention: any type of P4P Settings: Cambodia, Democratic Republic of the Congo, Rwanda, Zambia | ||||
| Outcome | Impact summary | Number of studies | Certainty of the evidence | Comments |
| Child immunization (likelihood of being vaccinated) | Effects of P4P are uncertain, with impact on the likelihood of any vaccination ranging from –7.4 to 19%. | 3 (Friedman 2016a; Soeters 2011; Van de Poel 2016) | Lowa | Some indirectness observed across studies. Sensitivity analysis: RCT estimate suggested P4P may have undesirable effects (–7.4%); low‐certainty evidence (downgraded for risk of bias criteria, 1 study). |
| Child immunization: % receiving BCG | P4P may lead to little or no difference: impacts on coverage of BCG vaccination estimated at 3.1%. | 1 (Friedman 2016a) | Lowa | RCT. |
| Child immunization: % receiving DTP | P4P may lead to little or no difference: effect estimated at –1%. | 1 (Friedman 2016a) | Lowa | RCT. |
| Child immunization: % fully vaccinated | Effects of P4P are uncertain: impacts on coverage of immunization (full immunization at 12–23 months) ranging from –8.1% to 39.8%. | 3 (Basinga 2011; Friedman 2016a; Sherry 2017) | Lowa | Sensitivity analysis: P4P may have desirable effects: RCT estimates positive impact at 39.8%; low‐certainty evidence (risk of bias criteria, 1 study). |
| Immunization during ANC – % receiving tetanus injection | P4P may have desirable effects on immunization rates: effect estimated at 6.84%. | 1 (Sherry 2017) | Lowb | No RCT reported this outcome for this comparison. |
| Summary | Overall inconsistent effects across this area, limited certainty in estimates. | |||
ANC: antenatal care; BCG: Bacillus Calmette–Guérin; DTP: diphtheria‐tetanus‐pertussis; P4P: paying for performance; RCT: randomized controlled trial. aConcerns over risk of bias criteria. bSome concerns over risk of bias and other concurrent campaigns, one study only.
Table 48. Utilization of family planning
| Utilization of family planning | ||||
|
Patient group: women and households enrolled in studies Comparison: comparator groups (matched financing or inputs) Intervention: any type of P4P Settings: Democratic Republic of the Congo, Rwanda, Zambia | ||||
| Outcome | Impact summary | Number of studies | Certainty of the evidence | Comments |
| Family planning: % using any method | P4P may make little or no difference, effects on the current use of contraceptives among households in study (recent birth households or otherwise) estimated between –4.28% and 2.8%. | 2 (Friedman 2016a; Shapira 2017) | Lowa | RCTs. |
| Family planning: % using modern methods | P4P may have little to no effect on utilization of modern family planning methods. | 3 (Priedeman Skiles 2013; Sherry 2017; Soeters 2011) | Lowb | No RCT reported this outcome for this comparison. |
| Summary | Inconsistent effects overall on family planning; however, consistent positive effects on utilization of modern family planning. | |||
P4P: paying for performance; RCT: randomized controlled trial. aSome concerns over risk of bias criteria. bSome concerns over multiple risk of bias criteria.
Table 49. Utilization of antenatal care
| Utilization of ANC | ||||
|
Patient group: pregnant women seeking ANC in enrolled facilities. Comparison: comparator groups (matched financing or inputs) Intervention: any type of P4P Settings: Argentina, Cambodia, Rwanda, Zambia | ||||
| Outcome | Impact summary | Number of studies | Certainty of the evidence | Comments |
| ANC: % receiving at ≥ 1 ANC | P4P may have little to no effect on the outcome: likelihood of any ANC being utilized among populations in the sites ranging from –1.5% to 3.2%. | 3 (Basinga 2011; Friedman 2016a; Van de Poel 2016) | Lowa | Sensitivity analysis: RCT estimate –1.5%; low‐certainty evidence (risk of bias criteria, 1 study only). |
| ANC: % ≥ 4 ANC | P4P may have little to no effect on the outcome: the use of ≥ 4 ANC visits by women in the study sites ranging from –5.3% to 4.4%. | 5 (Basinga 2011; Friedman 2016a; Priedeman Skiles 2013; Shapira 2017; Sherry 2017) | Lowb | Sensitivity analysis: RCT estimate –0.6%; low‐certainty evidence (risk of bias criteria, 1 study only). |
| ANC: % receiving ANC in first trimester | P4P may have desirable effects: likelihood of ANC utilization being in the first trimester increases in PBF facilities by 1.3% to 10%; studies noted that results‐based financing facilities saw women initiating ANC approximately 1 month earlier compared to other facilities. | 4 (Celhay 2015; Friedman 2016a; Priedeman Skiles 2013; Shapira 2017) | Lowc | Sensitivity analysis: 2 studies, RCT estimates suggested 1.3% to 10% of women initiated care earlier, approximately by 1 month; moderate‐certainty evidence (risk of bias criteria and indirectness). |
| Summary | Potential desirable effects on timely utilization of ANC; however, little to no effect on ANC utilization overall. | |||
ANC: antenatal care; P4P: paying for performance; RCT: randomized controlled trial. aCritical concerns over risk of bias criteria. bSome concerns over risk of bias. cConcerns over risk of bias criteria.
Table 50. Utilization of institutional delivery, postnatal care and child curative care
| Utilization: institutional delivery, postnatal care and child curative care | ||||
|
Patient group: pregnant women in households in facility catchment areas and children aged < 5 years Comparison: comparator groups (matched financing or inputs) Intervention: any type of P4P Settings: Cambodia, Democratic Republic of the Congo, Rwanda, Zambia | ||||
| Outcome | Impact summary | Number of studies | Certainty of the evidence | Comments |
| Institutional deliveries (rates and coverage) | Effects of the intervention are uncertain: Inconsistent effects on facility delivery rates ranging from –8.7% to 23.2%; 1 study estimated effects on overall coverage (–4.9%, same study as aforementioned negative). | 7 (Basinga 2011; Friedman 2016a; Priedeman Skiles 2013; Shapira 2017; Sherry 2017; Soeters 2011; Van de Poel 2016) | Lowa | Overall impacts noted were largely positive, only Zambia studies suggest negative impacts, suggestive of potential publication bias. Sensitivity analysis: 2 studies, but evidence inconsistent, between –8.7% and 1.9%; low‐certainty evidence (risk of bias criteria). |
| Postnatal care (rates and coverage) | P4P may have undesirable effects: impacts on any PNC being utilized, approximately –10%. | 1 (Friedman 2016a) | Lowa | RCT. |
| Child (aged < 5 years) curative visits (rates) | P4P may have little to no effect on the outcome, ranging from –5.76% to –3.1%. | 2 (Friedman 2016a; Sherry 2017) | Lowa | Sensitivity analysis: RCT estimate –3.1%; low‐certainty evidence (risk of bias criteria, 1 study only). |
| Summary | Inconsistent effects overall in this area, low‐certainty evidence. | |||
P4P: paying for performance; RCT: randomized controlled trial. aConcerns over risk of bias criteria.
Table 51. Utilization of services (general)
| Probability of any utilization and total utilization | ||||
|
Patient group: all patients accessing health care Comparison: comparator groups (matched financing or inputs) Intervention: any type of P4P Settings: Democratic Republic of the Congo, Zambia | ||||
| Outcome | Impact summary | Number of studies | Certainty of the evidence | Comments |
| Probability of any utilization (generic) | P4P may have desirable effects, estimated to range between 1.5% and 10%; however, may differ according to type of health provider or facility visited. | 2 (Friedman 2016a; Soeters 2011) | Lowa | Sensitivity analysis: RCT estimate 1.5% overall; however ranging from –6% to 9% depending on the type of facility or healthcare worker visited; low‐certainty evidence (1 study). |
P4P: paying for performance; RCT: randomized controlled trial. aSerious concerns over risk of bias.
2.2.2. Quality of care
Table 52. Adherence to procedure and guidelines
| Quality of care: adherence to procedure and guidelines | ||||
|
Patient group: dependent on indicator. Largely those accessing RMNCH services. Additionally those accessing curative services Comparison: comparator groups (matched financing or inputs) Intervention: any type of P4P Settings: Benin, Rwanda, Zambia | ||||
| Outcome | Impact summary | Number of studies | Certainty of the evidence | Comments |
| Background and physical assessment (score) | P4P may have desirable effects: ranging from –5.93% to 10.62% overall on diverse set of measures reflective of ANC, child health and adult curative consultations. | 3 (Friedman 2016a; Lagarde 2015; Sherry 2017) | Lowa | Sensitivity analysis: RCT estimate –5.4% on average; low‐certainty evidence (risk of bias criteria, 1 study). |
| Counselling (score) | Effects are uncertain: effects ranging from –37% to 26.12% overall. | 3 (Friedman 2016a; Lagarde 2015; Sherry 2017) | Lowa | Sensitivity analysis: RCT estimate –40% on average; low‐certainty evidence (risk of bias criteria, 1 study). |
| Immunization quality (score) | P4P may have desirable effects: quality index of vaccinations increasing in PBF facilities by 3.2%; overall effects on likelihood of receiving a tetanus vaccine during ANC estimated at 7.2%. | 2 (Basinga 2011; Friedman 2016a) | Lowa | Sensitivity analysis: RCT estimate 5.2% on average; low‐certainty evidence (risk of bias criteria, 1 study). |
| Summary | Overall low‐certainty evidence, some desirable effects noted. | |||
ANC: antenatal care; P4P: paying for performance; PBF: performance‐based funding; RCT: randomized controlled trial: RMNCH: reproductive, maternal, newborn and child health. aSerious concerns over risk of bias criteria.
Table 53. Human resource knowledge and skills
| Quality of care: human resource knowledge and skills, health literacy | ||||
|
Patient group: mainly from studies focused on RMNCH Comparison: comparator groups (matched financing or inputs) Intervention: any type of P4P Settings: Democratic Republic of the Congo, Rwanda | ||||
| Outcome | Impact summary | Number of studies | Certainty of the evidence | Comments |
| Staff knowledge and skills (scores) | P4P may have desirable effects on provider knowledge (or availability of knowledgeable staff in facility), ranging from an absolute increase in knowledge scores of 0.4 standard deviations, to relative impacts on availability of skilled personnel between 0.06% and 15% change in scores. | 3 (Gertler 2013; Sherry 2017; Soeters 2011) | Lowa | No RCT reported this outcome for this comparison. |
| Knowledge outcomes (index) | P4P may have desirable effects on health literacy outcomes (though these are diverse, e.g. having heard about family planning vs HIV/AIDS) ranging from –5.4% to 10% change in scores. | 2 (Shapira 2017; Soeters 2011) | Lowb | Sensitivity analysis: RCT suggested impacts were consistently negative, ranging from –5.4% to –2.4%; moderate‐certainty evidence (data sources and 1 study). |
| Summary | Overarchingly desirable effects, low‐certainty evidence. | |||
P4P: paying for performance; RCT: randomized controlled trial: RMNCH: reproductive, maternal, newborn and child health. aSerious concerns over risk of bias criteria and imprecision. bConcerns over risk of bias criteria.
Table 54. Total quality scores
| Quality of care: total quality scores | ||||
|
Patient group: principally mothers and children Comparison: comparator groups (matched financing or inputs) Intervention: any type of P4P Settings: Democratic Republic of the Congo, Rwanda, Zambia | ||||
| Outcome | Impact summary | Number of studies | Certainty of the evidence | Comments |
| Total quality family planning (scores) | P4P may have desirable effects, ranging from 1.34% to 500% change in scores increases in quality of family planning in PBF facilities. | 2 (Friedman 2016a; Sherry 2017) | Lowa | Sensitivity analysis: RCT estimate 500%; low‐certainty evidence (risk of bias and 1 study). |
| Total quality antenatal care (scores) | P4P may have desirable effects on antenatal care scores, ranging from 3.56% to 40%. | 3 (Basinga 2011; Friedman 2016a; Sherry 2017) | Lowa | Sensitivity analysis: RCT estimate 40% increase in ANC quality of care; low‐certainty evidence (risk of bias and 1 study only). |
| Total quality composite (score) | P4P may have desirable effects, ranging from 25% to 0.13 standard deviation changes in composite scores. | 2 (Gertler 2013; Soeters 2011) | Lowa | No RCT reported this outcome for this comparison. |
| Summary | Moderate certainty in the consistently positive results across this area. | |||
P4P: paying for performance; PBF: performance‐based funding; RCT: randomized controlled trial. aSerious concerns over risk of bias.
2.3. Targeted changes in resource use
Table 55. Changes in medicine and equipment use
| Changes in resource use: medicine and equipment | ||||
|
Patient group: primarily mothers and children, and patients using other curative services Comparison: comparator groups (matched financing or inputs) Intervention: any type of P4P Settings: Zambia | ||||
| Outcome | Impact summary | Number of studies | Certainty of the evidence | Comments |
| Equipment availability (composite score) | P4P may have desirable effects, estimated at 75% increase; however, not significant in comparison to comparator. | 1 (Friedman 2016a) | Lowa | RCT. |
| Medicine availability (composite score) | P4P may have undesirable effects, estimated at –160% decrease in composite score. | 1 (Friedman 2016a) | Lowa | RCT. |
| Summary | Inconsistent effects in relation to medicines vs equipment, equipment availability appeared to be increased; that of medicine decreased. | |||
P4P: paying for performance; RCT: randomized controlled trial. aConcerns over risk of bias, imprecision, one study only but upgraded for substantive effect.
2.4. Targeted secondary outcomes
Table 56. Impacts on management or information systems
| Impacts on management or information systems | ||||
|
Patient group: healthcare workers in PBF and comparator facilities Comparison: comparator groups (matched financing or inputs) Intervention: any type of P4P Settings: Zambia | ||||
| Outcome | Impact summary | Number of studies | Certainty of the evidence | Comments |
| Facility and managerial autonomy (score) | P4P may have desirable effects: estimated impact on autonomy index about 46%. | 1 (Friedman 2016a) | Lowa | RCT. |
| Summary | Consistently positive effects on facility and managerial autonomy, though larger when targeted. | |||
P4P: paying for performance; PBF: performance‐based funding; RCT: randomized controlled trial. aConcerns over risk of bias and imprecision, one study only.
Table 57. Patient satisfaction and acceptability
| Patient satisfaction and acceptability | ||||
|
Patient group: patients attending antenatal, childcare or curative adult care in facilities Comparison: comparator groups (matched financing or inputs) Intervention: any type of P4P Settings: Benin, Democratic Republic of the Congo | ||||
| Outcome | Impact summary | Number of studies | Certainty of the evidence | Comments |
| Waiting time | Effects of the intervention are uncertain: impact about 7%. | 1 (Soeters 2011) | Very lowa | No RCT reported this outcome for this comparison. |
| Patient satisfaction with staff communication (index) | Effects of the intervention are uncertain: impacts on the satisfaction with staff politeness estimated at 0.5%. | 1 (Lagarde 2015) | Very lowa | No RCT reported this outcome for this comparison. |
| Summary | Overarchingly uncertain impacts. | |||
P4P: paying for performance; RCT: randomized controlled trial. aSerious concerns over risk of bias, one study only.
Table 58. Equity‐consideration: evidence of differential impact on different parts of the population
| Equity‐consideration: evidence of differential impact on different parts of the population | ||||
|
Patient group: women and households utilizing family planning, antenatal, delivery and childcare Comparison: comparator groups (matched financing or inputs) Intervention: any type of P4P Settings: Cambodia, Rwanda | ||||
| Outcome | Impact summary | Number of studies | Certainty of the evidence | Comments |
| Wealth related: ANC (utilization) | P4P may have little to no effect: inconsistent impacts regarding ≥ 4 ANC visits in relation to pro‐poor effects (estimated at < 10% in comparison to least poor); similar in relation to utilization of ANC in first trimester. | 2 (Lannes 2016; Priedeman Skiles 2013) | Lowa | No RCT reported this outcome for this comparison. |
| Wealth related: curative visits (utilization) | P4P may have little to no effect: utilization among lower socioeconomic groups increased between 3.5% and 10%. | 2 (Lannes 2016; Priedeman Skiles 2015) | Lowa | No RCT reported this outcome for this comparison. |
| Wealth related: family planning (utilization) | P4P may have undesirable effects, less poor and mid‐status groups appear to benefit more. | 2 (Lannes 2016; Priedeman Skiles 2015) | Lowa | No RCT reported this outcome for this comparison. |
| Wealth related: institutional delivery (utilization) | P4P may have undesirable effects: middle‐income groups (or mid‐poverty) groups benefit more than poorest. | 3 (Lannes 2016; Priedeman Skiles 2015; Van de Poel 2016) | Lowa | No RCT reported this outcome for this comparison. |
| Summary | Low certainty overall, suggestive of limited to negative effects. | |||
ANC: antenatal care; P4P: paying for performance; RCT: randomized controlled trial. aSome concern over risk of bias.
2.5. Untargeted measures of provider performance
2.5.1. Untargeted utilization and delivery
Table 59. Utilization of mother and child immunization
| Utilization: mother and child immunization | ||||
|
Patient group: mother and children accessing health services Comparison: comparator groups (matched financing or inputs) Intervention: any type of P4P Settings: Argentina | ||||
| Outcome | Impact summary | Number of studies | Certainty of the evidence | Comments |
| Cross‐price spillover effect on mothers receiving tetanus vaccination | P4P probably has little to no effect, impact estimated 2%. | 1 (Celhay 2015) | Moderatea | RCT. |
| Summary | Consistent effects with when indicator on tetanus vaccination during ANC is targeted. | |||
P4P: paying for performance; RCT: randomized controlled trial. aOne study only.
Table 60. Utilization of institutional delivery, postnatal care and child curative care
| Utilization: institutional delivery, postnatal care and child curative care | ||||
|
Patient group: pregnant women in households in facility catchment areas and children aged < 5 years Comparison: comparator groups (matched financing or inputs) Intervention: any type of P4P Settings: Rwanda | ||||
| Outcome | Impact summary | Number of studies | Certainty of the evidence | Comments |
| Postnatal care (rates and coverage) | P4P may make little to no difference to the outcome, effects on any postnatal care being utilized estimated at –0.5%. | 1 (Shapira 2017) | Lowa | RCT. |
| Summary | Consistent with when indicator targeted, negative effects on the utilization on postnatal care noted. | |||
P4P: paying for performance; RCT: randomized controlled trial. aSerious risk of bias concerns, one study only.
2.5.2. Untargeted quality of care
Table 61. Human resource inputs
| Quality of care: human resource inputs | ||||
|
Patient group: mainly from studies focused on RMNCH Comparison: comparator groups (matched financing or inputs) Intervention: any type of P4P Settings: Benin | ||||
| Outcome | Impact summary | Number of studies | Certainty of the evidence | Comments |
| Staff knowledge and skills (score) | Effects are uncertain: estimated at 5.6%. | 1 (Lagarde 2015) | Very lowa | No RCT reported this outcome for this comparison. |
| Summary | Consistent with when indicator is targeted, impacts are positive but limited certainty in estimate. | |||
P4P: paying for performance; RCT: randomized controlled trial; RMNCH: reproductive, maternal, newborn and child health. aSerious concerns over risk of bias criteria and imprecision, one study only.
2.6. Untargeted health outcomes
Table 62. Reproductive maternal and child health outcomes
| Health outcomes: RMNCH outcomes | ||||
|
Patient group: women with pregnancies in study periods Comparison: comparator groups (matched financing or inputs) Intervention: any type of P4P Settings: Rwanda, Zambia | ||||
| Outcome | Impact summary | Number of studies | Certainty of the evidence | Comments |
| Proportion of women breastfeeding | P4P may have little to no effect, impact estimated at 0.29%. | 1 (Sherry 2017) | Lowa | RCT. |
| Reported illness in children (%) | P4P may have desirable effects, ranging from –5% to 10.5%. | 2 (Priedeman Skiles 2015, Friedman 2016a) | Lowb | Sensitivity analysis: RCT reported 10.5%; low‐certainty evidence (risk of bias criteria, 1 study only). |
| Summary | Overall inconsistent effects. | |||
P4P: paying for performance; RCT: randomized controlled trial; RMNCH: reproductive, maternal, newborn and child health. aSome concerns over risk of bias, one study only. bConcerns over risk of bias criteria.
2.7. Untargeted resource use
Table 63. Medicine and equipment availability
| Changes in resource use: medicine and equipment | ||||
|
Patient group: primarily mothers and children, and patients using other curative services Comparison: comparator groups (matched financing or inputs) Intervention: any type of P4P Settings: Benin | ||||
| Outcome | Impact summary | Number of studies | Certainty of the evidence | Comments |
| Equipment availability (composite score) | Effects of the intervention are uncertain: negative effect about –2.5%. | 1 (Lagarde 2015) | Very lowa | No RCT reported this outcome for this comparison. |
| Medicine availability (composite score) | Effects of the intervention are uncertain: positive effect about 4.8%. | 1 (Lagarde 2015) | Very lowa | No RCT reported this outcome for this comparison. |
| Summary | Opposite impacts to when indicators are targeted: medicine availability appeared to be increasing and that of equipment decreasing. | |||
P4P: paying for performance; RCT: randomized controlled trial. aSerious concerns over risk of bias and imprecision.
2.8. Untargeted secondary outcomes
Table 64. Impacts on management or information systems
| Impacts on management or information systems | ||||
|
Patient group: healthcare workers in PBF and comparator facilities Comparison: comparator groups (matched financing or inputs) Intervention: any type of P4P Settings: Benin | ||||
| Outcome | Impact summary | Number of studies | Certainty of the evidence | Comments |
| Facility and managerial autonomy (score) | Effect of the intervention is uncertain: impact estimated at 0.3% difference compared to comparator. | 1 (Lagarde 2015) | Very lowa | No RCT reported this outcome for this comparison. |
| Summary | Effects uncertain. | |||
P4P: paying for performance; PBF: performance‐based funding; RCT: randomized controlled trial. aConcerns over risk of bias and imprecision, one study only.
Table 65. Patient satisfaction and acceptability
| Patient satisfaction and acceptability | ||||
|
Patient group: patients attending antenatal, childcare or curative adult care in facilities Comparison: comparator groups (matched financing or inputs) Intervention: any type of P4P Settings: Rwanda, Zambia | ||||
| Outcome | Impact summary | Number of studies | Certainty of the evidence | Comments |
| Cleanliness | P4P may have a desirable effect: impacts on satisfaction scores for antenatal, child and adult curative care were consistently positive ranging from 2.45% to 11.90%. | 2 (Friedman 2016a; Lannes 2015) | Lowa | Sensitivity analysis: RCT estimate 2.45%; low‐certainty evidence (risk of bias criteria, 1 study only). |
| Contact time | P4P may have a desirable effect: impacts on client satisfaction with contact time ranging from 2.1% to 7.8%, though impacts were not consistently positive within studies. | 2 (Friedman 2016a; Lannes 2015) | Lowa | Sensitivity analysis: RCT estimate 7.8%; low‐certainty evidence (risk of bias criteria, 1 study only). |
| Waiting time | P4P may have a desirable effect: impacts on client satisfaction with waiting times ranging from 0.05% to 6%, though at times negative (e.g. for childcare from –2.6% to –0.07). | 2 (Friedman 2016a; Lannes 2015) | Lowa | Sensitivity analysis: RCT estimate 0.05%; low‐certainty evidence (risk of bias criteria, 1 study only). |
| Patient satisfaction with staff communication (index) | P4P may have little to no effect: impacts on client satisfaction with staff courteousness estimated at 3.35% | 1 (Friedman 2016a) | Lowb | Sensitivity analysis: RCT estimate 2.35%; low‐certainty evidence (risk of bias criteria, 1 study only). |
| Summary | Low‐certainty evidence, overarchingly desirable effects. | |||
P4P: paying for performance; RCT: randomized controlled trial. aSerious concerns over risk of bias. bSerious concerns over risk of bias, one study only
Table 66. Provider motivation, satisfaction, absenteeism and acceptability
| Provider motivation, satisfaction, absenteeism and acceptability | ||||
|
Patient group: healthcare workers in PBF and comparator facilities Comparison: comparator groups (matched financing or inputs) Intervention: any type of P4P Settings: Benin and Zambia | ||||
| Outcome | Impact summary | Number of studies | Certainty of the evidence | Comments |
| Motivation (score) | P4P may have little to no effect, ranging from –3.8% to 2.4%. | 3 (Friedman 2016a; Lagarde 2015; Shen 2017) | Lowa | Sensitivity analysis: RCT estimates inconsistent overall, ranging from –3.8 to. 2.4% depending on item; low‐certainty evidence (indirectness, risk of bias, 1 study). |
| Satisfaction (score) | P4P may have little to no effect, impacts ranging from –4.6 to 4.3%. | 3 (Friedman 2016a; Lagarde 2015; Shen 2017) | Lowa | Sensitivity analysis: RCT estimates inconsistent overall, ranging from –4.6% to 4.3% depending on item; low‐certainty evidence (indirectness, risk of bias, 1 study). |
| Summary | Overall little to no effect, low‐certainty evidence. | |||
P4P: paying for performance; PBF: performance‐based funding; RCT: randomized controlled trial. aConcerns over risk of bias, indirectness and imprecision.
Appendix 3. Reasons for exclusion at full‐text screening
Exclusions based on type of study
Study not a randomized controlled trial (RCT), quasi‐randomized trial, controlled before‐after study (CBA) or interrupted time series (ITS).
Study was a CBA, but there was only one cluster/site in each comparison group.
Study was a CBA, but the pre‐ and postintervention periods for study and control groups were not the same.
Study was a CBA, but the choice of control site was not appropriate (e.g. different socioeconomic characteristics, or major differences in the baseline group).
Study was an ITS, but did not have clearly defined time of intervention.
Study was an ITS but not have at least three data points before or after the intervention, neither was it likely that at least three data points before and after the intervention could have been retrieved from the authors.
Exclusions based on study population/participants
The study population/participants/healthcare providers were not from low‐ and middle‐income countries (as classified by the World Bank).
Exclusions based on intervention components
Study was not an impact evaluation of paying for performance (P4P) schemes (including ancillary components), compared to any alternative (including non‐conditional financial incentives and different levels of conditional financial incentives).
Study intervention did not cover conditional cash payment, conditional provision of material goods or target payments (payments for reaching a certain level of coverage, which can be defined in absolute terms or relative to a starting point).
Study focused on the demand side of health care only (i.e. payments to consumers, not producers).
Study focused only on payment to health workers or facilities that were not explicitly linked to changing patterns of performance (e.g. for coming to work; salary increases; routine increases in activity‐based payments such as diagnosis‐related groups or fees for service).
Study focused only on changes to budget flows that were routine or intended to motivate, but without being conditional on specific activity or output measures.
Exclusions based on type of provider
Study did not include health workers/providers of healthcare services, public health facilities, private for profit/not‐for‐profit health facilities, non‐governmental organizations, subnational governments (municipalities or provinces), national governments (Ministries of Health) or multiple levels of healthcare provision.
Exclusions based on primary outcomes of this systematic review
Study did not report on our major outcome measures of interest: changes in targeted measures of provider performance, the utilization or delivery of healthcare services, or patient outcomes; unintended effects, including motivating unintended behaviours, distortions (ignoring important tasks that were not rewarded with incentives), 'cherry‐picking'/'cream‐skimming' (prioritizing patients that were most profitable over those who released fewer financial rewards), gaming (improving or cheating on reporting rather than improving performance), increased inequities, and dependency on financial incentives; orchanges in resource use, including for incentives, administration and services.
Other
Insufficient detail given in paper to determine inclusion/exclusion. More information needed.
Duplicate.
Ongoing study for which relevant results not yet available.
Study complementary to, or superseded by, other included studies.
Appendix 4. Search strategies
CENTRAL Issue 3 2018, the Cochrane Library (searched 10 April 2018)
| ID | Search | Hits |
| #1 | MeSH descriptor: [Reimbursement, Incentive] this term only | 91 |
| #2 | MeSH descriptor: [Physician Incentive Plans] this term only | 16 |
| #3 | MeSH descriptor: [Employee Incentive Plans] this term only | 8 |
| #4 | "p4p":ti,ab,kw | 28 |
| #5 | ((performance or result or results) near/3 (pay* or paid or money or monetary or cash or financ* or fund* or econom* or disbursement* or remunerat* or reimburs* or compensat*)):ti,ab,kw | 1342 |
| #6 | ((performance or result or results) near/3 (nonmonetary or voucher* or token or tokens or goods)):ti,ab,kw | 35 |
| #7 | ((performance or result or results) near/3 (reward* or bonus* or initiative* or incentive* or contract or contracts)):ti,ab,kw | 408 |
| #8 | (indicator* near/3 (pay* or disbursement* or remunerat* or reimburs*)):ti,ab,kw | 7 |
| #9 | ((performance or merit) next based):ti,ab,kw | 411 |
| #10 | ((payment or financial or monetary or nonmonetary or economic or disbursement or remuneration or reimbursement or reward* or bonus) next incentive*):ti,ab,kw | 873 |
| #11 | ((payment or financial or monetary or nonmonetary or economic or disbursement or remuneration or reimbursement) next (reward* or bonus*)):ti,ab,kw | 183 |
| #12 | (pay* near/3 quality):ti,ab,kw | 34 |
| #13 | (bonus next payment*):ti,ab,kw | 9 |
| #14 | ((incentive* or compensatory or reimbursement) next (plan or plans)):ti,ab,kw | 29 |
| #15 | ((incentiv* or motivat* or positive* next reinforc*) near/3 (quality or output* or outcome* or delivery or utilisation or utilization)):ti,ab,kw | 879 |
| #16 | ((incentiv* or motivat* or positive* next reinforc*) near/3 (target or targets or "health goal" or "health goals" or measurable next action* or behaviour* or behavior* or "best practice" or practice next pattern* or standard or standards or recommendation* or guideline*)):ti,ab,kw | 1192 |
| #17 | (conditional near/3 (pay* or money or monetary or cash or financ* or fund* or econom* or disbursement* or remunerat* or reimburs* or nonmonetary or voucher* or token or tokens or goods or reward* or bonus* or incentive* or motivat*)):ti,ab,kw | 113 |
| #18 | (incentive next payment*):ti,ab,kw | 37 |
| #19 | ((target or targets or targeted) near/3 (pay* or reward*)):ti,ab,kw | 23 |
| #20 | ((chang* or enhanc* or improve*) near/6 (provider* or practitioner* or "health personnel" or "health care personnel" or "healthcare personnel" or health next worker* or "health care" next worker* or healthcare next worker* or physician* or doctor or doctors or nurse or nurses or health next facilit* or "health care" next facilit* or healthcare next facilit* or hospital or hospitals or health next service* or "health care" next service* or healthcare next service* or health next sector* or "health care" next sector* or healthcare next sector* or "health administrations" or government* or nongovernment*) near/6 performance):ti,ab,kw | 171 |
| #21 | ("provider recognition" next program*):ti,ab,kw | 1 |
| #22 | "cash on delivery":ti,ab,kw | 0 |
| #23 | ("output based aid" or "result based aid" or "results based aid"):ti,ab,kw | 0 |
| #24 | ("program for result" or "program for results" or "programs for result" or "programs for results" or "programme for result" or "programme for results" or "programmes for result" or "programmes for results"):ti,ab,kw | 0 |
| #25 | #1 or #2 or #3 or #4 or #5 or #6 or #7 or #8 or #9 or #10 or #11 or #12 or #13 or #14 or #15 or #16 or #17 or #18 or #19 or #20 or #21 or #22 or #23 or #24 | 4981 |
| #26 | (Africa or Asia or Caribbean or "West Indies" or "South America" or "Latin America" or "Central America"):ti,ab,kw | 8894 |
| #27 | (Afghanistan or Albania or Algeria or Angola or Antigua or Barbuda or Argentina or Armenia or Armenian or Aruba or Azerbaijan or Bahrain or Bangladesh or Barbados or Benin or Byelarus or Byelorussian or Belarus or Belorussian or Belorussia or Belize or Bhutan or Bolivia or Bosnia or Herzegovina or Hercegovina or Botswana or Brasil or Brazil or Bulgaria or "Burkina Faso" or "Burkina Fasso" or "Upper Volta" or Burundi or Urundi or Cambodia or "Khmer Republic" or Kampuchea or Cameroon or Cameroons or Cameron or Camerons or "Cape Verde" or "Central African Republic" or Chad or Chile or China or Colombia or Comoros or "Comoro Islands" or Comores or Mayotte or Congo or Zaire or "Costa Rica" or "Cote d'Ivoire" or "Ivory Coast" or Croatia or Cuba or Cyprus or Czechoslovakia or "Czech Republic" or Slovakia or "Slovak Republic"):ti,ab,kw | 19351 |
| #28 | (Djibouti or "French Somaliland" or Dominica or "Dominican Republic" or "East Timor" or "East Timur" or "Timor Leste" or Ecuador or Egypt or "United Arab Republic" or "El Salvador" or Eritrea or Estonia or Ethiopia or Fiji or Gabon or "Gabonese Republic" or Gambia or Gaza or Georgia or Georgian or Ghana or "Gold Coast" or Greece or Grenada or Guatemala or Guinea or Guam or Guiana or Guyana or Haiti or Honduras or Hungary or India or Maldives or Indonesia or Iran or Iraq or "Isle of Man" or Jamaica or Jordan or Kazakhstan or Kazakh or Kenya or Kiribati or Korea or Kosovo or Kyrgyzstan or Kirghizia or "Kyrgyz Republic" or Kirghiz or Kirgizstan or "Lao PDR" or Laos or Latvia or Lebanon or Lesotho or Basutoland or Liberia or Libya or Lithuania):ti,ab,kw | 21045 |
| #29 | (Macedonia or Madagascar or "Malagasy Republic" or Malaysia or Malaya or Malay or Sabah or Sarawak or Malawi or Nyasaland or Mali or Malta or "Marshall Islands" or Mauritania or Mauritius or "Agalega Islands" or Mexico or Micronesia or "Middle East" or Moldova or Moldovia or Moldovian or Mongolia or Montenegro or Morocco or Ifni or Mozambique or Myanmar or Myanma or Burma or Namibia or Nepal or "Netherlands Antilles" or "New Caledonia" or Nicaragua or Niger or Nigeria or "Northern Mariana Islands" or Oman or Muscat or Pakistan or Palau or Palestine or Panama or Paraguay or Peru or Philippines or Philipines or Phillipines or Phillippines or Poland or Portugal or "Puerto Rico"):ti,ab,kw | 10552 |
| #30 | (Romania or Rumania or Roumania or Russia or Russian or Rwanda or Ruanda or "Saint Kitts" or "St Kitts" or Nevis or "Saint Lucia" or "St Lucia" or "Saint Vincent" or "St Vincent" or Grenadines or Samoa or "Samoan Islands" or "Navigator Island" or "Navigator Islands" or "Sao Tome" or "Saudi Arabia" or Senegal or Serbia or Montenegro or Seychelles or "Sierra Leone" or Slovenia or "Sri Lanka" or Ceylon or "Solomon Islands" or Somalia or Sudan or Suriname or Surinam or Swaziland or Syria or Tajikistan or Tadzhikistan or Tadjikistan or Tadzhik or Tanzania or Thailand or Togo or "Togolese Republic" or Tonga or Trinidad or Tobago or Tunisia or Turkey or Turkmenistan or Turkmen or Uganda or Ukraine or Uruguay or USSR or "Soviet Union" or "Union of Soviet Socialist Republics" or Uzbekistan or Uzbek or Vanuatu or "New Hebrides" or Venezuela or Vietnam or "Viet Nam" or "West Bank" or Yemen or Yugoslavia or Zambia or Zimbabwe or Rhodesia):ti,ab,kw | 12515 |
| #31 | (developing or less* next developed or "under developed" or underdeveloped or "middle income" or low* next income or underserved or "under served" or deprived or poor*) next (countr* or nation* or population* or world):ti,ab,kw | 5136 |
| #32 | (developing or less* next developed or "under developed" or underdeveloped or "middle income" or low* next income) next (economy or economies):ti,ab,kw | 24 |
| #33 | low* next (gdp or gnp or "gross domestic" or "gross national"):ti,ab,kw | 41 |
| #34 | (low near/3 middle near/3 countr*):ti,ab,kw | 772 |
| #35 | (lmic or lmics or "third world" or "lami country" or "lami countries"):ti,ab,kw | 208 |
| #36 | ("transitional country" or "transitional countries"):ti,ab,kw | 3 |
| #37 | #26 or #27 or #28 or #29 or #30 or #31 or #32 or #33 or #34 or #35 or #36 | 65159 |
| #38 | #25 and #37 in Trials | 414 |
MEDLINE Epub Ahead of Print, In‐Process & Other Non‐Indexed Citations, MEDLINE Daily and MEDLINE 1946 to present, Ovid (searched 10 April 2018)
| # | Searches | Results |
| 1 | Reimbursement, Incentive/ | 3896 |
| 2 | Physician Incentive Plans/ | 2138 |
| 3 | Employee Incentive Plans/ | 1550 |
| 4 | or/1‐3 | 7218 |
| 5 | "p4p".ti,ab,kw. | 453 |
| 6 | ((performance or result? based) adj3 (pay* or paid or money or monetary or cash or financ* or fund* or econom* or disbursement? or remunerat* or reimburs* or compensat*)).ti,ab,kf. | 5600 |
| 7 | ((performance or result? based) adj3 (nonmonetary or voucher? or token? or goods)).ti,ab,kf. | 48 |
| 8 | ((performance or result? based) adj3 (reward* or bonus? or initiative? or incentive? or contract?)).ti,ab,kf. | 1675 |
| 9 | (indicator? adj3 (pay* or disbursement? or remunerat* or reimburs*)).ti,ab,kf. | 82 |
| 10 | ((performance or merit) adj based).ti,ab,kf. | 4495 |
| 11 | ((payment or financial or monetary or nonmonetary or economic or disbursement or remuneration or reimbursement or reward* or bonus) adj incentive?).ti,ab,kf. | 5896 |
| 12 | ((payment or financial or monetary or nonmonetary or economic or disbursement or remuneration or reimbursement) adj (reward* or bonus?)).ti,ab,kf. | 1584 |
| 13 | (pay* adj3 quality).ti,ab,kf. | 832 |
| 14 | bonus payment?.ti,ab,kw. | 81 |
| 15 | ((incentive or compensatory or reimbursement) adj plan?).ti,ab,kf. | 222 |
| 16 | ((incentiv* or motivat* or positive* reinforc*) adj3 (quality or output? or outcome? or delivery or utilisation or utilization)).ti,ab,kf. | 1972 |
| 17 | ((incentiv* or motivat* or positive* reinforc*) adj3 (target or targets or health goal? or measurable action? or behaviour? or behavior? or best practice or practice pattern? or standard? or recommendation? or guideline?)).ti,ab,kf. | 5400 |
| 18 | (conditional adj3 (pay* or money or monetary or cash or financ* or fund* or econom* or disbursement? or remunerat* or reimburs* or nonmonetary or voucher? or token? or goods or reward? or bonus? or incentive? or motivat*)).ti,ab,kf. | 412 |
| 19 | incentive payment?.ti,ab,kw. | 395 |
| 20 | ((target or targets or targeted) adj3 (pay* or reward*)).ti,ab,kw. | 470 |
| 21 | ((chang* or enhanc* or improve*) adj6 (provider? or practitioner? or health personnel or health care personnel or healthcare personnel or health worker? or health care worker? or healthcare worker? or physician* or doctor? or nurse? or health facilit* or health care facilit* or healthcare facilit* or hospital? or health service? or health care service? or healthcare service? or health sector? or health care sector? or healthcare sector? or health administrations or government* or nongovernment*) adj6 performance).ti,ab,kf. | 1726 |
| 22 | provider recognition program*.ti,ab,kw. | 12 |
| 23 | cash on delivery.ti,ab,kw. | 6 |
| 24 | (output based aid or result? based aid).ti,ab,kw. | 13 |
| 25 | program* for result?.ti,ab,kw. | 4338 |
| 26 | or/5‐25 | 31970 |
| 27 | 4 or 26 | 36614 |
| 28 | Developing Countries.sh,kf. | 80636 |
| 29 | (Africa or Asia or Caribbean or West Indies or South America or Latin America or Central America).hw,kf,ti,ab,cp. | 238702 |
| 30 | (Afghanistan or Albania or Algeria or Angola or Antigua or Barbuda or Argentina or Armenia or Armenian or Aruba or Azerbaijan or Bahrain or Bangladesh or Barbados or Benin or Byelarus or Byelorussian or Belarus or Belorussian or Belorussia or Belize or Bhutan or Bolivia or Bosnia or Herzegovina or Hercegovina or Botswana or Brasil or Brazil or Bulgaria or Burkina Faso or Burkina Fasso or Upper Volta or Burundi or Urundi or Cambodia or Khmer Republic or Kampuchea or Cameroon or Cameroons or Cameron or Camerons or Cape Verde or Central African Republic or Chad or Chile or China or Colombia or Comoros or Comoro Islands or Comores or Mayotte or Congo or Zaire or Costa Rica or Cote d'Ivoire or Ivory Coast or Croatia or Cuba or Cyprus or Czechoslovakia or Czech Republic or Slovakia or Slovak Republic or Djibouti or French Somaliland or Dominica or Dominican Republic or East Timor or East Timur or Timor Leste or Ecuador or Egypt or United Arab Republic or El Salvador or Eritrea or Estonia or Ethiopia or Fiji or Gabon or Gabonese Republic or Gambia or Gaza or Georgia Republic or Georgian Republic or Ghana or Gold Coast or Greece or Grenada or Guatemala or Guinea or Guam or Guiana or Guyana or Haiti or Honduras or Hungary or India or Maldives or Indonesia or Iran or Iraq or Isle of Man or Jamaica or Jordan or Kazakhstan or Kazakh or Kenya or Kiribati or Korea or Kosovo or Kyrgyzstan or Kirghizia or Kyrgyz Republic or Kirghiz or Kirgizstan or Lao PDR or Laos or Latvia or Lebanon or Lesotho or Basutoland or Liberia or Libya or Lithuania or Macedonia or Madagascar or Malagasy Republic or Malaysia or Malaya or Malay or Sabah or Sarawak or Malawi or Nyasaland or Mali or Malta or Marshall Islands or Mauritania or Mauritius or Agalega Islands or Mexico or Micronesia or Middle East or Moldova or Moldovia or Moldovian or Mongolia or Montenegro or Morocco or Ifni or Mozambique or Myanmar or Myanma or Burma or Namibia or Nepal or Netherlands Antilles or New Caledonia or Nicaragua or Niger or Nigeria or Northern Mariana Islands or Oman or Muscat or Pakistan or Palau or Palestine or Panama or Paraguay or Peru or Philippines or Philipines or Phillipines or Phillippines or Poland or Portugal or Puerto Rico or Romania or Rumania or Roumania or Russia or Russian or Rwanda or Ruanda or Saint Kitts or St Kitts or Nevis or Saint Lucia or St Lucia or Saint Vincent or St Vincent or Grenadines or Samoa or Samoan Islands or Navigator Island or Navigator Islands or Sao Tome or Saudi Arabia or Senegal or Serbia or Montenegro or Seychelles or Sierra Leone or Slovenia or Sri Lanka or Ceylon or Solomon Islands or Somalia or South Africa or Sudan or Suriname or Surinam or Swaziland or Syria or Tajikistan or Tadzhikistan or Tadjikistan or Tadzhik or Tanzania or Thailand or Togo or Togolese Republic or Tonga or Trinidad or Tobago or Tunisia or Turkey or Turkmenistan or Turkmen or Uganda or Ukraine or Uruguay or USSR or Soviet Union or Union of Soviet Socialist Republics or Uzbekistan or Uzbek or Vanuatu or New Hebrides or Venezuela or Vietnam or Viet Nam or West Bank or Yemen or Yugoslavia or Zambia or Zimbabwe or Rhodesia).hw,kf,ti,ab,cp. | 3299715 |
| 31 | ((developing or less* developed or under developed or underdeveloped or middle income or low* income or underserved or under served or deprived or poor*) adj (countr* or nation? or population? or world)).ti,ab. | 82240 |
| 32 | ((developing or less* developed or under developed or underdeveloped or middle income or low* income) adj (economy or economies)).ti,ab. | 426 |
| 33 | (low* adj (gdp or gnp or gross domestic or gross national)).ti,ab. | 212 |
| 34 | (low adj3 middle adj3 countr*).ti,ab. | 10061 |
| 35 | (lmic or lmics or third world or lami countr*).ti,ab. | 5396 |
| 36 | transitional countr*.ti,ab. | 142 |
| 37 | or/28‐36 | 3434653 |
| 38 | randomized controlled trial.pt. | 457171 |
| 39 | controlled clinical trial.pt. | 92291 |
| 40 | multicenter study.pt. | 230940 |
| 41 | pragmatic clinical trial.pt. | 713 |
| 42 | non‐randomized controlled trials as topic/ | 318 |
| 43 | interrupted time series analysis/ | 400 |
| 44 | controlled before‐after studies/ | 312 |
| 45 | (randomis* or randomiz* or randomly or groups or trial or multicenter or multi center or multicentre or multi centre or intervention? or effect? or impact? or controlled or control group? or (before adj5 after) or (pre adj5 post) or ((pretest or pre test) and (posttest or post test)) or quasiexperiment* or quasi experiment* or pseudo experiment* or pseudoexperiment* or evaluat* or time series or time point? or time trend? or repeated measur*).ti,ab. | 9340545 |
| 46 | or/38‐45 | 9435441 |
| 47 | exp Animals/ | 21420298 |
| 48 | Humans/ | 16980031 |
| 49 | 47 not (47 and 48) | 4440267 |
| 50 | review.pt. | 2362528 |
| 51 | meta analysis.pt. | 86627 |
| 52 | news.pt. | 186688 |
| 53 | comment.pt. | 711961 |
| 54 | editorial.pt. | 454775 |
| 55 | cochrane database of systematic reviews.jn. | 13526 |
| 56 | comment on.cm. | 711958 |
| 57 | (systematic review or literature review).ti. | 109172 |
| 58 | or/49‐57 | 7852927 |
| 59 | 46 not 58 | 6604157 |
| 60 | 27 and 37 and 59 | 2107 |
Embase 1974 to 2018 April 09, Ovid (searched 10 April 2018)
| # | Searches | Results |
| 1 | "p4p".ti,ab,kw. | 534 |
| 2 | ((performance or result? based) adj3 (pay* or paid or money or monetary or cash or financ* or fund* or econom* or disbursement? or remunerat* or reimburs* or compensat*)).ti,ab,kf. | 6667 |
| 3 | ((performance or result? based) adj3 (nonmonetary or voucher? or token? or goods)).ti,ab,kf. | 65 |
| 4 | ((performance or result? based) adj3 (reward* or bonus? or initiative? or incentive? or contract?)).ti,ab,kf. | 2062 |
| 5 | (indicator? adj3 (pay* or disbursement? or remunerat* or reimburs*)).ti,ab,kf. | 99 |
| 6 | ((performance or merit) adj based).ti,ab,kf. | 5428 |
| 7 | ((payment or financial or monetary or nonmonetary or economic or disbursement or remuneration or reimbursement or reward* or bonus) adj incentive?).ti,ab,kf. | 7146 |
| 8 | ((payment or financial or monetary or nonmonetary or economic or disbursement or remuneration or reimbursement) adj (reward* or bonus?)).ti,ab,kf. | 1985 |
| 9 | (pay* adj3 quality).ti,ab,kf. | 1012 |
| 10 | bonus payment?.ti,ab,kw. | 95 |
| 11 | ((incentive or compensatory or reimbursement) adj plan?).ti,ab,kf. | 264 |
| 12 | ((incentiv* or motivat* or positive* reinforc*) adj3 (quality or output? or outcome? or delivery or utilisation or utilization)).ti,ab,kf. | 2410 |
| 13 | ((incentiv* or motivat* or positive* reinforc*) adj3 (target or targets or health goal? or measurable action? or behaviour? or behavior? or best practice or practice pattern? or standard? or recommendation? or guideline?)).ti,ab,kf. | 6560 |
| 14 | (conditional adj3 (pay* or money or monetary or cash or financ* or fund* or econom* or disbursement? or remunerat* or reimburs* or nonmonetary or voucher? or token? or goods or reward? or bonus? or incentive? or motivat*)).ti,ab,kf. | 496 |
| 15 | incentive payment?.ti,ab,kw. | 475 |
| 16 | ((target or targets or targeted) adj3 (pay* or reward*)).ti,ab,kw. | 598 |
| 17 | ((chang* or enhanc* or improve*) adj6 (provider? or practitioner? or health personnel or health care personnel or healthcare personnel or health worker? or health care worker? or healthcare worker? or physician* or doctor? or nurse? or health facilit* or health care facilit* or healthcare facilit* or hospital? or health service? or health care service? or healthcare service? or health sector? or health care sector? or healthcare sector? or health administrations or government* or nongovernment*) adj6 performance).ti,ab,kf. | 2167 |
| 18 | provider recognition program*.ti,ab,kw. | 14 |
| 19 | cash on delivery.ti,ab,kw. | 4 |
| 20 | (output based aid or result? based aid).ti,ab,kw. | 19 |
| 21 | or/1‐20 | 33682 |
| 22 | Developing Country.sh. | 89096 |
| 23 | (Africa or Asia or Caribbean or West Indies or South America or Latin America or Central America).hw,ti,ab,cp. | 304374 |
| 24 | (Afghanistan or Albania or Algeria or Angola or Antigua or Barbuda or Argentina or Armenia or Armenian or Aruba or Azerbaijan or Bahrain or Bangladesh or Barbados or Benin or Byelarus or Byelorussian or Belarus or Belorussian or Belorussia or Belize or Bhutan or Bolivia or Bosnia or Herzegovina or Hercegovina or Botswana or Brasil or Brazil or Bulgaria or Burkina Faso or Burkina Fasso or Upper Volta or Burundi or Urundi or Cambodia or Khmer Republic or Kampuchea or Cameroon or Cameroons or Cameron or Camerons or Cape Verde or Central African Republic or Chad or Chile or China or Colombia or Comoros or Comoro Islands or Comores or Mayotte or Congo or Zaire or Costa Rica or Cote d'Ivoire or Ivory Coast or Croatia or Cuba or Cyprus or Czechoslovakia or Czech Republic or Slovakia or Slovak Republic or Djibouti or French Somaliland or Dominica or Dominican Republic or East Timor or East Timur or Timor Leste or Ecuador or Egypt or United Arab Republic or El Salvador or Eritrea or Estonia or Ethiopia or Fiji or Gabon or Gabonese Republic or Gambia or Gaza or Georgia Republic or Georgian Republic or Ghana or Gold Coast or Greece or Grenada or Guatemala or Guinea or Guam or Guiana or Guyana or Haiti or Honduras or Hungary or India or Maldives or Indonesia or Iran or Iraq or Isle of Man or Jamaica or Jordan or Kazakhstan or Kazakh or Kenya or Kiribati or Korea or Kosovo or Kyrgyzstan or Kirghizia or Kyrgyz Republic or Kirghiz or Kirgizstan or Lao PDR or Laos or Latvia or Lebanon or Lesotho or Basutoland or Liberia or Libya or Lithuania or Macedonia or Madagascar or Malagasy Republic or Malaysia or Malaya or Malay or Sabah or Sarawak or Malawi or Nyasaland or Mali or Malta or Marshall Islands or Mauritania or Mauritius or Agalega Islands or Mexico or Micronesia or Middle East or Moldova or Moldovia or Moldovian or Mongolia or Montenegro or Morocco or Ifni or Mozambique or Myanmar or Myanma or Burma or Namibia or Nepal or Netherlands Antilles or New Caledonia or Nicaragua or Niger or Nigeria or Northern Mariana Islands or Oman or Muscat or Pakistan or Palau or Palestine or Panama or Paraguay or Peru or Philippines or Philipines or Phillipines or Phillippines or Poland or Portugal or Puerto Rico or Romania or Rumania or Roumania or Russia or Russian or Rwanda or Ruanda or Saint Kitts or St Kitts or Nevis or Saint Lucia or St Lucia or Saint Vincent or St Vincent or Grenadines or Samoa or Samoan Islands or Navigator Island or Navigator Islands or Sao Tome or Saudi Arabia or Senegal or Serbia or Montenegro or Seychelles or Sierra Leone or Slovenia or Sri Lanka or Ceylon or Solomon Islands or Somalia or South Africa or Sudan or Suriname or Surinam or Swaziland or Syria or Tajikistan or Tadzhikistan or Tadjikistan or Tadzhik or Tanzania or Thailand or Togo or Togolese Republic or Tonga or Trinidad or Tobago or Tunisia or Turkey or Turkmenistan or Turkmen or Uganda or Ukraine or Uruguay or USSR or Soviet Union or Union of Soviet Socialist Republics or Uzbekistan or Uzbek or Vanuatu or New Hebrides or Venezuela or Vietnam or Viet Nam or West Bank or Yemen or Yugoslavia or Zambia or Zimbabwe or Rhodesia).hw,ti,ab,cp. | 3794559 |
| 25 | ((developing or less* developed or under developed or underdeveloped or middle income or low* income or underserved or under served or deprived or poor*) adj (countr* or nation? or population? or world)).ti,ab. | 102736 |
| 26 | ((developing or less* developed or under developed or underdeveloped or middle income or low* income) adj (economy or economies)).ti,ab. | 552 |
| 27 | (low* adj (gdp or gnp or gross domestic or gross national)).ti,ab. | 309 |
| 28 | (low adj3 middle adj3 countr*).ti,ab. | 11603 |
| 29 | (lmic or lmics or third world or lami countr*).ti,ab. | 6491 |
| 30 | transitional countr*.ti,ab. | 202 |
| 31 | or/22‐30 | 3989622 |
| 32 | Randomized Controlled Trial/ | 497473 |
| 33 | Controlled Clinical Trial/ | 459840 |
| 34 | Quasi Experimental Study/ | 4473 |
| 35 | Pretest Posttest Control Group Design/ | 339 |
| 36 | Time Series Analysis/ | 20575 |
| 37 | Experimental Design/ | 15363 |
| 38 | Multicenter Study/ | 182164 |
| 39 | (randomis* or randomiz* or randomly or groups or trial or multicenter or multi center or multicentre or multi centre or intervention? or effect? or impact? or controlled or control group? or (before adj5 after) or (pre adj5 post) or ((pretest or pre test) and (posttest or post test)) or quasiexperiment* or quasi experiment* or pseudo experiment* or pseudoexperiment* or evaluat* or time series or time point? or time trend? or repeated measur*).ti,ab. | 11966055 |
| 40 | or/32‐39 | 12075806 |
| 41 | exp animals/ or exp invertebrate/ or animal experiment/ or animal model/ or animal tissue/ or animal cell/ or nonhuman/ | 25885548 |
| 42 | human/ or normal human/ or human cell/ | 19570376 |
| 43 | 41 and 42 | 19522175 |
| 44 | 41 not 43 | 6363373 |
| 45 | (systematic review or literature review).ti. | 129754 |
| 46 | "cochrane database of systematic reviews".jn. | 11732 |
| 47 | or/44‐46 | 6503618 |
| 48 | 40 not 47 | 9228365 |
| 49 | 21 and 31 and 48 | 2212 |
| 50 | limit 49 to embase | 1158 |
PsycINFO 1806 to April Week 1 2018 (searched 10 April 2018)
| # | Searches | Results |
| 1 | Monetary Incentives/ | 1313 |
| 2 | Monetary Rewards/ | 1001 |
| 3 | "p4p".ti,ab. | 81 |
| 4 | ((performance or result? based) adj3 (pay* or paid or money or monetary or cash or financ* or fund* or econom* or disbursement? or remunerat* or reimburs* or compensat*)).ti,ab. | 4684 |
| 5 | ((performance or result? based) adj3 (nonmonetary or voucher? or token? or goods)).ti,ab. | 71 |
| 6 | ((performance or result? based) adj3 (reward* or bonus? or initiative? or incentive? or contract?)).ti,ab. | 2076 |
| 7 | (indicator? adj3 (pay* or disbursement? or remunerat* or reimburs*)).ti,ab. | 23 |
| 8 | ((performance or merit) adj based).ti,ab. | 3815 |
| 9 | ((payment or financial or monetary or nonmonetary or economic or disbursement or remuneration or reimbursement or reward* or bonus) adj incentive?).ti,ab. | 2876 |
| 10 | ((payment or financial or monetary or nonmonetary or economic or disbursement or remuneration or reimbursement) adj (reward* or bonus?)).ti,ab. | 1843 |
| 11 | (pay* adj3 quality).ti,ab. | 143 |
| 12 | bonus payment?.ti,ab. | 39 |
| 13 | ((incentive or compensatory or reimbursement) adj plan?).ti,ab. | 134 |
| 14 | ((incentiv* or motivat* or positive* reinforc*) adj3 (quality or output? or outcome? or delivery or utilisation or utilization)).ti,ab. | 2025 |
| 15 | ((incentiv* or motivat* or positive* reinforc*) adj3 (target or targets or health goal? or measurable action? or behaviour? or behavior? or best practice or practice pattern? or standard? or recommendation? or guideline?)).ti,ab. | 8296 |
| 16 | (conditional adj3 (pay* or money or monetary or cash or financ* or fund* or econom* or disbursement? or remunerat* or reimburs* or nonmonetary or voucher? or token? or goods or reward? or bonus? or incentive? or motivat*)).ti,ab. | 229 |
| 17 | incentive payment?.ti,ab. | 60 |
| 18 | ((target or targets or targeted) adj3 (pay* or reward*)).ti,ab. | 246 |
| 19 | ((chang* or enhanc* or improve*) adj6 (provider? or practitioner? or health personnel or health care personnel or healthcare personnel or health worker? or health care worker? or healthcare worker? or physician* or doctor? or nurse? or health facilit* or health care facilit* or healthcare facilit* or hospital? or health service? or health care service? or healthcare service? or health sector? or health care sector? or healthcare sector? or health administrations or government* or nongovernment*) adj6 performance).ti,ab. | 446 |
| 20 | provider recognition program*.ti,ab. | 2 |
| 21 | cash on delivery.ti,ab. | 3 |
| 22 | (output based aid or result? based aid).ti,ab. | 1 |
| 23 | or/1‐22 | 26035 |
| 24 | Developing Countries/ | 5060 |
| 25 | (Africa or Asia or Caribbean or West Indies or South America or Latin America or Central America).id,ti,ab,hw. | 33464 |
| 26 | (Afghanistan or Albania or Algeria or Angola or Antigua or Barbuda or Argentina or Armenia or Armenian or Aruba or Azerbaijan or Bahrain or Bangladesh or Barbados or Benin or Byelarus or Byelorussian or Belarus or Belorussian or Belorussia or Belize or Bhutan or Bolivia or Bosnia or Herzegovina or Hercegovina or Botswana or Brasil or Brazil or Bulgaria or Burkina Faso or Burkina Fasso or Upper Volta or Burundi or Urundi or Cambodia or Khmer Republic or Kampuchea or Cameroon or Cameroons or Cameron or Camerons or Cape Verde or Central African Republic or Chad or Chile or China or Colombia or Comoros or Comoro Islands or Comores or Mayotte or Congo or Zaire or Costa Rica or Cote d'Ivoire or Ivory Coast or Croatia or Cuba or Cyprus or Czechoslovakia or Czech Republic or Slovakia or Slovak Republic or Djibouti or French Somaliland or Dominica or Dominican Republic or East Timor or East Timur or Timor Leste or Ecuador or Egypt or United Arab Republic or El Salvador or Eritrea or Estonia or Ethiopia or Fiji or Gabon or Gabonese Republic or Gambia or Gaza or Georgia Republic or Georgian Republic or Ghana or Gold Coast or Greece or Grenada or Guatemala or Guinea or Guam or Guiana or Guyana or Haiti or Honduras or Hungary or India or Maldives or Indonesia or Iran or Iraq or Isle of Man or Jamaica or Jordan or Kazakhstan or Kazakh or Kenya or Kiribati or Korea or Kosovo or Kyrgyzstan or Kirghizia or Kyrgyz Republic or Kirghiz or Kirgizstan or Lao PDR or Laos or Latvia or Lebanon or Lesotho or Basutoland or Liberia or Libya or Lithuania or Macedonia or Madagascar or Malagasy Republic or Malaysia or Malaya or Malay or Sabah or Sarawak or Malawi or Nyasaland or Mali or Malta or Marshall Islands or Mauritania or Mauritius or Agalega Islands or Mexico or Micronesia or Middle East or Moldova or Moldovia or Moldovian or Mongolia or Montenegro or Morocco or Ifni or Mozambique or Myanmar or Myanma or Burma or Namibia or Nepal or Netherlands Antilles or New Caledonia or Nicaragua or Niger or Nigeria or Northern Mariana Islands or Oman or Muscat or Pakistan or Palau or Palestine or Panama or Paraguay or Peru or Philippines or Philipines or Phillipines or Phillippines or Poland or Portugal or Puerto Rico or Romania or Rumania or Roumania or Russia or Russian or Rwanda or Ruanda or Saint Kitts or St Kitts or Nevis or Saint Lucia or St Lucia or Saint Vincent or St Vincent or Grenadines or Samoa or Samoan Islands or Navigator Island or Navigator Islands or Sao Tome or Saudi Arabia or Senegal or Serbia or Montenegro or Seychelles or Sierra Leone or Slovenia or Sri Lanka or Ceylon or Solomon Islands or Somalia or South Africa or Sudan or Suriname or Surinam or Swaziland or Syria or Tajikistan or Tadzhikistan or Tadjikistan or Tadzhik or Tanzania or Thailand or Togo or Togolese Republic or Tonga or Trinidad or Tobago or Tunisia or Turkey or Turkmenistan or Turkmen or Uganda or Ukraine or Uruguay or USSR or Soviet Union or Union of Soviet Socialist Republics or Uzbekistan or Uzbek or Vanuatu or New Hebrides or Venezuela or Vietnam or Viet Nam or West Bank or Yemen or Yugoslavia or Zambia or Zimbabwe or Rhodesia).ti,ab,hw. | 186869 |
| 27 | ((developing or less* developed or under developed or underdeveloped or middle income or low* income or underserved or under served or deprived or poor*) adj (countr* or nation? or population? or world)).ti,ab. | 15378 |
| 28 | ((developing or less* developed or under developed or underdeveloped or middle income or low* income) adj (economy or economies)).ti,ab. | 318 |
| 29 | (low* adj (gdp or gnp or gross domestic or gross national)).ti,ab. | 39 |
| 30 | (low adj3 middle adj3 countr*).ti,ab. | 2302 |
| 31 | (lmic or lmics or third world or lami countr*).ti,ab. | 1485 |
| 32 | transitional countr*.ti,ab. | 59 |
| 33 | or/24‐32 | 210233 |
| 34 | Treatment Outcome.md. | 18819 |
| 35 | Empirical Study.md. | 2263554 |
| 36 | Prospective Study.md. | 38176 |
| 37 | Quantitative Study.md. | 1377390 |
| 38 | experimental design/ | 10755 |
| 39 | between groups design/ | 110 |
| 40 | quantitative methods/ | 3044 |
| 41 | quasi experimental methods/ | 144 |
| 42 | pretesting/ | 236 |
| 43 | posttesting/ | 135 |
| 44 | repeated measures/ | 651 |
| 45 | time series/ | 1897 |
| 46 | (posttest or posttests or post test or post tests or pretest or pretests or pre test or pre tests or "pretest/posttest" or quasi experimental or repeated measure or repeated measurement or repeated measurements or repeated measures or time series).id. | 3385 |
| 47 | (randomis* or randomiz* or randomly or groups or trial or multicenter or multi center or multicentre or multi centre or intervention? or effect? or impact? or controlled or control group? or (before adj5 after) or (pre adj5 post) or ((pretest or pre test) and (posttest or post test)) or quasiexperiment* or quasi experiment* or pseudo experiment* or pseudoexperiment* or evaluat* or time series or time point? or time trend? or repeated measur*).ti,ab. | 2015402 |
| 48 | or/34‐47 | 3013075 |
| 49 | 23 and 33 and 48 | 1266 |
CINAHL 1981 to present, EBSCOhost (searched 10 April 2018)
| # | Query | Results |
| S47 | S21 AND S31 AND S45 Exclude MEDLINE records |
340 |
| S46 | S21 AND S31 AND S45 | 815 |
| S45 | S32 OR S33 OR S34 OR S35 OR S36 OR S37 OR S38 OR S39 OR S40 OR S41 OR S42 OR S43 OR S44 | 1,582,750 |
| S44 | TI ( (randomis* or randomiz* or randomly or trial or effect* or impact* or intervention* or before N5 after or pre N5 post or ((pretest or "pre test") and (posttest or "post test")) or quasiexperiment* or quasi W0 experiment* or pseudo experiment* or pseudoexperiment* or evaluat* or "time series" or time W0 point* or repeated W0 measur*) ) OR AB ( (randomis* or randomiz* or randomly or trial or effect* or impact* or intervention* or before N5 after or pre N5 post or ((pretest or "pre test") and (posttest or "post test")) or quasiexperiment* or quasi W0 experiment* or pseudo experiment* or pseudoexperiment* or evaluat* or "time series" or time W0 point* or repeated W0 measur*) ) | 987,530 |
| S43 | (MH "Health Services Research") | 8,042 |
| S42 | (MH "Multicenter Studies") | 35,373 |
| S41 | (MH "Quasi‐Experimental Studies+") | 10,453 |
| S40 | (MH "Pretest‐Posttest Design+") | 31,400 |
| S39 | (MH "Experimental Studies") | 17,810 |
| S38 | (MH "Nonrandomized Trials") | 261 |
| S37 | (MH "Intervention Trials") | 6,995 |
| S36 | (MH "Clinical Trials") | 93,018 |
| S35 | (MH "Randomized Controlled Trials") | 41,155 |
| S34 | PT research | 1,198,627 |
| S33 | PT clinical trial | 55,968 |
| S32 | PT randomized controlled trial | 43,976 |
| S31 | S22 OR S23 OR S24 OR S25 OR S26 OR S27 OR S28 OR S29 OR S30 | 234,939 |
| S30 | TI transitional N0 countr* OR AB transitional N0 countr* | 42 |
| S29 | TI ( lmic or lmics or "third world" or lami N0 countr* ) OR AB ( lmic or lmics or "third world" or lami N0 countr* ) | 721 |
| S28 | TI low N3 middle N3 countr* OR AB low N3 middle N3 countr* | 2,061 |
| S27 | TI ( low* N0 (gdp or gnp or "gross domestic" or "gross national") ) OR AB ( low* N0 (gdp or gnp or "gross domestic" or "gross national") ) | 21 |
| S26 | TI ( (developing or less* N0 developed or "under developed" or underdeveloped or "middle income" or low* N3 income) N0 (economy or economies) ) OR AB ( (developing or less* N0 developed or "under developed" or underdeveloped or "middle income" or low* N3 income) N0 (economy or economies) ) | 60 |
| S25 | TI ( developing or less* N0 developed or "under developed" or underdeveloped or "middle income" or low* N0 income or underserved or "under served" or deprived or poor*) N0 (countr* or nation* or population* or world) ) OR AB ( developing or less* N0 developed or "under developed" or underdeveloped or "middle income" or low* N0 income or underserved or "under served" or deprived or poor*) N0 (countr* or nation* or population* or world) ) | 12,974 |
| S24 | TX Afghanistan or Albania or Algeria or Angola or Antigua or Barbuda or Argentina or Armenia or Armenian or Aruba or Azerbaijan or Bahrain or Bangladesh or Barbados or Benin or Byelarus or Byelorussian or Belarus or Belorussian or Belorussia or Belize or Bhutan or Bolivia or Bosnia or Herzegovina or Hercegovina or Botswana or Brasil or Brazil or Bulgaria or Burkina Faso or Burkina Fasso or Upper Volta or Burundi or Urundi or Cambodia or Khmer Republic or Kampuchea or Cameroon or Cameroons or Cameron or Camerons or Cape Verde or Central African Republic or Chad or Chile or China or Colombia or Comoros or Comoro Islands or Comores or Mayotte or Congo or Zaire or Costa Rica or Cote d'Ivoire or Ivory Coast or Croatia or Cuba or Cyprus or Czechoslovakia or Czech Republic or Slovakia or Slovak Republic or Djibouti or French Somaliland or Dominica or Dominican Republic or East Timor or East Timur or Timor Leste or Ecuador or Egypt or United Arab Republic or El Salvador or Eritrea or Estonia or Ethiopia or Fiji or Gabon or Gabonese Republic or Gambia or Gaza or Georgia Republic or Georgian Republic or Ghana or Gold Coast or Greece or Grenada or Guatemala or Guinea or Guam or Guiana or Guyana or Haiti or Honduras or Hungary or India or Maldives or Indonesia or Iran or Iraq or Isle of Man or Jamaica or Jordan or Kazakhstan or Kazakh or Kenya or Kiribati or Korea or Kosovo or Kyrgyzstan or Kirghizia or Kyrgyz Republic or Kirghiz or Kirgizstan or Lao PDR or Laos or Latvia or Lebanon or Lesotho or Basutoland or Liberia or Libya or Lithuania or Macedonia or Madagascar or Malagasy Republic or Malaysia or Malaya or Malay or Sabah or Sarawak or Malawi or Nyasaland or Mali or Malta or Marshall Islands or Mauritania or Mauritius or Agalega Islands or Mexico or Micronesia or Middle East or Moldova or Moldovia or Moldovian or Mongolia or Montenegro or Morocco or Ifni or Mozambique or Myanmar or Myanma or Burma or Namibia or Nepal or Netherlands Antilles or New Caledonia or Nicaragua or Niger or Nigeria or Northern Mariana Islands or Oman or Muscat or Pakistan or Palau or Palestine or Panama or Paraguay or Peru or Philippines or Philipines or Phillipines or Phillippines or Poland or Portugal or Puerto Rico or Romania or Rumania or Roumania or Russia or Russian or Rwanda or Ruanda or Saint Kitts or St Kitts or Nevis or Saint Lucia or St Lucia or Saint Vincent or St Vincent or Grenadines or Samoa or Samoan Islands or Navigator Island or Navigator Islands or Sao Tome or Saudi Arabia or Senegal or Serbia or Montenegro or Seychelles or Sierra Leone or Slovenia or Sri Lanka or Ceylon or Solomon Islands or Somalia or South Africa or Sudan or Suriname or Surinam or Swaziland or Syria or Tajikistan or Tadzhikistan or Tadjikistan or Tadzhik or Tanzania or Thailand or Togo or Togolese Republic or Tonga or Trinidad or Tobago or Tunisia or Turkey or Turkmenistan or Turkmen or Uganda or Ukraine or Uruguay or USSR or Soviet Union or Union of Soviet Socialist Republics or Uzbekistan or Uzbek or Vanuatu or New Hebrides or Venezuela or Vietnam or Viet Nam or West Bank or Yemen or Yugoslavia or Zambia or Zimbabwe or Rhodesia | 203,277 |
| S23 | TX Africa or Asia or Caribbean or "West Indies" or "South America" or "Latin America" or "Central America" | 43,714 |
| S22 | (MH "Developing Countries") | 9,732 |
| S21 | S1 OR S2 OR S3 OR S4 OR S5 OR S6 OR S7 OR S8 OR S9 OR S10 OR S11 OR S12 OR S13 OR S14 OR S15 OR S16 OR S17 OR S18 OR S19 OR S20 | 11,558 |
| S20 | TI ( "output based aid" or "output based aid" or "result based aid" or "results based aid" ) OR AB ( "output based aid" or "output based aid" or "result based aid" or "results based aid" ) | 155,579 |
| S19 | TI "cash on delivery" OR AB "cash on delivery" | 3 |
| S18 | TI "provider recognition" N0 program* OR AB "provider recognition" N0 program* | 7 |
| S17 | TI ( (chang* or enhanc* or improve*) N6 (provider* or practitioner* or "health personnel" or "health care personnel" or "healthcare personnel" or health N0 worker* or "health care" N0 worker* or healthcare N0 worker* or physician* or doctor or doctors or nurse or nurses or health N0 facilit* or "health care" N0 facilit* or healthcare N0 facilit* or hospital or hospitals or health N0 service* or "health care" N0 service* or healthcare N0 service* or health N0 sector* or "health care" N0 sector* or healthcare N0 sector* or "health administrations" or government* or nongovernment*) N6 performance ) OR AB ( (chang* or enhanc* or improve*) N6 (provider* or practitioner* or "health personnel" or "health care personnel" or "healthcare personnel" or health N0 worker* or "health care" N0 worker* or healthcare N0 worker* or physician* or doctor or doctors or nurse or nurses or health N0 facilit* or "health care" N0 facilit* or healthcare N0 facilit* or hospital or hospitals or health N0 service* or "health care" N0 service* or healthcare N0 service* or health N0 sector* or "health care" N0 sector* or healthcare N0 sector* or "health administrations" or government* or nongovernment*) N6 performance ) | 911 |
| S16 | TI (target or targets or targeted) N3 (pay* or reward*) OR AB (target or targets or targeted) N3 (pay* or reward*) | 99 |
| S15 | TI (incentive N0 payment*) OR AB (incentive N0 payment*) | 310 |
| S14 | TI ( conditional N3 (pay* or money or monetary or cash or financ* or econom* or disbursement* or remunerat* or reimburs* or nonmonetary or voucher* or token or tokens or goods or reward* or bonus* or incentive* or motivat*) ) OR AB ( conditional N3 (pay* or money or monetary or cash or financ* or econom* or disbursement* or remunerat* or reimburs* or nonmonetary or voucher* or token or tokens or goods or reward* or bonus* or incentive* or motivat*) ) | 121 |
| S13 | TI ( (incentiv* or motivat* or positive* N0 reinforc*) N3 (target or targets or "health goal" or "health goals" or measurable N0 action* or behaviour* or behavior* or "best practice" or practice N0 pattern* or standard or standards or recommendation* or guideline*) ) OR AB ( (incentiv* or motivat* or positive* N0 reinforc*) N3 (target or targets or "health goal" or "health goals" or measurable N0 action* or behaviour* or behavior* or "best practice" or practice N0 pattern* or standard or standards or recommendation* or guideline*) ) | 1,977 |
| S12 | TI ( (incentiv* or motivat* or positive* N0 reinforc*) N3 (quality or output* or outcome* or delivery or utilisation or utilization) ) OR AB ( (incentiv* or motivat* or positive* N0 reinforc*) N3 (quality or output* or outcome* or delivery or utilisation or utilization) ) | 973 |
| S11 | TI ( (incentive* or compensatory or reimbursement) N0 (plan or plans) ) OR AB ( (incentive* or compensatory or reimbursement) N0 (plan or plans) ) | 67 |
| S10 | TI (bonus N0 payment*) OR AB (bonus N0 payment*) | 37 |
| S9 | TI (pay* N3 quality) OR AB (pay* N3 quality) | 588 |
| S8 | TI ( (payment or financial or monetary or nonmonetary or economic or disbursement or remuneration or reimbursement) N0 (reward* or bonus*) ) OR AB ( (payment or financial or monetary or nonmonetary or economic or disbursement or remuneration or reimbursement) N0 (reward* or bonus*) ) | 313 |
| S7 | TI ( (payment or financial or monetary or nonmonetary or economic or disbursement or remuneration or reimbursement or reward* or bonus) N0 incentive* ) OR AB ( (payment or financial or monetary or nonmonetary or economic or disbursement or remuneration or reimbursement or reward* or bonus) N0 incentive* ) | 1,952 |
| S6 | TI ( (performance or merit) N0 based ) OR AB ( (performance or merit) N0 based ) | 1,549 |
| S5 | TI ( indicator* N3 (pay* or disbursement* or remunerat* or reimburs*) ) OR AB ( indicator* N3 (pay* or disbursement* or remunerat* or reimburs*) ) | 51 |
| S4 | TI ( ((performance or "result based" or "results based") N3 (reward* or bonus* or initiative* or incentive* or contract or contracts)) ) OR AB ( ((performance or "result based" or "results based") N3 (reward* or bonus* or initiative* or incentive* or contract or contracts)) ) | 696 |
| S3 | TI ( (performance or "result based" or "results based") N3 (nonmonetary or voucher* or token or tokens or goods) ) OR AB ( (performance or "result based" or "results based") N3 (nonmonetary or voucher* or token or tokens or goods) ) | 900 |
| S2 | TI ((performance or "result based" or "results based") N3 (pay* or paid or money or monetary or cash or financ* or fund* or econom* or disbursement* or remunerat* or reimburs* or compensat*)) OR AB ((performance or "result based" or "results based") N3 (pay* or paid or money or monetary or cash or financ* or fund* or econom* or disbursement* or remunerat* or reimburs* or compensat*)) | 2,346 |
| S1 | (MH "Reimbursement, Incentive") | 1,183 |
ClinicalTrials.gov, NIH (clinicaltrials.gov) (searched June 2018)
Advanced search in Intervention/treatment (6 individual strategies/searches) ID Search 1 "performance based" OR "reward based" OR "result based" OR "results based" OR "performance incentive" OR "performance incentives" OR "reimbursement incentive" OR "reimbursement incentives" OR "p4p" 2 "pay for performance" OR "paying for performance" OR "payment for performance" OR "payments for performance" OR "pay by performance" OR "paying by performance" OR "payment by performance" OR "payments by performance" 3 "performance related payment" OR "performance related payments" OR "incentive payment" OR "incentive payments" OR "payment incentive" OR "payment incentives" 4 "financial incentive" OR "financial incentives" OR "economic incentive" OR "economic incentives" OR "monetary incentive" OR "monetary incentives" 5 "financial reward" OR "financial rewards" OR "economic reward" OR "economic rewards" OR "monetary reward" OR "monetary rewards" 6 "rewarding performance" OR "performance reward" OR "performance rewards" OR "bonus payment" OR "bonus payments" OR "conditional cash"
ICTRP, WHO (apps.who.int/trialsearch/AdvSearch.aspx) (searched June 2018)
Advanced search in the Intervention with Recruitment status: ALL (6 individual strategies/searches) ID Search 1 performance based OR reward based OR result based OR results based OR performance incentive OR performance incentives OR reimbursement incentive OR reimbursement incentives OR p4p 2 pay for performance OR paying for performance OR payment for performance OR payments for performance OR pay by performance OR paying by performance OR payment by performance OR payments by performance 3 performance related payment OR performance related payments OR incentive payment OR incentive payments OR payment incentive OR payment incentives 4 financial incentive OR financial incentives OR economic incentive OR economic incentives OR monetary incentive OR monetary incentives 5 financial reward OR financial rewards OR economic reward OR economic rewards OR monetary reward OR monetary rewards 6 rewarding performance OR performance reward OR performance rewards OR bonus payment OR bonus payments OR conditional cash
Global Health 1973 to 2018 Week 43, Ovid (searched 27 April 2018)
ID Search 1 "p4p".af. 2 ((result based or results based) adj (pay* or fund* or reward*)).af. 3 (pay* adj3 perform*).af. 4 ((performance or merit) adj based).af. 5 ((performance or payment or financial or monetary or nonmonetary or economic or disbursement or remuneration or reimbursement or reward* or bonus) adj incentive?).af. 6 incentive payment?.af. 7 ((performance or payment or financial or monetary or nonmonetary or economic or disbursement or remuneration or reimbursement) adj (reward* or bonus?)).af. 8 (pay* adj3 quality).af. 9 ((incentive or compensatory or reimbursement) adj plan?).af. 10 (conditional adj3 (pay* or money or monetary or cash or financ* or fund* or econom* or disbursement? or remunerat* or reimburs* or nonmonetary or voucher? or token? or goods or reward? or bonus? or incentive? or motivat*)).af. 11 ((target or targets or targeted) adj3 (pay* or reward*)).af. 12 ((chang* or enhanc* or improve*) adj6 (provider? or practitioner? or health personnel or health care personnel or healthcare personnel or health worker? or health care worker? or healthcare worker? or physician* or doctor? or nurse? or health facilit* or health care facilit* or healthcare facilit* or hospital? or health service? or health care service? or healthcare service? or health sector? or health care sector? or healthcare sector? or health administrations or government* or nongovernment*) adj6 performance).af. 13 or/1‐12 14 (random* or intervention? or control* or evaluat* or (before adj5 after) or (pre adj5 post) or ((pretest or pre test) and (posttest or post test)) or quasiexperiment* or quasi experiment* or time series or time point? or time trend? or repeated measur*).ti,ab. 15 (trial or effect? or impact?).ti. 16 or/14‐15 17 13 and 16
EconLit 1886 to present, EBSCOhost (searched 27 April 2018)
ID Search S27 S15 AND S16 AND S25 AND S26 S26 TI (randomis* OR randomiz* OR randomly OR groups OR trial OR multicenter OR "multi center" OR multicentre OR "multi centre" OR intervention* OR effect* OR impact* OR controlled OR "control group" OR "before and after" OR quasiexperiment* OR quasi W0 experiment* OR pseudo W0 experiment* OR pseudoexperiment* OR evaluat* OR "time series" OR time W0 point* OR time W0 trend* OR repeated W0 measur*) OR AB (randomis* OR randomiz* OR randomly OR groups OR trial OR multicenter OR "multi center" OR multicentre OR "multi centre" OR intervention* OR effect* OR impact* OR controlled OR "control group" OR "before and after" OR quasiexperiment* OR quasi W0 experiment* OR pseudo W0 experiment* OR pseudoexperiment* OR evaluat* OR "time series" OR time W0 point* OR time W0 trend* OR repeated W0 measur*) S25 S17 OR S18 OR S19 OR S20 OR S21 OR S22 OR S23 OR S24 S24 TI ("transitional country" or "transitional countries")) OR AB ("transitional country" or "transitional countries")) S23 TI (lmic or lmics or "third world" or "lami country" or "lami countries") OR AB (lmic or lmics or "third world" or "lami country" or "lami countries") S22 TI (low N3 middle N3 countr*) OR AB (low N3 middle N3 countr*) S21 TI (low* W0 (gdp or gnp or "gross domestic" or "gross national")) OR AB (low* W0 (gdp or gnp or "gross domestic" or "gross national")) S20 TI ((developing or "less developed" or "lesser developed" or "under developed" or underdeveloped or "middle income" or "low income" or "lower income") W0 (economy or economies)) OR AB ((developing or "less developed" or "lesser developed" or "under developed" or underdeveloped or "middle income" or "low income" or "lower income") W0 (economy or economies)) S19 TI ((developing or "less developed" or "lesser developed" or "under developed" or underdeveloped or "middle income" or "low income" or "lower income" or underserved or "under served" or deprived or poor*) W0 (countr* or nation* or population* or world)) OR AB ((developing or "less developed" or "lesser developed" or "under developed" or underdeveloped or "middle income" or "low income" or "lower income" or underserved or "under served" or deprived or poor*) W0 (countr* or nation* or population* or world)) S18 TX (Afghanistan OR Albania OR Algeria OR Angola OR Antigua OR Barbuda OR Argentina OR Armenia OR Armenian OR Aruba OR Azerbaijan OR Bahrain OR Bangladesh OR Barbados OR Benin OR Byelarus OR Byelorussian OR Belarus OR Belorussian OR Belorussia OR Belize OR Bhutan OR Bolivia OR Bosnia OR Herzegovina OR Hercegovina OR Botswana OR Brasil OR Brazil OR Bulgaria OR "Burkina Faso" OR "Burkina Fasso" OR "Upper Volta" OR Burundi OR Urundi OR Cambodia OR "Khmer Republic" OR Kampuchea OR Cameroon OR Cameroons OR Cameron OR Camerons OR "Cape Verde" OR "Central African Republic" OR Chad OR Chile OR China OR Colombia OR Comoros OR "Comoro Islands" OR Comores OR Mayotte OR Congo OR Zaire OR "Costa Rica" OR "Cote d'Ivoire" OR "Ivory Coast" OR Croatia OR Cuba OR Cyprus OR Czechoslovakia OR "Czech Republic" OR Slovakia OR "Slovak Republic" OR Djibouti OR "French Somaliland" OR Dominica OR "Dominican Republic" OR "East Timor" OR "East Timur" OR "Timor Leste" OR Ecuador OR Egypt OR "United Arab Republic" OR "El Salvador" OR Eritrea OR Estonia OR Ethiopia OR Fiji OR Gabon OR "Gabonese Republic" OR Gambia OR Gaza OR Georgia OR Georgian OR Ghana OR "Gold Coast" OR Greece OR Grenada OR Guatemala OR Guinea OR Guam OR Guiana OR Guyana OR Haiti OR Honduras OR Hungary OR India OR Maldives OR Indonesia OR Iran OR Iraq OR "Isle of Man" OR Jamaica OR Jordan OR Kazakhstan OR Kazakh OR Kenya OR Kiribati OR Korea OR Kosovo OR Kyrgyzstan OR Kirghizia OR "Kyrgyz Republic" OR Kirghiz OR Kirgizstan OR "Lao PDR" OR Laos OR Latvia OR Lebanon OR Lesotho OR Basutoland OR Liberia OR Libya OR Lithuania OR Macedonia OR Madagascar OR "Malagasy Republic" OR Malaysia OR Malaya OR Malay OR Sabah OR Sarawak OR Malawi OR Nyasaland OR Mali OR Malta OR "Marshall Islands" OR Mauritania OR Mauritius OR "Agalega Islands" OR Mexico OR Micronesia OR "Middle East" OR Moldova OR Moldovia OR Moldovian OR Mongolia OR Montenegro OR Morocco OR Ifni OR Mozambique OR Myanmar OR Myanma OR Burma OR Namibia OR Nepal OR "Netherlands Antilles" OR "New Caledonia" OR Nicaragua OR Niger OR Nigeria OR "Northern Mariana Islands" OR Oman OR Muscat OR Pakistan OR Palau OR Palestine OR Panama OR Paraguay OR Peru OR Philippines OR Philipines OR Phillipines OR Phillippines OR Poland OR Portugal OR "Puerto Rico" OR Romania OR Rumania OR Roumania OR Russia OR Russian OR Rwanda OR Ruanda OR "Saint Kitts" OR "St Kitts" OR Nevis OR "Saint Lucia" OR "St Lucia" OR "Saint Vincent" OR "St Vincent" OR Grenadines OR Samoa OR "Samoan Islands" OR "Navigator Island" OR "Navigator Islands" OR "Sao Tome" OR "Saudi Arabia" OR Senegal OR Serbia OR Montenegro OR Seychelles OR "Sierra Leone" OR Slovenia OR "Sri Lanka" OR Ceylon OR "Solomon Islands" OR Somalia OR Sudan OR Suriname OR Surinam OR Swaziland OR Syria OR Tajikistan OR Tadzhikistan OR Tadjikistan OR Tadzhik OR Tanzania OR Thailand OR Togo OR "Togolese Republic" OR Tonga OR Trinidad OR Tobago OR Tunisia OR Turkey OR Turkmenistan OR Turkmen OR Uganda OR Ukraine OR Uruguay OR USSR OR "Soviet Union" OR "Union of Soviet Socialist Republics" OR Uzbekistan OR Uzbek OR Vanuatu OR "New Hebrides" OR Venezuela OR Vietnam OR "Viet Nam" OR "West Bank" OR Yemen OR Yugoslavia OR Zambia OR Zimbabwe OR Rhodesia) S17 TX (Africa OR Asia OR Caribbean OR "West Indies" OR "South America" OR "Latin America" OR "Central America") S16 TI (health* OR medical OR practitioner* OR physician* OR doctor OR doctors OR nurse OR nurses OR hospital OR hospitals) OR AB(health* OR medical OR practitioner* OR physician* OR doctor OR doctors OR nurse OR nurses OR hospital OR hospitals) S15 S1 OR S2 OR S3 OR S4 OR S5 OR S6 OR S7 OR S8 OR S9 OR S10 OR S11 OR S12 OR S13 OR S14 S14 TI ((chang* OR enhanc* OR improve*) N6 (provider* OR practitioner* OR "health personnel" OR "health care personnel" OR "healthcare personnel" OR "health worker" OR "health workers" OR "health care worker" OR "health care workers" OR "healthcare worker" OR "healthcare workers" OR physician* OR doctor OR doctors OR nurse OR nurses OR "health facility" OR "health facilities" OR "health care facility" OR "health care facilities" OR "healthcare facility" OR "healthcare facilities" OR hospital OR hospitals OR "health service" OR "health services" OR "health care service" OR "health care services" OR "healthcare service" OR "healthcare services" OR "health sector" OR "health sectors" OR "health care sector" OR "health care sectors" OR "healthcare sector" OR "healthcare sectors" OR "health administrations" OR government* OR nongovernment*) N6 performance) OR AB ((chang* OR enhanc* OR improve*) N6 (provider* OR practitioner* OR "health personnel" OR "health care personnel" OR "healthcare personnel" OR "health worker" OR "health workers" OR "health care worker" OR "health care workers" OR "healthcare worker" OR "healthcare workers" OR physician* OR doctor OR doctors OR nurse OR nurses OR "health facility" OR "health facilities" OR "health care facility" OR "health care facilities" OR "healthcare facility" OR "healthcare facilities" OR hospital OR hospitals OR "health service" OR "health services" OR "health care service" OR "health care services" OR "healthcare service" OR "healthcare services" OR "health sector" OR "health sectors" OR "health care sector" OR "health care sectors" OR "healthcare sector" OR "healthcare sectors" OR "health administrations" OR government* OR nongovernment*) N6 performance) S13 TI ((target OR targets OR targeted) N3 (pay* OR reward*)) OR AB ((target OR targets OR targeted) N3 (pay* OR reward*)) S12 TI (conditional N3 (pay* OR money OR monetary OR cash OR financ* OR fund* OR econom* OR disbursement* OR remunerat* OR reimburs* OR nonmonetary OR voucher* OR token OR tokens OR goods OR reward* OR bonus* OR incentive* OR motivat*)) OR AB (conditional N3 (pay* OR money OR monetary OR cash OR financ* OR fund* OR econom* OR disbursement* OR remunerat* OR reimburs* OR nonmonetary OR voucher* OR token OR tokens OR goods OR reward* OR bonus* OR incentive* OR motivat*)) S11 TI ((incentive* OR compensatory OR reimbursement) W0 (plan OR plans)) OR AB ((incentive* OR compensatory OR reimbursement) W0 (plan OR plans)) S10 TI (pay* W3 quality) OR AB (pay* W3 quality) S9 TI ((payment OR financial OR monetary OR nonmonetary OR economic OR disbursement OR remuneration OR reimbursement) W0 (reward* OR bonus*)) OR AB ((payment OR financial OR monetary OR nonmonetary OR economic OR disbursement OR remuneration OR reimbursement) W0 (reward* OR bonus*)) S8 TI (incentive W0 payment*) OR AB (incentive W0 payment*) S7 TI ((payment OR financial OR monetary OR nonmonetary OR economic OR disbursement OR remuneration OR reimbursement OR reward* OR bonus) W0 incentive*) OR AB ((payment OR financial OR monetary OR nonmonetary OR economic OR disbursement OR remuneration OR reimbursement OR reward* OR bonus) W0 incentive*) S6 TI ((performance OR merit) W0 based) OR AB ((performance OR merit) W0 based) S5 TI (("result based" OR "results based") W0 (pay* OR fund* OR reward*)) OR AB (("result based" OR "results based") W0 (pay* OR fund* OR reward*)) S4 TI ("p4p" OR (pay* N3 perform*)) OR AB ("p4p" OR (pay* N3 perform*)) S3 (SU(Compensation) AND SU(Incentives)) S2 SU ("Personnel Economics: Compensation and Compensation Methods and Their Effects") S1 SU ("Compensation Packages; Payment Methods")
LILACS and WHOLIS, Virtual Health Library (VHL) Regional Portal (searched 10 April 2018)
"p4p" OR "pay for performance" OR "paying for performance" OR "Reimbursement Incentive" OR "Reimbursement Incentives" OR "Physician Incentive Plans" OR "Physician Incentive Plan" OR "Employee Incentive Plans" OR "Employee Incentive Plan" OR "Pago por desempeño" OR "Pago basado en resultados" OR "Remuneración basada en desempeño" OR "Reembolso de Incentivo" OR "Planes para Motivación del Personal" OR "Planes de Incentivos para los Médicos" OR "Planos para Motivação de Pessoal" OR "Planos de Incentivos Médicos"
The Grey Literature Report (www.greylit.org/) (individual strategies/searches) (searched June 2018)
ID Search 1 "pay for performance" 2 "p4p" 3 "reimbursement incentive" 4 "payment incentive" 5 "payment reward" 6 "performance incentive" 7 "performance reward" 8 "performance payment" 9 "performance based financing" 10 "result based payment" 11 "result based funding" 12 "result based financing"
BLDS British Library for Development Studies (blds.ids.ac.uk) (individual strategies/searches) (searched 18 June 2018)
ID Search 1 pay for performance 2 paying for performance 3 p4p 4 reimbursement incentive 5 reimbursement incentives 6 payment incentive 7 payment incentives 8 payment reward 9 payment rewards 10 performance incentive 11 performance incentives 12 performance reward 13 performance rewards 14 performance payment 15 performance payments 16 performance based financing 17 result based payment 18 results based payment 19 result based payments 20 results based payments 21 result based funding 22 results based funding 23 result based financing 24 results based financing
OpenGrey (www.opengrey.eu/) (searched June 2018)
ID Search 1 "pay for performance" OR "paying for performance" OR "p4p" OR "reimbursement incentive" OR "reimbursement incentives" OR "payment incentive" OR "payment incentives" OR "payment reward" OR "payment rewards" OR "performance incentive" OR "performance incentives" OR "performance reward" OR "performance rewards" OR "performance payment" OR "performance payments" OR "performance based financing" OR "result based payment" OR "results based payment" OR "result based payments" OR "results based payments" OR "result based funding" OR "results based funding" OR "result based financing" OR "results based financing"
3ie Database of Impact Evaluations (http://www.3ieimpact.org/en/)(individual strategies/searches) (searched 07 June 2018)
ID Search 1 "pay for performance" OR "paying for performance" OR "p4p" OR "reimbursement incentive" OR "reimbursement incentives" 2 "payment incentive" OR "payment incentives" OR "payment reward" OR "payment rewards" OR "performance incentive" OR "performance incentives" OR "performance reward" OR "performance rewards" OR "performance payment" OR "performance payments" 3 "performance based financing" 4 "result based payment" OR "results based payment" OR "result based payments" OR "results based payments" OR "result based funding" OR "results based funding" OR "result based financing" OR "results based financing"
African Development Bank (www.afdb.org/en/) (searched 20/09/2017)
ID Search 1 "pay for performance" 2 "p4p" 3 "reimbursement incentive" 4 "payment incentive" 5 "payment reward" 6 "performance incentive" 7 "performance reward" 8 "performance payment" 9 "performance based financing" 10 "result based payment" 11 "result based funding" 12 "result based financing"
USAID (www.usaid.gov/) (searched 14/09/2017)
ID Search 1 "pay for performance" 2 "paying for performance" 3 "p4p" 4 "reimbursement incentive" 5 "reimbursement incentives" 6 "payment incentive" 7 "payment incentives" 8 "payment reward" 9 "payment rewards" 10 "performance incentive" 11 "performance incentives" 12 "performance reward" 13 "performance rewards" 14 "performance payment" 15 "performance payments" 16 "performance based financing" 17 "result based payment" 18 "results based payment" 19 "result based payments" 20 "results based payments" 21 "result based funding" 22 "results based funding" 23 "result based financing" 24 "results based financing"
CORDAID (www.cordaid.org/en/) (searched 20/09/2017)
ID Search 1 pay for performance 2 paying for performance 3 p4p 4 reimbursement incentive 5 reimbursement incentives 6 payment incentive 7 payment incentives 8 payment reward 9 payment rewards 10 performance incentive 11 performance incentives 12 performance reward 13 performance rewards 14 performance payment 15 performance payments 16 performance based financing 17 result based payment 18 results based payment 19 result based payments 20 results based payments 21 result based funding 22 results based funding 23 result based financing 24 results based financing
Management Sciences for Health (www.msh.org/) (searched 14/09/2017)
ID Search 1 "pay for performance" 2 "p4p" 3 "reimbursement incentive" 4 "payment incentive" 5 "payment reward" 6 "performance incentive" 7 "performance reward" 8 "performance payment" 9 "performance based financing" 10 "result based payment" 11 "result based funding" 12 "result based financing"
Centre for Global Development (www.cgdev.org/) (searched 15/09/2017)
ID Search 1 "pay for performance" 2 "p4p" 3 "reimbursement incentive" 4 "payment incentive" 5 "payment reward" 6 "performance incentive" 7 "performance reward" 8 "performance payment" 9 "performance based financing" 10 "result based payment" 11 "result based funding" 12 "result based financing"
Deutsche Gesellschaft für Technische Zusammenarbeit (GTZ) (www.giz.de/de/html/index.html) (searched 20/09/2017)
ID Search 1 "pay for performance" 2 "paying for performance" 3 "p4p" 4 "reimbursement incentive" 5 "reimbursement incentives" 6 "payment incentive" 7 "payment incentives" 8 "payment reward" 9 "payment rewards" 10 "performance incentive" 11 "performance incentives" 12 "performance reward" 13 "performance rewards" 14 "performance payment" 15 "performance payments" 16 "performance based financing" 17 "result based payment" 18 "results based payment" 19 "result based payments" 20 "results based payments" 21 "result based funding" 22 "results based funding" 23 "result based financing" 24 "results based financing"
KfW Entwicklungsbank (www.kfw‐entwicklungsbank.de/International‐financing/KfW‐Entwicklungsbank/) (searched 20/09/2017)
ID Search 1 pay‐for‐performance 2 paying‐for‐performance 3 p4p 4 reimbursement‐incentive 5 reimbursement‐incentives 6 payment‐incentive 7 payment‐incentives 8 payment‐reward 9 payment‐rewards 10 performance‐incentive 11 performance‐incentives 12 performance‐reward 13 performance‐rewards 14 performance‐payment 15 performance‐payments 16 performance‐based‐financing 17 result‐based‐payment 18 results‐based‐payment 19 result‐based‐payments 20 results‐based‐payments 21 result‐based‐funding 22 results‐based‐funding 23 result‐based‐financing 24 results‐based‐financing
Department for International Development (www.gov.uk/government/organisations/department‐for‐international‐development) (searched 20/09/2017)
ID Search 1 "pay for performance" 2 "p4p" 3 "reimbursement incentive" 4 "payment incentive" 5 "payment reward" 6 "performance incentive" 7 "performance reward" 8 "performance payment" 9 "performance based financing" 10 "result based payment" 11 "result based funding" 12 "result based financing"
Global Fund to Fight AIDS (www.theglobalfund.org/en/) (searched 15/09/2017)
ID Search 1 "pay for performance" 2 "paying for performance" 3 "p4p" 4 "reimbursement incentive" 5 "reimbursement incentives" 6 "payment incentive" 7 "payment incentives" 8 "payment reward" 9 "payment rewards" 10 "performance incentive" 11 "performance incentives" 12 "performance reward" 13 "performance rewards" 14 "performance payment" 15 "performance payments" 16 "performance based financing" 17 "result based payment" 18 "results based payment" 19 "result based payments" 20 "results based payments" 21 "result based funding" 22 "results based funding" 23 "result based financing" 24 "results based financing"
University of Cape Town (www.uct.ac.za/search/) (searched 18/09/2017)
ID Search 1 "pay for performance" 2 "paying for performance" 3 "p4p" 4 "reimbursement incentive" 5 "reimbursement incentives" 6 "payment incentive" 7 "payment incentives" 8 "payment reward" 9 "payment rewards" 10 "performance incentive" 11 "performance incentives" 12 "performance reward" 13 "performance rewards" 14 "performance payment" 15 "performance payments" 16 "performance based financing" 17 "result based payment" 18 "results based payment" 19 "result based payments" 20 "results based payments" 21 "result based funding" 22 "results based funding" 23 "result based financing" 24 "results based financing"
Kenya Institute of Policy Analysis and Research (IPAR) (iparkenya.blogspot.co.uk/) (searched 18/09/2017)
ID Search 1 "pay for performance" 2 "paying for performance" 3 "p4p" 4 "reimbursement incentive" 5 "reimbursement incentives" 6 "payment incentive" 7 "payment incentives" 8 "payment reward" 9 "payment rewards" 10 "performance incentive" 11 "performance incentives" 12 "performance reward" 13 "performance rewards" 14 "performance payment" 15 "performance payments" 16 "performance based financing" 17 "result based payment" 18 "results based payment" 19 "result based payments" 20 "results based payments" 21 "result based funding" 22 "results based funding" 23 "result based financing" 24 "results based financing"
Institute of Tropical Medicine Belgium (www.itg.be/E) (searched 20/09/2017)
ID Search 1 pay for performance 2 paying for performance 3 p4p 4 reimbursement incentive 5 reimbursement incentives 6 payment incentive 7 payment incentives 8 payment reward 9 payment rewards 10 performance incentive 11 performance incentives 12 performance reward 13 performance rewards 14 performance payment 15 performance payments 16 performance based financing 17 result based payment 18 results based payment 19 result based payments 20 results based payments 21 result based funding 22 results based funding 23 result based financing 24 results based financing
Appendix 5. Data extraction template
| Category | Extracted data | Page/Figure /Location in Text | Reviewer notes | Procedural notes |
| Doubts over inclusion? | ||||
| Comment on any inclusion criteria you think this paper may violate | If you have serious doubts, discuss before proceeding! | |||
| General descriptors | ||||
| Name of reviewer | ||||
| Date | dd/mm/yyyy | |||
| Study ID | surname of first author and year first full report of study was published e.g. Smith 2001 | |||
| Other reports of this study (entire reference) | ||||
| First author | Surname, Initial | |||
| Year of publication | yyyy | |||
| Publication type | ||||
| Report author contact details | Name; Email; Phone; Address | |||
| Data repository | ||||
| Funders of study | ||||
| Setting | ||||
| Country | Free text | |||
| PBF scheme | Exact data or NR or unclear (specify page) | |||
| Level at which PBF incentive is paid? | ||||
| How are the PBF incentives used and cascaded? | Describe the mechanism of payment to everyone involved | |||
| Scale of PBF intervention + rationale | Descriptive: e.g. national to X districts, or populations | |||
| Context | E.g. urban and rural, poverty levels, etc | |||
| Sector | E.g. public, private, mixes, faith based organizations | |||
| Clinical or population group targeted | E.g. MCH or TB patients or mothers attending with children under 5 | |||
| Type of PBF | ||||
| Who set the targets/how were the targets set? | E.g. Who made the decisions re: targets and based on what? | |||
| Payment frequency | ||||
| Payment formula | ||||
| Measurement of targets: how and where from? | E.g. Data source for measurement | |||
| Verification mechanisms | E.g. how is the data verified, by whom? | |||
| Magnitude of incentives | E.g price per indicator (if table then copy in separate sheet and link) | |||
| Relative size of incentive | E.g. compared to health worker salary, overall funding of health facility | |||
| Are incentives additional to normal wage/funding? | Extract data on the whole scheme budget + the facility/health worker incentive elements | |||
| Ancillary components: | Yes if done | |||
| Increased funding | ||||
| Increased health facility autonomy | ||||
| Training | ||||
| Supervision | ||||
| Supplies | ||||
| Technical support | ||||
| Management support | ||||
| Other quality improvement strategies | ||||
| Increasing salaries | ||||
| Construction of new facilities | ||||
| Improvements in information systems | ||||
| Changes in governance, priority setting or rationing | ||||
| Processes to involve stakeholders | Specify if consumers/others are involved | |||
| Complementary demand‐side incentives | ||||
| Other (specify) | ||||
| Overall cost | E.g. Per person budget or national cost of scheme | |||
| Source of funding | ||||
| More details | Optional to fill in | |||
| Impact evaluation: Participants, methods, data and analysis | ||||
| Type of study | ||||
| Aim of study | Describe aim | |||
| Location of care | ||||
| Sector | ||||
| Urban or rural areas? | ||||
| Choice of study setting selection | Describe why the study settings were chosen | |||
| Data | ||||
| Data collection methods | ||||
| Data source | E.g. house hold surveys, DHS | |||
| Who collected data? | E.g study authors, survey company, DHS etc | |||
| Time of baseline data collection | ||||
| Time of endline data collection | ||||
| Follow‐up of the PBF scheme | ||||
| Participants | ||||
| Level at which outcomes are assessed | ||||
| Description of patient‐group(s) affected by the intervention | Inclusion/exclusion criteria relating to participants | |||
| Total sample | ||||
| Number of providers | Specify number of health care workers | |||
| Number of patients | ||||
| Number of episodes of care | ||||
| Clustering level (overall) | Copy rows as much as needed to capture all clustering | |||
| Level 1 | From the most macro to micro | |||
| Units per level 1 | e.g. 17 households | |||
| Level 2 | ||||
| Units per level 2 | ||||
| Level 3 | ||||
| Units per level 3 | ||||
| Proportion of eligible providers (or allocation units) who participated in evaluation | ||||
| Other setting‐specific factors that may be of relevance when assessing external validity | ||||
| Analytic methods | ||||
| Unit of allocation (EPOC item: 6.1) | ||||
| Unit of analysis (EPOC item: 6.2) | ||||
| Power calculation (EPOC item: 6.3) | Score done if the study is powered; not done if underpowered; unclear if calculation missing + COPY calculation | |||
| Type of statistical analysis | ||||
| Equations | Copy it here! | |||
| Group descriptions | COPY OVER FOR EACH GROUP | |||
| Study arm/group | Intervention group 1 | |||
| Description of study arm/group intervention | E.g. scheme detailed above + payments to demand side OR control description | |||
| Participant characteristics in group | ||||
| Baseline | ||||
| Number of providers | ||||
| Number of patients | ||||
| Number of episodes of care | ||||
| Notes | Any notes on participant groups that may affect generalizability | |||
| Clustering level (overall) | Copy rows as much as needed to capture all clustering | |||
| Level 1 | e.g. households | |||
| Units per level 1 | e.g. 17 households | |||
| Level 2 | ||||
| Units per level 2 | ||||
| Endline (+ copy if needed for follow up) | ||||
| Number of providers | ||||
| Number of patients | ||||
| Number of episodes of care | ||||
| Notes | Any notes on participant groups that may affect generalizability | |||
| Clustering level (overall) | Copy rows as much as needed to capture all clustering | |||
| Level 1 | e.g. households | |||
| Units per level 1 | e.g. 17 households | |||
| Level 2 | ||||
| Units per level 2 | ||||
| More detail about intervention | If it deviates from the normal scheme then add in more info here | |||
| Results | COPY OVER FOR EACH OUTCOME | |||
| Type of outcome | ||||
| Specific indicator | List the exact indicator assessed | |||
| Summative findings | Interpretation of findings (direction, magnitude) | |||
| Explanatory notes | ||||
| Comments from authors | E.g. what to keep in mind when interpreting | |||
| Comments from us | ||||
| COPY THE RESULTS | ||||
| Overall interpretation/ implications | ||||
| Comments from authors | ||||
| Comments from us | ||||
| QUALITY CRITERIA: RISK OF BIAS (Cochrane EPOC, 'Suggested risk of bias criteria for EPOC reviews', 2017) | ||||
| Risk of bias for studies with a separate control group (randomized trials; non‐randomized trials; controlled before‐after studies) | ||||
| Random sequence generation | Score "Low risk" if a random component in the sequence generation process is described (e.g. Referring to a random number table). Score "High risk" when a nonrandom method is used (e.g. performed by date of admission). Non‐randomized trials and controlled before‐after studies should be scored "High risk". Score "Unclear risk" if not specified in the paper. | |||
| Allocation concealment | Score "Low risk" if the unit of allocation was by institution, team or professional and allocation was performed on all units at the start of the study; or if the unit of allocation was by patient or episode of care and there was some form of centralized randomization scheme, an on‐site computer system or sealed opaque envelopes were used. Controlled before‐after studies should be scored "High risk". Score "Unclear risk" if not specified in the paper. | |||
| Baseline outcome measurement similar | Score "Low risk" if performance or patient outcomes were measured prior to the intervention, and no important differences were present across study groups. In randomized trials, score "Low risk" if imbalanced but appropriate adjusted analysis was performed (e.g. Analysis of covariance). Score "High risk" if important differences were present and not adjusted for in analysis. If randomized trials have no baseline measure of outcome, score "Unclear risk". | |||
| Baseline characteristics similar | Score "Low risk" if baseline characteristics of the study and control providers are reported and similar. Score "Unclear risk" if it is not clear in the paper (e.g. characteristics are mentioned in text but no data were presented). Score "High risk" if there is no report of characteristics in text or tables or if there are differences between control and intervention providers. Note that in some cases imbalance in patient characteristics may be due to recruitment bias whereby the provider was responsible for recruiting patients into the trial. | |||
| Incomplete outcome data | Score "Low risk" if missing outcome measures were unlikely to bias the results (e.g. the proportion of missing data was similar in the intervention and control groups or the proportion of missing data was less than the effect size i.e. unlikely to overturn the study result). Score "High risk" if missing outcome data was likely to bias the results. Score "Unclear risk" if not specified in the paper (Do not assume 100% follow up unless stated explicitly). | |||
| Knowledge of the allocated interventions adequately prevented during study (blinding) | Score "Low risk" if the authors state explicitly that the primary outcome variables were assessed blindly, or the outcomes are objective, e.g. length of hospital stay. Primary outcomes are those variables that correspond to the primary hypothesis or question as defined by the authors. Score "High risk" if the outcomes were not assessed blindly. Score "Unclear risk" if not specified in the paper. | |||
| Protection against contamination | Score "Low risk" if allocation was by community, institution or practice and it is unlikely that the control group received the intervention. Score "High risk" if it is likely that the control group received the intervention (e.g. if patients rather than professionals were randomized). Score "Unclear risk" if professionals were allocated within a clinic or practice and it is possible that communication between intervention and control professionals could have occurred (e.g. physicians within practices were allocated to intervention or control) | |||
| Selective outcome reporting | Score "Low risk" if there is no evidence that outcomes were selectively reported (e.g. all relevant outcomes in the methods section are reported in the results section). Score "High risk" if some important outcomes are subsequently omitted from the results. Score "Unclear risk" if not specified in the paper. | |||
| Other risks of bias | Score "Low risk" if there is no evidence of other risk of biases. | |||
| Risk of bias for interrupted time series studies | ||||
| Intervention independent of other changes | Score "Low risk" if there are compelling arguments that the intervention occurred independently of other changes over time and the outcome was not influenced by other confounding variables/historic events during study period. If Events/variables identified, note what they are. Score "High risk" if reported that intervention was not independent of other changes in time. | |||
| Shape of the intervention effect pre‐specified | Score "Low risk" if point of analysis is the point of intervention OR a rational explanation for the shape of intervention effect was given by the author(s). Where appropriate, this should include an explanation if the point of analysis is NOT the point of intervention. Score "High risk" if it is clear that the condition above is not met. | |||
| Intervention unlikely to affect data collection | Score "Low risk" if reported that intervention itself was unlikely to affect data collection (for example, sources and methods of data collection were the same before and after the intervention); Score "High risk" if the intervention itself was likely to affect data collection (for example, any change in source or method of data collection reported). | |||
| Knowledge of the allocated interventions adequately prevented during the study | Score "Low risk" if the authors state explicitly that the primary outcome variables were assessed blindly, or the outcomes are objective, e.g. length of hospital stay. Primary outcomes are those variables that correspond to the primary hypothesis or question as defined by the authors. Score "High risk" if the outcomes were not assessed blindly. Score "Unclear risk" if not specified in the paper. | |||
| Incomplete outcome data adequately addressed | Score "Low risk" if missing outcome measures were unlikely to bias the results (e.g. the proportion of missing data was similar in the pre‐ and post‐intervention periods or the proportion of missing data was less than the effect size i.e. unlikely to overturn the study result). Score "High risk" if missing outcome data was likely to bias the results. Score "Unclear risk" if not specified in the paper (Do not assume 100% follow up unless stated explicitly). | |||
| Selective outcome reporting | Score "Low risk" if there is no evidence that outcomes were selectively reported (e.g. all relevant outcomes in the methods section are reported in the results section). Score "High risk" if some important outcomes are subsequently omitted from the results. Score "Unclear risk" if not specified in the paper. | |||
| Other risks of bias | Score "Low risk" if there is no evidence of other risk of biases. E.g. should consider if seasonality is an issue (i.e. if January to June comprises the pre‐intervention period and July to December the post, could the "seasons' have caused a spurious effect). | |||
Appendix 6. Risk of bias supporting judgements
Table 1. Risk of bias – studies with a control group
| Country | Study ID | Study design | Random sequence generation (low = random, high = not random, unclear if not specified) | Allocation concealment | Baseline outcome measurement similar | Baseline characteristics similar | Incomplete outcome data |
| Argentina | Gertler 2014 | CBA | High – as per guidance. | High – as per guidance. | Low – analysis methods adjusted for differences | Low except high for neonatal mortality (noted imbalance only for this outcome). | Low: paper mentioned missingness of 3%, similar across groups. Complete‐case analyses were conducted, which may compromise results but no reporting of missingness by outcome. |
| Burkina Faso | Steenland 2017 | CBA | High – as per guidance. | High – as per guidance. | Low – analysis methods adjusted for differences. | High – Table 1 suggested differences between comparison and intervention existed, e.g. number of health facilities/100,000 people consistently higher in intervention than in comparator group. | Low – see Appendix Table 4 of Steenland 2017. |
| Burundi | Bonfrer 2014a | CBA | High – as per guidance. | High – as per guidance. | Low – analysis methods adjusted for differences. | High – appendix Table 6 of Bonfrer 2014a suggests differences existed between the different districts, e.g. population characteristics (poverty) varied between 28.7% and 82.3%. | Unclear: not specified. |
| Bonfrer 2014b | CBA | High – as per guidance. | High – as per guidance. | Low – analysis methods adjusted for differences. | Low – comparable. | Unclear: not specified. | |
| Falisse 2015 | CBA | High – as per guidance. | High – as per guidance. | Low – analysis methods adjusted for differences. | High – data not presented. | Low – authors noted outcomes to focus on chosen based on completeness and sensitivity analyses conducted. | |
| Rudasingwa 2014 | CBA | High – as per guidance. | High – as per guidance. | Low – analysis methods adjusted for differences. | High – data not presented. | Low – authors noted outcomes to focus on chosen based on completeness. | |
| Cambodia | Van de Poel 2016 | CBA | High – as per guidance. | High – as per guidance. | Low – analysis methods adjusted for differences. | Low – comparable. | Unclear: not specified. |
| Cameroon | Zang 2015 | CBA | High – as per guidance. | High – as per guidance. | Low – analysis methods adjusted for differences. | Low – comparable. | Unclear: not specified. |
| China | Yao 2008 | CBA | High – as per guidance. | High – as per guidance. | Paper reanalyzed; reanalyzed results noted as low (analysis methods adjusted for differences). | High – Table 1 of Yao 2008 suggests the intervention was performed in areas that were more populated and poorer compared to control. | Unclear: not specified. |
| Democratic Republic of the Congo | Zeng 2018 | CBA | High – as per guidance. | High – as per guidance. | Low – analysis methods adjusted for differences. | High – Table 3 of Zeng 2018 suggests significant differences, e.g. in household size, daily spending and age of mother. | Unclear: not specified. |
| Soeters 2011 | CBA | High – as per guidance. | High – as per guidance. | Low – analysis methods adjusted for differences. | High – not specified. | Unclear: not specified. | |
| El Salvador | Bernal 2018 | CBA | High – as per guidance. | High – as per guidance. | Low – analysis methods adjusted for differences. | High – Table 2 and page 9 of Bernal 2018 highlight the differences between results‐based aid provinces and those with national funding. | Unclear: not specified. |
| Haiti | Zeng 2013 | CBA | High – as per guidance. | High – as per guidance. | Low – analysis methods adjusted for differences. | High – data not presented. | Unclear: not specified. |
| Multiple – Burkina Faso, Ghana and Tanzania | Duysburgh 2016 | CBA | High – as per guidance. | High – as per guidance. | Paper reanalyzed; reanalyzed results noted as low (analysis methods adjusted for differences). | High – appendix Table S1 of Duysburgh 2016 suggested differences between intervention and control sites but unclear what effect this would have on outcomes. | Unclear: not specified. |
| Tanzania | Binyaruka 2015 | CBA | High – as per guidance. | High – as per guidance. | Low – analysis methods adjusted for differences. | Low except for: ANC visits and IPT during ANC, outpatient visits per month < or > 5, patient assessments of staff kindness, probability of payment for delivery care, satisfaction with interpersonal care. | High: authors noted this may have biased results. |
| Binyaruka 2017 | CBA | High – as per guidance. | High – as per guidance. | Low – analysis methods adjusted for differences. | Low except for: availability and stockouts of medicines and medical supplies | Unclear: not specified. | |
| Binyaruka 2018b | CBA | High – as per guidance. | High – as per guidance. | Low – analysis methods adjusted for differences. | Low except for: ANC visits and IPT during ANC, outpatient visits per month < or > 5, patient assessments of staff kindness, probability of payment for delivery care, satisfaction with interpersonal care. | High: authors noted that this may have biased results. | |
| Mayumana 2017 | CBA | High – as per guidance. | High – as per guidance. | Low – analysis methods adjusted for differences. | Low except for: medical supply stockouts, disruptions due to broken equipment, governance outcomes (committee meetings, content of supervision, existence of community health fund). | High: authors noted that this may have biased results. | |
| Zimbabwe | Das 2017 | CBA | High – as per guidance. | High – as per guidance. | Low – analysis methods adjusted for differences. | Low – comparable. | High: subset analyses with particularly small samples. |
| Benin | Lagarde 2015 | Quasi/non‐randomized trial | Unclear: not specified. | Unclear: not specified. | High – analyses methods did not adjust for baseline differences in outcomes, but do adjusted for facility and health worker differences. | High – appendix Table 6 of Lagarde 2015 suggested differences exist between the different districts, e.g. population characteristics (poverty) varied between 28.7% and 82.3%. | Unclear: not specified. |
| Cameroon | de Walque 2017 | Quasi/non‐randomized trial | Low – sequence described in sufficient detail. | Low – assignment by province/district/cluster. | Low – analysis methods adjusted for differences. | Low – comparable. | Unclear: not specified. |
| China | Powell‐Jackson 2014 | Quasi/non‐randomized trial | High – no randomization, though matching occurred. | Low – assignment by province/district/cluster. | Low – analysis methods adjusted for differences. | Low – comparable. | Unclear: not specified. |
| Sun 2016 | Quasi/non‐randomized trial | High – randomization compromised. | Low – assignment by province/district/cluster. | Low – analysis methods adjusted for differences. | Low – comparable. | Unclear: not specified. | |
| Peru | Cruzado de la Vega 2017 | Quasi/non‐randomized trial | High – no randomization. | Low – assignment by province/district/cluster. | Low – analysis methods adjusted for differences. | Low – comparable. | Unclear: not specified. |
| Rwanda | Basinga 2011 | Quasi/non‐randomized trial | High – randomization compromised. | Low – assignment by province/district/cluster. | Low – analysis methods adjusted for differences. | Low – comparable. | Unclear: not specified. |
| Lannes 2016 | Quasi/non‐randomized trial | High – randomization compromised. | Low – assignment by province/district/cluster. | Low – analysis methods adjusted for differences. | Low – comparable. | Unclear: not specified. | |
| Priedeman Skiles 2013 | Quasi/non‐randomized trial | High – randomization compromised. | Low – assignment by province/district/cluster. | Low – analysis methods adjusted for differences. | Low – comparable. | Unclear: not specified. | |
| Priedeman Skiles 2015 | Quasi/non‐randomized trial | High – randomization compromised. | Low – assignment by province/district/cluster. | Low – analysis methods adjusted for differences. | Low – comparable. | Unclear: not specified. | |
| Sherry 2017 | Quasi/non‐randomized trial | High – randomization compromised. | Low – assignment by province/district/cluster. | Low – analysis methods adjusted for differences. | Low – comparable. | Unclear: not specified. | |
| Lannes 2015 | Quasi/non‐randomized trial | High – randomization compromised. | Low – assignment by province/district/cluster. | Unclear: not specified. | High – not specified. | Unclear: not specified, using data from Basinga 2011. | |
| Gertler 2013 | Quasi/non‐randomized trial | High – randomization compromised. | Low – assignment by province/district/cluster. | Low – analysis methods adjusted for differences. | Low – comparable. | Low – authors noted similar levels of attrition. | |
| de Walque 2015 | Quasi/non‐randomized trial | High – randomization compromised. | Low – assignment by province/district/cluster. | Low – analysis methods adjusted for differences. | Low – comparable. | Unclear: not specified. | |
| Swaziland | Kliner 2015 | Quasi/non‐randomized trial | High – no randomization. | High – allocation was pragmatic. | Low – analysis methods adjusted for differences. | High – Table 2 of Kliner 2015 suggested differences in populations and outcomes exist. | Unclear: not specified. |
| Tanzania | Brock 2018 | Quasi/non‐randomized trial | Low – sequence described in sufficient detail. | Low – assignment by healthcare professional, done after baseline assessment. | Low – comparable. | High – Tables 2 and 3 of Brock 2018 suggested some differences between providers and patients. | Low – dropout before assignment 12%, but after only 3%. |
| Zimbabwe | Friedman 2016b | Quasi/Non‐randomized trial | High – no randomization, though stratification and matching. | High – allocation was done by Ministry if Health via matching. | Low – analysis methods adjusted for differences. | Low – comparable. (Appendix 3 of Friedman 2016b tested parallel trends, though baseline characteristics were dissimilar at times). | Unclear: not specified (authors noted that for household expenditure data there was high missingness). |
| ANC: antenatal care; CBA: controlled before‐after; IPT: intermittent preventive treatment. | |||||||
Table 2. Risk of bias – interrupted time series studies
| Country | Study ID | Study design | Intervention independent of other changes | Shape of the intervention effect prespecified | Intervention unlikely to affect data collection | Knowledge of the allocated interventions adequately prevented during the study | Incomplete outcome data adequately addressed | Selective outcome reporting | Other risks of bias |
| Brazil | Viñuela 2015 | ITS | Unclear: other reforms were happening in the education and justice sectors that could have contributed as well. | Low – specified as per guidance. | Unclear: intervention may have affected data collection. | Low: unlikely allocation affected data collection. | Unclear: not specified. | Low | Note: data were aggregated at high level – this may have impacted analyses and findings. |
| Cambodia | Ir 2015 | ITS | High: multiple PBF reforms introduced alongside voucher schemes and changes to health service delivery (more trained professionals) also occurred. | High – as per guidance, effect shape not specified. | Unclear: intervention may have affected data collected as same source was used for payments and for outcome assessment. | Unclear: health workers themselves appeared to be reporting. | Unclear: not specified. | Low | Low |
| Khim 2018a | ITS | Unclear: not specified. | Low – specified as per guidance. | Unclear: intervention may have affected data collection. | Low: unlikely allocation affected data collection. | Unclear: not specified. | Low | Note: several other schemes were implemented at the same time and high variability in implementation of this scheme noted. | |
| Matsuoka 2014 | ITS | Unclear: not specified. | Low – specified as per guidance. | Unclear: intervention may have affected data collection. | Unclear: not specified. | Unclear: not specified. | Low | Note: data reanalyzed. | |
| China | Chang 2017 | ITS | High: other interventions concurrent (including further PBF and introduction of database). | Low – specified as per guidance. | High: intervention introduced alongside an HMIS intervention. | Unclear: not specified. | Unclear: not specified. | Low | Note: 3 PBF schemes implemented buy only 1 assessed. |
| Wu 2014 | ITS | Unclear: other reforms happening but robustness checks performed to ascertain impacts and effects were consistent. | Low – specified as per guidance. | Low: no effects on data collection. | Low: unlikely allocation affected data collection. | Unclear: not specified. | Low | Note: not generalizable, study conducted in 1 setting. | |
| Liu 2005 | ITS | High: other changes in the country likely to affect trends. | Low – specified as per guidance. | Low: no effects on data collection. | Low: blinded and random assessments. | Low: panel dataset. | Low | Low | |
| Rwanda | Rusa 2009a | ITS | High: other changes in the country (user fee removal) likely to affect trends. | Low – specified as per guidance. | Unclear: intervention may have affected data collection. | Unclear: not specified. | Unclear: not specified. | Low | Low |
| Zambia | Chansa 2015 | ITS | Unclear: not specified. | Low – specified as per guidance. | High: intervention introduced alongside audits. | Low: unlikely allocation affected data collection. | Low: HMIS data. | Low | Low |
| Malawi | McMahon 2016 | CBA and ITS | Unclear: not specified. | Low – specified as per guidance. | High: intervention directly targets improvements in data. | Unclear: not specified. | High: several indicators excluded due to missingness. | Low | Low |
| CBA: controlled before‐after; HMIS: health management information system; ITS: interrupted time series; PBF: performance‐based funding. | |||||||||
Characteristics of studies
Characteristics of included studies [ordered by study ID]
Basinga 2011.
| Study characteristics | ||
| Methods | For full details of this study, see Table 5; Table 6; Table 7; Table 8. | |
| Participants | ||
| Interventions | ||
| Outcomes | ||
| Notes | ||
| Risk of bias | ||
| Bias | Authors' judgement | Support for judgement |
| Random sequence generation (selection bias) | High risk | Randomization compromised. |
| Allocation concealment (selection bias) | Low risk | Assignment by province/district/cluster. |
| Blinding (performance bias and detection bias) All outcomes | Low risk | Blinded assessments. |
| Incomplete outcome data (attrition bias) All outcomes | Unclear risk | Not specified. |
| Selective reporting (reporting bias) | Low risk | No evidence of selective reporting. |
| Other bias | Low risk | No other apparent source of bias. |
| Baseline outcome measurement All outcomes | Low risk | Analysis methods adjusted for differences. |
| Matched characteristics for control study sites | Low risk | Comparable. |
| Protection against contamination (intervention and controls) | Low risk | Assignment by province/district/cluster. |
Bernal 2018.
| Study characteristics | ||
| Methods | For full details of this study, see Table 5; Table 6; Table 7; Table 8. | |
| Participants | ||
| Interventions | ||
| Outcomes | ||
| Notes | ||
| Risk of bias | ||
| Bias | Authors' judgement | Support for judgement |
| Random sequence generation (selection bias) | High risk | As per guidance. |
| Allocation concealment (selection bias) | High risk | As per guidance. |
| Blinding (performance bias and detection bias) All outcomes | Low risk | Bernal 2018 Section 6 outlines sensitivity analyses and details quality checks on data. |
| Incomplete outcome data (attrition bias) All outcomes | Unclear risk | Not specified. |
| Selective reporting (reporting bias) | Low risk | No evidence of selective reporting. |
| Other bias | Unclear risk | Reforms were taking place at the same time. |
| Baseline outcome measurement All outcomes | Low risk | Analysis methods adjusted for differences. |
| Matched characteristics for control study sites | High risk | Bernal 2018 Table 2 and page 9 highlight the differences between results‐based aid provinces and those with national funding. |
| Protection against contamination (intervention and controls) | Low risk | Assignment by province/district/cluster. |
Binyaruka 2015.
| Study characteristics | ||
| Methods | For full details of this study, see Table 5; Table 6; Table 7; Table 8. | |
| Participants | ||
| Interventions | ||
| Outcomes | ||
| Notes | ||
| Risk of bias | ||
| Bias | Authors' judgement | Support for judgement |
| Random sequence generation (selection bias) | High risk | As per guidance. |
| Allocation concealment (selection bias) | High risk | As per guidance. |
| Blinding (performance bias and detection bias) All outcomes | Low risk | Unlikely outcome assessment affected by allocation knowledge. |
| Incomplete outcome data (attrition bias) All outcomes | High risk | Authors note that this may have biased results. |
| Selective reporting (reporting bias) | Low risk | No evidence of selective reporting. |
| Other bias | Low risk | No other apparent source of bias. |
| Baseline outcome measurement All outcomes | Low risk | Analysis methods adjusted for differences. |
| Matched characteristics for control study sites | Low risk | Low except for: ANC visits and IPT during ANC, outpatient visits per month under/over 5, patient assessments of staff kindness, probability of payment for delivery care, satisfaction with interpersonal care. |
| Protection against contamination (intervention and controls) | Low risk | Assignment by province/district/cluster. |
Binyaruka 2017.
| Study characteristics | ||
| Methods | For full details of this study, see Table 5; Table 6; Table 7; Table 8. | |
| Participants | ||
| Interventions | ||
| Outcomes | ||
| Notes | ||
| Risk of bias | ||
| Bias | Authors' judgement | Support for judgement |
| Random sequence generation (selection bias) | High risk | As per guidance. |
| Allocation concealment (selection bias) | High risk | As per guidance. |
| Blinding (performance bias and detection bias) All outcomes | Low risk | Unlikely outcome assessment affected by allocation knowledge. |
| Incomplete outcome data (attrition bias) All outcomes | Unclear risk | Not specified. |
| Selective reporting (reporting bias) | Low risk | No evidence of selective reporting. |
| Other bias | Low risk | No other apparent source of bias. |
| Baseline outcome measurement All outcomes | Low risk | Analysis methods adjusted for differences. |
| Matched characteristics for control study sites | Low risk | Low except for: availability and stockouts of medicines and medical supplies. |
| Protection against contamination (intervention and controls) | Low risk | Assignment by province/district/cluster. |
Binyaruka 2018b.
| Study characteristics | ||
| Methods | For full details of this study, see Table 5; Table 6; Table 7; Table 8. | |
| Participants | ||
| Interventions | ||
| Outcomes | ||
| Notes | ||
| Risk of bias | ||
| Bias | Authors' judgement | Support for judgement |
| Random sequence generation (selection bias) | High risk | As per guidance. |
| Allocation concealment (selection bias) | High risk | As per guidance. |
| Blinding (performance bias and detection bias) All outcomes | Low risk | Unlikely outcome assessment affected by allocation knowledge. |
| Incomplete outcome data (attrition bias) All outcomes | High risk | Authors note that this may have biased results. |
| Selective reporting (reporting bias) | Low risk | No evidence of selective reporting. |
| Other bias | Low risk | No other apparent source of bias. |
| Baseline outcome measurement All outcomes | Low risk | Analysis methods adjusted for differences. |
| Matched characteristics for control study sites | Low risk | Low except for: ANC visits and IPT during ANC, outpatient visits per month under/over 5, patient assessments of staff kindness, probability of payment for delivery care, satisfaction with interpersonal care. |
| Protection against contamination (intervention and controls) | Low risk | Assignment by province/district/cluster. |
Bonfrer 2014a.
| Study characteristics | ||
| Methods | For full details of this study, see Table 5; Table 6; Table 7; Table 8. | |
| Participants | ||
| Interventions | ||
| Outcomes | ||
| Notes | ||
| Risk of bias | ||
| Bias | Authors' judgement | Support for judgement |
| Random sequence generation (selection bias) | High risk | As per guidance. |
| Allocation concealment (selection bias) | High risk | As per guidance. |
| Blinding (performance bias and detection bias) All outcomes | Low risk | Unlikely outcome assessment affected by allocation knowledge. |
| Incomplete outcome data (attrition bias) All outcomes | Unclear risk | Not specified. |
| Selective reporting (reporting bias) | Low risk | No evidence of selective reporting. |
| Other bias | Unclear risk | Authors recognized they only assessed impacts of 6/23 targeted services. |
| Baseline outcome measurement All outcomes | Low risk | Analysis methods adjusted for differences. |
| Matched characteristics for control study sites | High risk | Bonfrer 2014a Appendix Table 6 suggests differences existed between the different districts, e.g. population characteristics (poverty) varied between 28.7% and 82.3%. |
| Protection against contamination (intervention and controls) | Low risk | Assignment by province/district/cluster. |
Bonfrer 2014b.
| Study characteristics | ||
| Methods | For full details of this study, see Table 5; Table 6; Table 7; Table 8. | |
| Participants | ||
| Interventions | ||
| Outcomes | ||
| Notes | ||
| Risk of bias | ||
| Bias | Authors' judgement | Support for judgement |
| Random sequence generation (selection bias) | High risk | As per guidance. |
| Allocation concealment (selection bias) | High risk | As per guidance. |
| Blinding (performance bias and detection bias) All outcomes | Low risk | Blinded assessments. |
| Incomplete outcome data (attrition bias) All outcomes | Unclear risk | Not specified. |
| Selective reporting (reporting bias) | Low risk | No evidence of selective reporting. |
| Other bias | Unclear risk | Authors recognized they only assessed impacts of 6/23 targeted services. |
| Baseline outcome measurement All outcomes | Low risk | Analysis methods adjusted for differences. |
| Matched characteristics for control study sites | Low risk | Comparable. |
| Protection against contamination (intervention and controls) | Low risk | Assignment by province/district/cluster. |
Brock 2018.
| Study characteristics | ||
| Methods | For full details of this study, see Table 5; Table 6; Table 7; Table 8. | |
| Participants | ||
| Interventions | ||
| Outcomes | ||
| Notes | ||
| Risk of bias | ||
| Bias | Authors' judgement | Support for judgement |
| Random sequence generation (selection bias) | Low risk | Sequence described in sufficient detail. |
| Allocation concealment (selection bias) | Low risk | Assignment by healthcare professional after baseline assessment. |
| Blinding (performance bias and detection bias) All outcomes | Low risk | Blinded assessments. |
| Incomplete outcome data (attrition bias) All outcomes | Low risk | Dropout before assignment 12%, but after assignment only 3%. |
| Selective reporting (reporting bias) | Low risk | No evidence of selective reporting. |
| Other bias | Unclear risk | The initial design was changed given few clinicians saw sufficiently high number of patients to be of relevance. Initial provider pool convenience sample. |
| Baseline outcome measurement All outcomes | Low risk | Comparable. |
| Matched characteristics for control study sites | High risk | Brock 2018 Tables 2 and 3 suggested some differences between providers and patients. |
| Protection against contamination (intervention and controls) | Low risk | Assignment by healthcare professional. |
Celhay 2015.
| Study characteristics | ||
| Methods | For full details of this study, see Table 5; Table 6; Table 7; Table 8. | |
| Participants | ||
| Interventions | ||
| Outcomes | ||
| Notes | ||
| Risk of bias | ||
| Bias | Authors' judgement | Support for judgement |
| Random sequence generation (selection bias) | Low risk | Sequence described in sufficient detail. |
| Allocation concealment (selection bias) | Low risk | Assignment by province/district/cluster. |
| Blinding (performance bias and detection bias) All outcomes | Low risk | Unlikely outcome assessment affected by allocation knowledge. |
| Incomplete outcome data (attrition bias) All outcomes | Low risk | Authors used routine data and performed robustness analyses. |
| Selective reporting (reporting bias) | Low risk | No evidence of selective reporting. |
| Other bias | Low risk | No other apparent source of bias. |
| Baseline outcome measurement All outcomes | Low risk | Comparable. |
| Matched characteristics for control study sites | Low risk | Comparable. |
| Protection against contamination (intervention and controls) | Low risk | Assignment by province/district/cluster. |
Chang 2017.
| Study characteristics | ||
| Methods | For full details of this study, see Table 5; Table 6; Table 7; Table 8. | |
| Participants | ||
| Interventions | ||
| Outcomes | ||
| Notes | ||
| Risk of bias | ||
| Bias | Authors' judgement | Support for judgement |
| Blinding (performance bias and detection bias) All outcomes | Unclear risk | Not specified. |
| Selective reporting (reporting bias) | Low risk | No evidence of selective reporting. |
| Other bias | Unclear risk | 3 PBF schemes were implemented, only 1 assessed. |
| Intervention independent (ITS)? | High risk | Other interventions concurrent (including further PBF + introduction of database). |
| Shape of effect prespecified (ITS)? | Low risk | Specified as per guidance. |
| Unlikely to affect data collection (ITS)? | High risk | Intervention introduced alongside an HMIS intervention. |
| Incomplete outcome data addressed (ITS)? | Unclear risk | Not specified. |
Chansa 2015.
| Study characteristics | ||
| Methods | For full details of this study, see Table 5; Table 6; Table 7; Table 8. | |
| Participants | ||
| Interventions | ||
| Outcomes | ||
| Notes | ||
| Risk of bias | ||
| Bias | Authors' judgement | Support for judgement |
| Blinding (performance bias and detection bias) All outcomes | Low risk | Unlikely allocation affected data collection. |
| Selective reporting (reporting bias) | Low risk | No evidence of selective reporting. |
| Other bias | Low risk | No other apparent source of bias. |
| Intervention independent (ITS)? | Unclear risk | Not specified. |
| Shape of effect prespecified (ITS)? | Low risk | Specified as per guidance. |
| Unlikely to affect data collection (ITS)? | High risk | Intervention introduced alongside audits. |
| Incomplete outcome data addressed (ITS)? | Low risk | HMIS data. |
Cruzado de la Vega 2017.
| Study characteristics | ||
| Methods | For full details of this study, see Table 5; Table 6; Table 7; Table 8. | |
| Participants | ||
| Interventions | ||
| Outcomes | ||
| Notes | ||
| Risk of bias | ||
| Bias | Authors' judgement | Support for judgement |
| Random sequence generation (selection bias) | High risk | No randomization. |
| Allocation concealment (selection bias) | Low risk | Assignment by province/district/cluster. |
| Blinding (performance bias and detection bias) All outcomes | Low risk | Unlikely outcome assessment affected by allocation knowledge. |
| Incomplete outcome data (attrition bias) All outcomes | Unclear risk | Not specified. |
| Selective reporting (reporting bias) | Low risk | No evidence of selective reporting. |
| Other bias | Low risk | No other apparent source of bias. |
| Baseline outcome measurement All outcomes | Low risk | Analysis methods adjusted for differences. |
| Matched characteristics for control study sites | Low risk | Comparable. |
| Protection against contamination (intervention and controls) | Low risk | Assignment by province/district/cluster. |
Das 2017.
| Study characteristics | ||
| Methods | For full details of this study, see Table 5; Table 6; Table 7; Table 8. | |
| Participants | ||
| Interventions | ||
| Outcomes | ||
| Notes | ||
| Risk of bias | ||
| Bias | Authors' judgement | Support for judgement |
| Random sequence generation (selection bias) | High risk | As per guidance. |
| Allocation concealment (selection bias) | High risk | As per guidance. |
| Blinding (performance bias and detection bias) All outcomes | Unclear risk | Not specified. |
| Incomplete outcome data (attrition bias) All outcomes | High risk | Subset analyses with particularly small samples. |
| Selective reporting (reporting bias) | Low risk | No evidence of selective reporting. |
| Other bias | Low risk | No other apparent source of bias. |
| Baseline outcome measurement All outcomes | Low risk | Analysis methods adjusted for differences. |
| Matched characteristics for control study sites | Low risk | Comparable. |
| Protection against contamination (intervention and controls) | Low risk | Assignment by province/district/cluster. |
de Walque 2015.
| Study characteristics | ||
| Methods | For full details of this study, see Table 5; Table 6; Table 7; Table 8. | |
| Participants | ||
| Interventions | ||
| Outcomes | ||
| Notes | ||
| Risk of bias | ||
| Bias | Authors' judgement | Support for judgement |
| Random sequence generation (selection bias) | High risk | Randomization compromised. |
| Allocation concealment (selection bias) | Low risk | Assignment by province/district/cluster. |
| Blinding (performance bias and detection bias) All outcomes | Low risk | Blinded assessments. |
| Incomplete outcome data (attrition bias) All outcomes | Unclear risk | Not specified. |
| Selective reporting (reporting bias) | Low risk | No evidence of selective reporting. |
| Other bias | Low risk | No other apparent source of bias. |
| Baseline outcome measurement All outcomes | Low risk | Analysis methods adjusted for differences. |
| Matched characteristics for control study sites | Low risk | Comparable. |
| Protection against contamination (intervention and controls) | Low risk | Assignment by province/district/cluster. |
de Walque 2017.
| Study characteristics | ||
| Methods | For full details of this study, see Table 5; Table 6; Table 7; Table 8. | |
| Participants | ||
| Interventions | ||
| Outcomes | ||
| Notes | ||
| Risk of bias | ||
| Bias | Authors' judgement | Support for judgement |
| Random sequence generation (selection bias) | Low risk | Sequence described in sufficient detail. |
| Allocation concealment (selection bias) | Low risk | Assignment by province/district/cluster. |
| Blinding (performance bias and detection bias) All outcomes | Unclear risk | Not specified. |
| Incomplete outcome data (attrition bias) All outcomes | Unclear risk | Not specified. |
| Selective reporting (reporting bias) | Low risk | No evidence of selective reporting. |
| Other bias | Low risk | No other apparent source of bias. |
| Baseline outcome measurement All outcomes | Low risk | Analysis methods adjusted for differences. |
| Matched characteristics for control study sites | Low risk | Comparable. |
| Protection against contamination (intervention and controls) | Low risk | Assignment by province/district/cluster. |
Duysburgh 2016.
| Study characteristics | ||
| Methods | For full details of this study, see Table 5; Table 6; Table 7; Table 8. | |
| Participants | ||
| Interventions | ||
| Outcomes | ||
| Notes | ||
| Risk of bias | ||
| Bias | Authors' judgement | Support for judgement |
| Random sequence generation (selection bias) | High risk | As per guidance. |
| Allocation concealment (selection bias) | High risk | As per guidance. |
| Blinding (performance bias and detection bias) All outcomes | Low risk | Indicators assessed objectively by trained health workers not working in assessed facilities. |
| Incomplete outcome data (attrition bias) All outcomes | Unclear risk | Not specified. |
| Selective reporting (reporting bias) | Low risk | No evidence of selective reporting. |
| Other bias | Unclear risk | This was reanalyzed because initial analyses were inappropriate and did not account for baseline differences. |
| Baseline outcome measurement All outcomes | Unclear risk | Paper reanalyzed; reanalyzed results noted as low (analysis methods adjusted for differences). |
| Matched characteristics for control study sites | High risk | Duysburgh 2016 Appendix Table S1 suggests differences between intervention and control sites but unclear what effect this would have on outcomes. |
| Protection against contamination (intervention and controls) | Low risk | Assignment by province/district/cluster. |
Engineer 2016.
| Study characteristics | ||
| Methods | For full details of this study, see Table 5; Table 6; Table 7; Table 8. | |
| Participants | ||
| Interventions | ||
| Outcomes | ||
| Notes | ||
| Risk of bias | ||
| Bias | Authors' judgement | Support for judgement |
| Random sequence generation (selection bias) | Low risk | Sequence described in sufficient detail. |
| Allocation concealment (selection bias) | Low risk | Assignment by province/district/cluster. |
| Blinding (performance bias and detection bias) All outcomes | Low risk | Blinded assessments. |
| Incomplete outcome data (attrition bias) All outcomes | Unclear risk | Not specified. |
| Selective reporting (reporting bias) | Low risk | No evidence of selective reporting. |
| Other bias | Low risk | No other apparent source of bias. |
| Baseline outcome measurement All outcomes | Low risk | Analysis methods adjusted for differences. |
| Matched characteristics for control study sites | Low risk | Comparable. |
| Protection against contamination (intervention and controls) | Low risk | Assignment by province/district/cluster. |
Falisse 2015.
| Study characteristics | ||
| Methods | For full details of this study, see Table 5; Table 6; Table 7; Table 8. | |
| Participants | ||
| Interventions | ||
| Outcomes | ||
| Notes | ||
| Risk of bias | ||
| Bias | Authors' judgement | Support for judgement |
| Random sequence generation (selection bias) | High risk | As per guidance. |
| Allocation concealment (selection bias) | High risk | As per guidance. |
| Blinding (performance bias and detection bias) All outcomes | Low risk | Blinded assessments. |
| Incomplete outcome data (attrition bias) All outcomes | Low risk | Authors noted outcomes to focus on chosen based on completeness and sensitivity analyses conducted. |
| Selective reporting (reporting bias) | Low risk | No evidence of selective reporting. |
| Other bias | Unclear risk | Authors chose which indicators to report on based on data availability. |
| Baseline outcome measurement All outcomes | Low risk | Analysis methods adjusted for differences. |
| Matched characteristics for control study sites | High risk | Data not presented. |
| Protection against contamination (intervention and controls) | Low risk | Assignment by province/district/cluster. |
Friedman 2016a.
| Study characteristics | ||
| Methods | For full details of this study, see Table 5; Table 6; Table 7; Table 8. | |
| Participants | ||
| Interventions | ||
| Outcomes | ||
| Notes | ||
| Risk of bias | ||
| Bias | Authors' judgement | Support for judgement |
| Random sequence generation (selection bias) | Low risk | Sequence described in sufficient detail. |
| Allocation concealment (selection bias) | Low risk | Assignment by province/district/cluster. |
| Blinding (performance bias and detection bias) All outcomes | Low risk | Unlikely outcome assessment affected by allocation knowledge. |
| Incomplete outcome data (attrition bias) All outcomes | High risk | Authors noted that high data collection costs meant that population‐based data were only included in 18/30 study districts. |
| Selective reporting (reporting bias) | Low risk | No evidence of selective reporting. |
| Other bias | Low risk | No other apparent source of bias. |
| Baseline outcome measurement All outcomes | Low risk | Analysis methods adjusted for differences. |
| Matched characteristics for control study sites | High risk | Not specified. |
| Protection against contamination (intervention and controls) | Low risk | Assignment by province/district/cluster. |
Friedman 2016b.
| Study characteristics | ||
| Methods | For full details of this study, see Table 5; Table 6; Table 7; Table 8. | |
| Participants | ||
| Interventions | ||
| Outcomes | ||
| Notes | ||
| Risk of bias | ||
| Bias | Authors' judgement | Support for judgement |
| Random sequence generation (selection bias) | High risk | No randomization, though stratification and matching. |
| Allocation concealment (selection bias) | High risk | Allocation was done by MoH via matching. |
| Blinding (performance bias and detection bias) All outcomes | Low risk | Unlikely outcome assessment affected by allocation knowledge. |
| Incomplete outcome data (attrition bias) All outcomes | Unclear risk | Not specified (authors noted that for household expenditure data there was high missingness). |
| Selective reporting (reporting bias) | Low risk | No evidence of selective reporting. |
| Other bias | Low risk | No other apparent source of bias. |
| Baseline outcome measurement All outcomes | Low risk | Analysis methods adjusted for differences. |
| Matched characteristics for control study sites | Low risk | Comparable (Friedman 2016b Appendix 3 tested parallel trends, though baseline characteristics were dissimilar at times). |
| Protection against contamination (intervention and controls) | Low risk | Assignment by province/district/cluster. |
Gertler 2013.
| Study characteristics | ||
| Methods | For full details of this study, see Table 5; Table 6; Table 7; Table 8. | |
| Participants | ||
| Interventions | ||
| Outcomes | ||
| Notes | ||
| Risk of bias | ||
| Bias | Authors' judgement | Support for judgement |
| Random sequence generation (selection bias) | High risk | Randomization compromised. |
| Allocation concealment (selection bias) | Low risk | Assignment by province/district/cluster. |
| Blinding (performance bias and detection bias) All outcomes | Low risk | Unlikely outcome assessment affected by allocation knowledge. |
| Incomplete outcome data (attrition bias) All outcomes | Low risk | Authors noted similar levels of attrition. |
| Selective reporting (reporting bias) | Low risk | No evidence of selective reporting. |
| Other bias | Low risk | No other apparent source of bias. |
| Baseline outcome measurement All outcomes | Low risk | Analysis methods adjusted for differences. |
| Matched characteristics for control study sites | Low risk | Comparable. |
| Protection against contamination (intervention and controls) | Low risk | Assignment by province/district/cluster. |
Gertler 2014.
| Study characteristics | ||
| Methods | For full details of this study, see Table 5; Table 6; Table 7; Table 8. | |
| Participants | ||
| Interventions | ||
| Outcomes | ||
| Notes | ||
| Risk of bias | ||
| Bias | Authors' judgement | Support for judgement |
| Random sequence generation (selection bias) | High risk | As per guidance. |
| Allocation concealment (selection bias) | High risk | As per guidance. |
| Blinding (performance bias and detection bias) All outcomes | Low risk | Indicators assessed objectively. |
| Incomplete outcome data (attrition bias) All outcomes | Low risk | Paper mentioned missingness of 3%, similar across groups. Complete‐case analyses were conducted, which may have compromised results but no reporting of missingness by outcome. |
| Selective reporting (reporting bias) | Low risk | No evidence of selective reporting. |
| Other bias | Low risk | No other apparent source of bias. |
| Baseline outcome measurement All outcomes | Low risk | Analysis methods adjusted for differences. |
| Matched characteristics for control study sites | Low risk | Low except high for neonatal mortality (noted imbalance only for this outcome). |
| Protection against contamination (intervention and controls) | Low risk | Assignment by province/district/cluster. |
Huillery 2017.
| Study characteristics | ||
| Methods | For full details of this study, see Table 5; Table 6; Table 7; Table 8. | |
| Participants | ||
| Interventions | ||
| Outcomes | ||
| Notes | ||
| Risk of bias | ||
| Bias | Authors' judgement | Support for judgement |
| Random sequence generation (selection bias) | Low risk | Sequence described in sufficient detail. |
| Allocation concealment (selection bias) | Low risk | Assignment by province/district/cluster. |
| Blinding (performance bias and detection bias) All outcomes | Low risk | Unlikely outcome assessment affected by allocation knowledge. |
| Incomplete outcome data (attrition bias) All outcomes | Unclear risk | Not specified. |
| Selective reporting (reporting bias) | Low risk | No evidence of selective reporting. |
| Other bias | Low risk | No other apparent source of bias. |
| Baseline outcome measurement All outcomes | Low risk | Comparable (see Huillery 2017 Appendix). |
| Matched characteristics for control study sites | Low risk | Comparable (see Huillery 2017 Appendix). |
| Protection against contamination (intervention and controls) | Low risk | Assignment by province/district/cluster. |
Ir 2015.
| Study characteristics | ||
| Methods | For full details of this study, see Table 5; Table 6; Table 7; Table 8. | |
| Participants | ||
| Interventions | ||
| Outcomes | ||
| Notes | ||
| Risk of bias | ||
| Bias | Authors' judgement | Support for judgement |
| Blinding (performance bias and detection bias) All outcomes | Unclear risk | Health workers themselves appeared to be reporting. |
| Selective reporting (reporting bias) | Low risk | No evidence of selective reporting. |
| Other bias | Low risk | No other apparent source of bias. |
| Intervention independent (ITS)? | High risk | Multiple PBF reforms introduced alongside voucher schemes, changes to health service delivery (more trained professionals) also occurred. |
| Shape of effect prespecified (ITS)? | High risk | As per guidance, effect shape not specified. |
| Unlikely to affect data collection (ITS)? | Unclear risk | Intervention may have affected data collected as same source was used for payments and for outcome assessment. |
| Incomplete outcome data addressed (ITS)? | Unclear risk | Not specified. |
Khim 2018a.
| Study characteristics | ||
| Methods | For full details of this study, see Table 5; Table 6; Table 7; Table 8. | |
| Participants | ||
| Interventions | ||
| Outcomes | ||
| Notes | ||
| Risk of bias | ||
| Bias | Authors' judgement | Support for judgement |
| Blinding (performance bias and detection bias) All outcomes | Low risk | Unlikely allocation affected data collection. |
| Selective reporting (reporting bias) | Low risk | No evidence of selective reporting. |
| Other bias | Unclear risk | Several other schemes were implemented at the same time and high variability in implementation of this scheme noted. |
| Intervention independent (ITS)? | Unclear risk | Not specified. |
| Shape of effect prespecified (ITS)? | Low risk | Specified as per guidance. |
| Unlikely to affect data collection (ITS)? | Unclear risk | Intervention may have affected data collection. |
| Incomplete outcome data addressed (ITS)? | Unclear risk | Not specified. |
Kliner 2015.
| Study characteristics | ||
| Methods | For full details of this study, see Table 5; Table 6; Table 7; Table 8. | |
| Participants | ||
| Interventions | ||
| Outcomes | ||
| Notes | ||
| Risk of bias | ||
| Bias | Authors' judgement | Support for judgement |
| Random sequence generation (selection bias) | High risk | No randomization. |
| Allocation concealment (selection bias) | High risk | Allocation was pragmatic. |
| Blinding (performance bias and detection bias) All outcomes | Low risk | Unlikely outcome assessment affected by allocation knowledge. |
| Incomplete outcome data (attrition bias) All outcomes | Unclear risk | Not specified. |
| Selective reporting (reporting bias) | Low risk | No evidence of selective reporting. |
| Other bias | Unclear risk | We are unclear if this is a CBA study or a quasi‐non randomized trial (the authors themselves described both as randomized and then as 'randomization not possible') + this is not going to be generalizable, given it was in 1 main hospital population. |
| Baseline outcome measurement All outcomes | Low risk | Analysis methods adjusted for differences. |
| Matched characteristics for control study sites | High risk | Kliner 2015 Table 2 suggested differences in populations and outcomes existed. |
| Protection against contamination (intervention and controls) | High risk | Allocation was pragmatic and unclear how patients moving would have been dealt with. |
Lagarde 2015.
| Study characteristics | ||
| Methods | For full details of this study, see Table 5; Table 6; Table 7; Table 8. | |
| Participants | ||
| Interventions | ||
| Outcomes | ||
| Notes | ||
| Risk of bias | ||
| Bias | Authors' judgement | Support for judgement |
| Random sequence generation (selection bias) | Unclear risk | Not specified. |
| Allocation concealment (selection bias) | Unclear risk | Not specified. |
| Blinding (performance bias and detection bias) All outcomes | Unclear risk | Not specified. |
| Incomplete outcome data (attrition bias) All outcomes | Unclear risk | Not specified. |
| Selective reporting (reporting bias) | Low risk | No evidence of selective reporting. |
| Other bias | Unclear risk | Authors specified ceiling effects for some outcomes. |
| Baseline outcome measurement All outcomes | High risk | Analyses methods did not adjust for baseline differences in outcomes, but did adjust for facility and health worker differences. |
| Matched characteristics for control study sites | High risk | Lagarde 2015 Appendix Table 6 suggests differences existed between the different districts, e.g. population characteristics (poverty) varied between 28.7% and 82.3%. |
| Protection against contamination (intervention and controls) | Low risk | Assignment by province/district/cluster. |
Lannes 2015.
| Study characteristics | ||
| Methods | For full details of this study, see Table 5; Table 6; Table 7; Table 8. | |
| Participants | ||
| Interventions | ||
| Outcomes | ||
| Notes | ||
| Risk of bias | ||
| Bias | Authors' judgement | Support for judgement |
| Random sequence generation (selection bias) | High risk | Randomization compromised. |
| Allocation concealment (selection bias) | Low risk | Assignment by province/district/cluster. |
| Blinding (performance bias and detection bias) All outcomes | Low risk | Blinded assessments. |
| Incomplete outcome data (attrition bias) All outcomes | Unclear risk | Not specified, using data from Basinga 2011. |
| Selective reporting (reporting bias) | Low risk | No evidence of selective reporting. |
| Other bias | Low risk | No other apparent source of bias. |
| Baseline outcome measurement All outcomes | Unclear risk | Not specified. |
| Matched characteristics for control study sites | High risk | Not specified. |
| Protection against contamination (intervention and controls) | Low risk | Assignment by province/district/cluster. |
Lannes 2016.
| Study characteristics | ||
| Methods | For full details of this study, see Table 5; Table 6; Table 7; Table 8. | |
| Participants | ||
| Interventions | ||
| Outcomes | ||
| Notes | ||
| Risk of bias | ||
| Bias | Authors' judgement | Support for judgement |
| Random sequence generation (selection bias) | High risk | Randomization compromised. |
| Allocation concealment (selection bias) | Low risk | Assignment by province/district/cluster. |
| Blinding (performance bias and detection bias) All outcomes | Low risk | Blinded assessments. |
| Incomplete outcome data (attrition bias) All outcomes | Unclear risk | Not specified. |
| Selective reporting (reporting bias) | Low risk | No evidence of selective reporting. |
| Other bias | Low risk | No other apparent source of bias. |
| Baseline outcome measurement All outcomes | Low risk | Analysis methods adjusted for differences. |
| Matched characteristics for control study sites | Low risk | Comparable. |
| Protection against contamination (intervention and controls) | Low risk | Assignment by province/district/cluster. |
Liu 2005.
| Study characteristics | ||
| Methods | For full details of this study, see Table 5; Table 6; Table 7; Table 8. | |
| Participants | ||
| Interventions | ||
| Outcomes | ||
| Notes | ||
| Risk of bias | ||
| Bias | Authors' judgement | Support for judgement |
| Blinding (performance bias and detection bias) All outcomes | Low risk | Blinded and random assessments. |
| Selective reporting (reporting bias) | Low risk | No evidence of selective reporting. |
| Other bias | Low risk | No other apparent source of bias. |
| Intervention independent (ITS)? | High risk | Other changes in the country likely to affect trends. |
| Shape of effect prespecified (ITS)? | Low risk | Specified as per guidance. |
| Unlikely to affect data collection (ITS)? | Low risk | No effects on data collection. |
| Incomplete outcome data addressed (ITS)? | Low risk | Panel dataset. |
Matsuoka 2014.
| Study characteristics | ||
| Methods | For full details of this study, see Table 5; Table 6; Table 7; Table 8. | |
| Participants | ||
| Interventions | ||
| Outcomes | ||
| Notes | ||
| Risk of bias | ||
| Bias | Authors' judgement | Support for judgement |
| Blinding (performance bias and detection bias) All outcomes | Unclear risk | Not specified. |
| Selective reporting (reporting bias) | Low risk | No evidence of selective reporting. |
| Other bias | Unclear risk | Note: data reanalyzed. |
| Intervention independent (ITS)? | Unclear risk | Not specified. |
| Shape of effect prespecified (ITS)? | Low risk | Specified as per guidance. |
| Unlikely to affect data collection (ITS)? | Unclear risk | Intervention may have affected data collection. |
| Incomplete outcome data addressed (ITS)? | Unclear risk | Not specified. |
Mayumana 2017.
| Study characteristics | ||
| Methods | For full details of this study, see Table 5; Table 6; Table 7; Table 8. | |
| Participants | ||
| Interventions | ||
| Outcomes | ||
| Notes | ||
| Risk of bias | ||
| Bias | Authors' judgement | Support for judgement |
| Random sequence generation (selection bias) | High risk | As per guidance. |
| Allocation concealment (selection bias) | High risk | As per guidance. |
| Blinding (performance bias and detection bias) All outcomes | Unclear risk | Not specified. |
| Incomplete outcome data (attrition bias) All outcomes | High risk | Authors noted that this may have biased results. |
| Selective reporting (reporting bias) | Low risk | No evidence of selective reporting. |
| Other bias | Low risk | No other apparent source of bias. |
| Baseline outcome measurement All outcomes | Low risk | Analysis methods adjusted for differences. |
| Matched characteristics for control study sites | Low risk | Low except for: medical supply stockouts, disruptions due to broken equipment, governance outcomes (committee meetings, content of supervision, existence of community health fund). |
| Protection against contamination (intervention and controls) | Low risk | Assignment by province/district/cluster. |
McMahon 2016.
| Study characteristics | ||
| Methods | For full details of this study, see Table 5; Table 6; Table 7; Table 8. | |
| Participants | ||
| Interventions | ||
| Outcomes | ||
| Notes | ||
| Risk of bias | ||
| Bias | Authors' judgement | Support for judgement |
| Blinding (performance bias and detection bias) All outcomes | Unclear risk | Not specified. |
| Selective reporting (reporting bias) | Low risk | No evidence of selective reporting. |
| Other bias | Low risk | No other apparent source of bias. |
| Intervention independent (ITS)? | Unclear risk | Not specified. |
| Shape of effect prespecified (ITS)? | Low risk | Specified as per guidance. |
| Unlikely to affect data collection (ITS)? | High risk | Intervention directly targets improvements in data. |
| Incomplete outcome data addressed (ITS)? | High risk | Several indicators excluded due to missingness. |
Menya 2015.
| Study characteristics | ||
| Methods | For full details of this study, see Table 5; Table 6; Table 7; Table 8. | |
| Participants | ||
| Interventions | ||
| Outcomes | ||
| Notes | ||
| Risk of bias | ||
| Bias | Authors' judgement | Support for judgement |
| Random sequence generation (selection bias) | Low risk | Sequence described in sufficient detail. |
| Allocation concealment (selection bias) | Low risk | Assignment by province/district/cluster. |
| Blinding (performance bias and detection bias) All outcomes | Low risk | Unlikely outcome assessment affected by allocation knowledge. |
| Incomplete outcome data (attrition bias) All outcomes | Unclear risk | 1 facility excluded due to discontinuation (no laboratory technician available). |
| Selective reporting (reporting bias) | Low risk | No evidence of selective reporting. |
| Other bias | Low risk | No other apparent source of bias. |
| Baseline outcome measurement All outcomes | Unclear risk | Not specified. |
| Matched characteristics for control study sites | High risk | Menya 2015 Table 2 suggestive of differences between facilities and coverage. |
| Protection against contamination (intervention and controls) | Low risk | Assignment by province/district/cluster. |
Mohanan 2017.
| Study characteristics | ||
| Methods | For full details of this study, see Table 5; Table 6; Table 7; Table 8. | |
| Participants | ||
| Interventions | ||
| Outcomes | ||
| Notes | ||
| Risk of bias | ||
| Bias | Authors' judgement | Support for judgement |
| Random sequence generation (selection bias) | Low risk | Sequence described in sufficient detail. |
| Allocation concealment (selection bias) | Low risk | Assignment by healthcare professional. |
| Blinding (performance bias and detection bias) All outcomes | Low risk | Unlikely outcome assessment affected by allocation knowledge. |
| Incomplete outcome data (attrition bias) All outcomes | Unclear risk | Not specified. |
| Selective reporting (reporting bias) | Low risk | No evidence of selective reporting. |
| Other bias | Low risk | No other apparent source of bias. |
| Baseline outcome measurement All outcomes | Unclear risk | Not specified. |
| Matched characteristics for control study sites | Low risk | Comparable (see Mohanan 2017 Appendix). |
| Protection against contamination (intervention and controls) | Unclear risk | Contamination could have occurred. |
Peabody 2011a.
| Study characteristics | ||
| Methods | For full details of this study, see Table 5; Table 6; Table 7; Table 8. | |
| Participants | ||
| Interventions | ||
| Outcomes | ||
| Notes | ||
| Risk of bias | ||
| Bias | Authors' judgement | Support for judgement |
| Random sequence generation (selection bias) | Low risk | Sequence described in sufficient detail. |
| Allocation concealment (selection bias) | Low risk | Assignment by province/district/cluster. |
| Blinding (performance bias and detection bias) All outcomes | Low risk | Blinded assessments. |
| Incomplete outcome data (attrition bias) All outcomes | Unclear risk | Not specified. |
| Selective reporting (reporting bias) | Low risk | No evidence of selective reporting. |
| Other bias | Low risk | No other apparent source of bias. |
| Baseline outcome measurement All outcomes | Low risk | Analysis methods adjusted for differences. |
| Matched characteristics for control study sites | High risk | Peabody 2011 Table 1 suggested differences in providers. |
| Protection against contamination (intervention and controls) | Low risk | Assignment by province/district/cluster. |
Peabody 2014.
| Study characteristics | ||
| Methods | For full details of this study, see Table 5; Table 6; Table 7; Table 8. | |
| Participants | ||
| Interventions | ||
| Outcomes | ||
| Notes | ||
| Risk of bias | ||
| Bias | Authors' judgement | Support for judgement |
| Random sequence generation (selection bias) | Low risk | Sequence described in sufficient detail. |
| Allocation concealment (selection bias) | Low risk | Assignment by province/district/cluster. |
| Blinding (performance bias and detection bias) All outcomes | Low risk | Unlikely outcome assessment affected by allocation knowledge. |
| Incomplete outcome data (attrition bias) All outcomes | Unclear risk | Not specified. |
| Selective reporting (reporting bias) | Low risk | No evidence of selective reporting. |
| Other bias | Unclear risk | Outcome specified as 'not wasting' affected by seasonal variations. |
| Baseline outcome measurement All outcomes | Low risk | Analysis methods adjusted for differences. |
| Matched characteristics for control study sites | Low risk | Comparable. |
| Protection against contamination (intervention and controls) | Low risk | Assignment by province/district/cluster. |
Powell‐Jackson 2014.
| Study characteristics | ||
| Methods | For full details of this study, see Table 5; Table 6; Table 7; Table 8. | |
| Participants | ||
| Interventions | ||
| Outcomes | ||
| Notes | ||
| Risk of bias | ||
| Bias | Authors' judgement | Support for judgement |
| Random sequence generation (selection bias) | High risk | No randomization, though matching occurred. |
| Allocation concealment (selection bias) | Low risk | Assignment by province/district/cluster. |
| Blinding (performance bias and detection bias) All outcomes | Unclear risk | Not specified. |
| Incomplete outcome data (attrition bias) All outcomes | Unclear risk | Not specified. |
| Selective reporting (reporting bias) | Low risk | No evidence of selective reporting. |
| Other bias | Unclear risk | 1 year into scheme so early impacts. |
| Baseline outcome measurement All outcomes | Low risk | Analysis methods adjusted for differences. |
| Matched characteristics for control study sites | Low risk | Comparable. |
| Protection against contamination (intervention and controls) | Low risk | Assignment by province/district/cluster. |
Priedeman Skiles 2013.
| Study characteristics | ||
| Methods | For full details of this study, see Table 5; Table 6; Table 7; Table 8. | |
| Participants | ||
| Interventions | ||
| Outcomes | ||
| Notes | ||
| Risk of bias | ||
| Bias | Authors' judgement | Support for judgement |
| Random sequence generation (selection bias) | High risk | Randomization compromised. |
| Allocation concealment (selection bias) | Low risk | Assignment by province/district/cluster. |
| Blinding (performance bias and detection bias) All outcomes | Low risk | Unlikely outcome assessment affected by allocation knowledge. |
| Incomplete outcome data (attrition bias) All outcomes | Unclear risk | Not specified. |
| Selective reporting (reporting bias) | Low risk | No evidence of selective reporting. |
| Other bias | Unclear risk | Rollout of community‐based health insure may be affecting equity outcomes in particular. |
| Baseline outcome measurement All outcomes | Low risk | Analysis methods adjusted for differences. |
| Matched characteristics for control study sites | Low risk | Comparable. |
| Protection against contamination (intervention and controls) | Low risk | Assignment by province/district/cluster. |
Priedeman Skiles 2015.
| Study characteristics | ||
| Methods | For full details of this study, see Table 5; Table 6; Table 7; Table 8. | |
| Participants | ||
| Interventions | ||
| Outcomes | ||
| Notes | ||
| Risk of bias | ||
| Bias | Authors' judgement | Support for judgement |
| Random sequence generation (selection bias) | High risk | Randomization compromised. |
| Allocation concealment (selection bias) | Low risk | Assignment by province/district/cluster. |
| Blinding (performance bias and detection bias) All outcomes | Low risk | Unlikely outcome assessment affected by allocation knowledge. |
| Incomplete outcome data (attrition bias) All outcomes | Unclear risk | Not specified. |
| Selective reporting (reporting bias) | Low risk | No evidence of selective reporting. |
| Other bias | Unclear risk | Assessment time may have been too short, seasonal variations also relevant. |
| Baseline outcome measurement All outcomes | Low risk | Analysis methods adjusted for differences. |
| Matched characteristics for control study sites | Low risk | Comparable. |
| Protection against contamination (intervention and controls) | Low risk | Assignment by province/district/cluster. |
Quimbo 2016.
| Study characteristics | ||
| Methods | For full details of this study, see Table 5; Table 6; Table 7; Table 8. | |
| Participants | ||
| Interventions | ||
| Outcomes | ||
| Notes | ||
| Risk of bias | ||
| Bias | Authors' judgement | Support for judgement |
| Random sequence generation (selection bias) | Low risk | Sequence described in sufficient detail. |
| Allocation concealment (selection bias) | Low risk | Assignment by province/district/cluster. |
| Blinding (performance bias and detection bias) All outcomes | Low risk | Blinded assessments. |
| Incomplete outcome data (attrition bias) All outcomes | Unclear risk | Not specified. |
| Selective reporting (reporting bias) | Low risk | No evidence of selective reporting. |
| Other bias | Low risk | No other apparent source of bias. |
| Baseline outcome measurement All outcomes | Low risk | Analysis methods adjusted for differences. |
| Protection against contamination (intervention and controls) | Low risk | Assignment by province/district/cluster. |
Rudasingwa 2014.
| Study characteristics | ||
| Methods | For full details of this study, see Table 5; Table 6; Table 7; Table 8. | |
| Participants | ||
| Interventions | ||
| Outcomes | ||
| Notes | ||
| Risk of bias | ||
| Bias | Authors' judgement | Support for judgement |
| Random sequence generation (selection bias) | High risk | As per guidance. |
| Allocation concealment (selection bias) | High risk | As per guidance. |
| Blinding (performance bias and detection bias) All outcomes | Unclear risk | Not specified. |
| Incomplete outcome data (attrition bias) All outcomes | Low risk | Authors noted outcomes to focus on chosen based on completeness. |
| Selective reporting (reporting bias) | Low risk | No evidence of selective reporting. |
| Other bias | Unclear risk | Authors noted small facility sample size, resulting in "a higher probability of Type II error" (page 25). Authors had not considered that results may have been influenced by the removal of user fees from certain services at a similar time to when the PBF programme was introduced. Potential conflict of interest: funding for data collection by CORDAID, 1 of the implementing agents of the PBF scheme. |
| Baseline outcome measurement All outcomes | Low risk | Analysis methods adjusted for differences. |
| Matched characteristics for control study sites | High risk | Data not presented. |
| Protection against contamination (intervention and controls) | Low risk | Assignment by province/district/cluster. |
Rusa 2009a.
| Study characteristics | ||
| Methods | For full details of this study, see Table 5; Table 6; Table 7; Table 8. | |
| Participants | ||
| Interventions | ||
| Outcomes | ||
| Notes | ||
| Risk of bias | ||
| Bias | Authors' judgement | Support for judgement |
| Blinding (performance bias and detection bias) All outcomes | Unclear risk | Not specified. |
| Selective reporting (reporting bias) | Low risk | No evidence of selective reporting. |
| Other bias | Low risk | No other apparent source of bias. |
| Intervention independent (ITS)? | High risk | Other changes in the country (user fee removal) likely to affect trends. |
| Shape of effect prespecified (ITS)? | Low risk | Specified as per guidance. |
| Unlikely to affect data collection (ITS)? | Unclear risk | Intervention may have affected data collection. |
| Incomplete outcome data addressed (ITS)? | Unclear risk | Not specified. |
Shapira 2017.
| Study characteristics | ||
| Methods | For full details of this study, see Table 5; Table 6; Table 7; Table 8. | |
| Participants | ||
| Interventions | ||
| Outcomes | ||
| Notes | ||
| Risk of bias | ||
| Bias | Authors' judgement | Support for judgement |
| Random sequence generation (selection bias) | Low risk | Sequence described in sufficient detail. |
| Allocation concealment (selection bias) | Low risk | Assignment by province/district/cluster. |
| Blinding (performance bias and detection bias) All outcomes | High risk | Outcomes were partly self‐assessed. |
| Incomplete outcome data (attrition bias) All outcomes | Low risk | Unbalanced attrition addressed. |
| Selective reporting (reporting bias) | Low risk | No evidence of selective reporting. |
| Other bias | Low risk | No other apparent source of bias. |
| Baseline outcome measurement All outcomes | Low risk | Comparable, except for institutional deliveries and number of pregnancies. |
| Matched characteristics for control study sites | Low risk | Comparable. |
| Protection against contamination (intervention and controls) | Low risk | Assignment by province/district/cluster. |
Shen 2017.
| Study characteristics | ||
| Methods | For full details of this study, see Table 5; Table 6; Table 7; Table 8. | |
| Participants | ||
| Interventions | ||
| Outcomes | ||
| Notes | ||
| Risk of bias | ||
| Bias | Authors' judgement | Support for judgement |
| Random sequence generation (selection bias) | Low risk | Sequence described in sufficient detail. |
| Allocation concealment (selection bias) | Low risk | Assignment by province/district/cluster. |
| Blinding (performance bias and detection bias) All outcomes | High risk | Outcomes are self‐scored. |
| Incomplete outcome data (attrition bias) All outcomes | Unclear risk | Not specified. |
| Selective reporting (reporting bias) | Low risk | No evidence of selective reporting. |
| Other bias | Low risk | No other apparent source of bias. |
| Baseline outcome measurement All outcomes | Low risk | Analysis methods adjusted for differences. |
| Matched characteristics for control study sites | High risk | Shen 2017 Table 2 suggestive of differences between facilities and health worker characteristics. |
| Protection against contamination (intervention and controls) | Low risk | Assignment by province/district/cluster. |
Sherry 2017.
| Study characteristics | ||
| Methods | For full details of this study, see Table 5; Table 6; Table 7; Table 8. | |
| Participants | ||
| Interventions | ||
| Outcomes | ||
| Notes | ||
| Risk of bias | ||
| Bias | Authors' judgement | Support for judgement |
| Random sequence generation (selection bias) | High risk | Randomization compromised. |
| Allocation concealment (selection bias) | Low risk | Assignment by province/district/cluster. |
| Blinding (performance bias and detection bias) All outcomes | Low risk | Unlikely outcome assessment affected by allocation knowledge. |
| Incomplete outcome data (attrition bias) All outcomes | Unclear risk | Not specified. |
| Selective reporting (reporting bias) | Low risk | No evidence of selective reporting. |
| Other bias | Unclear risk | Rollout of national immunization campaigns, increased HIV funding coincided with study periods and may have affected results. |
| Baseline outcome measurement All outcomes | Low risk | Analysis methods adjusted for differences. |
| Matched characteristics for control study sites | Low risk | Comparable. |
| Protection against contamination (intervention and controls) | Low risk | Assignment by province/district/cluster. |
Soeters 2011.
| Study characteristics | ||
| Methods | For full details of this study, see Table 5; Table 6; Table 7; Table 8. | |
| Participants | ||
| Interventions | ||
| Outcomes | ||
| Notes | ||
| Risk of bias | ||
| Bias | Authors' judgement | Support for judgement |
| Random sequence generation (selection bias) | High risk | As per guidance. |
| Allocation concealment (selection bias) | High risk | As per guidance. |
| Blinding (performance bias and detection bias) All outcomes | Low risk | Low except concerns relating to patient‐reported outcomes. |
| Incomplete outcome data (attrition bias) All outcomes | Unclear risk | Not specified. |
| Selective reporting (reporting bias) | Low risk | No evidence of selective reporting. |
| Other bias | Low risk | No other apparent source of bias. |
| Baseline outcome measurement All outcomes | Low risk | Analysis methods adjusted for differences. |
| Matched characteristics for control study sites | High risk | Not specified. |
| Protection against contamination (intervention and controls) | Low risk | Assignment by province/district/cluster. |
Steenland 2017.
| Study characteristics | ||
| Methods | For full details of this study, see Table 5; Table 6; Table 7; Table 8. | |
| Participants | ||
| Interventions | ||
| Outcomes | ||
| Notes | ||
| Risk of bias | ||
| Bias | Authors' judgement | Support for judgement |
| Random sequence generation (selection bias) | High risk | As per guidance. |
| Allocation concealment (selection bias) | High risk | As per guidance. |
| Blinding (performance bias and detection bias) All outcomes | Low risk | HMIS. |
| Incomplete outcome data (attrition bias) All outcomes | Low risk | See Steenland 2017 Appendix Table 4. |
| Selective reporting (reporting bias) | Low risk | No evidence of selective reporting. |
| Other bias | Unclear risk | Author raised concerns that PBF may have incentivized additional reporting, therefore, data were more available in intervention districts. Potential conflict of interest: funding for data collection by CORDAID, 1 of the implementing agents of the PBF scheme. |
| Baseline outcome measurement All outcomes | Low risk | Analysis methods adjusted for differences. |
| Matched characteristics for control study sites | High risk | Steenland 2017 Table 1 suggested differences between comparison and intervention existed, e.g. number of health facilities/100,000 people consistently higher in intervention group than in comparator group. |
| Protection against contamination (intervention and controls) | Low risk | Assignment by province/district/cluster. |
Sun 2016.
| Study characteristics | ||
| Methods | For full details of this study, see Table 5; Table 6; Table 7; Table 8. | |
| Participants | ||
| Interventions | ||
| Outcomes | ||
| Notes | ||
| Risk of bias | ||
| Bias | Authors' judgement | Support for judgement |
| Random sequence generation (selection bias) | High risk | Randomization compromised. |
| Allocation concealment (selection bias) | Low risk | Assignment by province/district/cluster. |
| Blinding (performance bias and detection bias) All outcomes | Low risk | Unlikely outcome assessment affected by allocation knowledge. |
| Incomplete outcome data (attrition bias) All outcomes | Unclear risk | Not specified. |
| Selective reporting (reporting bias) | Low risk | No evidence of selective reporting. |
| Other bias | Unclear risk | Authors noted political interference in process. |
| Baseline outcome measurement All outcomes | Low risk | Analysis methods adjusted for differences. |
| Matched characteristics for control study sites | Low risk | Comparable. |
| Protection against contamination (intervention and controls) | Low risk | Assignment by province/district/cluster. |
Van de Poel 2016.
| Study characteristics | ||
| Methods | For full details of this study, see Table 5; Table 6; Table 7; Table 8. | |
| Participants | ||
| Interventions | ||
| Outcomes | ||
| Notes | ||
| Risk of bias | ||
| Bias | Authors' judgement | Support for judgement |
| Random sequence generation (selection bias) | High risk | As per guidance. |
| Allocation concealment (selection bias) | High risk | As per guidance. |
| Blinding (performance bias and detection bias) All outcomes | Low risk | Indicators assessed objectively. |
| Incomplete outcome data (attrition bias) All outcomes | Unclear risk | Not specified. |
| Selective reporting (reporting bias) | Low risk | No evidence of selective reporting. |
| Other bias | Unclear risk | Multiple PBF schemes that overlapped and potentially introduced alongside budget increases. |
| Baseline outcome measurement All outcomes | Low risk | Analysis methods adjusted for differences. |
| Matched characteristics for control study sites | Low risk | Comparable. |
| Protection against contamination (intervention and controls) | Low risk | Assignment by province/district/cluster. |
Viñuela 2015.
| Study characteristics | ||
| Methods | For full details of this study, see Table 5; Table 6; Table 7; Table 8. | |
| Participants | ||
| Interventions | ||
| Outcomes | ||
| Notes | ||
| Risk of bias | ||
| Bias | Authors' judgement | Support for judgement |
| Blinding (performance bias and detection bias) All outcomes | Low risk | Unlikely allocation affected data collection. |
| Selective reporting (reporting bias) | Low risk | No evidence of selective reporting. |
| Other bias | Unclear risk | Data were aggregated at high level, which may impact analyses and findings. |
| Intervention independent (ITS)? | Unclear risk | Other reforms were happening in the education and justice sectors, which could have contributed. |
| Shape of effect prespecified (ITS)? | Low risk | Specified as per guidance. |
| Unlikely to affect data collection (ITS)? | Unclear risk | Intervention may have affected data collection. |
| Incomplete outcome data addressed (ITS)? | Unclear risk | Not specified. |
Wagner 2018a.
| Study characteristics | ||
| Methods | For full details of this study, see Table 5; Table 6; Table 7; Table 8. | |
| Participants | ||
| Interventions | ||
| Outcomes | ||
| Notes | ||
| Risk of bias | ||
| Bias | Authors' judgement | Support for judgement |
| Random sequence generation (selection bias) | Low risk | Sequence described in sufficient detail. |
| Allocation concealment (selection bias) | Low risk | Assignment by province/district/cluster. |
| Blinding (performance bias and detection bias) All outcomes | Low risk | Unlikely outcome assessment affected by allocation knowledge. |
| Incomplete outcome data (attrition bias) All outcomes | Low risk | 2% of sample missing only. |
| Selective reporting (reporting bias) | Low risk | No evidence of selective reporting. |
| Other bias | Low risk | No other apparent source of bias. |
| Baseline outcome measurement All outcomes | Low risk | Analysis methods adjusted for differences. |
| Matched characteristics for control study sites | Low risk | Comparable. |
| Protection against contamination (intervention and controls) | Low risk | Assignment by province/district/cluster. |
Witvorapong 2016.
| Study characteristics | ||
| Methods | For full details of this study, see Table 5; Table 6; Table 7; Table 8. | |
| Participants | ||
| Interventions | ||
| Outcomes | ||
| Notes | ||
| Risk of bias | ||
| Bias | Authors' judgement | Support for judgement |
| Random sequence generation (selection bias) | Low risk | Sequence described in sufficient detail. |
| Allocation concealment (selection bias) | Low risk | Assignment by province/district/cluster. |
| Blinding (performance bias and detection bias) All outcomes | Low risk | Unlikely outcome assessment affected by allocation knowledge. |
| Incomplete outcome data (attrition bias) All outcomes | High risk | 408/7131 observations excluded due to missing data. |
| Selective reporting (reporting bias) | Low risk | No evidence of selective reporting. |
| Other bias | Unclear risk | Potential selection bias and additionally unclear if authors had access to baseline data. |
| Baseline outcome measurement All outcomes | Unclear risk | Baseline measurement not specified. |
| Matched characteristics for control study sites | High risk | Characteristics not specified. |
| Protection against contamination (intervention and controls) | Low risk | Assignment by province/district/cluster. |
Wu 2014.
| Study characteristics | ||
| Methods | For full details of this study, see Table 5; Table 6; Table 7; Table 8. | |
| Participants | ||
| Interventions | ||
| Outcomes | ||
| Notes | ||
| Risk of bias | ||
| Bias | Authors' judgement | Support for judgement |
| Blinding (performance bias and detection bias) All outcomes | Low risk | Unlikely allocation affected data collection. |
| Selective reporting (reporting bias) | Low risk | No evidence of selective reporting. |
| Other bias | Unclear risk | Not generalizable, study conducted in 1 setting. |
| Intervention independent (ITS)? | Unclear risk | Other reforms happening but robustness checks performed to ascertain impacts and effects were consistent. |
| Shape of effect prespecified (ITS)? | Low risk | Specified as per guidance. |
| Unlikely to affect data collection (ITS)? | Low risk | No effects on data collection. |
| Incomplete outcome data addressed (ITS)? | Unclear risk | Not specified. |
Yao 2008.
| Study characteristics | ||
| Methods | For full details of this study, see Table 5; Table 6; Table 7; Table 8. | |
| Participants | ||
| Interventions | ||
| Outcomes | ||
| Notes | ||
| Risk of bias | ||
| Bias | Authors' judgement | Support for judgement |
| Random sequence generation (selection bias) | High risk | As per guidance. |
| Allocation concealment (selection bias) | High risk | As per guidance. |
| Blinding (performance bias and detection bias) All outcomes | Low risk | Blinded assessments. |
| Incomplete outcome data (attrition bias) All outcomes | Unclear risk | Not specified. |
| Selective reporting (reporting bias) | Low risk | No evidence of selective reporting. |
| Other bias | Low risk | Reanalysis could not be adjusted for the gross domestic product/country make‐up. |
| Baseline outcome measurement All outcomes | Unclear risk | Paper reanalyzed; reanalyzed results noted as low (analysis methods adjusted for differences). |
| Matched characteristics for control study sites | High risk | Yao 2008 Table 1 suggested the intervention was performed in areas that were more populated and poorer compared to the control group. |
| Protection against contamination (intervention and controls) | Low risk | Assignment by province/district/cluster. |
Yip 2014.
| Study characteristics | ||
| Methods | For full details of this study, see Table 5; Table 6; Table 7; Table 8. | |
| Participants | ||
| Interventions | ||
| Outcomes | ||
| Notes | ||
| Risk of bias | ||
| Bias | Authors' judgement | Support for judgement |
| Random sequence generation (selection bias) | Low risk | Sequence described in sufficient detail. |
| Allocation concealment (selection bias) | Low risk | Assignment by province/district/cluster. |
| Blinding (performance bias and detection bias) All outcomes | Low risk | Unlikely outcome assessment affected by allocation knowledge. |
| Incomplete outcome data (attrition bias) All outcomes | Unclear risk | Not specified. |
| Selective reporting (reporting bias) | Low risk | No evidence of selective reporting. |
| Other bias | Low risk | No other apparent source of bias. |
| Baseline outcome measurement All outcomes | Low risk | Constrained matched randomization. |
| Matched characteristics for control study sites | Low risk | Comparable (see Yip 2014 Appendix). |
| Protection against contamination (intervention and controls) | Low risk | Assignment by province/district/cluster. |
Zang 2015.
| Study characteristics | ||
| Methods | For full details of this study, see Table 5; Table 6; Table 7; Table 8. | |
| Participants | ||
| Interventions | ||
| Outcomes | ||
| Notes | ||
| Risk of bias | ||
| Bias | Authors' judgement | Support for judgement |
| Random sequence generation (selection bias) | High risk | As per guidance. |
| Allocation concealment (selection bias) | High risk | As per guidance. |
| Blinding (performance bias and detection bias) All outcomes | Unclear risk | Not specified. |
| Incomplete outcome data (attrition bias) All outcomes | Unclear risk | Not specified. |
| Selective reporting (reporting bias) | Low risk | No evidence of selective reporting. |
| Other bias | Low risk | We classified this as CBA; however, it could be non‐randomized trial, but no allocation mentioned. |
| Baseline outcome measurement All outcomes | Low risk | Analysis methods adjusted for differences. |
| Matched characteristics for control study sites | Low risk | Comparable. |
| Protection against contamination (intervention and controls) | Low risk | Assignment by province/district/cluster. |
Zeng 2013.
| Study characteristics | ||
| Methods | For full details of this study, see Table 5; Table 6; Table 7; Table 8. | |
| Participants | ||
| Interventions | ||
| Outcomes | ||
| Notes | ||
| Risk of bias | ||
| Bias | Authors' judgement | Support for judgement |
| Random sequence generation (selection bias) | High risk | As per guidance. |
| Allocation concealment (selection bias) | High risk | As per guidance. |
| Blinding (performance bias and detection bias) All outcomes | Low risk | Indicators assessed objectively. |
| Incomplete outcome data (attrition bias) All outcomes | Unclear risk | Not specified. |
| Selective reporting (reporting bias) | Low risk | No evidence of selective reporting. |
| Other bias | Unclear risk | NGO facilities may not be a suitable comparator to public facilities. |
| Baseline outcome measurement All outcomes | Low risk | Analysis methods adjusted for differences. |
| Matched characteristics for control study sites | High risk | Data not presented. |
| Protection against contamination (intervention and controls) | Low risk | Assignment by province/district/cluster. |
Zeng 2018.
| Study characteristics | ||
| Methods | For full details of this study, see Table 5; Table 6; Table 7; Table 8. | |
| Participants | ||
| Interventions | ||
| Outcomes | ||
| Notes | ||
| Risk of bias | ||
| Bias | Authors' judgement | Support for judgement |
| Random sequence generation (selection bias) | High risk | As per guidance. |
| Allocation concealment (selection bias) | High risk | As per guidance. |
| Blinding (performance bias and detection bias) All outcomes | Low risk | Low except concerns relating to patient satisfaction and quality‐reported outcomes. |
| Incomplete outcome data (attrition bias) All outcomes | Unclear risk | Not specified. |
| Selective reporting (reporting bias) | Low risk | No evidence of selective reporting. |
| Other bias | Low risk | No other apparent source of bias. |
| Baseline outcome measurement All outcomes | Low risk | Analysis methods adjusted for differences. |
| Matched characteristics for control study sites | High risk | Zeng 2018 Table 3 suggested significant differences, e.g. in household size, daily spending and age of mother. |
| Protection against contamination (intervention and controls) | Low risk | Assignment by province/district/cluster. |
ANC: antenatal care; CBA: controlled before‐after; HMIS: Health Management Information System; IPT: intermittent preventive treatment; ITS: interrupted time series; MoH: Ministry of Health; NGO: non‐governmental organization; PBF: performance‐based funding.
Characteristics of excluded studies [ordered by study ID]
| Study | Reason for exclusion |
|---|---|
| Aninanya 2016 | Study did not include major outcomes of interest. |
| Anselmi 2017 | Study complementary to, or superseded by, other included study. |
| Aung 2015 | Study did not include major outcomes of interest. |
| Banerjee 2008 | Study intervention did not cover relevant payments. |
| Basinga 2010 | Study complementary to, or superseded by, other included study. |
| Biai 2012 | Study focused only on payments that were not explicitly linked to changing patterns of performance. |
| Borghi 2015 | Study was complementary to included evaluations, excluded based on study type. |
| Canavan 2008 | Study design was not CBA/RCT/ITS. |
| Department for International Development 2017 | CBA but choice of control not appropriate. |
| Kumar 2016 | CBA but choice of control not appropriate. |
| Liu 2003 | Study is an ITS but not have at least 3 data points before or after the intervention. |
| Morisky 1985 | CBA but only 1 cluster/site in each comparison group. |
| Ngo 2017 | Study complementary to, or superseded by, other included study. |
| Nguyen 2015 | Study did not include major outcomes of interest. |
| Olken 2012 | Study did not include relevant healthcare providers. |
| Peabody 2010 | Study superseded by already included study. |
| Peabody 2017 | Study was complementary to included evaluations, excluded based on study type. |
| Phillips 1975 | Study did not include relevant healthcare providers. |
| Prakarsh 2017 | Study did not include relevant healthcare providers. |
| Quy 2003 | ITS but more time points for assessment needed. |
| Rahman 2017 | Study focused only on payments that were not explicitly linked to changing patterns of performance. |
| RBF Health 2017 | Study did not include relevant healthcare providers. |
| Rusa 2009b | Study complementary to, or superseded by, other included study. |
| Shen 2015 | Study complementary to, or superseded by, other included study. |
| Singh 2015 | Study did not include relevant healthcare providers. |
| Soeters 2005 | CBA but insufficient clusters. |
| Soeters 2008 | CBA but insufficient clusters. |
| Soeters 2009 | CBA but had insufficient clusters. |
| Sylvia 2015 | Study did not include relevant healthcare providers. |
| Valadez 2015 | CBA but choice of control not appropriate. |
| Vergeer 2008 | Study superseded by other included study. |
| World Bank 2015 | Insufficient information available to determine inclusion. |
| Zeng 2018a | Study was complementary to included evaluations, excluded based on study type. |
| Zhang 2017 | ITS but did not have ≥ 3 data points before or after the intervention. |
| Zhao 2013 | CBA but only 1 cluster/site in each comparison group. |
CBA: controlled before‐after; ITS: interrupted time series; RCT: randomized controlled trial.
Differences between protocol and review
The following represent deviations from the protocol (Witter 2009), and original review (Witter 2012).
Search strategies have been altered to include further up‐to‐date terms referring to paying for performance (see Appendix 4).
The following databases were added to the search process for this review version:
CINAHL;
3ie Database of Impact Evaluations;
BLDS British Library for Development Studies;
Global Health;
Grey Literature report;
OpenGrey;
International Clinical Trials Registry Platform (ICTRP);
ClinicalTrials.gov.
The following databases searched for the 2012 review version were not rerun:
Database of Abstracts of Reviews of Effectiveness (DARE);
Sociological Abstracts;
Social Services Abstracts.
Given the volume of data retrieved, we restricted our analyses and synthesis to those indicators that were comparable (i.e. indicators similarly formulated, calculated and which could speak to similar underlying populations to minimize indirectness) and discussed across two or more studies.
Subgroup analyses: given inconsistencies in reporting of characteristics intended to be used for subgroup analyses, we used scheme design as the primary criterion by which to conduct subgroup analyses.
Given the volume of impact evaluations, the findings of health economic evaluations or qualitative studies conducted alongside impact evaluations have not been included. We will attempt to include these studies in further work exploring the mechanisms behind P4P impacts.
Contributions of authors
All authors reviewed and updated the protocol.
AV and JF developed the search strategies with the EPOC information specialist.
KD, AV and JF selected the studies and undertook data extraction.
KD led in the drafting of the review, with the support of SW and AF.
All authors reviewed and commented on the final draft.
Sources of support
Internal sources
Norwegian Institute of Public Health, Norway
External sources
-
Institute of Global Health and Development, Queen Margaret University, UK
The Institute offered necessary infrastructure and staff time for undertaking the review.
-
Foreign, Commonwealth and Development Office, UK
Project number 300342‐104
Declarations of interest
KD: none.
JF: none.
AV: none.
AF: none.
SW: none.
Edited (no change to conclusions)
References
References to studies included in this review
Basinga 2011 {published data only}
- Basinga P, Gertler PJ, Binagwaho A, Soucat AL, Sturdy J, Vermeersch CM. Effect on maternal and child health services in Rwanda of payment to primary health-care providers for performance: an impact evaluation. Lancet 2011;377(9775):1421-8. [DOI] [PubMed] [Google Scholar]
Bernal 2018 {published data only}
- Bernal P, Celhay P, Martinez S. Is results-based aid more effective than conventional aid? Evidence from the health sector in El Salvador. IDB Working Paper Series No. IDB-WP-859. 2018.
Binyaruka 2015 {published data only}
- Binyaruka P, Patouillard E, Powell-Jackson T, Greco G, Maestad O, Borghi J. Effect of paying for performance on utilisation, quality, and user costs of health services in Tanzania: a controlled before and after study. PloS One 2015;10(8):e0135013. [DOI] [PMC free article] [PubMed] [Google Scholar]
Binyaruka 2017 {published data only}
- Binyaruka P, Borghi J. Improving quality of care through payment for performance: examining effects on the availability and stock-out of essential medical commodities in Tanzania. Tropical Medicine and International Health 2017;22(1):92-102. [DOI] [PubMed] [Google Scholar]
Binyaruka 2018b {published data only}
- Binyaruka P, Robberstad B, Torsvik G, Borghi J. Who benefits from increased service utilisation? Examining the distributional effects of payment for performance in Tanzania. International Journal for Equity in Health 2018;17:14. [DOI] [PMC free article] [PubMed] [Google Scholar]
Bonfrer 2014a {published data only}
- Bonfrer I, Soeters R, de Poel E, Basenya O, Longin G, de Looij F, et al. Introduction of performance-based financing in Burundi was associated with improvements in care and quality. Health Affairs 2014;33(12):2179-87. [DOI] [PubMed] [Google Scholar]
Bonfrer 2014b {published data only}
- Bonfrer I, de Poel E, Doorslaer E. The effects of performance incentives on the utilization and quality of maternal and child care in Burundi. Social Science and Medicine 2014;123:96-104. [DOI] [PubMed] [Google Scholar]
Brock 2018 {published data only}
- Brock JM, Lange A, Leonard KL. Giving and promising gifts: experimental evidence on reciprocity from the field. Journal of Health Economics 2018;58:188-201. [DOI] [PMC free article] [PubMed] [Google Scholar]
Celhay 2015 {published data only}
- Celhay P, Gertler P, Giovagnoli P, Vermeersch C. Long-run effects of temporary incentives on medical care productivity. National Bureau of Economic Research: NBER Working Paper Series. Working Paper No. 21361. 2015.
Chang 2017 {published data only}
- Chang F, Xi Y, Zhao J, Zhang X, Lu Y. A time series analysis of the effects of financial incentives and mandatory clinical applications as interventions to improve spontaneous adverse drug reaction reporting by hospital medical staff in China. Journal of Evaluation in Clinical Practice 2017;23(6):1316-21. [DOI] [PubMed] [Google Scholar]
Chansa 2015 {published data only}
- Chansa C, Das A, Qamruddin JN, Friedman J, Mkandawire A, Vledder M. Linking results to performance: evidence from a results based financing pre-pilot project in Katete District, Zambia. Washington, DC: World Bank Group. Health, Nutrition and Population Discussion Paper No. 98265. 2015.
Cruzado de la Vega 2017 {published data only}
- Cruzado de la Vega V. Payment by performance to improve the nutritional status of children: impact of budget support agreements in three Peruvian regions with a high prevalence of chronic malnutrition in children in 2010-2014 [Pagos por desempeño para mejorar el estado nutricional infantil: impacto de los convenios de apoyo presupuestario en tres regiones peruanas con alta prevalencia de desnutrición crónica infantil, 2010-2014]. Revista Peruana de Medicina Experimental y Salud Publica 2017;34(3):365-76. [DOI] [PubMed] [Google Scholar]
Das 2017 {published data only}
- Das A. Effect of Pay for Performance on the Quality of Antenatal Care in Zimbabwe: a Controlled Before-after Study [Doctor of Philosophy thesis]. London: London School of Hygiene and Tropical Medicine, 2017. [Google Scholar]
de Walque 2015 {published data only}
- Walque D, Gertler PJ, Bautista-Arredondo S, Kwan A, Vermeersch C, Dieu Bizimana J, et al. Using provider performance incentives to increase HIV testing and counseling services in Rwanda. Journal of Health Economics 2015;40:1-9. [DOI] [PubMed] [Google Scholar]
de Walque 2017 {published data only}
- Walque D, Robyn PJ, Saidou H, Sorgho G, Steenland M. Looking into the performance-based financing black box: evidence from an impact evaluation in the health sector in Cameroon. Washington, DC: World Bank Group. Policy Research Working Paper No. WPS8162. 2017. [DOI] [PMC free article] [PubMed]
Duysburgh 2016 {published data only}
- Duysburgh E, Temmerman M, Yé M, Williams A, Massawe S, Williams J, et al. Quality of antenatal and childbirth care in rural health facilities in Burkina Faso, Ghana and Tanzania: an intervention study. Tropical Medicine and International Health 2016;21(1):70-83. [DOI] [PubMed] [Google Scholar]
Engineer 2016 {published data only}
- Engineer CY, Dale E, Agarwal A, Agarwal A, Alonge O, Edward A, et al. Effectiveness of a pay-for-performance intervention to improve maternal and child health services in Afghanistan: a cluster-randomized trial. International Journal of Epidemiology 2016;45(2):451-9. [DOI] [PubMed] [Google Scholar]
Falisse 2015 {published data only}
- Falisse JB, Ndayishimiye J, Kamenyero V, Bossuyt M. Performance-based financing in the context of selective free health-care: an evaluation of its effects on the use of primary health-care services in Burundi using routine data. Health Policy and Planning 2015;30(10):1251-60. [DOI] [PubMed] [Google Scholar]
Friedman 2016a {published data only}
- Friedman J, Qamruddin J, Chansa C, Das AK. Impact evaluation of Zambia's health results-based financing pilot project. Washington, DC: World Bank Group. Working Paper No. 120723. 2016.
Friedman 2016b {published data only}
- Friedman J, Das A, Mutasa R. Rewarding provider performance to improve quality and coverage of maternal and child health outcomes. Zimbabwe results-based financing pilot program: evidence to inform policy and management decisions. Washington, DC: The International Bank for Reconstruction and Development/ The World Bank. Report No. 106518-ZW. 2016.
Gertler 2013 {published data only}
- Gertler P, Vermeersch C. Using performance incentives to improve medical care productivity and health outcomes. NBER Working Paper No. 19046 2013;(May).
Gertler 2014 {published data only}
- Gertler P, Giovagnoli P, Martinez S. Rewarding provider performance to enable a healthy start to life: evidence from Argentina's Plan Nacer. Washington DC: World Bank Group. Policy Research Working Paper No. WPS 6884. 2014.
Huillery 2017 {published data only}
- Huillery E, Seban J. Money for nothing? The effect of financial incentives on efforts and performances in the health sector, 2017. www.povertyactionlab.org/sites/default/files/research-paper/496_Money-for-Nothing_Huillery_DRC_May2017.pdf (accessed prior to 4 April 2021). [PDF: econ.sciences-po.fr/sites/default/files/file/elise/paper_DRC_July2016.pdf]
Ir 2015 {published data only}
- Ir P, Korachais C, Chheng K, Horemans D, Damme W, Meessen B. Boosting facility deliveries with results-based financing: a mixed-methods evaluation of the government midwifery incentive scheme in Cambodia. BMC Pregnancy and Childbirth 2015;15:170. [DOI] [PMC free article] [PubMed] [Google Scholar]
Khim 2018a {published data only}
- Khim K, Jayasuriya R, Annear PL. Administrative reform and pay-for-performance methods of primary health service delivery: a comparison of 3 health districts in Cambodia, 2006-2012. International Journal of Health Planning and Management 2018;33(2):e569-85. [DOI] [PubMed] [Google Scholar]
Kliner 2015 {published data only}
- Kliner M, Canaan M, Ndwandwe S, Busulwa F, Welfare W, Richardson M, et al. Effects of financial incentives for treatment supporters on tuberculosis treatment outcomes in Swaziland: a pragmatic interventional study. Infectious Diseases of Poverty 2015;4:29. [DOI] [PMC free article] [PubMed] [Google Scholar]
Lagarde 2015 {published data only}
- Lagarde M, Burn S, Lawin L, Bello K, Dossou J-P, Makoutode P, et al. Exploring the impact of performance-based financing on health workers' performance in Benin, 2015. www.rbfhealth.org/sites/rbf/files/Benin%20RBFHRH%20report.pdf (accessed prior to 4 April 2021). [PDF: www.rbfhealth.org/sites/rbf/files/Benin%20RBFHRH%20report.pdf]
Lannes 2015 {published data only}
- Lannes L. Improving health worker performance: the patient-perspective from a PBF program in Rwanda. Social Science and Medicine 2015;138:1-11. [DOI] [PubMed] [Google Scholar]
Lannes 2016 {published data only}
- Lannes L, Meessen B, Soucat A, Basinga P. Can performance-based financing help reaching the poor with maternal and child health services? The experience of rural Rwanda. International Journal of Health Planning and Management 2016;31(3):309-48. [DOI] [PubMed] [Google Scholar]
Liu 2005 {published data only}
- Liu X, Mills A. The effect of performance-related pay of hospital doctors on hospital behaviour: a case study from Shandong, China. Human Resources for Health 2005;3:11. [DOI] [PMC free article] [PubMed] [Google Scholar]
Matsuoka 2014 {published data only}
- Matsuoka S, Obara H, Nagai M, Murakami H, Chan Lon R. Performance-based financing with GAVI health system strengthening funding in rural Cambodia: a brief assessment of the impact. Health Policy and Planning 2014;29(4):456-65. [DOI] [PubMed] [Google Scholar]
Mayumana 2017 {published data only}
- Mayumana I, Borghi J, Anselmi L, Mamdani M, Lange S. Effects of payment for performance on accountability mechanisms: evidence from Pwani, Tanzania. Social Science and Medicine 2017;179:61-73. [DOI] [PubMed] [Google Scholar]
McMahon 2016 {published data only}
- McMahon S, De Allegri M. Final results of the SSDI-PBI process and impact evaluation, 2016. www.klinikum.uni-heidelberg.de/fileadmin/inst_public_health/Dokumente/SSDI_final_report.pdf (accessed prior to 4 April 2021). [PDF: www.klinikum.uni-heidelberg.de/fileadmin/inst_public_health/Dokumente/SSDI_final_report.pdf]
Menya 2015 {published data only}
- Menya D, Platt A, Manji I, Sang E, Wafula R, Ren J, et al. Using pay for performance incentives (P4P) to improve management of suspected malaria fevers in rural Kenya: a cluster randomized controlled trial. BMC Medicine 2015;13:268. [DOI] [PMC free article] [PubMed] [Google Scholar]
Mohanan 2017 {published data only}
- Mohanan M, Miller G, Donato K, Truskinovsky Y, Vera-Hernández M. Different strokes for different folks: experimental evidence on the effectiveness of input and output incentive contracts for health care providers with different levels of skills. Washington DC: Centre for Global Development. Working Paper No. 464. 2017.
Peabody 2011a {published data only}
- Peabody J, Shimkhada R, Quimbo S, Florentino J, Bacate M, McCulloch CE, et al. Financial incentives and measurement improved physicians' quality of care in the Philippines. Health Affairs 2011;30(4):773-81. [DOI] [PubMed] [Google Scholar]
Peabody 2014 {published data only}
- Peabody JW, Shimkhada R, Quimbo S, Solon O, Javier X, McCulloch C. The impact of performance incentives on child health outcomes: results from a cluster randomized controlled trial in the Philippines. Health Policy and Planning 2014;29(5):615-21. [DOI] [PMC free article] [PubMed] [Google Scholar]
Powell‐Jackson 2014 {published data only}
- Powell-Jackson T, Yip WC, Han W. Realigning demand and supply side incentives to improve primary health care seeking in rural China. Health Economics 2014;24(6):755-72. [DOI] [PubMed] [Google Scholar]
Priedeman Skiles 2013 {published data only}
- Priedeman Skiles M, Curtis S, Basinga P, Angeles G. An equity analysis of performance-based financing in Rwanda: are services reaching the poorest women? Health Policy and Planning 2013;28(8):825-37. [DOI] [PubMed] [Google Scholar]
Priedeman Skiles 2015 {published data only}
- Priedeman Skiles M, Curtis SL, Basinga P, Angeles G, Thirumurthy H. The effect of performance-based financing on illness, care-seeking and treatment among children: an impact evaluation in Rwanda. BMC Health Services Research 2015;15:375. [DOI] [PMC free article] [PubMed] [Google Scholar]
Quimbo 2016 {published data only}
- Quimbo S, Wagner N, Florentino J, Solon O, Peabody J. Do health reforms to improve quality have long-term effects? Results of a follow-up on a randomized policy experiment in the Philippines. Health Economics 2016;25(2):165-77. [DOI] [PubMed] [Google Scholar]
Rudasingwa 2014 {published data only}
- Rudasingwa M, Soeters R, Bossuyt M. The effect of performance-based financial incentives on improving health care provision in Burundi: a controlled cohort study. Global Journal of Health Science 2014;7(3):15-29. [DOI] [PMC free article] [PubMed] [Google Scholar]
Rusa 2009a {published data only}
- Rusa L, Ngirabega J de D, Janssen W, Bastelaere S, Porignon D, Vandenbulcke W. Performance-based financing for better quality of services in Rwandan health centres: 3-year experience. Tropical Medicine and International Health 2009;14(7):830-7. [DOI] [PubMed] [Google Scholar]
Shapira 2017 {published data only}
- Shapira G, Kalisa I, Condo J, Humuza J, Mugeni C, Nkunda D, et al. Effects of performance incentives for community health worker cooperatives in Rwanda. Washington, DC: World Bank Group. Policy Research Working Paper No. WPS 8059. 2017.
Shen 2017 {published data only}
- Shen GC, Nguyen HT, Das A, Sachingongu N, Chansa C, Qamruddin J, et al. Incentives to change: effects of performance-based financing on health workers in Zambia. Human Resources for Health 2017;15(1):20. [DOI] [PMC free article] [PubMed] [Google Scholar]
Sherry 2017 {published data only}
- Sherry TB, Bauhoff S, Mohanan M. Multitasking and heterogeneous treatment effects in pay-for-performance in health care: evidence from Rwanda. American Journal of Health Economics 2017;3(2):192-226. [Google Scholar]
Soeters 2011 {published data only}
- Soeters R, Peerenboom PB, Mushagalusa P, Kimanuka C. Performance-based financing experiment improved health care in the Democratic Republic of Congo. Health Affairs 2011;30(8):1518-27. [DOI] [PubMed] [Google Scholar]
Steenland 2017 {published data only}
- Steenland M, Robyn PJ, Compaore P, Kabore M, Tapsoba B, Zongo A, et al. Performance-based financing to increase utilization of maternal health services: evidence from Burkina Faso. SSM – Population Health 2017;3:179-84. [DOI] [PMC free article] [PubMed] [Google Scholar]
Sun 2016 {published data only}
- Sun X, Liu X, Sun Q, Yip W, Wagstaff A, Meng Q. The impact of a pay-for-performance scheme on prescription quality in rural China. Health Economics 2016;25(6):706-22. [DOI] [PubMed] [Google Scholar]
Van de Poel 2016 {published data only}
- Van de Poel E, Flores G, Ir P, O'Donnell O. Impact of performance-based financing in a low-resource setting: a decade of experience in Cambodia. Health Economics 2016;25(6):668-705. [DOI] [PubMed] [Google Scholar]
Viñuela 2015 {published data only}
- Viñuela L, Zoratto L. Do performance agreements help improve service delivery? the experience of Brazilian states. Washington DC: World Bank Group. Policy Research Working Paper No. WPS 7375. 2015.
Wagner 2018a {published data only}
- Wagner N, Quimbo S, Shimkhada R, Peabody J. Does health insurance coverage or improved quality protect better against out-of-pocket payments? Experimental evidence from the Philippines. Social Science and Medicine 2018;204:51-8. [DOI] [PubMed] [Google Scholar]
Witvorapong 2016 {published data only}
- Witvorapong N, Foshanji AI. The impact of a conditional cash transfer program on the utilization of non-targeted services: evidence from Afghanistan. Social Science and Medicine 2016;152:87-95. [DOI] [PubMed] [Google Scholar]
Wu 2014 {published data only}
- Wu B. Mismeasurement in pay-for-performance: evidence from an intervention to reduce health care spending in China. New Jersey: Rutgers University, Department of Economics. Departmental Working Papers 201409. 2014.
Yao 2008 {published data only}
- Yao H, Wei X, Liu J, Zhao J, Hu D, Walley JD. Evaluating the effects of providing financial incentives to tuberculosis patients and health providers in China. International Journal of Tuberculosis and Lung Disease 2008;12(10):1166-72. [PubMed] [Google Scholar]
Yip 2014 {published data only}
- Yip W, Powell-Jackson T, Chen W, Fe E, Hu M, Jian W, et al. Capitation combined with pay-for-performance improves antibiotic prescribing practices in rural China. Health Affairs 2014;33(3):502-10. [DOI] [PubMed] [Google Scholar]
Zang 2015 {published data only}
- Zang O, Djienouassi S, Sorgho G, Taptue JC. Impact of performance-based financing on health-care quality and utilization in urban areas of Cameroon. African Health Monitor 2015;October:10-4. [Google Scholar]
Zeng 2013 {published data only}
- Zeng W, Cros M, Wright KD, Shepard DS. Impact of performance-based financing on primary health care services in Haiti. Health Policy and Planning 2013;28(6):596-605. [DOI] [PubMed] [Google Scholar]
Zeng 2018 {published data only}
- Zeng W, Shepard DS, Rusatira JD, Blaakman AP, Nsitou BM. Evaluation of results-based financing in the Republic of the Congo: a comparison group pre-post study. Health Policy and Planning 2018;33(3):392-400. [DOI] [PubMed] [Google Scholar]
References to studies excluded from this review
Aninanya 2016 {published data only}
- Aninanya GA, Howard N, Williams JE, Apam B, Prytherch H, Loukanova S, et al. Can performance-based incentives improve motivation of nurses and midwives in primary facilities in northern Ghana? A quasi-experimental study. Global Health Action 2016;9:32404. [DOI] [PMC free article] [PubMed] [Google Scholar]
Anselmi 2017 {published data only}
- Anselmi L, Binyaruka P, Borghi J. Understanding causal pathways within health systems policy evaluation through mediation analysis: an application to payment for performance (P4P) in Tanzania. Implementation Science 2017;12:10. [DOI] [PMC free article] [PubMed] [Google Scholar]
Aung 2015 {published data only}
- Aung T, White C, Montagu D, McFarland W, Hlaing T, Khin HS, et al. Improving uptake and use of malaria rapid diagnostic tests in the context of artemisinin drug resistance containment in eastern Myanmar: an evaluation of incentive schemes among informal private healthcare providers. Malaria Journal 2015;14:105. [DOI] [PMC free article] [PubMed] [Google Scholar]
Banerjee 2008 {published data only}
- Banerjee AV, Duflo E, Glennerster R. Putting a band-aid on a corpse: incentives for nurses in the Indian public health care system. Journal of the European Economic Association 2008;6(2-3):487-500. [DOI] [PMC free article] [PubMed] [Google Scholar]
Basinga 2010 {published data only}
- Basinga P, Gertler PJ, Binagwaho A, Soucat AL, Sturdy JR, Vermeersch CM. Paying primary health care centers for performance in Rwanda. Washington, DC: World Bank Group. Policy Research Working Paper WPS5190. 2010.
Biai 2012 {published data only}
- Biai S, Rodrigues A, Gomes M, Ribeiro I, Sodemann M, Alves F, et al. Reduced in-hospital mortality after improved management of children under 5 years admitted to hospital with malaria: randomised trial. BMJ 2012;335:862. [DOI] [PMC free article] [PubMed] [Google Scholar]
Borghi 2015 {published data only}
- Borghi J, Little R, Binyaruka P, Patouillard E, Kuwawenaruwa A. In Tanzania, the many costs of pay-for-performance leave open to debate whether the strategy is cost-effective. Health Affairs 2015;34(3):406-14. [DOI] [PubMed] [Google Scholar]
Canavan 2008 {published data only}
- Canavan A, Swai G. Payment for performance (P4P) evaluation: Tanzania country report for CORDAID. www.kit.nl/wp-content/uploads/2018/08/1531_Cordaid_KIT_Tanzania_P4P_26-March-2009-final-version.pdf (accessed prior to 4 April 2021).
Department for International Development 2017 {published data only}
- Department for International Development. Evaluation of results based financing programme for Northern Uganda, 2017. www.gov.uk/government/publications/evaluation-of-results-based-financing-programme-for-northern-uganda (accessed prior to 4 April 2021). [URL: www.gov.uk/government/publications/evaluation-of-results-based-financing-programme-for-northern-uganda]
Kumar 2016 {published data only}
- Kumar M, Lehmann JT, Rucogoza A, Kayobotsi C, Das AK, Schneidman M. East Africa – public health laboratory networking project: evaluation of performance-based financing for public health laboratories in Rwanda (English). Washington, DC: World Bank Group. Health, Nutrition, and Population Discussion Paper 105015. 2016.
Liu 2003 {published data only}
- Liu X, Mills A. The influence of bonus payments to doctors on hospital revenue: results of a quasi-experimental study. Applied Health Economics & Health Policy 2003;2:91-8. [PubMed] [Google Scholar]
Morisky 1985 {published data only}
- Morisky DE. Evaluating the effectiveness of utilizing traditional birth attendants for maternal and child health/family planning programs in the rural Philippines. International Quarterly of Community Health Education 1985;6(2):131-43. [DOI] [PubMed] [Google Scholar]
Ngo 2017 {published data only}
- Ngo DKL, Sherry TB, Bauhoff S. Health system changes under pay-for-performance: the effects of Rwanda's national programme on facility inputs. Health Policy and Planning 2017;32(1):11-20. [DOI] [PubMed] [Google Scholar]
Nguyen 2015 {published data only}
- Nguyen HT, Gopalan S, Mutasa R, Friedman J, Das AK, Sisimayi C, et al. Impact of results-based financing on health worker satisfaction and motivation in Zimbabwe, 2015. www.rbfhealth.org/resource/impact-results-based-financing-health-worker-satisfaction-and-motivation-zimbabwe (accessed prior to 4 April 2021). [URL: www.rbfhealth.org/resource/impact-results-based-financing-health-worker-satisfaction-and-motivation-zimbabwe]
Olken 2012 {published data only}
- Olken BA, Onishi J, Wong S. Should aid reward performance? Evidence from a field experiment on health and education in Indonesia. National Bureau of Economic Research, Working Paper 17892. 2012. [DOI] [PMC free article] [PubMed]
Peabody 2010 {unpublished data only}
- Peabody J, Shimkhada R, Quimbo S, Solon O, Javier X, McCulloch C. Linkage between measurement and incentive payments and health outcomes: experimental data from a policy experiment in the Philippines. Submitted for publication to JAMA.
Peabody 2017 {published data only}
- Peabody JW, Quimbo S, Florentino J, Shimkhada R, Javier X, Paculdo D, et al. Comparative effectiveness of two disparate policies on child health: experimental evidence from the Philippines. Health Policy and Planning 2017;32(4):563-71. [DOI] [PMC free article] [PubMed] [Google Scholar]
Phillips 1975 {published data only}
- Phillips JF, Silayan Go A, Pal Montano A. An experiment with payment, quota, and clinic affiliation schemes for lay motivators in the Philippines. Studies in Family Planning 1975;6(9):326-34. [PubMed] [Google Scholar]
Prakarsh 2017 {published data only}
- Prakarsh S, Sandip M. Incentives, information and malnutrition: evidence from an experiment in India. European Economic Review 2017;93:24-46. [Google Scholar]
Quy 2003 {unpublished data only}
- Quy H, Lan N, Lonnroth K, Buu T, Dieu T, Hai T. Public-private mix for improved TB control in Ho Chi Minh City, Vietnam: an assessment of its impact on case detection. International Journal for Tuberculosis and Lung Disease 2003;7:464-71. [PubMed] [Google Scholar]
Rahman 2017 {published data only}
- Rahman S, Choudhury AA, Khanam R, Moin SM, Ahmed S, Begum N, et al. Effect of a package of integrated demand- and supply-side interventions on facility delivery rates in rural Bangladesh: implications for large-scale programs. PloS One 2017;12(10):e0186182. [DOI] [PMC free article] [PubMed] [Google Scholar]
RBF Health 2017 {published data only}
- RBF Health. The Gambia's community-based RBF scheme: contracting communities to boost demand, 2017. www.rbfhealth.org/resource/gambia%E2%80%99s-community-based-rbf-scheme-contracting-communities-boost-demand (accessed prior to 4 April 2021). [URL: www.rbfhealth.org/resource/gambia%E2%80%99s-community-based-rbf-scheme-contracting-communities-boost-demand]
Rusa 2009b {published data only}
- Rusa L, Schneidman M, Fritsche G, Musango L. Chapter 10. Rwanda: performance-based financing in the public sector. In: Performance Incentives for Global Health: Potential and Pitfalls. Washington (DC): Center for Global Development, 2009:189-214. [URL: www.cgdev.org/sites/default/files/9781933286297-Levine-performance-incentives.pdf] [Google Scholar]
Shen 2015 {published data only}
- Shen G, Nguyen HT, Das AK, Sachingongu N, Chans C, Friedman J, et al. Results-based financing's impact on human resources for health in Zambia, 2015. www.rbfhealth.org/sites/rbf/files/Zambia%20RBFHRH%20report.pdf (accessed prior to 4 April 2021). [URL: www.rbfhealth.org/sites/rbf/files/Zambia%20RBFHRH%20report.pdf]
Singh 2015 {published data only}
- Singh P. Performance pay and information: reducing child undernutrition in India. Journal of Economic Behavior and Organization 2015;112:141-63. [Google Scholar]
Soeters 2005 {unpublished data only}
- Soeters R, Musango L, Meessen B. Comparison of two output based schemes in Butare and Cyangugu provinces with two control provinces in Rwanda. GBPOA, World Bank, Ministry of Health Rwanda. 2005.
Soeters 2008 {unpublished data only}
- Soeters R, Kimakuka C. Résultats de l’enquête ménage, l’enquête qualité, et l’enquête infirmiers titulaires. Pour le Programme Achat de Performance dans les Zones de Santé du District Sanitaire Nord du Sud Kivu. The Hague: CORDAID. 2008.
Soeters 2009 {unpublished data only}
- Soeters R, Kiwanuka C. Rapport de l'Etude d'Evaluation du programme Achat de Performance dans les Provinces Bubanza et Cankuzo, basé sur les résultats des enquêtes ménages, qualité et infirmiers titulaires réalisées en 2006 et 2008. 2008.
Sylvia 2015 {published data only}
- Sylvia SY. Managerial Incentives in Public Service Delivery: Evidence from School-Based Nutrition Programs in Rural China [Thesis]. Maryland (MD): University of Maryland, 2015. [URL: hdl.handle.net/1903/15457] [Google Scholar]
Valadez 2015 {published data only}
- Valadez JJ, Jeffery C, Brant T, Vargas W, Pagano M. Final impact assessment of the results-based financing programme for Northern Uganda. Department for International Development 2015. [URL: www.gov.uk/government/uploads/system/uploads/attachment_data/file/607579/Evaluation-of-Results-Based-Financing-Programme-for-Northern-Uganda.pdf]
Vergeer 2008 {unpublished data only}
- Vergeer P, Chansa C. Payment for performance (P4P) evaluation. Zambia Country Report for CORDAID. 2008.
World Bank 2015 {published data only}
- World Bank. India – impact evaluation of results-based payments for hospital care for the poor in Karnataka state (English). Washington, DC: World Bank Group. Health, Nutrition, and Population Global Practice Discussion Paper 97519. 2015.
Zeng 2018a {published data only}
- Zeng W, Shepard DS, Nguyen H, Chansa C, Das AK, Qamruddin J, et al. Cost–effectiveness of results-based financing, Zambia: a cluster randomized trial. Bulletin of the World Health Organization 2018;96(11):760-71. [DOI] [PMC free article] [PubMed] [Google Scholar]
Zhang 2017 {published data only}
- Zhang W, Luo H, Ma Y, Guo Y, Fang Q, Yang Z, et al. Monetary incentives for provision of syphilis screening, Yunnan, China. Bulletin of the World Health Organization 2017;95(9):657-62. [DOI] [PMC free article] [PubMed] [Google Scholar]
Zhao 2013 {published data only}
- Zhao Y, Huo Z, Wu J, Xie S, Zhang L, Feng Z. Impact on the performance of health workers adopted performance-related contracts in the provision of basic public health service at village and township levels. Iranian Journal of Public Health 2013;42(4):358-67. [PMC free article] [PubMed] [Google Scholar]
References to studies awaiting assessment
Adato 2010 {published data only}
- Adato M, Roopnaraine T. Women's Status, Gender Relations, and Conditional Cash Transfers. In: Adato, M, Hoddinott J, editors(s). Conditional cash transfers in Latin America. Baltimore, MD: The International Food Policy Research Institute (IFPRI) by Johns Hopkins University Press, 2010:31-314. [Google Scholar]
Adzei 2012 {published data only}
- Adzei FA, Atinga RA. Motivation and retention of health workers in Ghana's district hospitals: addressing the critical issues. Journal of Health Organization & Management 2012;26:467-85. [DOI] [PubMed] [Google Scholar]
Aghajani 2019 {published data only}
- Aghajani MH, Manavi S, Maher A, Rafiei S, Ayoubian A, Shahrami A, et al. Pay for performance in hospital management: a case study. International Journal of Healthcare Management 24 Sep 2019. [DOI: 10.1080/20479700.2019.1664029] [DOI] [Google Scholar]
Ahmed 2019 {published data only}
- Ahmed T, Arur A, De Walque D, Shapira G. Incentivizing quantity and quality of care: evidence from an impact evaluation of performance-based financing in the health sector in Tajikistan, 2019. openknowledge.worldbank.org/handle/10986/32154 (accessed prior to 4 April 2021).
Anonymous 1962 {published data only}
- Anonymous. Report on the incentive payment system for the workers employed in the Indian undertakings of the public sector. Not reported 1962.
Anonymous 2006 {published data only}
- Anonymous. Using performance feedback to change provider behavior. Performance improvement advisor 2006;10(5):58-9. [PubMed] [Google Scholar]
Baral 2012 {published data only}
- Baral G. An assessment of the safe delivery incentive program at a tertiary level hospital in Nepal. Journal of Nepal Health Research Council 2012;10(21):118-24. [PubMed] [Google Scholar]
Basinga 2009 {published data only}
- Basinga P. Impact of Performance-Based Financing on the quantity and quality of maternal health services in Rwanda. Dissertation Abstracts International: Section B: The Sciences and Engineering 2009;70(4-B):192-226. [Google Scholar]
Berg 2013 {published data only}
- Berg E, Ghatak, M, Manjula R, Rajasekhar D, Roy S. Motivating Knowledge Agents: Can Incentive Pay Overcome Social Distance? CSAE Working Paper Series 2013-06, Centre for the Study of African Economies, University of Oxford.
Bernal 2020 {published data only}
- Bernal P, Martinez S. In-kind incentives and health worker performance: experimental evidence from El Salvador. Journal of Health Economics 2020;70:102267. [DOI] [PMC free article] [PubMed] [Google Scholar]
Binyaruka 2018c {published data only}
- Binyaruka P, Robberstad B, Torsvik G, Borghi J. Does payment for performance increase performance inequalities across health providers? A case study of Tanzania. Health Policy and Planning 2018;33(9):1026-36. [DOI] [PMC free article] [PubMed] [Google Scholar]
Brenner 2018 {published data only}
- Brenner S, Mazalale J, Wilhelm D, Nesbitt RC, Lohela TJ, Chinkhumba J, et al. Impact of results-based financing on effective obstetric care coverage: evidence from a quasi-experimental study in Malawi. BMC Health Services Research 2018;18:791. [DOI] [PMC free article] [PubMed] [Google Scholar]
Brenner 2020 {published data only}
- Brenner S, Chase RP, McMahon SA, Lohmann J, Makwero CJ, Muula AS, et al. Effect heterogeneity in responding to performance-based incentives: a quasi-experimental comparison of impacts on health service indicators between hospitals and health centers in Malawi. Health Systems & Reform 2020;6(1):e1745580. [DOI] [PubMed] [Google Scholar]
Carmichael 2019 {published data only}
- Carmichael SL, Mehta K, Raheel H, Srikantiah S, Chaudhuri I, Trehan S, et al. Effects of team-based goals and non-monetary incentives on front-line health worker performance and maternal health behaviours: a cluster randomised controlled trial in Bihar, India. BMJ Global Health 2019;4(4):e001146. [DOI] [PMC free article] [PubMed] [Google Scholar]
Celhay 2019 {published data only}
- Celhay PA, Gertler PJ, Giovagnoli P, Vermeersch C. Long-run effects of temporary incentives on medical care productivity. American Economic Journal: Applied Economics 2019;11(3):92-127. [Google Scholar]
Chariwala 2020 {published data only}
- Chariwala RA, Shukla R, Gajiwala UR, Gilbert C, Pant H, Lewis MG, et al. Effectiveness of health education and monetary incentive on uptake of diabetic retinopathy screening at a community health center in South Gujarat, India. Indian Journal of Ophthalmology 2020;68(Suppl 1):S52-5. [DOI] [PMC free article] [PubMed] [Google Scholar]
Chinkhumba 2020 {published data only}
- Chinkhumba J, De Allegri M, Brenner S, Muula A, Robberstad B. The cost-effectiveness of using results-based financing to reduce maternal and perinatal mortality in Malawi. BMJ Global Health 2020;5:5. [DOI] [PMC free article] [PubMed] [Google Scholar]
Chukwuma 2017 {published data only}
- Chukwuma A, Mbachu C, McConnell M, Bossert T, Cohen J. Do performance-based monetary incentives for referrals by traditional birth attendants increase postnatal care use? Evidence from a Nigerian field experiment. American Journal of Tropical Medicine and Hygiene 2017;97(5):283. [Google Scholar]
Dansereau 2019 {published data only}
- Dansereau EA. Results based aid for universal health coverage in poor and indigenous communities: Impact evaluation of the Salud Mesoamerica initiative. ResearchWorks Archive 2019;80(8-B(E)). [digital.lib.washington.edu/researchworks/handle/1773/43609] [Google Scholar]
Das 2019 {published data only}
- Das A, George B, Ranebennur V, Parthasarathy MR, Shreenivas GS, Todankar P, et al. Getting to the first 90: incentivized peer mobilizers promote HIV testing services to men who have sex with men using social media in Mumbai, India. Global Health: Science and Practice 2019;7(3):469-77. [DOI] [PMC free article] [PubMed] [Google Scholar]
De Allegri 2019a {published data only}
- De Allegri M, Makwero C, Torbica A. At what cost is performance-based financing implemented? Novel evidence from Malawi. Health Policy and Planning 2019;34(4):282-8. [DOI] [PubMed] [Google Scholar]
De Allegri 2019b {published data only}
- De Allegri M, Chase RP, Lohmann J, Schoeps A, Muula AS, Brenner S. Effect of results-based financing on facility-based maternal mortality at birth: an interrupted time-series analysis with independent controls in Malawi. BMJ Global Health 2019;4:e001184. [DOI] [PMC free article] [PubMed] [Google Scholar]
De Allegri 2019c {published data only}
- De Allegri M, Lohmann J, Souares A, Hillebrecht M, Hamadou S, Hien H, et al. Responding to policy makers' evaluation needs: combining experimental and quasi-experimental approaches to estimate the impact of performance based financing in Burkina Faso. BMC Health Services Research 2019;19(1):733. [DOI] [PMC free article] [PubMed] [Google Scholar]
Demirkiran 2016 {published data only}
- Demirkiran M, Yorulmaz M, Unal S, Taskaya S, Carikci O. Effects of the Performance-Based Remuneration System: What Do Nurses Think? Research Journal of Business and Management 2016;3(1):88-96. [Google Scholar]
Deressa 2019 {published data only}
- Deressa AT, Zeru G. Work motivation and its effects on organizational performance: the case of nurses in Hawassa public and private hospitals: mixed method study approach. BMC Research Notes 2019;12:213. [DOI] [PMC free article] [PubMed] [Google Scholar]
De Walque 2018 {published data only}
- De Walque D, Robyn PJ, Saidou H, Sorgho G, Steenland M. The impact of performance-based financing on the delivery of HIV testing, prevention of mother to child transmission and antiretroviral delivery in the Cameroon health system. Journal of the International AIDS Society 2018;21(Suppl 6):e25148. [Google Scholar]
De Walque 2020 {published data only}
- de Walque D, Chukwuma A, Ayivi-Guedehoussou N, Koshkakaryan M. A randomized evaluation of demand-side interventions for health screenings in Armenia. documents1.worldbank.org/curated/en/672701596200009570/pdf/Invitations-Incentives-and-Conditions-A-Randomized-Evaluation-of-Demand-Side-Interventions-for-Health-Screenings-in-Armenia.pdf (accessed prior to 4 April 2021).
Diclemente 1998 {published data only}
- Diclemente R, Wingood GM. Monetary incentives: a useful strategy for enhancing enrollment and promoting participation in HIV/STD risk reduction interventions. Sexually Transmitted Infections 1998;74(4):239-40. [PubMed] [Google Scholar]
Duchoslav 2019 {published data only}
- Duchoslav J, Cecchi F. Do incentives matter when working for god? The impact of performance-based financing on faith-based healthcare in Uganda. World Development 2019;113:309-19. [Google Scholar]
Egbe 2016 {published data only}
- Egbe TO, Atashili J, Talla E, Atanga MB. Effect of performance based financing home visiting on the use of modern methods of contraception in the Kumbo east health district, Cameroon. Contraception and Reproductive Medicine 2016;1:19. [DOI] [PMC free article] [PubMed] [Google Scholar]
El Bcheraou 2018 {published data only}
- El Bcheraoui C, Kamath AM, Dansereau E, Palmisano EB, Schaefer A, Hernandez B, et al. Results-based aid with lasting effects: Sustainability in the Salud Mesoamerica Initiative 11 Medical and Health Sciences 1117 Public Health and Health Services 16 Studies in Human Society 1605 Policy and Administration. Globalization and Health 2018;14(1):97. [DOI] [PMC free article] [PubMed] [Google Scholar]
Fahey 2020 {published data only}
- Fahey CA, Njau PF, Katabaro E, Mfaume RS, Ulenga N, Mwenda N, et al. Financial incentives to promote retention in care and viral suppression in adults with HIV initiating antiretroviral therapy in Tanzania: a three-arm randomised controlled trial. Lancet HIV 2020;7(11):e762-71. [DOI] [PMC free article] [PubMed] [Google Scholar]
Federal 2018 {published data only}
- Federal Ministry of Health of Nigeria. Impact evaluation of Nigeria state health investment project, 2018. documents.worldbank.org/en/publication/documents-reports/documentdetail/589301552969360031/impact-evaluation-of-nigeria-state-health-investment-project (accessed prior to 4 April 2021).
Francetic 2019 {published data only}
- Francetic I, Tediosi F, Salari P, Savigny D. Going operational with health systems governance: supervision and incentives to health workers for increased quality of care in Tanzania. Health Policy and Planning 2019;34(Suppl 2):ii77-ii92. [DOI] [PubMed] [Google Scholar]
Gupta 2019a {published data only}
- Gupta N, Lavallee R, Ayles J. Gendered effects of pay for performance among family physicians for chronic disease care: an economic evaluation in a context of universal health coverage. Human Resources for Health 2019;17:40. [DOI] [PMC free article] [PubMed] [Google Scholar]
Hoddinott 2010 {published data only}
- Hoddinott J. Nutrition and Conditional Cash Transfer Programs. In: Adato M, Hoddinott J, editors(s). Conditional cash transfers in Latin America. Baltimore, MD: Published for the International Food Policy Research Institute (IFPRI) by Johns Hopkins University Press, 2010:27-257. [Google Scholar]
Hussain 2019 {published data only}
- Hussain H, Mori AT, Khan AJ, Khowaja S, Creswel J, Tylleskar T, et al. The cost-effectiveness of incentive-based active case finding for tuberculosis (TB) control in the private sector Karachi, Pakistan. BMC Health Services Research 2019;19:1. [DOI] [PMC free article] [PubMed] [Google Scholar]
Janssen 2015 {published data only}
- Janssen W, Ngirabega J de D, Matungwa M, Bastelaere S van. Improving quality through performance-based financing in district hospitals in Rwanda between 2006 and 2010: a 5-year experience. Tropical Doctor 2015;45(1):27-35. [DOI] [PubMed] [Google Scholar]
Janus 2011 {published data only}
- Janus K. Pay-for-performance does not always "pay". Eurohealth 2011;17(4):31-4. [Google Scholar]
Kanmiki 2018 {published data only}
- Kanmiki EW, Bempah BO, Awoonor-Williams JK, Bawah AA, d'Almeida SA, Kassak KM. An assessment of a performance-based management agreement initiative in Ghana's health service. BMC Health Services Research 2018;18:995. [DOI] [PMC free article] [PubMed] [Google Scholar]
Karim 2015 {published data only}
- Karim QA, Leask K, Kharsany A, Humphries H, Ntombela F, Samsunder N, et al. Impact of conditional cash incentives on HSV-2 and HIV prevention in rural South African high school students: Results of the CAPRISA 007 cluster randomized controlled trial. Journal of the International AIDS Society 2015;18:43-4. [Google Scholar]
Kipp 2000 {published data only}
- Kipp W. Cost-Sharing in Kabarole District, Uganda: Incentive Payments to Health Staff Most Likely Explanation for a Low Impact of User Fees on Utilization Frequency of Health Services. In: Publications I: The 7th International Conference on System Science in Health Care, 29 May-2 June 2000, Budapest, Hungary. 2000:60-4.
Kitui 2017 {published data only}
- Kitui JE, Dutton V, Bester D, Ndirangu R, Wangai S, Ngugi S. Traditional Birth Attendant reorientation and Motherpacks incentive's effect on health facility delivery uptake in Narok County, Kenya: An impact analysis. BMC Pregnancy and Childbirth 2017;17(1):125. [DOI] [PMC free article] [PubMed] [Google Scholar]
Korachais 2020 {published data only}
- Korachais C, Nkurunziza S, Nimpagaritse M, Meessen B. Impact of the extension of a performance-based financing scheme to nutrition services in Burundi on malnutrition prevention and management among children below five: a cluster-randomized control trial. PloS One 2020;15(9):e0239036. [DOI] [PMC free article] [PubMed] [Google Scholar]
Kraft 2008 {published data only}
- Kraft AD, Capuno JJ, Quimbo SA, Tan CAR Jr. Information, Incentives and Practice Patterns: The Case of TB DOTS Services and Private Physicians in the Philippines. Singapore Economic Review 2008;53(1):43-56. [Google Scholar]
Kuunibe 2020a {published data only}
- Kuunibe N, Lohmann J, Hillebrecht M, Nguyen HT, Tougri G, Allegri M. What happens when performance-based financing meets free healthcare? Evidence from an interrupted time-series analysis. Health Policy and Planning 2020;35(8):906-17. [DOI] [PubMed] [Google Scholar]
Lazarevik 2013 {published data only}
- Lazarevik V, Kasapinov B. Pay-for-performance in the former Yugoslav Republic of Macedonia: between a good title and a bad reform. Eurohealth 2013;19(1):29-32. [Google Scholar]
Lohmann 2018 {published data only}
- Lohmann J, Muula AS, Houlfort N, De Allegri, M. How does performance-based financing affect health workers' intrinsic motivation? A self-determination theory-based mixed-methods study in Malawi. Social Science and Medicine 2018;208:1-8. [DOI] [PubMed] [Google Scholar]
Luo 2011 {published data only}
- Luo R, Jin X, Yang Q. Research on performance evaluation criteria for local MCH services in ethnic minority areas. Maternal and Child Health Care of China 2011;26(33):5125-27. [Google Scholar]
Manga 2018 {published data only}
- Manga LJ, Fouda AA, Mbida L, Mvogo CE. Performance based financing and job satisfaction in a semiurban health district in Cameroon. Journal of Public Health in Africa 2018;9(1):760. [DOI] [PMC free article] [PubMed] [Google Scholar]
Menya 2013 {published data only}
- Menya D, Logedi J, Wafula R, Sang E, Manji I, Armstrong J, Neelon B, O'Meara WP. Cluster randomized trial of an innovative pay-for performance (P4P) strategy to improve diagnosis and treatment of malaria in western Kenya. American Journal of Tropical Medicine and Hygiene 2013;89(5 suppl. 1):168-9. [Google Scholar]
Morris 2010 {published data only}
- Morris SS. Conditional Cash Transfer Programs and Health. In: Adato M, Hoddinott J, editors(s). Conditional cash transfers in Latin America. Baltimore, MD: The International Food Policy Research Institute (IFPRI) by Johns Hopkins University Press, 2010:212-230. [Google Scholar]
Mothusi 2009 {published data only}
- Mothusi B. Managing performance improvement in government: lessons of the Botswana experience. African Journal of Public Administration and Management 2009;20(2):23-36. [Google Scholar]
Mukwenha 2020 {published data only}
- Mukwenha S, Dzinamarira T, Mugurungi O, Musuka G. Maintaining robust HIV and tuberculosis services in the COVID-19 era: a public health dilemma in Zimbabwe. International Journal of Infectious Diseases 2020;100:394-5. [DOI] [PMC free article] [PubMed] [Google Scholar]
Mwase 2020 {published data only}
- Mwase T, Lohmann J, Hamadou S, Brenner S, Somda SM, Hien H, et al. Can combining performance-based financing with equity measures result in greater equity in utilization of maternal care services? Evidence from Burkina Faso. International Journal of Health Policy and Management 2020 Jul 27 [Epub ahead of print]. [DOI: 10.34172/ijhpm.2020.121] [DOI] [PMC free article] [PubMed] [Google Scholar]
Nguyen 2017 {published data only}
- Nguyen HT, Bales S, Wagstaff A, Dao H. Getting incentives right? The impact of hospital capitation payment in Vietnam. Health Economics 2017;26(2):263-72. [DOI] [PubMed] [Google Scholar]
Nimpagaritse 2016 {published data only}
- Nimpagaritse M, Korachais C, Roberfroid D, Kolsteren P, El Idrissi MD, Meessen B. Measuring and understanding the effects of a performance based financing scheme applied to nutrition services in Burundi – a mixed method impact evaluation design. International Journal for Equity in Health 2016;15:93. [DOI] [PMC free article] [PubMed] [Google Scholar]
Oyebola 2014 {published data only}
- Oyebola BC, Muhammad F, Otunomeruke A, Galadima A. Effect of performance-based incentives for traditional birth attendants on access to maternal and newborn health-care facilities in Gombe State, Nigeria: a pilot study. New Voices in Global Health 2014;384(Suppl. 1):S10. [Google Scholar]
Peabody 2011b {published data only}
- Peabody J, Shimkhada R, Quimbo S, Florentino J, Bacate M, McCulloch CE, et al. Financial incentives and measurement improved physicians' quality of care in the Philippines. Health Affairs 2011;30(4):773-81. [DOI] [PubMed] [Google Scholar]
Powell‐Jackson 2009 {published data only}
- Powell-Jackson T, Neupane BD, Tiwari S, Tumbahangphe K, Manandhar D, Costello AM. The impact of Nepal's national incentive programme to promote safe delivery in the district of Makwanpur. Advances in Health Economics & Health Services Research 2009;21:221-49. [PubMed] [Google Scholar]
Rai 2015 {published data only}
- Rai NA. Attending to Traditional Birth Attendants: Incentives and Responses in Western Kenya. Georgetown University.
Rajkotia 2017 {published data only}
- Rajkotia Y, Zang O, Nguimkeu P, Gergen J, Djurovic I, Vaz P, et al. The effect of a performance-based financing program on HIV and maternal/child health services in Mozambique – an impact evaluation. Health Policy and Planning 2017;32(10):1386-96. [DOI] [PMC free article] [PubMed] [Google Scholar]
Rwiyereka 2014 {published data only}
- Rwiyereka AK. Making money work for mothers: A quantitative and qualitative assessment of the impact of novel health financing policies on maternal health services in Rwanda. Dissertation Abstracts International: Section B: The Sciences and Engineering 2014;74:no pagination. [Google Scholar]
Saddi 2018 {published data only}
- Saddi FC, Peckham S. Brazilian Payment for Performance (PMAQ) Seen From a Global Health and Public Policy Perspective: What Does It Mean for Research and Policy? Journal of Ambulatory Care Management 2018;41(1):25-33. [DOI] [PubMed] [Google Scholar]
Sahadevan 1992 {published data only}
- Sahadevan KG. India's balance of payments performance: the decade 1980 - 81 [to] 1990 - 91. Finance India 1992:757-772. [Google Scholar]
Sahel 2015 {published data only}
- Sahel A, DeBrouwere V, Dujardin B, Kegels G, Belkaab N, Alaoui Belghiti A. Implementing a nationwide quality improvement approach in health services. Leadership in Health Services 2015;28(1):24-34. [DOI] [PubMed] [Google Scholar]
Salehi 2020 {published data only}
- Salehi AS, Borghi J, Blanchet K, Vassall A. The cost-effectiveness of using performance-based financing to deliver the basic package of health services in Afghanistan. BMJ Global Health 2020;5:9. [DOI] [PMC free article] [PubMed] [Google Scholar]
Saran 2020 {published data only}
- Saran I, Winn L, Kipkoech Kirui J, Menya D, Prudhomme O'Meara W. The relative importance of material and non-material incentives for community health workers: evidence from a discrete choice experiment in Western Kenya. Social Science & Medicine 2020;246:112726. [DOI] [PubMed] [Google Scholar]
Sato 2020a {published data only}
- Sato R, Belel A. The effect of performance-based financing on child vaccinations in northern Nigeria. Vaccine 2020;38(9):2209-15. [DOI] [PubMed] [Google Scholar]
Sato 2020b {published data only}
- Sato R, Belel A. Effect of performance-based financing on health service delivery: a case study from Adamawa state, Nigeria. International Health 2020;13(2):122-9. [DOI] [PMC free article] [PubMed] [Google Scholar]
Scheffler 2012 {published data only}
- Scheffler RM. The Global Shortage of Health Workers and Pay for Performance. In: Rosen B, Israeli A, Shortell S, editors(s). Accountability and responsibility in health care: issues in addressing an emerging global challenge. World Scientific, 2012. [Google Scholar]
Shapira 2018 {published data only}
- Shapira G, Kalisa I, Condo J, Humuza J, Mugeni C, Nkunda D, et al. Going beyond incentivizing formal health providers: evidence from the Rwanda Community Performance-Based Financing program. Health Economics 2018;27(12):2087-106. [DOI] [PubMed] [Google Scholar]
Shei 2012 {published data only}
- Shei Amie C-C. The health impacts of public programs for the poor in Brazil and the United States. Dissertation Abstracts International: Section B: The Sciences and Engineering 2012;73(4-B):2158. [Google Scholar]
Sherry 2012 {published data only}
- Sherry TB, Bauhoff S, Mohanan M. Paying for Performance When Health Care Production is Multi-Dimensional: The Impact of Rwanda's National Program on Rewarded Services, Multitasking and Health Outcome. Working Papers 12-19, Duke University, Department of Economics 2012.
Sherry 2013 {published data only}
- Maternal Health and Child Development Programs in the United States and Rwanda: An Evaluation of Policies to Improve Quality and Efficiency. Doctoral dissertation, Harvard University 2012.
Sieleunou 2020 {published data only}
- Sieleunou I, De Allegri M, Roland Enok Bonong P, Ouedraogo S, Ridde V. Does performance-based financing curb stock-outs of essential medicines? Results from a randomised controlled trial in Cameroon. Tropical Medicine & International Health 2020;25(8):944-61. [DOI] [PubMed] [Google Scholar]
Singh 2020b {published data only}
- Singh P, Masters WA. Performance bonuses in the public sector: winner-take-all prizes versus proportional payments to reduce child malnutrition in India. Journal of Development Economics 2020;146:102295. [DOI] [PMC free article] [PubMed] [Google Scholar]
Smith 2020 {published data only}
- Smith MK, Shen H, Huang S, Zheng H, Yang B, Wiesen C, et al. Detection-based monetary incentives to improve syphilis screening uptake: results of a pilot intervention in a high transmission setting in southern China. Sexually Transmitted Diseases 2020;47(3):187-91. [DOI] [PubMed] [Google Scholar]
Sosa‐Rubi 2015 {published data only}
- Sosa-Rubi S, Galarraga O, Operario D, Saavedra B, Mayer K, Allain NG, et al. Impact of conditional economic incentives to reduce risky behaviours among high-risk men who have sex with men in a three-year randomized pilot study. Journal of the International AIDS Society 2015;18:12. [Google Scholar]
Tawfiq 2018 {published data only}
- Tawfiq E, Desai J, Hyslop D. Effects of results-based financing of maternal and child health services on patient satisfaction in Afghanistan. Journal of Health Services Research & Policy 2018;24(1):4-10. [DOI] [PubMed] [Google Scholar]
Tawfiq 2019 {published data only}
- Tawfiq E, Desai J, Hyslop D. Effects of results-based financing of maternal and child health services on patient satisfaction in Afghanistan. Journal of Health Services and Research Policy 2019;24(1):4-10. [DOI] [PubMed] [Google Scholar]
Thi 2018 {published data only}
- Thi H, Nguyen H. Improving grassroots service delivery using results based financing in Viet, 2018. www.rbfhealth.org/resource/improving-grassroots-service-delivery-using-results-based-financing-vietnam-assessment-nghe (accessed prior to 4 April 2021).
Trap 2011 {published data only}
- Trap R, Trap B, Hansen TW, Hansen EH. Performance based reward for immunization: Experiences from GAVI. Southern Med Review 2011;4(1):40-7. [Google Scholar]
Turcotte‐Tremblay 2018 {published data only}
- Turcotte-Tremblay AM, De Allegri M, Gali-Gali IA, Ridde V. The unintended consequences of combining equity measures with performance-based financing in Burkina Faso. International Journal for Equity in Health 2018;17:109. [DOI] [PMC free article] [PubMed] [Google Scholar]
Turcotte‐Tremblay 2020 {published data only}
- Turcotte-Tremblay AM, Gali Gali IA, Ridde V. An exploration of the unintended consequences of performance-based financing in 6 primary healthcare facilities in Burkina Faso. International Journal of Health Policy and Management 2020 Jun 23 [Epub ahead of print]. [DOI: 10.34172/ijhpm.2020.83] [DOI] [PMC free article] [PubMed] [Google Scholar]
Ustuner 2014 {published data only}
- Ustuner Y, Idrisoglu FK. Neo-Taylorist Practices and Ethics in Public Administration: Pay for Performance in Turkish Public Health Service [Kamu calisma etigi ve neo-taylorist uygulamalar: Turk kamu saglik hizmetinde performansa dayali ucretlendirme ornegi]. Middle East Technical University Studies in Development 2014;41(2):177-200. [Google Scholar]
Vian 2010 {published data only}
- Vian, T. Good governance and performance-based budgeting: Factors affecting reform progress in Lesotho hospitals. Dissertation Abstracts International Section A: Humanities and Social Sciences 2010;71:1111. [Google Scholar]
Wagner 2018b {published data only}
- Wagner AD, Njuguna IN, Neary J, Omondi VO, Otieno VA, Babigumira J, et al. Financial incentives to increase pediatric HIV testing: : study protocol for a randomised controlled trial in Kenya. BMJ Open 2018;8:e024310. [DOI] [PMC free article] [PubMed] [Google Scholar]
Watson‐Grant 2015 {published data only}
- Watson-Grant, S. Measuring country ownership and its relationship to health outcomes: The case of liberia. Dissertation Abstracts International: Section B: The Sciences and Engineering 2015;75:No Pagination. [Google Scholar]
Wise 2017 {published data only}
- Wise A, Kaddu P. Micro-entrepreneur based community health delivery program demonstrates significant reduction in under-five mortality in Uganda at less than $2 per capita. BMC Proceedings 2017;11(10):https://doi.org/10.1186/s12919-017-0074-9. [Google Scholar]
Wright 2018 {published data only}
- Wright J, Eichler R. A review of initiatives that link provider payment with quality measurement of maternal health services in low- and middle-income countries. Health Systems and Reform 2018;4(2):77-92. [Google Scholar]
Yingxia 2017 {published data only}
- Yingxia Z, Jiajun Y, Luo LU, Bin D, Liebin Z. The effectiveness of a pay for performance incentive program on the comprehensive management in patients with type 2 diabetes. Health Policy 2017:1017-23. [Google Scholar]
Yip 2001 {published data only}
- Yip W, Eggleston K. Provider Payment Reform in China: The Case of Hospital Reimbursement in Hainan Province. Health Economics 2001;10(4):325-39. [DOI] [PubMed] [Google Scholar]
Yotebieng 2015 {published data only}
- Yotebieng M, Thirumurthy H, Moracco KE, Kawende B, Chalachala JL, Wenzi LK, et al. Effectiveness of conditional cash transfers to increase retention in care and adherence to PMTCT services: A randomized controlled trial. Journal of the International AIDS Society 2015;18:63-5. [Google Scholar]
Zeng 2018b {published data only}
- Zeng W, Lannes L, Mutasa R. Utilization of health care and burden of out-of-pocket health expenditure in Zimbabwe: results from a national household survey. Health Systems and Reform 2018;4(4):300-12. [DOI] [PubMed] [Google Scholar]
Zhang 2019 {published data only}
- Zhang H, Doorslaer E, Xu L, Zhang Y, de Klundert J. Can a results-based bottom-up reform improve health system performance? Evidence from the rural health project in China. Health Economics 2019;28(10):1204-19. [DOI] [PubMed] [Google Scholar]
Zheng 2019 {published data only}
- Zheng CY, Musominali S, Chaw GF, Paccione G. A performance-based incentives system for village health workers in Kisoro, Uganda. Annals of Global Health 2019;85(1):46. [DOI] [PMC free article] [PubMed] [Google Scholar]
Zizien 2019 {published data only}
- Zizien ZR, Korachais C, Compaore P, Ridde V, De Brouwere V. Contribution of the results-based financing strategy to improving maternal and child health indicators in Burkina Faso. International Journal of Health Planning and Management 2019;34(1):111-29. [DOI] [PubMed] [Google Scholar]
Zombre 2020 {published data only}
- Zombre D, De Allegri M, Ridde V. No effects of pilot performance-based intervention implementation and withdrawal on the coverage of maternal and child health services in the Koulikoro region, Mali: an interrupted time series analysis. Health Policy and Planning 2020;35(4):379-87. [DOI] [PubMed] [Google Scholar]
References to ongoing studies
Agarwal 2019 {published data only}
- Agarwal S, Anaba U, Abuya T, Kintu R, Casseus A, Hossain S, et al. Understanding incentive preferences of community health workers using discrete choice experiments: a multicountry protocol for Kenya, Uganda, Bangladesh and Haiti. BMJ Open 2019;9(12):e033601. [DOI] [PMC free article] [PubMed]
Burkina Faso {published data only}
- RBF Health. Burkina Faso impact evaluation. www.rbfhealth.org/impact-evaluation/burkina-faso-impact-evaluation (accessed prior to 24 January 2020).
Burundi {published data only}
- RBF Health. Burundi impact evaluation. www.rbfhealth.org/impact-evaluation/burundi-impact-evaluation (accessed prior to 24 January 2020).
Ethiopia {published data only}
- CORDAID. Equitable health care through RBF in Ethiopia. www.cordaid.org/en/publications/equitable-health-care-through-pbf-in-ethiopia (accessed prior to 24 January 2020).
Ghana {published data only}
- RBF Health. Ghana impact evaluation. www.rbfhealth.org/impact-evaluation/ghana-impact-evaluation (accessed prior to 24 January 2020).
Haiti {published data only}
- RBF Health. Haiti Impact Evaluation. www.rbfhealth.org/impact-evaluation/haiti-impact-evaluation (accessed prior to 24 January 2020).
ISRCTN14332616 {published data only}
- ISRCTN14332616. Impact evaluation of Zambia health results-based financing pilot. www.isrctn.com/ISRCTN14332616 (first received 12 December 2014).
ISRCTN14667607 {published data only}
- ISRCTN14667607. Impact and cost-effectiveness of integrated care and results-based financing intervention on adherence among pulmonary tuberculosis patients in Georgia. www.isrctn.com/ISRCTN14667607 (first received 14 January 2019).
ISRCTN16392613 {published data only}
- ISRCTN16392613. Impact evaluation of Zimbabwe's health results based financing project. www.isrctn.com/ISRCTN16392613 (first received 5 December 2014).
Kyrgyz Republic {published data only}
- RBF Health. Kyrgyz Republic impact evaluation. www.rbfhealth.org/impact-evaluation/kyrgyz-republic-impact-evaluation (accessed prior to 24 January 2020).
Lesotho {published data only}
- RBF Health. Lesotho impact evaluation. www.rbfhealth.org/impact-evaluation/lesotho-impact-evaluation (accessed prior to 24 January 2020).
NCT03890653 {published data only}
- NCT03890653. Impact evaluation of the Nigeria result-based financing project. clinicaltrials.gov/ct2/show/NCT03890653 (first received 26 March 2019).
Nigeria {published data only}
- RBF Health. Nigeria impact evaluation. www.rbfhealth.org/impact-evaluation/nigeria-impact-evaluation (accessed prior to 24 January 2020).
Tajikistan A {published data only}
- RBF Health. Tajikistan impact evaluation. www.rbfhealth.org/impact-evaluation/tajikistan-impact-evaluation (accessed prior to 24 January 2020).
Tajikistan B {published data only}
- RBF Health. Baseline study for the impact evaluation of a performance based financing (PBF) pilot in Tajikistan. documents.worldbank.org/curated/en/992471492590596793/pdf/114374-WP-TajikistanPBFIEBaselinereportFinal-PUBLIC.pdf (accessed prior to 24 January 2020).
The Gambia {published data only}
- RBF Health. The Gambia maternal and child nutrition and health results project baseline survey report. www.rbfhealth.org/sites/rbf/files/documents/Gambia%20IE%20baseline%20report.pdf (accessed prior to 24 January 2020).
Uganda {published data only}
- CORDAID. Improving health service delivery through PBF. www.cordaid.org/en/publications/improving-health-service-delivery-through-pbf (accessed prior to 24 January 2020).
Additional references
Binyaruka 2018a
- Binyaruka P, Robberstad B, Torsvik G, Borghi J. Who benefits from increased service utilisation? Examining the distributional effects of payment for performance in Tanzania. International Journal for Equity in Health 2018;17:14. [DOI] [PMC free article] [PubMed] [Google Scholar]
Blacklock 2016
- Blacklock C, MacPepple E, Kunutsor S, Witter S. Paying for performance to improve the delivery and uptake of family planning in low and middle income countries: a systematic review. Studies in Family Planning 2016;47(4):309-24. [DOI] [PMC free article] [PubMed] [Google Scholar]
Campbell 2020
- Campbell M, McKenzie JE, Sowden A, Katikireddi SV, Brennan SE, Ellis S, et al. Synthesis without meta-analysis (SWiM) in systematic reviews: reporting guideline. BMJ 2020;368:l6890. [DOI] [PMC free article] [PubMed] [Google Scholar]
Cashin 2014
- Cashin C, Chi Y, Smith PC, Borowitz M, Thomson S. Paying for Performance in Health Care: Implications for Health System Performance and Accountability. New York (NY): World Health Organization, 2014. [Google Scholar]
Christianson 2007
- Christianson J, Leatherman S, Sutherland K. Financial Incentives, Health Care Providers and Quality Improvements: a Review of the Evidence. London (UK): The Health Foundation, 2007. [Google Scholar]
Dale 2014
- Dale EM. Performance-Based Payments, Provider Motivation and Quality of Care in Afghanistan [Doctor of Philosophy thesis]. Baltimore (MD): Johns Hopkins University, 2014. [Google Scholar]
Das 2016
- Das A, Gopalan SS, Chandramohan D. Effect of pay for performance to improve quality of maternal and child care in low- and middle-income countries: a systematic review. BMC Public Health 2016;16:321. [DOI] [PMC free article] [PubMed] [Google Scholar]
Deci 1999
- Deci E, Ryan R, Koestner R. A meta-analytic review of experiments examining the effects of extrinsic rewards on intrinsic motivation. Psychological Bulletin 1999;125(6):627-8. [DOI] [PubMed] [Google Scholar]
Deeks 2019
- Deeks JJ, Higgins JP, Altman DG. Chapter 10: Analysing data and undertaking meta-analyses. In: Higgins JP, Thomas J, Chandler J, Cumpston M, Li T, Page MJ, et al, editor(s). Cochrane Handbook for Systematic Reviews of Interventions version 6.0 (updated July 2019). Cochrane, 2019. Available from training.cochrane.org/handbook/archive/v6.
Eichler 2006
- Eichler R. Can "Pay for Performance" increase utilization by the poor and improve the quality of health services? Center for Global Development. Discussion paper for the first meeting of the Working Group on Performance-Based Incentives. 2006.
EPOC 2017a
- Cochrane Effective Practice and Organisation of Care (EPOC). Suggested risk of bias criteria for EPOC reviews. EPOC resources for review authors, 2017. epoc.cochrane.org/resources/epoc-resources-review-authors (accessed prior to 24 January 2020).
EPOC 2017b
- Cochrane Effective Practice and Organisation of Care (EPOC). Interrupted time series (ITS) analyses. EPOC resources for review authors, 2017. epoc.cochrane.org/resources/epoc-resources-review-authors (accessed prior to 24 January 2020).
EPOC 2017c
- Cochrane Effective Practice and Organisation of Care (EPOC). EPOC worksheets for preparing a summary of findings (SoF) table using GRADE. EPOC resources for review authors, 2017. epoc.cochrane.org/resources/epoc-resources-review-authors (accessed 24 January 2020).
Higgins 2019
- Higgins JP, Thomas J, Chandler J, Cumpston M, Li T, Page MJ, et al. Cochrane Handbook for Systematic Reviews of Interventions version 6.0 (updated July 2019). Cochrane, 2019. Available from training.cochrane.org/handbook/archive/v6. [DOI] [PMC free article] [PubMed]
Huillery 2014
- Huillery E, Seban J. Performance-based financing, motivation and final output in the health sector: experimental evidence from the Democratic Republic of Congo. No 2014-12, Sciences Po Economics Discussion Papers, Sciences Po Department of Economics. 2014.
Hultcrantz 2017
- Hultcrantz M, Rind D, Akl EA, Treweek S, Mustafa RA, Iorio A, et al. The GRADE Working Group clarifies the construct of certainty of evidence. Journal of Clinical Epidemiology 2017;87:4-13. [DOI] [PMC free article] [PubMed] [Google Scholar]
Josephson 2017
- Josephson E, Gergen J, Coe M, Ski S, Madhavan S, Bauhoff S. How do performance-based financing programmes measure quality of care? A descriptive analysis of 68 quality checklists from 28 low- and middle-income countries. Health Policy and Planning 2017;32(8):1120-6. [DOI] [PMC free article] [PubMed] [Google Scholar]
Lagarde 2011
- Lagarde M, Palmer N. The impact of user fees on access to health services in low- and middle-income countries. Cochrane Database of Systematic Reviews 2011, Issue 4. Art. No: CD009094. [DOI: 10.1002/14651858.CD009094] [DOI] [PMC free article] [PubMed] [Google Scholar]
Lewin 2017
- Lewin S, Hendry M, Chandler J, Oxman AD, Michie S, Shepperd S, et al. Assessing the complexity of interventions within systematic reviews: development, content and use of a new tool (iCAT_SR). BMC Medical Research Methodology 2017;17:76. [DOI] [PMC free article] [PubMed] [Google Scholar]
Linden 2015
- Linden A. Conducting interrupted time-series analysis for single- and multiple-group comparisons. Stata Journal 2015;15(2):480-500. [Google Scholar]
Marquand 2004
- Marquand D. Decline of the Public. The Hollowing Out of Citizenship. Cambridge (UK): Polity Press, 2004. [Google Scholar]
Meessen 2011
- Meessen B, Soucat A, Sekabaraga C. Performance-based financing: just a donor fad or a catalyst towards comprehensive health-care reform? Bulletin of the World Health Organization 2011;89:153-6. [DOI] [PMC free article] [PubMed] [Google Scholar]
Murad 2017
- Murad MH, Mustafa RA, Schünemann HJ, Sultan S, Santesso N. Rating the certainty in evidence in the absence of a single estimate of effect. BMJ Evidence-Based Medicine 2017;22:85-7. [DOI] [PMC free article] [PubMed] [Google Scholar]
Musgrove 2011
- Musgrove P. Financial and other rewards for good performance or results: a guided tour of concepts and terms and a short glossary, 2011. www.rbfhealth.org/sites/rbf/files/RBFglossarylongrevised_0.pdf (accessed prior to 24 January 2020).
Ogundeji 2016
- Ogundeji YK, Bland JM, Sheldon TA. The effectiveness of payment for performance in health care: A meta-analysis and exploration of variation in outcomes.. Health Policy 2016;120(10):1141-1150. [DOI] [PubMed] [Google Scholar]
Oxman 2008
- Oxman AD, Fretheim A. An overview of research on the effects of results-based financing. Report Nr 16-2008. Oslo: Nasjonalt kunnskapssenter for helsetjenesten. 2008. [PubMed]
RBF Health 2020
- RBF Health. Projects. www.rbfhealth.org/projects (accessed prior to 24 January 2020).
Renmans 2016
- Renmans D, Holvoet N, Orach CG, Criel B. Opening the 'black box' of performance-based financing in low- and lower middle-income countries: a review of the literature. Health Policy and Planning 2016;31(9):1297-309. [DOI] [PubMed] [Google Scholar]
Schünemann 2013
- Schünemann H, Brożek J, Guyatt G, Oxman A, editor(s). Handbook for grading the quality of evidence and the strength of recommendations using the GRADE approach (updated October 2013). GRADE Working Group, 2013. Available from gdt.guidelinedevelopment.org/app/handbook/handbook.html.
Singh 2020a
- Singh NS, Kovacs RJ, Cassidy R, Kristensen SR, Borghi J, Brown GW. A realist review to assess for whom, under what conditions and how pay for performance programmes work in low- and middle-income countries. Social Science & Medicine 2021;270:113624. [DOI] [PubMed] [Google Scholar]
Soucat 2017
- Soucat A, Dale E, Mathauer I, Kutzin J. Pay-for-performance debate: not seeing the forest for the trees. Health Systems & Reform 2017;3(2):74-9. [DOI] [PubMed] [Google Scholar]
Turcotte‐Tremblay 2016
- Turcotte-Tremblay AM, Spagnolo J, De Allegri M, Ridde V. Does performance-based financing increase value for money in low- and middle-income countries? A systematic review. Health Economics Review 2016;6(1):30. [DOI] [PMC free article] [PubMed] [Google Scholar]
Witter 2009
- Witter S, Kessy FL, Fretheim A, Lindahl AK. Paying for performance to improve the delivery of health interventions in low and middle-income countries. Cochrane Database of Systematic Reviews 2009, Issue 3. Art. No: CD007899. [DOI: 10.1002/14651858.CD007899.pub2] [DOI] [PMC free article] [PubMed] [Google Scholar]
Witter 2013
- Witter S, Toonen J, Meessen B, Kagubare J, Fritsche G, Vaughan K. Performance-based financing as a health system reform: mapping the key dimensions for monitoring and evaluation. BMC Health Services Research 2013;13:367. [DOI] [PMC free article] [PubMed] [Google Scholar]
Witter 2019a
- Witter S, Chirwa Y, Chandiwana P, Munyati S, Pepukai M, Bertone MP. The political economy of results-based financing: the experience of the health system in Zimbabwe. Global Health Research and Policy 2019;4:20. [DOI] [PMC free article] [PubMed] [Google Scholar]
References to other published versions of this review
Witter 2009b
- Witter S, Kessy FL, Fretheim A, Lindahl AK. Paying for performance to improve the delivery of health interventions in low and middle‐income countries. Cochrane Database of Systematic Reviews 2009, Issue 3. Art. No: CD007899. [DOI: 10.1002/14651858.CD007899] [DOI] [PMC free article] [PubMed] [Google Scholar]
Witter 2012
- Witter S, Fretheim A, Kessy FL, Lindahl AK. Paying for performance to improve the delivery of health interventions in low- and middle-income countries. Cochrane Database of Systematic Reviews 2012, Issue 2. Art. No: CD007899. [DOI: 10.1002/14651858.CD007899.pub2] [DOI] [PubMed] [Google Scholar]