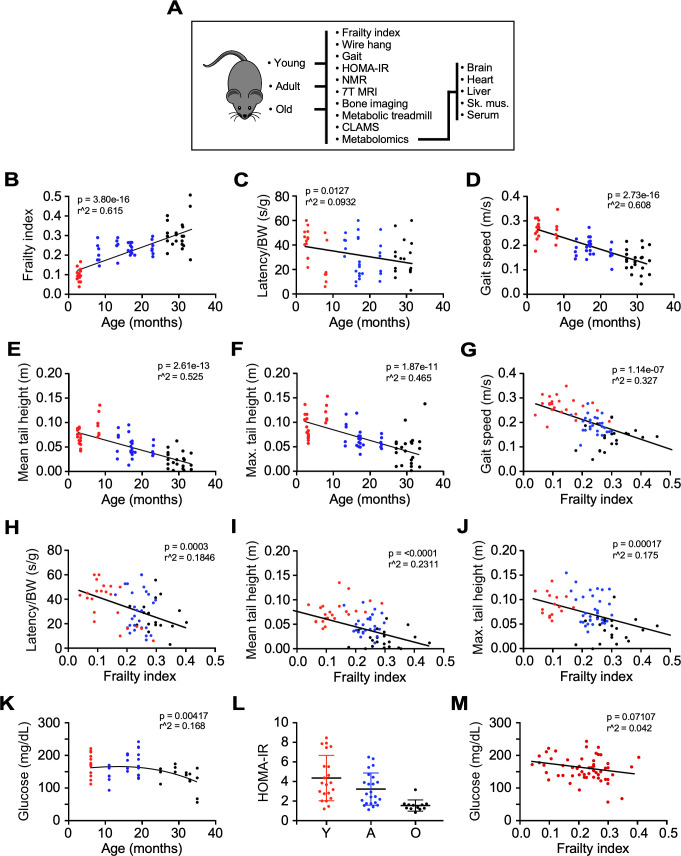
Figure 1. Impact of age and frailty on motor function, gait, and glucose homeostasis in male C57BL/6N mice.
(A) Flowchart depicting analyses performed in the study. (B–D) Effects of age on frailty index, motor function, and gait speed in mice. (E–F) Mean and maximum tail height as a function of age. (G–J) Negative correlation between gait speed, motor function, and tail height with frailty. (K) Dependence of fasting blood glucose with age. (L) Scatter plot depicting insulin sensitivity as measured by the HOMA-IR index. (M) Relationship between fasting blood glucose and frailty index. Glucose measurement was performed 3 months after frailty assessment. (B–M): Mice ranged in age from 3 to 33 months. Y: young (3–8 mo, n = 23); A, adult (13–23 mo, n = 26); O: old (27–33 mo, n = 22). The actual number of data points shown on the graphs varies as not all mice were tested for any given intervention.


