

Abstract
Cervical cancer (CC) is the fourth leading cause of deaths in gynecological malignancies. Although the etiology of CC has been extensively investigated, the exact pathogenesis of CC remains incomplete. Recently, single-cell technologies demonstrated advantages in exploring intra-tumoral diversification among various tumor cells. However, single-cell transcriptome analysis (single-cell RNA sequencing [scRNA-seq]) of CC cells and microenvironment has not been conducted. In this study, a total of 20,938 cells from CC and adjacent normal tissues were examined by scRNA-seq. We identified four tumor cell subpopulations in tumor cells, which had specific signature genes with different biological functions and presented different prognoses. Among them, we identified a subset of cancer stem cells (CSCs) that was related to the developmental hierarchy of tumor progression. Then, we compared the expressive differences between tumor-derived endothelial cells (TECs) and normal ECs (NECs) and revealed higher expression of several metabolism-related genes in TECs. Then, we explored the potential biological function of ECs in vascularization and found several marker genes, which played a prior role in connections between cancer cells and ECs. Our findings provide valuable resources for deciphering the intra-tumoral heterogeneity of CC and uncover the developmental procedure of ECs, which paves the way for CC therapy.
Keywords: cervical cancer, tumor heterogeneity, single-cell RNA sequencing, endothelial cell
Graphical abstract
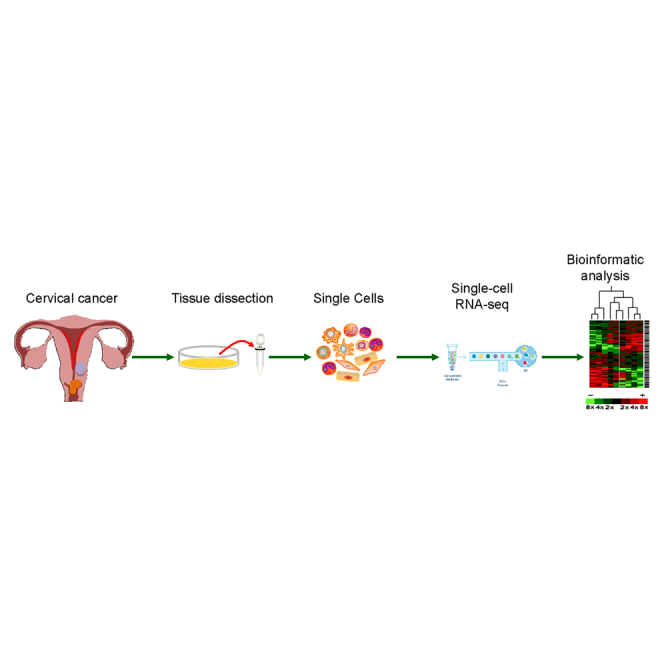
This study characterizes intra-tumor heterogeneity and developmental procedures of cervical cancer (CC) at single-cell resolution and provides valuable resources for therapeutic strategies of CC.
Introduction
Cervical cancer (CC) remains the most common gynecological tumor and the leading cause of cancer-related deaths in women worldwide.1 Although surgery and radiotherapy are the most effective treatment, ∼30% of patients will still progress.2 Anti-angiogenesis and immunotherapy have provided survival benefits; however, response rates and durability of response need to be improved.3,4 The greatest risk factor for CC is infection with certain types of human papillomavirus (HPV), but viral infection alone is not sufficient to explain its development.5 It is generally believed that CC tumors exhibit high heterogeneity both inter-tumor and in the microenvironment, allowing cancer to evolve continuously in the process of disease development, leading to treatment failure.6
One of the important sources of tumor heterogeneity is molecular variation within tumor subclones and even between individual cells.6,7 These variations drive tumor progression through the dysregulation of key oncogenes or pathways and contributes to the evolutionary adaptation of tumors.8 Previous gene expression studies from bulk transcriptional data have largely revealed transcriptional variation that may affect prognosis.9 However, one of the major limitations is that bulk sequencing of tumor samples is unable to identify small subsets of tumor tissues. As a revolutionary method, single-cell RNA sequencing (scRNA-seq) has been widely used in various fields to dissect cellular compositions and characterize molecular properties of complex tissues.10,11 To date, the full spectrum of differences from the single-cell level in CC compared with its adjacent normal counterpart has not been estimated.
Here, we present the first study of gene expression patterns for CC at a previously unrealized transcriptomic resolution by utilizing scRNA-seq technology. Through the analysis of single cells from CC, we uncovered the characteristics of various cell populations and mined the biological functions of endothelial cells (ECs) in CC progression and drug resistance.
Results
Single-cell transcriptional atlas and cell compositions in CC and adjacent normal samples
Cervical tissue consists of various cell types, such as epithelial cells, smooth muscle cells, fibroblasts, ECs, endometrial stromal cells, and immune cells (Figure 1A; Figure S1A). Because of the abundant blood supply, CC tends to be in large volume (Figure 1B). To explore the diverse cell compositions in CC tissue, scRNA-seq was conducted on all living cells isolated from CC and adjacent normal tissues with the 10x Genomics Chromium platform. Among the cells sequenced, a total of 11,289 cells from the tumor sample and 9,649 cells from the adjacent normal sample met our quality control (QC) metrics and were further analyzed to identify various cell types (Table S1). By using a graph-based clustering method (see Materials and methods), we identified 13 cell clusters (Figure 1C). Putative cell type identities were then assigned by cross-referencing genes differentially expressed in each cluster (Figures 1C and 1D; Figure S1B). Cells in cluster 0, 1, 3, and 8 cells expressed high levels of EPCAM, CDH1, and CDKN2A and were classified as epithelial/cancer cells. We found that the number of epithelial/cancer cells in the tumor sample was much higher than that in the normal sample. Cluster 4 had a high level of EGFL7, EMCN, and PECAM1 and was identified as an EC cluster (Figure 1E). Clusters 2 and 6 were assigned as smooth muscle cells, as distinguished by selective expression of ACTG2. Cells in cluster 7 expressed high levels of COL1A2 and APOD and were identified as fibroblasts. In view of the high expression level of SUSD2, cells in clusters 5, 9, and 12 were assigned as endometrial stromal cells. We also identified a small population of immune cells, including macrophages (cluster 10) and lymphocytes (cluster 11). Meanwhile, we also acquired several significant genes for each cluster for further analysis. In addition, we were able to identify marker genes that were known to be affected by HPV infection, such as TP53 and RB1 (Figures S1C and S1D). We found that the target cells of HPV infection were among small portions of epithelial cells, ECs, and macrophages (Figures S1E and S1F). We speculated that these cells were associated with the origin, progression, and metastasis of HPV-related CC.
Figure 1.

Identification of CC cell populations
(A) An overview schematic of the cell populations with the CC and adjacent normal samples. (B) MRI showing the location and volume of CC. (C) The t-distributed stochastic neighbor embedding (t-SNE) plot demonstrating main cell types in CC. (D) Heatmap shows expression levels of specific markers in each cell cluster. (E) Expression levels of representative well-known markers across the cell types in CC. Color key from gray to red indicates relative expression levels from low to high. The expression level was normalized by the LogNormalize method in Seurat.
Single-cell transcriptomics reveal intra-tumoral heterogeneity in CC cells
We next explored epithelial/cancer cells and mutual expression patterns of their marker genes (EPCAM, TP63, CDH1, and CDKN2A). We detected 10,457 epithelial/tumor cells, 10,395 from the tumor sample and 62 from the adjacent normal sample (Figures 2A and 2B), which were classified into four clusters (clusters 0, 1, 3, and 8) (Figures 2C and 2D; Figures S2A–S2D). They were divided into four cell groups with different biological functions according to the markers identified for each of these clusters. We found that proliferation-related genes, such as MKI67 (KI67 gene), CCNB1, and TOP2A, were enriched in cluster 3 (Figures 2C and 2D). KI67 is a protein that primarily plays a role in cell proliferation by enhancing the activity of cathepsin.12,13 According to previous studies, high KI67 expression in CC is related to the size of tumors, progression of tumors, and lymph node metastases.14 Gene set enrichment analysis (GSEA) analysis showed that biological pathways, such as cell cycle, oocyte meiosis, RNA degradation, and fatty acid metabolism and biosynthesis were enriched in cluster 3 (Figure 2E). Meanwhile, cluster 3 was found to have higher levels of G2/M signatures, suggesting high proliferative activity. Cluster 1 showed a high level of CEACAM6, CD55, and GJB6. CEACAM6 is a carcinoembryonic antigen family and is widely expressed in epithelial cells, ECs, and hematopoietic cells including neutrophils, T cells, and NK cells.15 It is reported that CEACAMs are able to transmit signals that result in a variety of effects, including tumor promotion, angiogenesis, neutrophil activation, and lymphocyte activation. Indeed, CEACAM1, CEACAM5, and CEACAM6 are now considered valid clinical biomarkers and promising therapeutic targets in melanoma, lung, colorectal, and pancreatic cancers.16 Then, GSEA analysis according to the marker gene sets implicated immune regulation signaling pathways, such as Vibrio cholerae infection, shigellosis, and ErbB signaling pathway, enriched in cluster 1 (Figure 2E). We found that cells in cluster 0 presented high levels of DEFB1, KRT5, CXCL10, WARS, LY6D, CRABP2, CXCL9, PHOV, C10orf99, and PYCARD and were enriched in a variety of features and metabolism-related signaling pathways, such as steroid biosynthesis, mismatch repair, and peroxisome (Figure 2E). We presumed these cells in cluster 0 to be the terminal stage during tumor progression. However, the cells in cluster 8 presented high expression of stem-related genes such as SOX2 and ALDHA1, and we presumed them to be the origin of cancer cells during tumor progression (Figure 2E).
Figure 2.

Heterogeneity of tumor cells in CC
(A) t-SNE representation of 4 clusters generated from all tumor cells. (B) The cell number and percentage of assigned cell types. (C) Heatmap shows expression levels of specific markers of cell type in 4 clusters. (D) Expression levels of representative well-known markers across the 4 clusters (0, 1, 3, and 8) in cancer cells. (E) Heatmap shows the representative gene ontology and pathway terms enriched in each subgroup. Color key from blue to red indicates Z score of −log10(p value). (F) Heatmap shows the expression patterns of representative cancer markers across the 216 CC samples in the TCGA CESC cohort. (G) Kaplan-Meier survival analysis of tumor samples grouped in (F). Statistical significance was determined by log-rank test.
Samples derived from the The Cancer Genome Atlas (TCGA) CESC cohort were divided into four major groups, defined as clusters A–D, by K-means clustering (k = 4 for samples, k = 5 for genes) with the marker genes from scRNA-seq data (Figure 2F; Figure S2E). In particular, cluster A, rich in Geneclass3, showed cell development and differentiation, corresponding to cluster 8 in scRNA-seq. Cluster B, rich in Geneclass2 and 5, presented the response to oxygen levels, hypoxia, and glucocorticoid, as well as extracellular matrix (ECM) organization, responding to cluster 0. Cluster C, enriched with Geneclass1, presented mitotic nuclear division, organelle division, chromosome segregation, and spindle organization, suggesting the proliferative status, corresponding to cluster 3. Cluster D, enriched with Geneclass4, presented the response to virus, tumor necrosis factor (TNF)-α signaling pathway, and response to interferon (IFN)-γ, suggesting an inflammatory response status, corresponding to cluster 1. Then, we found that cluster D (cluster 1 in scRNA-seq) was associated with a favorable survival outcome, while cluster B (cluster 0 in scRNA-seq) usually had a worse prognosis (Figure 2G). These results indicated that discovery obtained from single-cell transcriptomics suggested relevant clinical consequence. These findings further warrant the practical use of single-cell transcriptomics to understand CC tumor biology.
Reconstruction of progressive trajectory of CC from CSCs
The theory of CC stem cells (CSCs) assumes that not all tumor cells present equally with regard to self-renewal, tumorigenesis, and maintenance potential.17,18 CSCs are a small subpopulation of tumor cells that play a decisive role in tumorigenesis, while the majority of tumor cells die after transient differentiation.19 Cell surface markers and transcription factors, including SOX220 and aldehyde dehydrogenase 1 (ALDH1),21 have been used to isolate and identify CSC populations from different tumors including CC.22 The CSC marker genes ALDH1A1 and SOX2 were significantly higher in cluster 8 (Figures 3A and 3B). To further investigate the developmental procedure from stem-like tumor cells expressing SOX2 and ALDH1A1 to differentiated cancer cells, we performed subcluster identification in cluster 8 (Figures S3A and S3C). The analysis uncovered six subclusters, each of which was enriched for a specific functional category. We found that SOX2 and ALDH1A1 presented a higher expression level in subcluster 1 than in other subclusters (Figure 3C; Figure S3B). GSEA analysis revealed that subcluster 1 showed high levels of stem-related signaling pathways, such as transforming growth factor (TGF)-β signaling pathway, Hedgehog signaling pathway, and Notch signaling pathway (Figure 3D). These findings shed light on the hierarchical structure and heterogeneity of cervical CSCs.
Figure 3.

Expression patterns of cervical cancer stem cells with tumor progression
(A) Violin plots display the expression of representative stem-related markers across four cancer cell clusters identified in CC. (B) ALDH1A1 and SOX2 expression stained in CC normal and cancer samples derived from THPA database. (C) Violin plots display the expression of representative stem-related markers in six subclusters of cancer cells in cluster 8. (D) Heatmap shows representative stem-related signaling pathways in six subclusters of cancer cells in cluster 8. (E) Pseudo-time trajectory of cancer cells in cluster 8 with gene expression profiles inferred by Monocle 2. Each point corresponds to a single cell. (F) The differentially expressed genes (rows) along the pseudo-time (columns) were clustered hierarchically into six profiles.
To identify transcriptional adaptability in cancer cells at different stages of tumor development, we performed a pseudo-time analysis to reveal gene expression trajectories related to functional changes. Based on the changes in transcriptional activities of cells in cluster 8, we defined four gene co-expression modules. Module 1 (referring to cells in states 4 and 6) displayed prominent ontology terms, such as cell differentiation (Figure S3E). Notably, most of the cells in subcluster 1 were located at the root of trajectory, which is consistent with the functional annotation and state characterization of module 1. Module 2 (referring to cells in state 5) acquired DNA/RNA catabolic-related genes, with high expression of V4GALT4, B3GNT5, FUT2, ST3GAL6, and GCNT2 (Figure S3E). Cells in subcluster 2 were at one end of the pseudotemporal trajectory (Figures 3E and 3F; Figure S3E). We found that most of the cells in subclusters 3, 4, and 5 were located at other ends of the pseudotemporal trajectory and correspond to module 3 and module 4, respectively (Figures 3E and 3F). The functional annotation of module 3 (referring to cells in state 1) presented biological functions, such as T and B cell receptor signaling pathway and immune network for IgA production (Figures 3E and 3F; Figure S3E). Module 4 (referring to cells in state 5) showed glutathione metabolism, RNA transport, and beta-alanine metabolism, including JUN, SKP1, PSMB9, ACTB, and PSMA5. In addition, cells in subcluster 0 were distributed in the trajectory of a pseudo-timescale with ECM-receptor interaction, aldosterone-regulated sodium reabsorption, and mRNA surveillance pathway (Figures 3E and 3F; Figure S3E). The expression of stem-related marker SOX2 descended gradually during the transition, while genes previously reported to be involved in tumor progression, such as PSMA5 and JUN, gradually increased along tumor progression (Figure S3D). Our analysis revealed that the cancer cells in early phase showed relatively high differentiation potential and then the cells proliferated rapidly. As expected, in late stages of tumor growth, tumor cells showed a series of functions, such as immune response, cell metabolism, and signal transduction. These results reflected the complexity and heterogeneity of tumor progression.
ECs exert different functions in cancer and normal tissues
Angiogenesis is important in both normal and disease tissues and represents a key target in cancer treatment.23 A total of 1,803 ECs derived from tumor or adjacent normal tissues were detected by scRNA-seq. The analysis of hallmark pathway gene signatures emphasized that metabolic regulation was the most abundant signature in tumor-derived ECs (TECs). In particular, the top 10 different expression genes (DEGs), either upregulated or downregulated, were mainly related to metabolic processes (Figure 4A). Hence, we conducted ontological enrichment analysis of the upregulated or downregulated DEGs. TECs were found to be enriched in the regulation of peptidase activity, the regulation of proteolysis, and the extracellular structure organization, while normal ECs (NECs) had basic biological functions, such as vascular system development, angiogenesis, EC migration, and endothelial development (Figures 4B and 4C). Meanwhile, GSEA analysis also showed that TECs were enriched in xenobiotics metabolism, PPAR signaling pathway, amino acid biosynthesis, carbon metabolism, and glycolysis/gluconeogenesis, which are essential for tumor cell metabolism. In addition, other enriched pathways included DNA replication, citrate cycle (TCA cycle), and cell cycle, which are important for cell proliferation.
Figure 4.

The difference between NECs and TECs in CC
(A) Volcano plot of differentially expressed genes (DEGs) of NECs between tumor and normal samples. Symbols of top 10 upregulated and downregulated genes were annotated, respectively. (B) Gene Ontology analysis of upregulated DEGs. (C) Gene Ontology analysis of downregulated DEGs. (D) Violin plots show the smoothened expression distribution of selected genes involved in angiogenesis between NECs and TECs. (E) Violin plots show the smoothened expression distribution of selected genes involved in immune activation between NECs and TECs. (F) GSEA shows the differences in pathway activities between NECs and TECs.
The most significantly downregulated pathways involved in immune regulation are allograft rejection and intestinal immunity. Other important signaling pathways related to signal transduction include AGE-RAGE, PI3K-Akt, cGMP-PKG, cytokine-cytokine receptor interaction, and TNF signaling pathway (Figure 4E). As we all know, endothelium is the main interface between circulating immune cells, inflammatory mediators, small molecules, and tumor cells and plays an important role in transferring signals and presenting epitopes from tissues to the immune system.24 Gene categories include those genes related to chemotaxis (CCL2, CCL14, CXCL2, HLA-DQA1, HLA-DQB1, HLA-DRA, CD34, CD74, and IL1R) and immune cell homing (ICAM1, ICAM2, and ICAM4) (Figures 4D and E). In addition, based on public datasets from the Gene Expression Omnibus (GEO) database and EC marker genes, we identified 6 downregulated genes (CXCL8, STMN1, CKS2, WARS, ISG15, and IFI6) and 4 upregulated genes (GPX3, KLF4, IGFBP5, and SH3BGRL) (Figure S4A). Surprisingly, upregulated genes were associated with metabolic regulation, while downregulated genes were related with the immune activation. Together, these results indicate that TECs are transcriptionally reprogrammed to upregulate their metabolic function, which is related to the development of tumor, and downregulate their antigen presentation and immune cell homing activities, thus contributing to tumor immune tolerance. These results implicated the potential synergy of anti-angiogenesis therapy and checkpoint immunotherapy for treating patients with CC.
Finally, to assess which transcription factors made major contributions to the difference in expression between TECs and NECs, we applied single-cell regulatory network inference and clustering (SCENIC) to scan differentially expressed genes for overrepresented transcription factor binding sites and analyzed co-expression of transcription factors and their putative target genes (Figures S4B and S4C). Our analysis found the downregulation of Fos/Jun and ELK3 and upregulation of STAT1, KLF5, and TAGLN2 in TECs. Interestingly, Fos/Jun is related to the expression of ICAM1 in ECs, and other genes involved in immune activation also showed putative Fos/Jun binding sites, indicating that the loss of Fos/Jun is the basis for the reduced immunostimulatory phenotype of TECs. TAGLN2 is a protein related to actin stress fiber, which could stabilize actin filaments.25 The overexpression of TAGLN2 in tumor samples is related to lymph node metastasis and distant metastasis, late stage, and poor survival in CC. Jin et al. reported that the expression of TAGLN2 in micro-vascular ECs was significantly higher than that in matched normal individuals in lung cancer and it played an important role in tumor angiogenesis.26 KLF5 is a basic transcription factor that regulates a variety of physiological and pathological processes. A large amount of evidence indicates that KLF5 has a key role in regulating cell proliferation in various cancers.27 Interestingly, KLF5 also promotes angiogenesis by directly regulating VEGFA transcription.28
Heterogeneity analysis unveils transitional trajectory of ECs in CC
To characterize various EC phenotypes, we identified 7 subclusters in the EC cluster (Figure 5A). Next, we attempted to identify marker genes for each subcluster and assign them to known EC types.29,30 Subclusters 0 and 6 shared the majority of genes with similar expression, while subclusters 1, 4, and 5 showed the most similar genes. However, subclusters 2 and 3 were found to share no specific genes. Further analysis revealed that arterial markers ELN and EGR1 were the most abundant in subclusters 0 and 6, while venous marker genes LRG1 and ICAM1 were identified in subclusters 1, 4, and 5 (Figure 5B). Arteriolar ECs expressed both arterial and capillary markers (IGFBP3 and ARL15), which was consistent with their topographical location across the vascular tree (in between arteries and capillaries). We therefore named arteriolar ECs “capillary-arterial” ECs. Similarly, because venular ECs express venous and capillary markers (EMCN and FOS), we defined venular ECs as “capillary-venous” ECs (Figure 5C).
Figure 5.

Heterogeneity of ECs and its developmental trajectory
(A) t-SNE plot shows seven subgroups of the EC cluster (cluster 4). (B) Violin plots show the expression of representative arterial and venous markers across seven subgroups. (C) Violin plots show the expression of representative capillary markers across seven subgroups of ECs. (D) Pseudo-time trajectory of ECs with gene expression profiles inferred by Monocle 2. Each point corresponds to a single cell. (E) The DEGs (rows) along the pseudo-time (columns) were clustered hierarchically into six profiles. (F–H) Gene Ontology analysis of each EC gene set.
Compared with traditional bulk RNA-seq, scRNA-seq was able to eliminate the differences caused by the tumor microenvironment (TME). Such pseudotemporal analysis is a measure of progression through biological processes based on transcriptional similarity. We defined three gene co-expression modules based on the transcriptional changes (Figure 5D and 5E). Module 1 (referring to cells in state 5) showed such ontology terms as RNA catabolic process, ribosome biogenesis, and translational initiation, which represented the triggering of metabolism (Figure 5F). We found that the majority of ECs derived from small venous and capillary tissue were located at the root of the trajectory (Figure S5B). Along the trajectory, the expression of EMCN and FOS descended gradually during the transition, while the larger venous and arterial markers ELN and PODXL gradually increased (Figure S5C). Module 2 (referring to cells in state 6) exhibited ontology terms such as ATP metabolic process and triphosphate metabolic process. The procedures proposed more arterial EC assemblies with prominent metabolic energy signaling pathways. Since it is closely related to cell migration and blood vessel formation, it is very important for ECs with high expression of arterial markers (ELN). Module 3 (referring to cells in state 2) displayed ontology terms such as Wnt signaling pathway and antigen processing and presentation. The majority of TECs aggregated at the end of the trajectory. These cells presented high levels of arterial, venous, and capillary markers, such as IGFBP3, FABP5, NKFB1, and VEGFA, which are inconsistent with the markers of ECs from the normal sample.
Crosstalks between ECs and cancer/immune cells potentially facilitate tumor angiogenesis
Drug resistance is a major problem in anticancer therapy. Since Folkman31 proposed the concept that tumor growth depends on angiogenesis, tumor blood vessels have been regarded as important targets for cancer treatment. Targeting ECs may be more effective than targeting tumor cells. ABC transporters are one of the largest families of transmembrane protein family and play a role in multidrug resistance.32 Recent studies have revealed that ABC transporter is highly expressed in tumor endothelium and may be resistant to chemotherapy.33,34 The most extensively characterized transporters are ABCB1 and ABCG2. Our data provided an opportunity to discover new cell regulators as potential prognostic markers and/or drug targets. As shown in Figures 6A–6C, ABCB1 and ABCG2 were especially expressed in cluster 4, with higher level in TECs than in NECs (Figure 6B), indicating that ABC transporters might affect chemoresistance by medicating the function of ECs. Akiyama et al. reported that tumor-secreted factors induced the expression of ABC transporters in ECs. They demonstrated that VEGF secreted by tumor might induce upregulation of ABC transporters.35 To verify this concept, we explored the connection between tumor cells and ECs and found that VEGFA was highly expressed in TECs and low in NECs (Figure S6A). The protein-protein interaction (PPI) modules were established to explore the interactions among these genes. In tumor, the significant module involving VEGFA also included other genes such as BMP, MIF, CSF1, TNFSF10, CEACAM5, AXL, and EGFR (Figure S6B). Then, we performed functional enrichment analysis on genes in the module and found that they were mainly enriched in cell-cell adhesion and signal transduction. Then, we found that significant genes in the normal sample were enriched in sprouting angiogenesis and cell proliferation (Figure S6C). Recently, Lambrechts et al. analyzed the ECs in lung cancer through scRNA-seq and reached a similar conclusion.36 These results indicate that the origin of tumor angiogenesis was derived from normal ECs. The procedure was regulated by several cytokines secreted by cancer cells.
Figure 6.

The expression levels of ABC transport proteins and cell-cell communications between cancer/immune cells and ECs
(A) t-SNE plot shows the expression levels of ABC transport proteins in all cell clusters. (B) Boxplots show the expression levels of ABC transport proteins between tumor and normal samples. (C) Violin plots show higher expression levels of ABC transport proteins in EC cluster. (D) The connections between tumor cells and ECs. (E) Cell-cell connections show the specific legend-receptor pairs between tumor cells and ECs in tumor. (F) Cell-cell connections show the specific legend-receptor pairs between epithelial cells and ECs in the adjacent normal sample. (G) Cell-cell connections show the specific legend-receptor pairs between immune cells and ECs in the tumor sample. (H) Cell-cell connections show the specific legend-receptor pairs between immune cells and ECs in the normal sample.
To systematically study interactions between tumor or immune cells and ECs, we conducted a cell-cell communication network based on CellPhoneDB. This approach emphasized interactions between different cell types that might be involved in angiogenesis, immune cell recruitment, and immunomodulation (Figure 6D). Through comparing the top 50 significant legend-receptor pairs of tumor cells and ECs in tumor or normal samples, we identified 16 specific legend-receptor pairs, respectively. We found that legend-receptor pairs were related to immune regulation in tumor, such as CD74-COPA, CD74-MIF, CD74-APP, TNFRS10-TNFSF10, TNFSF10-RIPK1, HLA-DPA1, and HLA-C-FAM3C (Figure 6E). However, in the normal sample, signal transduction-related pairs such as DSG2-DSC3, DSC2-DSG2, EGFR-TGFB1, TGFB1-aVb6 complex, and CEACAM5-CEACAM6 showed high expression levels (Figure 6F). Meanwhile, according to the receptor genes in ECs, we performed Gene Ontology (GO) analysis. The results indicated that TECs were related to the ephrin receptor, axon guidance, cell-cell adhesion, establishment of endothelium, and EC differentiation and development, which reflected the tumor angiogenesis and progression (Figure S6D). However, in NECs, this analysis could ensure the organization of the ECM, the regulation of phosphatidylinositol 3-kinase signaling and protein kinase B signaling, which represented the normal biological function of ECs (Figure S6E). Then, we also compared the significant legend-receptor pairs of immune cells and ECs in the tumor or normal sample. Surprisingly, the majority of legend-receptor pairs between cancer cells and ECs were also expressed between immune cells and ECs (Figures 6G and 6H; Figures S6G and S6H). GO analysis of EC receptor genes showed that T cell activation played a key role in the regulation process between immune cells and TECs (Figure S6F). In the normal sample, peptidyl-tyrosine phosphorylation and cell chemotaxis were enriched between immune cells and ECs (Figure S6G). These results indicated the synergistic effect of tumor cells and immune cells that led to tumor angiogenesis.
Discussion
In recent years, the heterogeneity of tumor and microenvironment in various solid tumors had been well mapped. However, it remains unclear how this heterogeneity contributes to treatment failure and tumor progression of CC. The present study is the first to prove the presence of biological and transcriptomic heterogeneity of CC at the single-cell level. We found evidence of tumor cell heterogeneity identified by different CC cell markers and the presence of CSCs in the tumor sample associated with the tumor progression, suggesting that the diverse transcriptome of a single cell might reflect its tumor biology. Meanwhile, our data also provided evidence of the heterogeneity of TECs and revealed the state transition of ECs. These outcomes reflect the true biological nature of the tumor and should be performed at the single-cell level, rather than tumor bulks. Therefore, our study established a feasible approach to investigate intra-tumoral heterogeneity and angiogenesis in CC.
By using the scRNA-seq technique, all cell types in CC were identified, including epithelial cells, cancer cells, ECs, fibroblasts, smooth muscle cells, endometrial stromal cells, lymphocytes, and macrophages. As we captured all expected cell populations in the cervix, it seems that we have captured all tumor cells in CC, including several rare populations. Human cervix is barrel shaped with an ∼2-cm-long central canal. The proximal end of cervix is called the internal os and opens into the uterus without any obvious features to mark the borders of the two tissues, whereas the distal end is called the external os and opens into the vagina. The cervical tissue has two dominant cell types in both endo- and ectocervix, that is, stromal and epithelial cells. These two cell types are separated by a basement membrane. The stromal tissue is predominantly made up of fibroblasts, smooth muscle, and scattered immune cells, embedded in a collagen-rich ECM containing hyaluronan and proteoglycans. A previous study developed a uniform method suitable for quantitative comparison of the leukocytes from all these tissues in the human female reproductive tract (Fallopian tube, uterus, cervix, and vagina) by flow cytometric analysis. They found that reproductive tract tissues contain ∼6%–20% of leukocytes, with Fallopian tubes and uterus containing higher proportions of leukocytes than cervix and vagina. The proportion of leukocytes decreased from the top of the reproductive tract to the bottom, with Fallopian tube tissue most heavily infiltrated with immune cells. According to our single-cell sequencing, the proportion of leukocytes in normal tissue is 2% and the proportion of leukocytes in CC is 5%. The small proportion of immune cells in cervix is due to the property of cervix tissue.37
By performing GSEA analysis on the marker genes of each cancer cell cluster, we uncovered some interesting patterns that further confirmed the identity of the cells and revealed previously undescribed biological pathways. Many studies have attempted to identify cervical CSCs, but the molecular markers that irrefutably identify cervical CSCs have not been clearly defined. The consensus is that the CSC population is rare (<2%).38 Through scRNA-seq analysis, we identified a cluster of cervical CSCs, which had outstanding levels of stem-related markers SOX2 and ALDH1A1. Although the number of cervical CSCs is small, our data provide sufficient evidence to explain important biological functions in tumor formation and growth. Our further analysis confirmed that subcluster 1 was rich in stem-related signal transduction pathways compared with other subclusters. Our further pseudo-time analysis determined that the trajectory has a branched structure. One branch represented the root of the trajectory, indicating high expression of stem-related genes. The other three branches were enriched in cell proliferative and high invasive potential. These results further provided important clues for targeting and eradicating cervical CSCs.
Recently, the critical role of the microenvironment in the growth and progression of CC has been established.39 The putative genetic stability of TME components (such as ECs) makes them attractive therapeutic targets. In fact, biological therapies aiming at vascularization (such as bevacizumab) have shown promise in clinical trials and preclinical models of various cancers.40 However, other targets will be required to achieve further therapeutic benefits. ECs from tumors are different from ECs in normal tissues. Some studies have shown that TECs display altered phenotypic and functional characteristics, which reflect alterations in transcriptional levels.41 However, so far, the genetic and molecular pathways that govern the organ-specific effects of ECs have not been clearly demonstrated, mainly because of insufficient method to investigate individual cell types from various tissues in parallel. Genomic analysis of ECs by scRNA-seq is a powerful method to understand the development procedure of ECs and identify new genes that may be potential targets or biomarkers.29,42 In this study, our data revealed the important role of metabolism-related signaling pathway in TECs, while NECs showed significant enrichment in immune response and signal transduction. In addition, several transcription factors, including TAGLN2, KLF5, STAT1, and STAT2, may be efficient markers for CC ECs, which have important diagnostic value and clinical significance for CC patients. Future research on CC metabolism should focus on not only cancer cells but also other stromal cell types.
Our pseudo-time analysis explained that although adjacent normal tissues act as a source of TECs, once at the tumor ECs would rapidly transform from their naive state through the clonal expansion and activation phases. As expected, in the early stage normal ECs presented enrichment of activation signals. Then, these cells showed both high metabolism populations, indicating an intermediate dysfunctional state, and its programs can be reversed before it differentiates into the terminal state. Finally, ECs required antigen processing and presentation function and activated the Wnt signaling pathway, indicating the appearance of tumor-like ECs. The cell-cell communication showed that ECs in normal tissue were regulated by IGFR, FGF, TGFBR, ACKR1, and JAG2, so that cells showed specific biological functions, such as signaling transduction. However, in tumor ECs were regulated by tumor cells through CD74, TNFRS superfamily, and HLA complex. These cells showed immune regulation-related signaling pathway. These findings will help us further understand the pathological process of tumor angiogenesis and cancer progression and help identify potential targets. Blocking these pathways may interrupt EC dysfunction. This represents a new strategy for anti-angiogenesis treatment against CC.
Although recent anti-tumor drug research has seen the development of a large variety of anti-angiogenesis therapies, drug resistance remains an obstacle to the success of cancer therapy.43,44 It is reported that the key mechanism of cell resistance involves the ABC (ATP-binding cassette) transporters, which pump drug molecules out of the cells, thereby reducing the effective concentration within them.45 Consistent with several published studies that reported high-level expression of ABCB1 and ABCG2 in TECs, our scRNA-seq data showed that expression levels of ABCB1 and ABCG2 in the tumor sample were higher than those in the adjacent normal sample. It is worth noting that the expression of ABCB1 and ABCG2 has been suggested to be a useful biomarker of drug resistance in many cancers, and its upregulation might contribute to chemoresistance and anti-apoptosis. This feature is a novel finding for CC and suggests that drug extrusion from tumor endothelium is mediated by ABC protein transporters.
Since scRNA-seq is inherently limited to the measurement of transcript levels, the functional implication of each of these populations needs further study. However, the robust markers and larger cell numbers that we have provided for each of these subpopulations will form the basis for applying the scRNA-seq method to CC, allowing us understand how these populations and their transcriptomes are involved in various pathological settings. More importantly, the power of single-cell transcriptomics makes it possible to identify rare cell subpopulations and explain the connection between tumor cells and ECs. Therefore, we anticipate that these findings will provide important clues to complement this challenging exploitation.
Materials and methods
Clinical specimens
Human CC and adjacent normal tissues were obtained from a patient who had undergone resection in our hospital. The patient was 53 years old with HPV18-positive cervical squamous cell carcinoma. This study was approved by the ethics committee of the Obstetrics and Gynecology Hospital of Fudan University. Informed consent was acquired from enrolled patients.
Isolation of single cells
After surgical resection, fresh samples were collected and washed with PBS three times. Tissue was cut into ∼1 mm3 pieces and incubated in the same dispase solution at 37°C for 30 min. Then, the tissue was gently dissociated with a pipette and incubated in trypsin 0.05% solution diluted with PBS for 10 min. After the trypsin was deactivated with 5% PBS, the samples were filtered out with a 70 μm filter. Single cells were counted with a hemocytometer. Live cells were preferentially sorted for single-cell sequencing.
Single-cell sequencing
The cellular suspension was loaded on a Chromium Single Cell instrument (10x Genomics) to generate single-cell Gel Beads-in-emulsion (GEMs). Then, single-cell RNA sequence library was estimated by using version 1 Chromium Single-Cell 3′ Library, Gel Bead & Mutiplex Kit (10x Genomics). Sequencing was performed on the Illumina NextSeq500, containing a length of 59 bp. The raw sequencing data were submitted to the GEO database under GEO: GSE168652. Cell Ranger (version 3.0.1) was used with default parameters to perform sample demultiplexing, barcode processing, and single-cell gene unique molecular index counting (https://software.10xgenomics.com/single-cell/overview/welcome).46
QC and cell type identification
Seurat (version 3.0.1) was used for the procession QC. Cells with <200 unique molecular identifiers (UMIs) in a single cell or >10% of mitochondrion-derived UMI counts were considered low-quality cells and removed. The top 30 principal components, along with the first 2,000 variable genes, were used in this process. Then, the influence of the UMI count and the percentage of mitochondrion-derived UMI counts were regressed out with the ScaleData function. Subsequently, the main cell clusters were identified with the FindClusters function of Seurat. The Louvain clustering algorithm embedded in Seurat software was adapted to perform clustering, and results were visualized by the t-distributed stochastic neighbor embedding (t-SNE) method. For any cell cluster, it was mainly identified because of the differences of cell cycle and did not participate in the downstream analysis. To precisely annotate the cell types, we manually curated gene markers for each cell type. In particular, most of the markers to distinguish different cell types were retrieved from the Cell Markers database (https://www.labome.com/method/Cell-Markers.html). The other marker genes were from published papers, such as the marker gene of endometrial stromal cells, SUSD2,47 and stem-related genes SOX2 and ALDH1A1.18
Pseudo-time trajectory analysis
The Monocle 2 package (v.2.8.0)48 was used to analyze single-cell trajectories in order to discover the cell state transitions with the following parameters: average expression R0.125, num_cells_expressed R10, qval < 0.01 (differentialGeneTest function). The trajectory is visualized as a 2D tSNE graph, and the dynamical expression heatmaps are constructed by using the plot_pseudotime_heatmap function.
Functional enrichment analysis
DEGs were identified by using the FindMarkers function embedded in Seurat with the following cutoff thresholds: Benjamini-Hochberg adjusted p value <0.01 and fold change (FC) >1.5. Then, these DEGs were loaded into the clusterProfiler package for the GO enrichment analysis. Pathways with adjusted p values <0.05 were considered significantly enriched. GSEA analysis was performed by using the gsea function embedded in the clusterProfiler package to detect which gene set was significantly enriched in each specific cell cluster.
Cell-cell communication analysis
CellPhoneDB is a Python-based computational analysis tool; it can be used to analyze the cell-cell communications between cells at the molecular level. A website version was also provided for analyzing the relatively small datasets (https://www.cellphonedb.org/). As described above, 20,938 single cells were first clustered into 7 cell types. In order to investigate the molecular interaction networks among the cell types or clusters, CellphoneDB was used to analyze the 7 major cell types and cell subclusters. Ligand-receptor pairs with p values >0.05, as determined by CellPhoneDB, were then filtered, while the others were retained for evaluating the relationships between the different cell clusters.
Protein-protein interaction network analysis
A PPI network was constructed by using the STRING online database (https://string-db.org/). The PPI pairs with selected larger scores were used to construct the PPI network.
Correlations to public datasets
For the TCGA cohort, clinical and RNA-seq data related to 253 CC samples with available survival data were collected from the Genomic Data Commons data portal (GDC, https://portal.gdc.cancer.gov/). For other public datasets, raw data related to CC from the GEO database (https://www.ncbi.nlm.nih.gov/geo/) were downloaded and analyzed, including GEO: GSE63514 (28 tumor and 24 normal samples), GSE67522 (20 tumor and 22 normal samples), GSE9750 (33 tumor and 24 normal samples), and GSE7803 (21 tumor and 13 normal samples). The immunohistochemical (IHC) staining data from The Human Protein Atlas (THPA, https://www.proteinatlas.org/) database was applied to verify protein expression in tumor and normal samples.
Statistical analysis
SPSS 20.0 (Chicago, IL, USA) was used for statistical analysis, and statistical significance was determined with a t test. The p values were calculated. Unless specifically stated, p <0.05 was considered statistically significant.
Acknowledgments
This study was supported by The National Science Foundation for Young Scholars of China (81701422) and Shanghai General Hospital Startup Funding (02.06.01.20.06).
Author contributions
K.H. and S.L. conceived and designed the study. C.L. and L.G. collected clinical samples and performed scRNA-seq library construction. C.L. and S.L. performed data analysis and visualization. C.L., S.L., and K.H. wrote the manuscript. All authors reviewed the manuscript and consented for publication.
Declaration of interests
The authors declare no competing interests.
Footnotes
Supplemental information can be found online at https://doi.org/10.1016/j.omtn.2021.03.017.
Contributor Information
Shengli Li, Email: shengli.li@shsmu.edu.cn.
Keqin Hua, Email: huakeqinjiaoshou@163.com.
Supplemental information
References
- 1.Siegel R.L., Miller K.D., Jemal A. Cancer statistics, 2020. CA Cancer J. Clin. 2020;70:7–30. doi: 10.3322/caac.21590. [DOI] [PubMed] [Google Scholar]
- 2.Leath C.A., 3rd, Monk B.J. Twenty-first century cervical cancer management: A historical perspective of the gynecologic oncology group/NRG oncology over the past twenty years. Gynecol. Oncol. 2018;150:391–397. doi: 10.1016/j.ygyno.2018.06.023. [DOI] [PMC free article] [PubMed] [Google Scholar]
- 3.Stryker Z.I., Rajabi M., Davis P.J., Mousa S.A. Evaluation of angiogenesis assays. Biomedicines. 2019;7:1–13. doi: 10.3390/biomedicines7020037. [DOI] [PMC free article] [PubMed] [Google Scholar]
- 4.Minion L.E., Tewari K.S. Cervical cancer - State of the science: From angiogenesis blockade to checkpoint inhibition. Gynecol. Oncol. 2018;148:609–621. doi: 10.1016/j.ygyno.2018.01.009. [DOI] [PMC free article] [PubMed] [Google Scholar]
- 5.Clark K.T., Trimble C.L. Current status of therapeutic HPV vaccines. Gynecol. Oncol. 2020;156:503–510. doi: 10.1016/j.ygyno.2019.12.017. [DOI] [PubMed] [Google Scholar]
- 6.Prasetyanti P.R., Medema J.P. Intra-tumor heterogeneity from a cancer stem cell perspective. Mol. Cancer. 2017;16:41. doi: 10.1186/s12943-017-0600-4. [DOI] [PMC free article] [PubMed] [Google Scholar]
- 7.Caiado F., Silva-Santos B., Norell H. Intra-tumour heterogeneity - going beyond genetics. FEBS J. 2016;283:2245–2258. doi: 10.1111/febs.13705. [DOI] [PubMed] [Google Scholar]
- 8.Zaridze D.G. Molecular epidemiology of cancer. Biochemistry (Mosc.) 2008;73:532–542. doi: 10.1134/s0006297908050064. [DOI] [PubMed] [Google Scholar]
- 9.Boon S.S., Chen Z., Li J., Lee K.Y.C., Cai L., Zhong R., Chan P.K.S. Human papillomavirus type 18 oncoproteins exert their oncogenicity in esophageal and tongue squamous cell carcinoma cell lines distinctly. BMC Cancer. 2019;19:1211. doi: 10.1186/s12885-019-6413-7. [DOI] [PMC free article] [PubMed] [Google Scholar]
- 10.Fan J., Slowikowski K., Zhang F. Single-cell transcriptomics in cancer: computational challenges and opportunities. Exp. Mol. Med. 2020;52:1452–1465. doi: 10.1038/s12276-020-0422-0. [DOI] [PMC free article] [PubMed] [Google Scholar]
- 11.Müller S., Diaz A. Single-cell mRNA sequencing in cancer research: Integrating the genomic fingerprint. Front. Genet. 2017;8:73. doi: 10.3389/fgene.2017.00073. [DOI] [PMC free article] [PubMed] [Google Scholar]
- 12.Dasari S., Wudayagiri R., Valluru L. Cervical cancer: Biomarkers for diagnosis and treatment. Clin. Chim. Acta. 2015;445:7–11. doi: 10.1016/j.cca.2015.03.005. [DOI] [PubMed] [Google Scholar]
- 13.Malhone C., Longatto-Filho A. Cervical, Ovarian and Endometrial Tumor Markers: Potential Clinical Value. Semin. Ultrasound CT MR. 2019;40:350–357. doi: 10.1053/j.sult.2019.03.003. [DOI] [PubMed] [Google Scholar]
- 14.Liang S.N., Huang Y.J., Liu L.L., Liu X. Study on the correlation between the expression of Ki67 and FasL and prognosis of cervical carcinoma. Genet. Mol. Res. 2015;14:8634–8639. doi: 10.4238/2015.July.31.11. [DOI] [PubMed] [Google Scholar]
- 15.Kuespert K., Pils S., Hauck C.R. CEACAMs: their role in physiology and pathophysiology. Curr. Opin. Cell Biol. 2006;18:565–571. doi: 10.1016/j.ceb.2006.08.008. [DOI] [PMC free article] [PubMed] [Google Scholar]
- 16.Skubitz K.M., Skubitz A.P.N. Interdependency of CEACAM-1, -3, -6, and -8 induced human neutrophil adhesion to endothelial cells. J. Transl. Med. 2008;6:78. doi: 10.1186/1479-5876-6-78. [DOI] [PMC free article] [PubMed] [Google Scholar]
- 17.Kontostathi G., Zoidakis J., Anagnou N.P., Pappa K.I., Vlahou A., Makridakis M. Proteomics approaches in cervical cancer: focus on the discovery of biomarkers for diagnosis and drug treatment monitoring. Expert Rev. Proteomics. 2016;13:731–745. doi: 10.1080/14789450.2016.1210514. [DOI] [PubMed] [Google Scholar]
- 18.Yao T., Lu R., Zhang Y., Zhang Y., Zhao C., Lin R., Lin Z. Cervical cancer stem cells. Cell Prolif. 2015;48:611–625. doi: 10.1111/cpr.12216. [DOI] [PMC free article] [PubMed] [Google Scholar]
- 19.Clarke M.F., Dick J.E., Dirks P.B., Eaves C.J., Jamieson C.H.M., Jones D.L., Visvader J., Weissman I.L., Wahl G.M. Cancer stem cells--perspectives on current status and future directions: AACR Workshop on cancer stem cells. Cancer Res. 2006;66:9339–9344. doi: 10.1158/0008-5472.CAN-06-3126. [DOI] [PubMed] [Google Scholar]
- 20.Liu X.F., Yang W.T., Xu R., Liu J.T., Zheng P.S. Cervical cancer cells with positive Sox2 expression exhibit the properties of cancer stem cells. PLoS ONE. 2014;9:e87092. doi: 10.1371/journal.pone.0087092. [DOI] [PMC free article] [PubMed] [Google Scholar]
- 21.Ueda K., Ogasawara S., Akiba J., Nakayama M., Todoroki K., Ueda K., Sanada S., Suekane S., Noguchi M., Matsuoka K., Yano H. Aldehyde dehydrogenase 1 identifies cells with cancer stem cell-like properties in a human renal cell carcinoma cell line. PLoS ONE. 2013;8:e75463. doi: 10.1371/journal.pone.0075463. [DOI] [PMC free article] [PubMed] [Google Scholar]
- 22.Organista-Nava J., Gómez-Gómez Y., Garibay-Cerdenares O.L., Leyva-Vázquez M.A., Illades-Aguiar B. Cervical cancer stem cell-associated genes: Prognostic implications in cervical cancer. Oncol. Lett. 2019;18:7–14. doi: 10.3892/ol.2019.10307. [DOI] [PMC free article] [PubMed] [Google Scholar]
- 23.Alldredge J.K., Tewari K.S. Clinical Trials of Antiangiogenesis Therapy in Recurrent/Persistent and Metastatic Cervical Cancer. Oncologist. 2016;21:576–585. doi: 10.1634/theoncologist.2015-0393. [DOI] [PMC free article] [PubMed] [Google Scholar]
- 24.Rasila K.K., Burger R.A., Smith H., Lee F.C., Verschraegen C. Angiogenesis in gynecological oncology-mechanism of tumor progression and therapeutic targets. Int. J. Gynecol. Cancer. 2005;15:710–726. doi: 10.1111/j.1525-1438.2005.00132.x. [DOI] [PubMed] [Google Scholar]
- 25.Meng T., Liu L., Hao R., Chen S., Dong Y. Transgelin-2: A potential oncogenic factor. Tumour Biol. 2017;39 doi: 10.1177/1010428317702650. 1010428317702650. [DOI] [PubMed] [Google Scholar]
- 26.Jin H., Cheng X., Pei Y., Fu J., Lyu Z., Peng H., Yao Q., Jiang Y., Luo L., Zhuo H. Identification and verification of transgelin-2 as a potential biomarker of tumor-derived lung-cancer endothelial cells by comparative proteomics. J. Proteomics. 2016;136:77–88. doi: 10.1016/j.jprot.2015.12.012. [DOI] [PubMed] [Google Scholar]
- 27.Dong J.T., Chen C. Essential role of KLF5 transcription factor in cell proliferation and differentiation and its implications for human diseases. Cell. Mol. Life Sci. 2009;66:2691–2706. doi: 10.1007/s00018-009-0045-z. [DOI] [PMC free article] [PubMed] [Google Scholar]
- 28.Gao Y., Wu K., Chen Y., Zhou J., Du C., Shi Q., Xu S., Jia J., Tang X., Li F. Beyond proliferation: KLF5 promotes angiogenesis of bladder cancer through directly regulating VEGFA transcription. Oncotarget. 2015;6:43791–43805. doi: 10.18632/oncotarget.6101. [DOI] [PMC free article] [PubMed] [Google Scholar]
- 29.Kalucka J., de Rooij L.P.M.H., Goveia J., Rohlenova K., Dumas S.J., Meta E., Conchinha N.V., Taverna F., Teuwen L.A., Veys K. Single-Cell Transcriptome Atlas of Murine Endothelial Cells. Cell. 2020;180:764–779.e20. doi: 10.1016/j.cell.2020.01.015. [DOI] [PubMed] [Google Scholar]
- 30.Rohlenova K., Goveia J., García-Caballero M., Subramanian A., Kalucka J., Treps L., Falkenberg K.D., de Rooij L.P.M.H., Zheng Y., Lin L. Single-Cell RNA Sequencing Maps Endothelial Metabolic Plasticity in Pathological Angiogenesis. Cell Metab. 2020;31:862–877.e14. doi: 10.1016/j.cmet.2020.03.009. [DOI] [PubMed] [Google Scholar]
- 31.Folkman J. Role of angiogenesis in tumor growth and metastasis. Semin. Oncol. 2002;29(6, Suppl 16):15–18. doi: 10.1053/sonc.2002.37263. [DOI] [PubMed] [Google Scholar]
- 32.Bani M., Decio A., Giavazzi R., Ghilardi C. Contribution of tumor endothelial cells to drug resistance: anti-angiogenic tyrosine kinase inhibitors act as p-glycoprotein antagonists. Angiogenesis. 2017;20:233–241. doi: 10.1007/s10456-017-9549-6. [DOI] [PubMed] [Google Scholar]
- 33.Beuselinck B., Lambrechts D., Van Brussel T., Wolter P., Cardinaels N., Joniau S., Lerut E., Karadimou A., Couchy G., Sebe P. Efflux pump ABCB1 single nucleotide polymorphisms and dose reductions in patients with metastatic renal cell carcinoma treated with sunitinib. Acta Oncol. 2014;53:1413–1422. doi: 10.3109/0284186X.2014.918276. [DOI] [PubMed] [Google Scholar]
- 34.Wijaya J., Fukuda Y., Schuetz J.D. Obstacles to brain tumor therapy: Key ABC transporters. Int. J. Mol. Sci. 2017;18:2544. doi: 10.3390/ijms18122544. [DOI] [PMC free article] [PubMed] [Google Scholar]
- 35.Akiyama K., Maishi N., Ohga N., Hida Y., Ohba Y., Alam M.T., Kawamoto T., Ohmura H., Yamada K., Torii C. Inhibition of multidrug transporter in tumor endothelial cells enhances antiangiogenic effects of low-dose metronomic paclitaxel. Am. J. Pathol. 2015;185:572–580. doi: 10.1016/j.ajpath.2014.10.017. [DOI] [PubMed] [Google Scholar]
- 36.Lambrechts D., Wauters E., Boeckx B., Aibar S., Nittner D., Burton O., Bassez A., Decaluwé H., Pircher A., Van den Eynde K. Phenotype molding of stromal cells in the lung tumor microenvironment. Nat. Med. 2018;24:1277–1289. doi: 10.1038/s41591-018-0096-5. [DOI] [PubMed] [Google Scholar]
- 37.Givan A.L., White H.D., Stern J.E., Colby E., Gosselin E.J., Guyre P.M., Wira C.R. Flow Cytometric analysis of leukocytes in the human female reproductive tract : comparison of fallopian tube, uterus, cervix, and vagina. Am. J. Reprod. Immunol. 1997;38:350–359. doi: 10.1111/j.1600-0897.1997.tb00311.x. [DOI] [PubMed] [Google Scholar]
- 38.Mendoza-Almanza G., Ortíz-Sánchez E., Rocha-Zavaleta L., Rivas-Santiago C., Esparza-Ibarra E., Olmos J. Cervical cancer stem cells and other leading factors associated with cervical cancer development. Oncol. Lett. 2019;18:3423–3432. doi: 10.3892/ol.2019.10718. [DOI] [PMC free article] [PubMed] [Google Scholar]
- 39.De Gregorio V., Urciuolo F., Netti P.A., Imparato G. In vitro organotypic systems to model tumor microenvironment in human papillomavirus (HPV)-related cancers. Cancers (Basel) 2020;12:1150. doi: 10.3390/cancers12051150. [DOI] [PMC free article] [PubMed] [Google Scholar]
- 40.Garcia J., Hurwitz H.I., Sandler A.B., Miles D., Coleman R.L., Deurloo R., Chinot O.L. Bevacizumab (Avastin®) in cancer treatment: A review of 15 years of clinical experience and future outlook. Cancer Treat. Rev. 2020;86:102017. doi: 10.1016/j.ctrv.2020.102017. [DOI] [PubMed] [Google Scholar]
- 41.Hida K., Kikuchi H., Maishi N., Hida Y. ATP-binding cassette transporters in tumor endothelial cells and resistance to metronomic chemotherapy. Cancer Lett. 2017;400:305–310. doi: 10.1016/j.canlet.2017.02.006. [DOI] [PubMed] [Google Scholar]
- 42.Zhao Q., Eichten A., Parveen A., Adler C., Huang Y., Wang W., Ding Y., Adler A., Nevins T., Ni M. Single-cell transcriptome analyses reveal endothelial cell heterogeneity in tumors and changes following antiangiogenic treatment. Cancer Res. 2018;78:2370–2382. doi: 10.1158/0008-5472.CAN-17-2728. [DOI] [PubMed] [Google Scholar]
- 43.Kim J.Y., Kim Y.M. Tumor endothelial cells as a potential target of metronomic chemotherapy. Arch. Pharm. Res. 2019;42:1–13. doi: 10.1007/s12272-018-01102-z. [DOI] [PubMed] [Google Scholar]
- 44.Ye Y., Xiang Y., Ozguc F.M., Kim Y., Liu C.J., Park P.K., Hu Q., Diao L., Lou Y., Lin C. The Genomic Landscape and Pharmacogenomic Interactions of Clock Genes in Cancer Chronotherapy. Cell Syst. 2018;6:314–328.e2. doi: 10.1016/j.cels.2018.01.013. [DOI] [PMC free article] [PubMed] [Google Scholar]
- 45.Casey S.C., Amedei A., Aquilano K., Azmi A.S., Benencia F., Bhakta D., Bilsland A.E., Boosani C.S., Chen S., Ciriolo M.R. Cancer prevention and therapy through the modulation of the tumor microenvironment. Semin. Cancer Biol. 2015;35(Suppl):S199–S223. doi: 10.1016/j.semcancer.2015.02.007. [DOI] [PMC free article] [PubMed] [Google Scholar]
- 46.Dobin A., Davis C.A., Schlesinger F., Drenkow J., Zaleski C., Jha S., Batut P., Chaisson M., Gingeras T.R. STAR: ultrafast universal RNA-seq aligner. Bioinformatics. 2013;29:15–21. doi: 10.1093/bioinformatics/bts635. [DOI] [PMC free article] [PubMed] [Google Scholar]
- 47.Patterson A.L., George J.W., Chatterjee A., Carpenter T.J., Wolfrum E., Chesla D.W., Teixeira J.M. Putative human myometrial and fibroid stem-like cells have mesenchymal stem cell and endometrial stromal cell properties. Hum. Reprod. 2020;35:44–57. doi: 10.1093/humrep/dez247. [DOI] [PMC free article] [PubMed] [Google Scholar]
- 48.Trapnell C., Cacchiarelli D., Grimsby J., Pokharel P., Li S., Morse M., Lennon N.J., Livak K.J., Mikkelsen T.S., Rinn J.L. The dynamics and regulators of cell fate decisions are revealed by pseudotemporal ordering of single cells. Nat. Biotechnol. 2014;32:381–386. doi: 10.1038/nbt.2859. [DOI] [PMC free article] [PubMed] [Google Scholar]
Associated Data
This section collects any data citations, data availability statements, or supplementary materials included in this article.