

Abstract
Alternative splicing (AS) plays an important role in gene regulation, and AS perturbations are frequently observed in cancer. RNA binding protein (RBP) is one of the molecular determinants of AS, and perturbations in RBP-gene network activity are causally associated with cancer development. Here, we performed a systematic analysis to characterize the perturbations in AS events across 18 cancer types. We showed that AS alterations were prevalent in cancer and involved in cancer-related pathways. Given that the extent of AS perturbation was associated with disease severity, we proposed a computational pipeline to identify RBP regulators. Pan-cancer analysis identified a number of conserved RBP regulators, which play important roles in regulating AS of genes involved in cancer hallmark pathways. Our application analysis revealed that the expression of 68 RBP regulators helped in cancer subtyping. Specifically, we identified four subtypes of kidney cancer with differences in cancer hallmark pathway activities and prognosis. Finally, we identified the small molecules that can potentially target the RBP genes and suggested potential candidates for cancer therapy. In summary, our comprehensive AS perturbation landscape analysis identified RBPs as potential therapeutic targets in cancer and provided novel insights into the regulatory functions of RBPs in cancer.
Keywords: RNA binding protein, alterative splicing, regulatory network, cancer, therapeutic targets
Graphical abstract
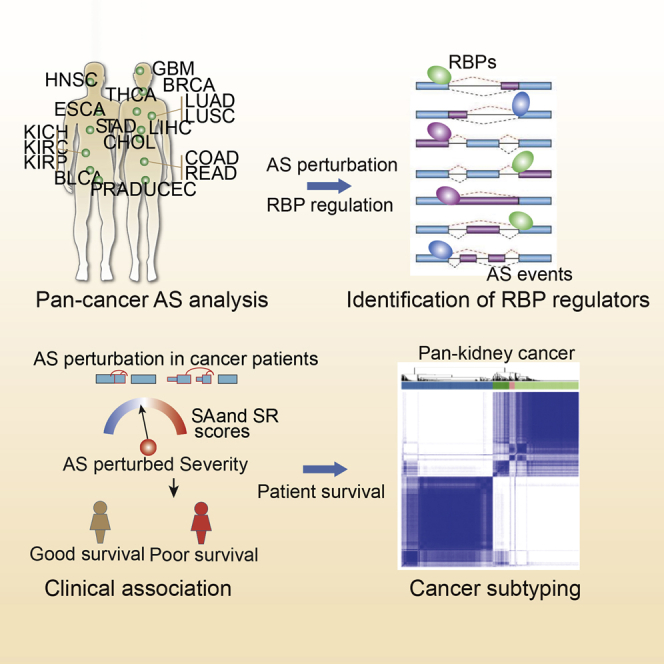
Li and colleagues comprehensively analyzed the alternative splicing perturbation landscape and proposed a computational method to identify RNA binding proteins as potential therapeutic targets across cancer types.
Introduction
Alternative splicing (AS) plays critical roles in post-transcriptional regulation of gene expression and contributes to protein complexity.1,2 Given the importance of AS events in gene regulation, perturbation of AS has been revealed in various types of cancer3,4 and it has been demonstrated that AS contributes to various cancer signaling pathways.5 Moreover, clinical relevance of AS events in cancer tissues has been demonstrated.6 In distinct cells or cancers, a precise splicing process controls cell decision and different cancer phenotypes.7 Although AS events in several candidate genes have been identified to contribute to cancer development, cancer-specific or recurrent splicing patterns on a transcriptome-wide scale have been less investigated.8
Considerable efforts have been made to identify the perturbed AS events (PASEs) in cancer. However, the mechanisms by which molecular regulators perturb splicing remain unknown. Identification of these molecular regulators that perturb AS is critical for developing cancer biomarkers and therapeutic targets.5 With the development of computational and experimental technologies, both genetic and epigenetic determinants of AS events have been revealed in cancer. Deregulation of AS is potentially regulated by somatic mutations,9,10 antisense RNAs,11 RNA binding proteins (RBPs),12 transcriptional factors (TFs), and epigenetic factors.13 The PASEs can recapitulate the complex phenotype linked to mutations or expression dysregulation of RBPs.14 Our recent study also found that the somatic mutations potentially regulating AS events were enriched in RBPs.10 Widespread alterations of RBP genes have been found across cancer types.15 However, there is still a lack of computational or experimental methods to comprehensively identify the RBP regulators in cancer.
Multiple lines of evidence have demonstrated that RBPs play an indispensable role in cancer development and progression. Increasing numbers of RBPs are being identified as regulators of AS events in various types of cancer. For example, RBP RALY promotes the expression of alternatively spliced isoform v2 of arginine methyltransferase 1 and metastatic potential in breast cancer.16 RBP ZMAT3 is a regulator that inhibits splicing of CD44 in colorectal carcinoma.17 Thus, RBP-based cancer subtyping and targeting RBPs for cancer therapy have gained more attention.18 Our recent study also found that EIF2S2 knockdown combined with oxaliplatin treatment could be a potential combination therapy in cancer.19 Systematic identification of potential drugs that target RBPs will provide novel insights for improving cancer therapy.
In this study, we systematically analyzed the genome-wide alternative splicing perturbations across cancer types. We found that there were prevalent changes in AS across cancers and PASEs were associated with disease severity. A computational pipeline was proposed to identify the RBP regulators of AS perturbation, and we found that these RBP regulators play important roles in cancer hallmark-related pathways. Moreover, we identified different subtypes based on the expression of RBP regulators, and patients in these subtypes showed distinct survival and pathway activities. Finally, we identified the drug-RBP correlations, which suggested new potential drugs for cancer therapy. Together, our integrative analysis of the AS perturbation landscape identified RBPs as potential therapeutic targets in cancer.
Results
Landscape of perturbed AS events in cancer
To determine the global dysregulation of AS across cancer types, we systematically analyzed the mRNA splicing profiles in 18 human cancers from the The Cancer Genome Atlas (TCGA) cohort (Figure 1A; Table S1). There were in total 7,245 cancer samples and 735 normal samples. Throughout all cancer types, we found a substantial number of splicing events, and the proportions of splice types did not vary much between different cancer types (Figure 1B). In total, seven types of AS events were considered in our analysis, including exon skipping (ES), alternative donor site (AD), alterative acceptor site (AA), retained intron (RI), mutually exclusive exons (ME), alternative terminator (AT), and alternative promoter (AP). The most common splice event was ES, which accounted for 34.5%–41.4% of total events across cancers (Figure 1B: Table S2). In contrast, the least common AS event was ME, which accounted for only 0.3%–0.6% of total events across cancer types.
Figure 1.

Perturbation of AS events across cancer types
(A) A total of 18 cancer types were analyzed. (B) The proportion of AS events for different types across cancers. Seven types of AS events were analyzed. (C) The enrichment of different subtypes of AS events. Top: the number of upregulated AS and downregulated AS events in 18 cancer types. Bottom: the odds ratio for up- and downregulated AS events. Right: the total number of differential AS events in 18 cancer types. Red: upregulated AS; green: downregulated AS.
We next identified the PASEs in each cancer type. When directly contrasted to normal tissues in each cancer, we found that a high proportion of AS events was perturbed in cancer, ranging from 6% in esophageal carcinoma (ESCA) to 29% in kidney renal clear cell carcinoma (KIRC) (Table S3). The numbers of PASEs varied across cancer types (Figure 1C, top). We defined AS events with higher percent spliced-in (PSI) values as upregulated AS events in cancer, and those with lower PSI values were designated as downregulated AS events. We identified more upregulated AS events in KIRC and stomach adenocarcinoma (STAD; Figure 1C). There were more downregulated AS events in breast invasive carcinoma (BRCA), glioblastoma multiforme (GBM), and thyroid cancer (THCA; Figure 1C). Next, we explored the extent to which the different AS types were perturbed in cancer. Therefore, we calculated the odds ratio (OR) for each type of AS events. Although there was a higher number of ES events perturbed (Figure S1), the PASEs were likely to be enriched in AP and AT types (Figure 1C; Table S4, bottom). In addition, the upregulated PASEs in cancer were also enriched in RI splice type across cancers (Figure 1C; Table S4, bottom). This was consistent with the recent observation of RI as a hallmark of cancer stemness and aggressiveness.20 Taken together, these results suggest that there are prevalent AS alterations across cancer types.
PASEs imply tissue origin of cancers
It has been indicated that cancer types with similar tissue origins often share a number of molecular features, such as gene expression and DNA methylation.21,22 We next investigated whether cancer types with similar tissue origins exhibit similar PASEs. We first visualized the AS diversity across the cancer cohort with t-distributed stochastic neighbor embedding (t-SNE). This highlighted both the tissue-specific nature of AS events and cancer type-specific differences and commonalities (Figure 2A). We found that cancer types of similar origins and often described with similar molecular characteristics, such as kidney renal papillary cell carcinoma (KIRP), KIRC, and kidney chromophobe (KICH), liver hepatocellular carcinoma (LIHC) and cholangiocarcinoma (CHOL), or colon adenocarcinoma (COAD) and rectum adenocarcinoma (READ), were commonly clustered closely together (Figure 2A). Moreover, we calculated the similarity between two cancers as the Jaccard index of the PASEs in two cancers (more details provided in Materials and methods). We observed the similar patterns based on a clustering of the similarity calculated as the proportion of shared PASEs (Figure 2B). These results are consistent with previous studies that focused on expression and methylation analyses23,24 and suggest that related AS mechanisms might operate in cancer types with similar tissue origin.
Figure 2.

Alternative splicing perturbation similarity of cancer
(A) t-SNE plot showing the similarity of cancers. Each dot represents one cancer patient, and the same dots belong to one cancer type. (B) Clustering of cancers based on the similarity of perturbed AS events. (C) Bar plots show the number of differential AS event-involved genes observed in different numbers of cancer types. The genes involved in pan-cancer differential AS events are shown in the box. (D) The enriched functions by the pan-cancer differential AS event-involved genes. Green, biological process in Gene Ontology; blue, molecular functions in Gene Ontology; orange, tissue-specific expressed genes.
Next, we investigated the extent to which PASEs contribute to cancer specificity. We found that although a large number of PASEs showed cancer specificity, a number of PASEs were involved in numerous cancer types (Figure 2C). We defined these AS events as pan-cancer AS events. These pan-cancer differential AS events were involved in a number of well-known oncogenes (e.g., NFE2L2, RARA, and SGK1), tumor suppressor genes (e.g., CASP8, DNMT3A, FANCD2, and SMARCA4), and fusion genes (e.g., EIF4A2, SEPT6, and TCF12).25 Moreover, we found that the majority of these pan-PASEs were associated with patients’ survival and they exhibited similarly to various cancer types (Figure S2). We next performed functional enrichment analysis for these pan-cancer genes. We found that pan-cancer PASE-involved genes were enriched in a number of cancer-associated functional categories (Figure 2D; Table S5), such as translational initiation,26 protein binding, and cadherin binding involved in cell-cell adhesion.27 In addition, these genes exhibited high tissue-specific expression in testis, K562, and colorectal adenocarcinoma (Figure 2D). Taken together, these results imply that splicing abnormalities impact cancer biology by regulating cancer-related pathways.
Perturbed AS events are associated with disease severity
To determine the molecular players associated with the perturbed PASEs in cancer, we devised a versatile and comprehensive workflow to identify the RBP regulators (Figure 3A; see details in Materials and methods). Briefly, we first constructed the AS activity perturbation profiles for each patient by comparing the PSI to normal samples. Two activity scores (activated activity [SA] and repressed activity [SR]) were calculated by summarizing the perturbed level of each AS event in the same patient. Second, we identified the RBPs showing transcriptomic perturbation in cancer. RBP regulators were identified by correlating the expression of RBPs with the AS activity scores (Spearman correlation coefficient [SCC] p-adjusted < 0.1).
Figure 3.

AS perturbation correlated with disease severity
(A) The flowchart for identifying RBP regulators in cancer. (B) The proportion of curated RBP genes in different classes. (C) The cartoon shows the correlation between AS perturbed severity and survival rates. (D) Kaplan-Meier plots indicating survival of cancer patients with high and low AS activity scores. Top: SA and SR in KIRC. Bottom: SA and SR in LIHC.
In total, we manually curated 2,038 RBPs and further classified them into nine clusters (Figure 3B). There were 139 ribosomal proteins, 636 mRNAs, and 89 noncoding RNAs (ncRNAs). However, 40.9% of RBPs had not been classified into specific clusters in the literature, suggesting that we still lack sufficient knowledge about their functions. We next explored the correlation between RBP expression and AS perturbation scores. We hypothesized that patients with higher AS perturbed scores (SA or SR) were likely to also show higher disease severity (Figure 3C). To test this hypothesis, we compared the survival rates among patients with different AS perturbed scores. We found that patients with higher SA or higher SR were likely to exhibit worse survival across cancer types, ∼66.7% or 77.8% of cancer types with hazard ratio (HR) > 1 (Figure S3). In particular, patients with higher SA or SR in KIRC and LIHC had significantly worse survival (Figure 3D; log rank p values < 0.01). Moreover, we performed multivariate analysis by integrating age, sex, and stage. We found that the level of AS perturbation was an independent risk factor in KIRC and LIHC (Figures S4 and S5). Together, these results suggest that AS perturbations are associated with disease severity, where cancer patients with prevalent PASEs exhibit worse survival.
Identification of perturbed AS-related RBP regulators
Since we demonstrated that perturbed AS activity scores were associated with disease severity, we hypothesized that RBPs whose expression levels correlated with those scores were likely to regulate AS in cancer. First, we identified the differentially expressed RBPs in 18 cancer types. We found that more RBPs were upregulated in cancer (Figure 4A), which is consistent with recent studies.28,29 Next, we calculated the number of cancer types in which these RBPs were differentially expressed. We found that more RBPs were only observed in one cancer type (Figure 4B), suggesting that different cancer types have distinct RBP dysregulation signatures. Moreover, there were some consistently dysregulated RBPs across the 18 cancer types analyzed. We identified 246 RBPs consistently up- or downregulated in >15 cancer types (Figure S6). Among these RBPs, we found that APOBEC3B, DCN, EZH2, and RAD51AP1 differentially expressed in all 18 cancer types (Table S6). APOBEC3B plays a key role in cancer and has been reported to be upregulated in many cancers.30,31 As a master regulator of chromatin regulation, EZH2 is overexpressed in human epithelial cancers.32 Moreover, we identified the differentially expressed RBPs based on Wilcoxon rank-sum test. The majority of RBPs exhibited consistently differential expression (Table S7). All these RBPs provided a valuable resource for identifying the critical therapy targets in cancer.
Figure 4.

Identifying RBP regulators of AS events in cancer
(A) Number of dysregulated RBPs across cancer types. Red: upregulated RBPs; green: downregulated RBPs. (B) Number of RBPs observed in different cancers. Cancer-specific RBPs are enlarged at top right. (C and D) Circos plots showing the active and repressive RBP regulators across cancer types. Each circle represents one cancer type, the color indicating the Spearman correlation coefficient, for active RBPs (C) and for repressive RBPs (D).
We next identified the potential RBP regulators of AS events across cancer types based on the correlation between RBP expression and AS activity scores. In total, we identified 1,365 RBPs that were correlated with active scores (ActRBPs) and 1,045 RBPs correlated with repressive scores (ResRBPs) across 18 cancers (Figure S7). There were 211 ActRBPs and 91 ResRBPs observed in 15 or more cancer types (Figures 4C and 4D). The frequently dysregulated RBPs (APOBEC3B, DCN, EZH2, and RAD51AP1) were found in ActRBPs and identified as regulators in 18 cancer types (Table S8). Moreover, MEX3A, MRVI1, PUS7, FHL1, and SYNE1 were identified as the top ResRBPs, and they correlated with AS activity in 18 cancer types (Table S9). MEX3A is a stemness-related gene and plays an important role in cell proliferation,33 whereas FHL1 plays a tumor suppressor gene function in cancer and is repressed by epigenetic signals.34 Taken together, all these observations suggested that comprehensive analysis of the AS perturbation landscape can potentially capture the cancer-related RBPs in cancer.
Function of pan-cancer RBP regulators
We next calculated the number of cancer types for each RBP regulator. Many RBPs were only identified in one cancer type, although several RBPs were observed in >11 cancer types. Thus, we classified the RBP regulators into three types. The RBPs that occurred in only one cancer type were defined as cancer-specific RBPs, RBPs identified in 2–11 cancer types were defined as moderate RBPs, and those identified in >11 cancers were defined as pan-cancer RBPs (Figure 5A). In total, we identified 302 and 345 cancer-specific ActRBPs and ResRBPs, respectively. There were 71 and 22 pan-cancer ActRBPs and ResRBPs, respectively. These pan-cancer RBPs potentially regulated various types of AS events across cancer types (Figure 5B). In particular, ActRBP NME1 and ResRBP SYNE1 potentially regulate the highest number of AS events in cancer. NME1 is a metastasis suppressor that can potentially reduce metastasis without affecting primary tumor size; however, the precise mechanisms are unknown.35 Our results suggested that NME1 might regulate the AS of a number of cancer-related genes, such as CD44,36 CTNND1,37 and PTBP2.38 SYNE1 was found to have a higher mutation density.39 We found that this RBP can potentially regulate the AS events of numerous genes. These results suggest that identification of the potential AS targets provides insights into the function of RBP regulators.
Figure 5.

Function of pan-cancer RBP regulators
(A) Number of RBP regulators identified in different number of cancer types. Top: active RBPs. Bottom: repressive RBPs. Three types of RBPs were defined, including cancer-specific, moderate, and pan-cancer RBPs. (B) Heatmap shows whether the corresponding RBPs (columns) were identified in specific cancers (rows). Top: bar plots show the number of AS events in different subtypes. Bottom: river plots show the link between genes and AS types. (C) Network showing the RBP-pathways in cancer. The numbers adjacent to the pathways show the number of RBPs that correlated with each pathway.
To investigate the function of these pan-cancer RBPs, we next performed functional enrichment analysis based on their regulated AS event-involved genes. Here, we focused on 50 cancer hallmark-related pathways.40 At the false discovery rate (FDR) of <0.01, we identified 442 RBP-pathway associations among 93 RBPs and 16 pathways (Figure 5C). We found that all pan-cancer RBPs potentially regulated at least one cancer hallmark-related pathway. For these pathways, there were more RBPs involved in mitotic spindle, UV response, phosphatidylinositol 3-kinase (PI3K)-AKT-mammalian target of rapamycin (mTOR) signaling, and adipogenesis. Moreover, we found that RBPs played important roles in several metabolism-related pathways (Figure 5C). Indeed, increasing evidence has demonstrated their roles in metabolism.41, 42, 43 All these results suggest that pan-cancer RBPs play fundamental roles in cancer by regulating the AS events.
Patient stratification of kidney cancer based on RBPs
An increasing number of studies have demonstrated that AS events are able to discriminate between different subtypes of cancer and that they have prognostic impacts.44,45 We also found that the AS activity was associated with disease severity, particularly in kidney cancer. Thus, we next identified the RBP regulators and investigated whether they could help in molecular subtyping of cancers. Here, we focused on two types of kidney cancer (KIRC and KIRP), as they exhibited similar results in our current analysis and previous pan-cancer results.23,46 We identified 68 common RBP regulators from these two cancer types (Figure 6A). Next, we grouped kidney cancer patients into different subtypes based on the expression of these RBPs. Consensus clustering was performed with k from 2 to 10.47 This analysis revealed that there were four subtypes in kidney cancer (Figure 6B). There were 298, 76, 426, and 26 patients in C1, C2, C3, and C4 subtypes, respectively (Table S10). We first investigated the source of these patients and found that the majority of patients for C1, C2, and C4 were KIRC. However, C3 subtype comprised both KIRC and KIRP patients (Figure S8).
Figure 6.

Kidney cancer subtyping based on RBP regulators
(A) Venn plot showing the overlap of RBPs in KIRC and KIRP. The heatmap on the right shows the expression of 68 RBPs across 826 kidney cancer patients. (B) The heatmap shows the similarity of cancer patients. (C) Distribution of age at diagnosis for patients in different subtypes. (D) Proportion of patients in high versus low stages in four subtypes. (E) Kaplan-Meier plots indicating survival of cancer patients in different subtypes.
Moreover, we explored the clinical information of patients from different subtypes. We found that the patients in C4 were diagnosed at a significantly younger age (Figure 6C; p < 0.001, Wilcoxon rank-sum test). The patients in C2 subtype had the highest age among all subtypes. We also calculated the proportion of patients in high stages (iii and iv) and low stages (i and ii). There were more high-stage patients in C2 and C4 than in C1 and C3 (Figure 6D; Fisher’s exact test p = 1.63E−3). These results suggested that patients in C4 might be more severe, so we further investigated their survival rates. Indeed, we found that patients in C4 had the worst survival (Figure 6E; log rank test, p = 5.5E−5). In addition, patients in C1 had better survival than those in C3 (log rank test, p = 0.01). The patients in C2 also had better survival than those in C4 (log rank test, p = 0.05). These results suggest that the common RBP regulators are helpful in identifying the molecular subtypes of cancer.
Distinct cancer pathways of kidney cancer subtypes
We next investigated the extent to which pathway activities differ across different kidney cancer subtypes. First, we calculated the pathway activity for 50 cancer hallmark-related pathways in all patients based on gene set variation analysis (GSVA). Next, the differences of pathway activities were checked by analysis of variance (ANOVA). In total, we found that 80% (40/50) of these pathways showed different pathway activities across C1–C4 subtypes at the threshold FDR of <0.01 (Figure 7A). In particular, we found that patients in C2 and C4 had significantly higher complement pathway activities than those in C1 and C3 subtypes (Figure 7B; p values < 0.001, Wilcoxon rank-sum test). The complement system is a collection of serum proteins that are integral to inflammatory processes and innate immunity against infection.48 Several studies have demonstrated that some components generated by complement pathway activation could promote tumor cell growth and progression.49,50 These results are consistent with the worse survival of patients in C2 and C4 subtypes. Although complement pathway activities were similar between patients in C1 and C3, and between C2 and C4, there were significant survival differences among these pairs of groups (Figure 6E). We found that the bile acid metabolism pathways showed greater activities in C1 and C2 subtypes (Figure 7C; p values < 0.001, Wilcoxon rank-sum test), which might be a potential pathway indicator for distinguishing C1 from C3 and C2 from C4 subtypes. Bile acids play a critical role in the regulation of glucose, lipid, and energy metabolism.51
Figure 7.

Pathway activities across patients in different subtypes
(A) Heatmap showing the cancer hallmark-related pathway activities across patients. (B) Boxplots showing the distribution of complement pathway activities for patients in different subtypes. (C) Boxplots showing the distribution of bile acid metabolism pathway activities for patients in different subtypes.
Moreover, we investigated the immune cell infiltration levels in patients. Those in C1 showed higher immune cell infiltration levels (Figure S9). Next, we explored the mutations in patients among different subtypes. In total, five genes were identified with significant mutation frequency among subtypes (Fisher’s exact test p < 0.01; Figure S10). These genes have been found to play critical roles in cancer, such as VHL52 and PBRM153. In addition, we investigated the extent to which we can subtype the same kidney cancer patients by AS. Based on the AS events regulated by RBPs, we classified the patients into three subtypes. We found that these clusters significantly overlapped with those classified based on RBP expression (Figure S11). Next, we validated the classification in another two independent datasets. We found that patients can be classified into four subtypes with distinct survival rates (Figure S12). Taken together, all these results indicate that there are significant differences in pathway activities among cancer subtypes, which provided potential candidates for pathway-based cancer therapy.
Therapeutic targets of RBPs in cancer
As shown in previous studies and our current observations, deregulated RBPs can affect many characteristics of cancer, which suggests that RBPs might be a good therapeutic target for cancer treatment.54 Next, to identify the potential RBP candidates for cancer therapy, we evaluated the correlation between the expression levels of RBPs and drug activities across cancer types. We found that ∼1,088 RBPs correlated with the drug half-maximal inhibitory concentration (IC50) values across 10 cancers (Figure 8A; absolute values of correlation coefficient [|R|] > 0.5 and p values < 0.01). We next focused on the drug-RBP correlations in KIRC, and these correlated RBPs and drugs formed a dense network (Figure 8B). Specifically, we found that several drugs, such as pelitinib, masitinib, and omipalisib, correlated with more RBPs. Pelitinib is a potent irreversible epidermal growth factor receptor-tyrosine kinase inhibitor currently in clinical trials for the treatment of cancer.55 Moreover, several RBPs, such as ATP5F1, BCAS2, and RRP12, also correlated with more drugs. These RBPs have been demonstrated to play key roles in various types of cancer.56,57
Figure 8.

The correlation between expression of RBPs and drug activities
(A) The number of drugs or RBPs identified in each cancer type. (B) Network showing the drug-RBP correlations in KIRC. The size of nodes corresponds to the number of correlations. Red lines, positive correlations; blue lines, negative correlations. (C) Sub-network showing the drugs correlated with RBPs used for subtyping. (D and E) Kaplan-Meier plots indicating overall survival (D) and disease-free survival (E) of cancer patients with high and low PPIH expression.
In addition, we extracted the sub-network for 68 RBPs that were used for kidney cancer subtyping. Ten drugs potentially correlated with the expression of five RBPs (Figure 8C), including SNRPD1, RNPS1, PPIA, MRPL14, and PPIH. The expression of PPIH correlated with masitinib and QL-XII-47. Next, we computationally modeled the altered expression of RBPs by dividing cell lines into two groups. Then, we compared the IC50 values between two groups with different RBP expressions and found significant inter-group differences (Figure S13). These results suggest that alteration of RBP expression might affect the IC50 of cell lines. Moreover, high expression of PPIH was significantly associated with worse overall survival and disease-free survival in kidney cancer (log rank test, p value = 0.0066 and p value = 0.013, respectively; Figure 8D). All these results suggest that these two drugs might be potentially used for cancer therapy.
Discussion
There is accumulating evidence that RBPs regulate the expression and AS of thousands of transcripts, and more and more RBPs have been reported to be involved in various types of cancer. In the present study, we integrated the AS perturbation and genome-wide expression of RBPs and proposed a computational method to identify the RBP regulators in cancer. Our hypothesis was that RBPs can regulate AS in cancer. These RBPs also exhibited dysregulated expression in cancer and correlated with cancer-related pathway activities. Our analyses demonstrated that these RBP regulators play important roles in cancer hallmark-related pathways and may be helpful in cancer subtyping and identification of potential drug targets. All these results provided new insights into the RBP functions in cancer as well as cancer therapy. Moreover, we computationally analyzed the perturbation of AS across cancer types. We identified the important RBPs correlated with cancer pathway activities. However, these prioritized ASs and RBPs need to be further functionally validated in cell lines or animal models.
With the development of high-throughput sequencing, a number of RBP-gene regulations were identified. However, only 40 RNA binding domains (RBDs) of RBPs have been identified to date, although their number is constantly increasing.58 The presence of multiple RBDs in a RBP enables a more specific and higher-affinity interaction of the RBP with its targets. Thus, we need to analyze the regulation among RBPs and genes in a network-based view. Recently developed crosslinking and immunoprecipitation (CLIP)-based methods have been employed with demonstrable success in the transcriptome-wide identification of binding sites for RBPs.59 However, additional work is still needed to establish protocols that would allow obtaining quantitative data on RBP-RNA interactions. Identification of the RBP targets will help in understanding their roles in cancer.
Moreover, immunotherapy is now becoming a frontline treatment for many tumor types. A few notable examples of AS events have clearly been demonstrated to regulate T cell responses to antigens.60 Additionally, a growing number of RBPs were found to be involved in cancer immunology. RBP PTBP1 was found to be important for the progression of B cells through late S phase of the cell cycle and for affinity maturation.61 AT-rich interactive domain 5A (ARID5A/Arid5a) has recently been recognized to be associated with inflammatory autoimmune diseases.62 Distinct isoforms of RBPs have been found to play specific antiviral and immune resolution functions.63 Thus, systematical understanding of the consequences of AS and RBP regulation in the adaptive immune system and cancer immunology will give us a new view of functions of AS in cancer.
In summary, our results provided a detailed landscape for AS perturbation across cancer types and identified the potential RBP regulators. Functional analyses and drug screening of RBPs may be helpful to pave the way for the development of cancer therapies.
Materials and methods
Genome-wide AS profiling across human cancers
To systematically investigate the AS landscape across cancer, we first retrieved the genome-wide AS data in 10,699 samples representing 33 cancer types.64 The AS profiles of patients were downloaded from the TCGA SpliceSeq database. The transcript splicing patterns and splicing events were identified by the SpliceSeq pipeline.65 The splicing events were quantified by the PSI value, which was defined as the number of reads that a transcript element was presented divided by the total number of reads covering the AS event. In total, seven types of AS events were considered, including ES, AD, AA, RI, ME, AT, and AP.
Identification of perturbed AS events in cancer
We identified the PASEs in 18 cancer types with more than five normal samples. Wilcoxon rank-sum test was used to identify the differential AS events in each cancer type. The p values were corrected by Benjamini-Hochberg (BH) method.66 The AS events with >1.2-fold changes and adjusted p values < 0.05 were identified as perturbed.
In addition, we calculated the OR for each type of AS event to explore which AS types were more likely to be perturbed in cancer. OR is a statistic that is similar to risk ratio (RR). The OR is the ratio of the odds of an AS event occurring in differential group to the odds of it occurring in total AS events. An OR >1 indicates that the AS event is more likely to occur in the differential group. The OR for each AS type m in cancer n was calculated by
where is the number of perturbed AS type m in cancer n, is the total number of AS type m in cancer n, is the total number of PASEs in cancer n, and is the total number of AS events observed in cancer n. Moreover, we calculated the cancer similarity based on the shared PASEs, similar to our previous method.10
The t-distributed stochastic neighbor embedding of cancer patients
We first used the “var” function in Python to identify the AS events that exhibited high variation of PSI values across tumors. All the AS events exhibiting difference in at least one cancer type were considered in our analysis. The 100 top-ranked AS events were used, and all tumor samples were modeled by a two-dimensional point.
Manual collection and classification of human RBPs
We manually curated the recently published literature to collect comprehensive RBPs in human. First, we obtained three human RBP gene lists from the literature, including 1,350,15 799,29 and 1,07267 genes. Next, 1,148 RBPs in mouse were retrieved from the Liao et al. study.68 We used BioMart in Ensembl to map these RBPs to human and obtained the human RBP genes. In addition, 1,550 genes annotated as “binding” and “splicing” in Gene Ontology were collected. In total, 2,038 RBP genes were obtained for analysis. These RBPs were classified into nine sub-classes based on literature annotation, including ribosomal-binding protein, mRNA-binding protein, pre-rRNA-binding protein, tRNA-binding protein, small nuclear RNA (snRNA)-binding protein, small nucleolar RNA (snoRNA)-binding protein, ncRNA-binding protein, diverse-binding protein, and unknown.
Transcriptomic dysregulation analysis of RBPs in cancer
Genome-wide expressions of RBPs in 33 cancer types were obtained from the TCGA project. We first filtered the genes with expression level 0 in >30% of samples. Next, a t test was used to investigate the difference in expression of RBPs in cancer versus normal tissue. Here, 18 cancer types with more than five normal samples were considered. p values were adjusted by BH method, and RBPs with >1.2-fold changes and p-adjusted < 0.05 were identified as dysregulated RBPs in cancer. Moreover, Wilcoxon rank-sum test was used to identify dysregulated RBPs. In addition, another two independent kidney cancer transcriptomes were downloaded from Gene Expression Omnibus (GEO) under the accession numbers GSE29609 and GSE2748. These two datasets were combined, and bath effects were corrected by ComBat.
Identification of RBPs correlating with perturbed AS
To identify the RBPs that may potentially regulate the AS events in cancer, we proposed a three-step method that integrated RBP expression and AS profiling. First, we constructed the perturbed AS profiling for each patient in each cancer. For the specific AS event i, the perturbed level in patient j was calculated as follows:
where N is the number of normal samples in specific cancer. Next, we calculated two activity scores (active and repressive scores, SA and SR) for all AS events across cancer patients. For each patient j, these two scores were calculated as follows:
where p and q are the number of AS events with greater or less than 0, respectively.
Second, we identified RBPs with transcriptomic perturbations in cancer by t test. We hypothesized that the expression levels of RBP regulators would be correlated with the activity scores. Thus, we calculated the SCC between the RBP expression level and active and repressive scores across cancer patients. p values of SCC < 0.1 were selected for further analysis. In addition, the labels of patients were perturbed, and we recalculated the SCC. This procedure was repeated 1,000 times for each RBP. The p value for random test was calculated as the number of SCCs in random conditions that were greater than real conditions. p values were adjusted by BH method, and we identified the RBPs with p-adjusted < 0.05. RBPs that correlated with active/repressive scores were defined as active/repressive RBP regulators, respectively.
Functional analysis of pan-cancer RBP regulators
To identify the function of RBPs, we performed functional enrichment analysis based on the AS event-involved genes. In our analysis, 50 cancer hallmark-related pathways were used.40 The hypergeometric test was used for this process, and the p values were calculated as follows:
where N is the total number of human coding genes, represents the AS genes regulated by RBP i, is the number of genes in pathway j, and are the overlapping genes between RBP-regulated genes and those in pathway. All p values were subjected to FDR correction. All RBP-pathway pairs with FDR < 0.05 were identified and visualized by Cytoscape 3.7.1.69
Identification of subtypes of cancer
The common RBP regulators that potentially regulated AS events in KIRC and KIRP were identified. Consensus ward linkage hierarchical clustering of the samples and RBPs identified the subtypes with the stability of the clustering increasing from k = 2 to k = 10. For each iteration process, we selected 80% of the kidney cancer samples, which was repeated 100 times. This process was performed by using the R package “ConsensusClusterPlus.”47
Pathway activities of cancer patients
To calculate the pathway activities for each cancer patient, we used GSVA70 and 50 cancer hallmark-related pathways from MSigDB.71 The pathway differences among patients in different subtypes were investigated by ANOVA. The p values were adjusted by BH method, and pathways with FDR <0.01 were identified.
Immune cell infiltration levels in cancer patients
We downloaded the immune cell infiltration levels from TIMER2.0 (http://timer.cistrome.org/). We used “kruskal.test” to evaluate the differences among different subtypes. The immune cell infiltration levels with p-adjusted <0.01 were shown by heatmap.
Identification of drug-related RBPs
We first downloaded the IC50 values for a number of drugs across cell lines from Genomics of Drug Sensitivity in Cancer (GDSC).72 These cell lines were classified into different cancer types. For each cancer type, we calculated the correlation coefficient between the expression of RBPs and IC50 values of a drug across cell lines. The drug-RBP pairs with |R| >0.5 and p value <0.01 were identified. The drug-RBP pairs were visualized by Cytoscape 3.7.1.
Survival analysis
The clinical information for cancers was obtained from the TCGA project via the TCGAbiolinks R package.73 The function survdiff in the survival R package was used for exploring the difference in survival time among different groups of patients.
Acknowledgments
This work was supported by Hainan Provincial Natural Science Foundation of China (grant no. 820MS053); the National Key R&D Program of China (grant no. 2018YFC2000100); the National Natural Science Foundation of China (grant nos. 61873075, 32060152, 32070673, 31970646, and 31871338); Natural Science Foundation for Distinguished Young Scholars of Heilongjiang Province (JQ2019C004); and Heilongjiang Touyan Innovation Team Program and University Nursing Program for Young Scholars with Creative Talents in Heilongjiang Province (UNPYSCT-2016189 and UNPYSCT-2017059).
Author contributions
Y.L., Xia Li, and Y.Z. designed the research studies. J.L., L.C., and T.P. acquired the data and conducted the data analysis. Q.W., Z.C., W.Z., Xinhui Li, and G.X. designed the figures with input from Y.L. Y.L., Xia Li, and Y.Z. wrote the manuscript. All authors read and approved the final manuscript.
Declaration of interests
The authors declare no competing interests.
Footnotes
Supplemental information can be found online at https://doi.org/10.1016/j.omtn.2021.04.005.
Contributor Information
Xia Li, Email: lixia@hrbmu.edu.cn.
Yongsheng Li, Email: liyongsheng@hainmc.edu.cn.
Yunpeng Zhang, Email: zhangyp@hrbmu.edu.cn.
Supplemental information
References
- 1.Blencowe B.J. The Relationship between Alternative Splicing and Proteomic Complexity. Trends Biochem. Sci. 2017;42:407–408. doi: 10.1016/j.tibs.2017.04.001. [DOI] [PubMed] [Google Scholar]
- 2.Koch L. Alternative splicing: A thermometer controlling gene expression. Nat. Rev. Genet. 2017;18:515. doi: 10.1038/nrg.2017.61. [DOI] [PubMed] [Google Scholar]
- 3.Kahles A., Lehmann K.V., Toussaint N.C., Hüser M., Stark S.G., Sachsenberg T., Stegle O., Kohlbacher O., Sander C., Rätsch G., Cancer Genome Atlas Research Network Comprehensive Analysis of Alternative Splicing Across Tumors from 8,705 Patients. Cancer Cell. 2018;34:211–224.e6. doi: 10.1016/j.ccell.2018.07.001. [DOI] [PMC free article] [PubMed] [Google Scholar]
- 4.Climente-González H., Porta-Pardo E., Godzik A., Eyras E. The Functional Impact of Alternative Splicing in Cancer. Cell Rep. 2017;20:2215–2226. doi: 10.1016/j.celrep.2017.08.012. [DOI] [PubMed] [Google Scholar]
- 5.Li Y., McGrail D.J., Xu J., Mills G.B., Sahni N., Yi S. Gene Regulatory Network Perturbation by Genetic and Epigenetic Variation. Trends Biochem. Sci. 2018;43:576–592. doi: 10.1016/j.tibs.2018.05.002. [DOI] [PMC free article] [PubMed] [Google Scholar]
- 6.Zhang Y., Yan L., Zeng J., Zhou H., Liu H., Yu G., Yao W., Chen K., Ye Z., Xu H. Pan-cancer analysis of clinical relevance of alternative splicing events in 31 human cancers. Oncogene. 2019;38:6678–6695. doi: 10.1038/s41388-019-0910-7. [DOI] [PubMed] [Google Scholar]
- 7.Pan Q., Shai O., Lee L.J., Frey B.J., Blencowe B.J. Deep surveying of alternative splicing complexity in the human transcriptome by high-throughput sequencing. Nat. Genet. 2008;40:1413–1415. doi: 10.1038/ng.259. [DOI] [PubMed] [Google Scholar]
- 8.Wang E.T., Sandberg R., Luo S., Khrebtukova I., Zhang L., Mayr C., Kingsmore S.F., Schroth G.P., Burge C.B. Alternative isoform regulation in human tissue transcriptomes. Nature. 2008;456:470–476. doi: 10.1038/nature07509. [DOI] [PMC free article] [PubMed] [Google Scholar]
- 9.Jung H., Lee D., Lee J., Park D., Kim Y.J., Park W.Y., Hong D., Park P.J., Lee E. Intron retention is a widespread mechanism of tumor-suppressor inactivation. Nat. Genet. 2015;47:1242–1248. doi: 10.1038/ng.3414. [DOI] [PubMed] [Google Scholar]
- 10.Li Y., Sahni N., Pancsa R., McGrail D.J., Xu J., Hua X., Coulombe-Huntington J., Ryan M., Tychhon B., Sudhakar D. Revealing the Determinants of Widespread Alternative Splicing Perturbation in Cancer. Cell Rep. 2017;21:798–812. doi: 10.1016/j.celrep.2017.09.071. [DOI] [PMC free article] [PubMed] [Google Scholar]
- 11.Morrissy A.S., Griffith M., Marra M.A. Extensive relationship between antisense transcription and alternative splicing in the human genome. Genome Res. 2011;21:1203–1212. doi: 10.1101/gr.113431.110. [DOI] [PMC free article] [PubMed] [Google Scholar]
- 12.Ghigna C., Giordano S., Shen H., Benvenuto F., Castiglioni F., Comoglio P.M., Green M.R., Riva S., Biamonti G. Cell motility is controlled by SF2/ASF through alternative splicing of the Ron protooncogene. Mol. Cell. 2005;20:881–890. doi: 10.1016/j.molcel.2005.10.026. [DOI] [PubMed] [Google Scholar]
- 13.Han H., Braunschweig U., Gonatopoulos-Pournatzis T., Weatheritt R.J., Hirsch C.L., Ha K.C.H., Radovani E., Nabeel-Shah S., Sterne-Weiler T., Wang J. Multilayered Control of Alternative Splicing Regulatory Networks by Transcription Factors. Mol. Cell. 2017;65:539–553.e7. doi: 10.1016/j.molcel.2017.01.011. [DOI] [PubMed] [Google Scholar]
- 14.Bechara E.G., Sebestyén E., Bernardis I., Eyras E., Valcárcel J. RBM5, 6, and 10 differentially regulate NUMB alternative splicing to control cancer cell proliferation. Mol. Cell. 2013;52:720–733. doi: 10.1016/j.molcel.2013.11.010. [DOI] [PubMed] [Google Scholar]
- 15.Sebestyén E., Singh B., Miñana B., Pagès A., Mateo F., Pujana M.A., Valcárcel J., Eyras E. Large-scale analysis of genome and transcriptome alterations in multiple tumors unveils novel cancer-relevant splicing networks. Genome Res. 2016;26:732–744. doi: 10.1101/gr.199935.115. [DOI] [PMC free article] [PubMed] [Google Scholar]
- 16.Bondy-Chorney E., Baldwin R.M., Didillon A., Chabot B., Jasmin B.J., Côté J. RNA binding protein RALY promotes Protein Arginine Methyltransferase 1 alternatively spliced isoform v2 relative expression and metastatic potential in breast cancer cells. Int. J. Biochem. Cell Biol. 2017;91(Pt B):124–135. doi: 10.1016/j.biocel.2017.07.008. [DOI] [PubMed] [Google Scholar]
- 17.Muys B.R., Anastasakis D.G., Claypool D., Pongor L., Li X.L., Grammatikakis I., Liu M., Wang X., Prasanth K.V., Aladjem M.I. The p53-induced RNA-binding protein ZMAT3 is a splicing regulator that inhibits the splicing of oncogenic CD44 variants in colorectal carcinoma. Genes Dev. 2021;35:102–116. doi: 10.1101/gad.342634.120. [DOI] [PMC free article] [PubMed] [Google Scholar]
- 18.Mohibi S., Chen X., Zhang J. Cancer the’RBP’eutics-RNA-binding proteins as therapeutic targets for cancer. Pharmacol. Ther. 2019;203:107390. doi: 10.1016/j.pharmthera.2019.07.001. [DOI] [PMC free article] [PubMed] [Google Scholar]
- 19.Zhang J., Li S., Zhang L., Xu J., Song M., Shao T., Huang Z., Li Y. RBP EIF2S2 Promotes Tumorigenesis and Progression by Regulating MYC-Mediated Inhibition via FHIT-Related Enhancers. Mol. Ther. 2020;28:1105–1118. doi: 10.1016/j.ymthe.2020.02.004. [DOI] [PMC free article] [PubMed] [Google Scholar]
- 20.Zhang D., Hu Q., Ji Y., Chao H.-P., Tracz A., Kirk J., Buonamici S., Zhu P., Wang J., Liu S., Tang D.G. Dysregulated Alternative Splicing Landscape Identifies Intron Retention as a Hallmark and Spliceosome as a Therapeutic Vulnerability in Aggressive Prostate Cancer. bioRxiv. 2019 doi: 10.1101/634402. [DOI] [Google Scholar]
- 21.Hoadley K.A., Yau C., Hinoue T., Wolf D.M., Lazar A.J., Drill E., Shen R., Taylor A.M., Cherniack A.D., Thorsson V., Cancer Genome Atlas Network Cell-of-Origin Patterns Dominate the Molecular Classification of 10,000 Tumors from 33 Types of Cancer. Cell. 2018;173:291–304.e6. doi: 10.1016/j.cell.2018.03.022. [DOI] [PMC free article] [PubMed] [Google Scholar]
- 22.Wellenstein M.D., de Visser K.E. Cancer-Cell-Intrinsic Mechanisms Shaping the Tumor Immune Landscape. Immunity. 2018;48:399–416. doi: 10.1016/j.immuni.2018.03.004. [DOI] [PubMed] [Google Scholar]
- 23.Li Y., Jiang T., Zhou W., Li J., Li X., Wang Q., Jin X., Yin J., Chen L., Zhang Y. Pan-cancer characterization of immune-related lncRNAs identifies potential oncogenic biomarkers. Nat. Commun. 2020;11:1000. doi: 10.1038/s41467-020-14802-2. [DOI] [PMC free article] [PubMed] [Google Scholar]
- 24.Wang Z., Yin J., Zhou W., Bai J., Xie Y., Xu K., Zheng X., Xiao J., Zhou L., Qi X. Complex impact of DNA methylation on transcriptional dysregulation across 22 human cancer types. Nucleic Acids Res. 2020;48:2287–2302. doi: 10.1093/nar/gkaa041. [DOI] [PMC free article] [PubMed] [Google Scholar]
- 25.Sondka Z., Bamford S., Cole C.G., Ward S.A., Dunham I., Forbes S.A. The COSMIC Cancer Gene Census: describing genetic dysfunction across all human cancers. Nat. Rev. Cancer. 2018;18:696–705. doi: 10.1038/s41568-018-0060-1. [DOI] [PMC free article] [PubMed] [Google Scholar]
- 26.Sriram A., Bohlen J., Teleman A.A. Translation acrobatics: how cancer cells exploit alternate modes of translational initiation. EMBO Rep. 2018;19:e45947. doi: 10.15252/embr.201845947. [DOI] [PMC free article] [PubMed] [Google Scholar]
- 27.Peng Y.F., Mandai K., Nakanishi H., Ikeda W., Asada M., Momose Y., Shibamoto S., Yanagihara K., Shiozaki H., Monden M. Restoration of E-cadherin-based cell-cell adhesion by overexpression of nectin in HSC-39 cells, a human signet ring cell gastric cancer cell line. Oncogene. 2002;21:4108–4119. doi: 10.1038/sj.onc.1205517. [DOI] [PubMed] [Google Scholar]
- 28.Hu H., Miao Y.R., Jia L.H., Yu Q.Y., Zhang Q., Guo A.Y. AnimalTFDB 3.0: a comprehensive resource for annotation and prediction of animal transcription factors. Nucleic Acids Res. 2019;47(D1):D33–D38. doi: 10.1093/nar/gky822. [DOI] [PMC free article] [PubMed] [Google Scholar]
- 29.Kechavarzi B., Janga S.C. Dissecting the expression landscape of RNA-binding proteins in human cancers. Genome Biol. 2014;15:R14. doi: 10.1186/gb-2014-15-1-r14. [DOI] [PMC free article] [PubMed] [Google Scholar]
- 30.Wang S., Jia M., He Z., Liu X.S. APOBEC3B and APOBEC mutational signature as potential predictive markers for immunotherapy response in non-small cell lung cancer. Oncogene. 2018;37:3924–3936. doi: 10.1038/s41388-018-0245-9. [DOI] [PMC free article] [PubMed] [Google Scholar]
- 31.Burns M.B., Temiz N.A., Harris R.S. Evidence for APOBEC3B mutagenesis in multiple human cancers. Nat. Genet. 2013;45:977–983. doi: 10.1038/ng.2701. [DOI] [PMC free article] [PubMed] [Google Scholar]
- 32.Zhang H., Qi J., Reyes J.M., Li L., Rao P.K., Li F., Lin C.Y., Perry J.A., Lawlor M.A., Federation A. Oncogenic Deregulation of EZH2 as an Opportunity for Targeted Therapy in Lung Cancer. Cancer Discov. 2016;6:1006–1021. doi: 10.1158/2159-8290.CD-16-0164. [DOI] [PMC free article] [PubMed] [Google Scholar]
- 33.Fernandez-Barral A., Costales-Carrera A., Buira S.P., Jung P., Ferrer-Mayorga G., Larriba M.J., Bustamante-Madrid P., Dominguez O., Real F.X., Guerra-Pastrian L. Vitamin D differentially regulates colon stem cells in patient-derived normal and tumor organoids. FEBS J. 2020;287:53–72. doi: 10.1111/febs.14998. [DOI] [PMC free article] [PubMed] [Google Scholar]
- 34.Wang J., Huang F., Huang J., Kong J., Liu S., Jin J. Epigenetic analysis of FHL1 tumor suppressor gene in human liver cancer. Oncol. Lett. 2017;14:6109–6116. doi: 10.3892/ol.2017.6950. [DOI] [PMC free article] [PubMed] [Google Scholar]
- 35.Khan I., Gril B., Steeg P.S. Metastasis Suppressors NME1 and NME2 Promote Dynamin 2 Oligomerization and Regulate Tumor Cell Endocytosis, Motility, and Metastasis. Cancer Res. 2019;79:4689–4702. doi: 10.1158/0008-5472.CAN-19-0492. [DOI] [PMC free article] [PubMed] [Google Scholar]
- 36.Ghuwalewala S., Ghatak D., Das P., Dey S., Sarkar S., Alam N., Panda C.K., Roychoudhury S. CD44(high)CD24(low) molecular signature determines the Cancer Stem Cell and EMT phenotype in Oral Squamous Cell Carcinoma. Stem Cell Res. (Amst.) 2016;16:405–417. doi: 10.1016/j.scr.2016.02.028. [DOI] [PubMed] [Google Scholar]
- 37.Sebestyén E., Zawisza M., Eyras E. Detection of recurrent alternative splicing switches in tumor samples reveals novel signatures of cancer. Nucleic Acids Res. 2015;43:1345–1356. doi: 10.1093/nar/gku1392. [DOI] [PMC free article] [PubMed] [Google Scholar]
- 38.Cheung H.C., Hai T., Zhu W., Baggerly K.A., Tsavachidis S., Krahe R., Cote G.J. Splicing factors PTBP1 and PTBP2 promote proliferation and migration of glioma cell lines. Brain. 2009;132:2277–2288. doi: 10.1093/brain/awp153. [DOI] [PMC free article] [PubMed] [Google Scholar]
- 39.Cheng F., Liu C., Lin C.C., Zhao J., Jia P., Li W.H., Zhao Z. A Gene Gravity Model for the Evolution of Cancer Genomes: A Study of 3,000 Cancer Genomes across 9 Cancer Types. PLoS Comput. Biol. 2015;11:e1004497. doi: 10.1371/journal.pcbi.1004497. [DOI] [PMC free article] [PubMed] [Google Scholar]
- 40.Liberzon A., Birger C., Thorvaldsdóttir H., Ghandi M., Mesirov J.P., Tamayo P. The Molecular Signatures Database (MSigDB) hallmark gene set collection. Cell Syst. 2015;1:417–425. doi: 10.1016/j.cels.2015.12.004. [DOI] [PMC free article] [PubMed] [Google Scholar]
- 41.Nikolaou K.C., Vatandaslar H., Meyer C., Schmid M.W., Tuschl T., Stoffel M. The RNA-Binding Protein A1CF Regulates Hepatic Fructose and Glycerol Metabolism via Alternative RNA Splicing. Cell Rep. 2019;29:283–300.e8. doi: 10.1016/j.celrep.2019.08.100. [DOI] [PubMed] [Google Scholar]
- 42.Gopalakrishna S., Pearce S.F., Dinan A.M., Schober F.A., Cipullo M., Spåhr H., Khawaja A., Maffezzini C., Freyer C., Wredenberg A. C6orf203 is an RNA-binding protein involved in mitochondrial protein synthesis. Nucleic Acids Res. 2019;47:9386–9399. doi: 10.1093/nar/gkz684. [DOI] [PMC free article] [PubMed] [Google Scholar]
- 43.Stricker T.P., Brown C.D., Bandlamudi C., McNerney M., Kittler R., Montoya V., Peterson A., Grossman R., White K.P. Robust stratification of breast cancer subtypes using differential patterns of transcript isoform expression. PLoS Genet. 2017;13:e1006589. doi: 10.1371/journal.pgen.1006589. [DOI] [PMC free article] [PubMed] [Google Scholar]
- 44.Leivonen S.K., Taskinen M., Cervera A., Karjalainen-Lindsberg M.L., Delabie J., Holte H., Lehtonen R., Hautaniemi S., Leppä S. Alternative splicing discriminates molecular subtypes and has prognostic impact in diffuse large B-cell lymphoma. Blood Cancer J. 2017;7:e596. doi: 10.1038/bcj.2017.71. [DOI] [PMC free article] [PubMed] [Google Scholar]
- 45.Lin P., He R.Q., Ma F.C., Liang L., He Y., Yang H., Dang Y.W., Chen G. Systematic Analysis of Survival-Associated Alternative Splicing Signatures in Gastrointestinal Pan-Adenocarcinomas. EBioMedicine. 2018;34:46–60. doi: 10.1016/j.ebiom.2018.07.040. [DOI] [PMC free article] [PubMed] [Google Scholar]
- 46.Li Y., Xiao J., Bai J., Tian Y., Qu Y., Chen X., Wang Q., Li X., Zhang Y., Xu J. Molecular characterization and clinical relevance of m6A regulators across 33 cancer types. Mol. Cancer. 2019;18:137. doi: 10.1186/s12943-019-1066-3. [DOI] [PMC free article] [PubMed] [Google Scholar]
- 47.Wilkerson M.D., Hayes D.N. ConsensusClusterPlus: a class discovery tool with confidence assessments and item tracking. Bioinformatics. 2010;26:1572–1573. doi: 10.1093/bioinformatics/btq170. [DOI] [PMC free article] [PubMed] [Google Scholar]
- 48.Zhao L., Zhang Z., Lin J., Cao L., He B., Han S., Zhang X. Complement receptor 1 genetic variants contribute to the susceptibility to gastric cancer in chinese population. J. Cancer. 2015;6:525–530. doi: 10.7150/jca.10749. [DOI] [PMC free article] [PubMed] [Google Scholar]
- 49.Markiewski M.M., DeAngelis R.A., Benencia F., Ricklin-Lichtsteiner S.K., Koutoulaki A., Gerard C., Coukos G., Lambris J.D. Modulation of the antitumor immune response by complement. Nat. Immunol. 2008;9:1225–1235. doi: 10.1038/ni.1655. [DOI] [PMC free article] [PubMed] [Google Scholar]
- 50.Reis E.S., Mastellos D.C., Ricklin D., Mantovani A., Lambris J.D. Complement in cancer: untangling an intricate relationship. Nat. Rev. Immunol. 2018;18:5–18. doi: 10.1038/nri.2017.97. [DOI] [PMC free article] [PubMed] [Google Scholar]
- 51.Chiang J.Y.L. Bile acid metabolism and signaling in liver disease and therapy. Liver Res. 2017;1:3–9. doi: 10.1016/j.livres.2017.05.001. [DOI] [PMC free article] [PubMed] [Google Scholar]
- 52.Capitanio U., Rosiello G., Erdem S., Rowe I., Kara O., Roussel E., Campi R., Klatte T., Kriegmair M.C., Sibona M., Kidney Cancer Working Group of the Young Academic Urologists (YAU) Working Party of the European Association of Urology (EAU) Clinical, surgical, pathological and follow-up features of kidney cancer patients with Von Hippel-Lindau syndrome: novel insights from a large consortium. World J. Urol. 2021 doi: 10.1007/s00345-020-03574-5. Published online January 8, 2021. [DOI] [PubMed] [Google Scholar]
- 53.Hakimi A.A., Attalla K., DiNatale R.G., Ostrovnaya I., Flynn J., Blum K.A., Ged Y., Hoen D., Kendall S.M., Reznik E. A pan-cancer analysis of PBAF complex mutations and their association with immunotherapy response. Nat. Commun. 2020;11:4168. doi: 10.1038/s41467-020-17965-0. [DOI] [PMC free article] [PubMed] [Google Scholar]
- 54.Hong S. RNA Binding Protein as an Emerging Therapeutic Target for Cancer Prevention and Treatment. J. Cancer Prev. 2017;22:203–210. doi: 10.15430/JCP.2017.22.4.203. [DOI] [PMC free article] [PubMed] [Google Scholar]
- 55.To K.K., Poon D.C., Wei Y., Wang F., Lin G., Fu L. Pelitinib (EKB-569) targets the up-regulation of ABCB1 and ABCG2 induced by hyperthermia to eradicate lung cancer. Br. J. Pharmacol. 2015;172:4089–4106. doi: 10.1111/bph.13189. [DOI] [PMC free article] [PubMed] [Google Scholar]
- 56.Brüggemann M., Gromes A., Poss M., Schmidt D., Klümper N., Tolkach Y., Dietrich D., Kristiansen G., Müller S.C., Ellinger J. Systematic Analysis of the Expression of the Mitochondrial ATP Synthase (Complex V) Subunits in Clear Cell Renal Cell Carcinoma. Transl. Oncol. 2017;10:661–668. doi: 10.1016/j.tranon.2017.06.002. [DOI] [PMC free article] [PubMed] [Google Scholar]
- 57.Zhou K.R., Liu S., Sun W.J., Zheng L.L., Zhou H., Yang J.H., Qu L.H. ChIPBase v2.0: decoding transcriptional regulatory networks of non-coding RNAs and protein-coding genes from ChIP-seq data. Nucleic Acids Res. 2017;45(D1):D43–D50. doi: 10.1093/nar/gkw965. [DOI] [PMC free article] [PubMed] [Google Scholar]
- 58.Kishore S., Luber S., Zavolan M. Deciphering the role of RNA-binding proteins in the post-transcriptional control of gene expression. Brief. Funct. Genomics. 2010;9:391–404. doi: 10.1093/bfgp/elq028. [DOI] [PMC free article] [PubMed] [Google Scholar]
- 59.Hafner M., Landthaler M., Burger L., Khorshid M., Hausser J., Berninger P., Rothballer A., Ascano M., Jr., Jungkamp A.C., Munschauer M. Transcriptome-wide identification of RNA-binding protein and microRNA target sites by PAR-CLIP. Cell. 2010;141:129–141. doi: 10.1016/j.cell.2010.03.009. [DOI] [PMC free article] [PubMed] [Google Scholar]
- 60.Martinez N.M., Lynch K.W. Control of alternative splicing in immune responses: many regulators, many predictions, much still to learn. Immunol. Rev. 2013;253:216–236. doi: 10.1111/imr.12047. [DOI] [PMC free article] [PubMed] [Google Scholar]
- 61.Monzón-Casanova E., Screen M., Díaz-Muñoz M.D., Coulson R.M.R., Bell S.E., Lamers G., Solimena M., Smith C.W.J., Turner M. The RNA-binding protein PTBP1 is necessary for B cell selection in germinal centers. Nat. Immunol. 2018;19:267–278. doi: 10.1038/s41590-017-0035-5. [DOI] [PMC free article] [PubMed] [Google Scholar]
- 62.Nyati K.K., Zaman M.M., Sharma P., Kishimoto T. Arid5a, an RNA-Binding Protein in Immune Regulation: RNA Stability, Inflammation, and Autoimmunity. Trends Immunol. 2020;41:255–268. doi: 10.1016/j.it.2020.01.004. [DOI] [PubMed] [Google Scholar]
- 63.Schwerk J., Soveg F.W., Ryan A.P., Thomas K.R., Hatfield L.D., Ozarkar S., Forero A., Kell A.M., Roby J.A., So L. RNA-binding protein isoforms ZAP-S and ZAP-L have distinct antiviral and immune resolution functions. Nat. Immunol. 2019;20:1610–1620. doi: 10.1038/s41590-019-0527-6. [DOI] [PMC free article] [PubMed] [Google Scholar]
- 64.Ryan M., Wong W.C., Brown R., Akbani R., Su X., Broom B., Melott J., Weinstein J. TCGASpliceSeq a compendium of alternative mRNA splicing in cancer. Nucleic Acids Res. 2016;44(D1):D1018–D1022. doi: 10.1093/nar/gkv1288. [DOI] [PMC free article] [PubMed] [Google Scholar]
- 65.Ryan M.C., Cleland J., Kim R., Wong W.C., Weinstein J.N. SpliceSeq: a resource for analysis and visualization of RNA-Seq data on alternative splicing and its functional impacts. Bioinformatics. 2012;28:2385–2387. doi: 10.1093/bioinformatics/bts452. [DOI] [PMC free article] [PubMed] [Google Scholar]
- 66.Benjamini Y., Hochberg Y. Controlling the False Discovery Rate: A Practical and Powerful Approach to Multiple Testing. J. R. Stat. Soc. Series B. 1995;57:289–300. [Google Scholar]
- 67.Sundararaman B., Zhan L., Blue S.M., Stanton R., Elkins K., Olson S., Wei X., Van Nostrand E.L., Pratt G.A., Huelga S.C. Resources for the Comprehensive Discovery of Functional RNA Elements. Mol. Cell. 2016;61:903–913. doi: 10.1016/j.molcel.2016.02.012. [DOI] [PMC free article] [PubMed] [Google Scholar]
- 68.Liao Y., Castello A., Fischer B., Leicht S., Föehr S., Frese C.K., Ragan C., Kurscheid S., Pagler E., Yang H. The Cardiomyocyte RNA-Binding Proteome: Links to Intermediary Metabolism and Heart Disease. Cell Rep. 2016;16:1456–1469. doi: 10.1016/j.celrep.2016.06.084. [DOI] [PMC free article] [PubMed] [Google Scholar]
- 69.Shannon P., Markiel A., Ozier O., Baliga N.S., Wang J.T., Ramage D., Amin N., Schwikowski B., Ideker T. Cytoscape: a software environment for integrated models of biomolecular interaction networks. Genome Res. 2003;13:2498–2504. doi: 10.1101/gr.1239303. [DOI] [PMC free article] [PubMed] [Google Scholar]
- 70.Hänzelmann S., Castelo R., Guinney J. GSVA: gene set variation analysis for microarray and RNA-seq data. BMC Bioinformatics. 2013;14:7. doi: 10.1186/1471-2105-14-7. [DOI] [PMC free article] [PubMed] [Google Scholar]
- 71.Liberzon A., Subramanian A., Pinchback R., Thorvaldsdóttir H., Tamayo P., Mesirov J.P. Molecular signatures database (MSigDB) 3.0. Bioinformatics. 2011;27:1739–1740. doi: 10.1093/bioinformatics/btr260. [DOI] [PMC free article] [PubMed] [Google Scholar]
- 72.Yang W., Soares J., Greninger P., Edelman E.J., Lightfoot H., Forbes S., Bindal N., Beare D., Smith J.A., Thompson I.R. Genomics of Drug Sensitivity in Cancer (GDSC): a resource for therapeutic biomarker discovery in cancer cells. Nucleic Acids Res. 2013;41:D955–D961. doi: 10.1093/nar/gks1111. [DOI] [PMC free article] [PubMed] [Google Scholar]
- 73.Colaprico A., Silva T.C., Olsen C., Garofano L., Cava C., Garolini D., Sabedot T.S., Malta T.M., Pagnotta S.M., Castiglioni I. TCGAbiolinks: an R/Bioconductor package for integrative analysis of TCGA data. Nucleic Acids Res. 2016;44:e71. doi: 10.1093/nar/gkv1507. [DOI] [PMC free article] [PubMed] [Google Scholar]
Associated Data
This section collects any data citations, data availability statements, or supplementary materials included in this article.