

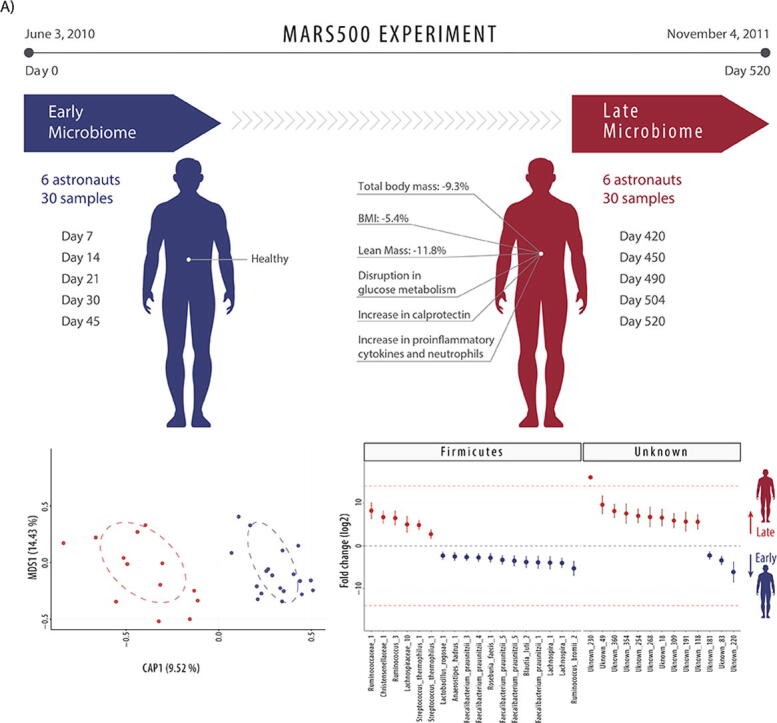
Graphical abstract
Keywords: Microbiome, Mars, Space science, Astronaut health, 16S rRNA gene
Abstract
Maintaining astronaut health throughout long-duration spaceflight is essential to the feasibility of a manned mission to Mars. The ground-based Mars500 experiment investigated long-duration health by isolating six astronauts for 520 days, the longest controlled human confinement study conducted to date. After 520 days, astronauts had uniform strength and lean body mass losses, and increased fasting plasma glucose, calprotectin, and neutrophil levels characteristic of intestinal inflammation but previous analyses revealed no common significant changes in gut microbiota. This study reanalysed data from early (days 7–45) and late (days 420–520) faecal samples and identified 408 exact sequence variants (ESVs), including 213 shared by all astronauts. Thirty-two ESVs were significantly differentially abundant over time, including depletion of keystone resistant starch degrading, anti-inflammatory and insulin sensitivity-associated species, such as Faecalibacterium prausnitzii, Ruminococcus bromii, Blautia luti, Anaerostipes hadrus, Roseburia faecis, and Lactobacillus rogosae, and enrichment of yet-to-be-cultured bacteria. Additionally, the extraordinary experimental confinement allowed observation of microbiota potentially shared between astronauts and their habitat. Forty-nine species were shared, representing 49% and 12% of the human and environmental microbiome diversity, respectively. These findings reveal the microbiota which significantly altered in relative abundance throughout confinement, including species known to influence inflammation and host glucose homeostasis consistent with astronaut symptoms. Identification of microbiome alterations after 520 days of isolation represents a missing piece connecting Mars500 astronaut physiological studies. Knowledge of the impact of long-term confinement upon the human microbiome helps to improve our understanding of how humans interact with their habitats and is a valuable step forward towards enabling long-duration spaceflight.
1. Introduction
The International Space Exploration Coordination Group, which now comprises 20 national space agencies, recently published the third edition of the Global Exploration Roadmap [1] outlining a strategy to expand human presence in the solar system and setting the surface of Mars as a collaborative target for 2030. Safeguarding astronaut health is a critical factor in meeting this ambitious target. The Canadian Space Agency currently considers the major human health risk categories associated to space flight as: musculoskeletal (reduced muscle strength, aerobic capacity and bone fragility), sensorimotor (visual impairment), metabolic (nutritional status and sickness), behavioural health and performance (stress, fatigue, cognitive deterioration and wellbeing), radiation (ultraviolet and ionising), autonomous medical care (medical access), and physiological adaptation to variable gravity and environmental stressors (including human-associated microbial communities) [2]. These challenges are magnified in long-duration space flight, such as during a two–three year mission to Mars, where no resupply of air, water, food or medical supplies is possible, radiation and microgravity exposure will be for longer than has yet been tested, and abortion of a mission due to crew illness will not be possible [3], [4].
While the human gastrointestinal track (GIT) microbiome is still being explored, it is considered essential for long-term maintenance of many aspects of human health, including healthy nutritional, immune, metabolic and psychophysiological function [5], [6], [7], [8], [9], [10]. Long-duration habitat confinement, such as that faced by astronauts during spaceflight, could interrupt the dialog between environmental microbial ecosystems and the human microbiome [4]. Previous research has established that confined habitats subject to strict cleaning procedures on Earth, such as intensive care units and surgical theatres, as well as those in space, can produce a unique surface environment dominated by human GIT microbiome [11], [12], [13], [14]. The influence of confinement upon the microbiome has been studied recently in four astronauts over 60 days by Chen et al [15] using bioregenerative life support systems (confined and self-sufficient ecosystems). Although no common microbiome composition was observed over time they did report a potential non-significant trend of depletion of Faecalibacterium prausnitzii as well as large individual differences between individuals (expected in microbiome studies with very low participant numbers). Whether confinement can influence the GIT microbiome of long-term inhabitants is an important priority for future space missions [16] and was directly addressed in the longest-running human confined habitat experiment conducted to date, the Mars500 experiment [17].
The Mars500 experiment isolated six astronauts within an analogue Mars-surface habitat. After 520 days, the six astronauts emerged as largely healthy, but the long-term confinement had significantly altered some of their physiology. Research conducted by Strollo et al. [18] measured significant decreases in total body mass (−9.3%), BMI (−5.4%) and lean (non-fat) mass (−11.8%) by day 417 of isolation. When considered alongside significant increases in fasting plasma glucose from a healthy median of 4.65 mmol/L at the beginning of the experiment to prediabetic levels of 6.02 mmol/L (impaired fasting glucose) [19], these findings are indicative of potential disruption in glucose metabolism and insulin sensitivity in astronauts after extensive confinement. This aligned with significant losses of up to 22% of quadriceps/hamstring strength in astronauts, observed by Gaffney et al. [20]. In parallel, Roda et al. [21] observed that the loss of body mass was accompanied by a significant increase in the faecal protein calprotectin, the intestinal inflammation biomarker making up 60% of neutrophils (the cells which characterise intestinal inflammation [22]); from calprotectin negative in astronauts at the beginning of the experiment, towards varying degrees of positive by day 475. Further supporting this general trend towards an onset of intestinal inflammation, Yi et al. [23] directly observed a significant increase in proinflammatory cytokines and neutrophils in the Mars500 astronauts after the 520 days of isolation, symptoms which are commonly observed in astronauts during space flight [24]. While Strollo et al. [18] hypothesised that the observed symptoms accompanied by an increase in calprotectin in later faecal samples could be indicative of common metabolic alterations associated with intestinal inflammation, they discounted any microbiome interactions due to prior research conducted by Turroni et al. [17], which did not identify significant microbiome changes over time and found only 14 OTUs (operational taxonomic units, representing putative microbiome species) were shared between the six astronauts. Here, the potential for common microbiome change in the Mars500 astronauts over time is reassessed using improved 16S rRNA gene amplicon bioinformatics technology [12] and a common data normalisation strategy for all six astronauts.
2. Materials and methods
2.1. Sample collection and microbiome sequencing
The Mars500 experiment was a ground-based human isolation study conducted over 520 days which aimed to simulate a manned mission to Mars [17], [20], [25]. The study participants were all male and their ages ranged from 29 to 40. Faecal samples used for analysis here were taken on the days 7, 14, 21, 30 and 45 (early) and days 420, 450, 490, 504, 520 of the Mars500 experiment (Supplementary file 1). Sampling, DNA extraction, amplification and sequencing approaches were not conducted in this study but are reported in [17]. Briefly, the authors report that total DNA was isolated from faeces using a modified bead-beating and column extraction with QIAamp DNA Stool miniKit. Amplification used 341F (5′-CCTACGGGNGGCWGCAG-3′) and 805R (5′-GACTACHVGGGTATCTAATCC-3′) primers targeting the V3-V4 hypervariable region and amplicons were sequenced using an Illumina MiSeq platform (2 × 300 bp paired-end). Raw sequences available in NCBI SRA BioProject PRJNA358005 or from https://genelab.nasa.gov/.
Mars500 habitat environmental samples used for analysis were taken from surfaces using swabs on the days 14, 44, 436, 467, 496 to correspond to faecal microbiome sampling and were from the utility, medical or habitat modules (Supplementary file 1). Sampling, DNA extraction, amplification and sequencing approaches were not conducted in this study but are reported in [25]. Briefly, the authors report that total DNA was isolated from surfaces using a 552C regular ethylene oxide sterilized swab moistened with PCR grade H2O. Total DNA was extracted using a FastDNA SPIN Kit. Amplification used 515f (5′-GTGYCAGCMGCCGCGGTAA-3′) and 926r (5′-CCGYCAATTYMTTTRAGTTT-3′) primers targeting the V4 hypervariable region and amplicons were sequenced using an Illumina MiSeq platform (2 × 300 bp paired-end). Raw sequences were deposited in the European Nucleotide Archive accession number: PRJEB21072.
2.2. Data processing
Amplicon sequence reads were processed and annotated using Anchor [12], [26], [27], [28]. The amplicon terminology of exact sequence variants (ESV) are used in place of operational taxonomic unit as no 97% similarity clustering is used [29], [30], [31], [32]. Sequences were aligned and dereplicated using Mothur [33] and an ESV count threshold of 18 for the astronaut faecal microbiome dataset and 30 for the Mars500 habitat dataset. Annotation at family, genera or species-level used BLASTn criteria of BLASTn criteria of >99% identity and coverage to the NCBI curated bacterial and Archaea RefSeq and NCBI nr/nt databases (January 2020 versions). All annotation calls are putative despite >99% similarity, as databases are subject to change as discoveries are made and phylogenies revised. Reporting of 100% similar sequence matches to unique species is more accurate than reporting such hits at higher taxon levels [12]; however, all annotation should be considered as putative and interpreted with care. Differentially abundant ESVs annotated from the NCBI nr/nt database were manually assessed for quality. Annotation improvement is possible as databases improve/expand using the sequences provided with each ESV in Supplementary file 1. When the highest identity/coverage is shared amongst multiple different putative annotation, all annotation is retained and reported. Amplicons with low-counts (<30 or <18) are binned to high-count sequences in a second BLASTn, using a lower threshold of >98% identity/coverage.
2.3. Statistical analysis
The normalisation strategy conducted by Turroni et al. [17] was distinct for each astronaut to allow observation of individual microbiome change in steady states [34] over time. While this described some unique elements of each astronaut, the strategy made observation of common OTUs challenging. Here, while the limited biological replication of 6n (astronauts) could not be altered, the variation introduced from single replicate stool sampling [35], [36], [37] could be reduced by pooling libraries from the first five samples and from the final five samples to improve representation of early (7–45 days) and late (420–520 days) microbiome states of the each astronaut. Samples selected to represent early and late periods of confinement were defined as the first and last set of five samples taken from all six astronauts and the libraries were pooled in silico per astronaut and period. These timepoints also represent the samples available for all six astronauts which best aligned with the Mars500 physiology studies measuring astronaut body mass [18], strength [20], faecal protein calprotectin [21] and immune responses [23]. Differential abundance analysis was performed using DESeq2 [38], [39], which performs well with 16S rRNA gene amplicon data and uneven library sizes [40]. A false discovery rate (FDR; Benjamini-Hochberg procedure) < 0.1 was applied [41]. Sparsity and count thresholds were applied whereby an ESV count in a single sample is <90% of the count in all samples and ESV counts must be >0 in at least 3 samples from the same group (early or late) [12]. Constrained ordination analysis was performed using canonical analysis of principal coordinates (CAP; Fig. 2) with the 1-dimensional constraint (early vs late) represented on the x-axis and the first axis of non-constrained ordination (multidimensional scaling) on the y-axis. This analysis was performed with the Vegan library [42] on R via the capscale function.
Fig. 2.

Early and late microbiome of Mars500 astronauts. A) Comparison of alpha diversity indices (Shannon and Inverse Simpson), B) Canonical analysis of principal coordinates (CAP; MDS = multidimensional scaling) of normalised (rlog) ESV abundance of astronaut samples, and C) Differentially abundant ESVs between the early and late samples (n = 6 astronauts). Fold change (FC log2) in relative abundance of significantly different (DESeq2 [38]) ESVs between early and late samples. +/− INF (demarcated by the dashed red line) indicates ‘infinite’ fold change, where an ESV had detectable counts in samples from only one condition. The complete ESV table including relative abundance, annotation, count distribution, blast statistics, alternative database hits, and sequences is provided in Supplementary file 1. (For interpretation of the references to colour in this figure legend, the reader is referred to the web version of this article.)
2.4. Data and code availability
ANCHOR code is available at https://github.com/gonzalezem/ANCHOR. ESV tables including relative abundance, annotation, count distribution, blast statistics, alternative database hits, and sequences are provided in Supplementary file 1.
3. Results
3.1. Mars500 astronaut gastrointestinal track microbiome community overview
A total of 408 exact sequence variants (ESVs) were assembled and captured 71.78% of the total 4,837,317 amplicons sequenced, including 213 ESVs present in all six astronauts in the early (7–45 days) and late (420–520 days) samples alone (Supplementary file 1). Amplicon lengths ranged between 439 and 466 nt. All ESVs were annotated as >99% similar sequence identity: 162 ESVs as putative species (including 14 which were ambiguous sequences to multiple species), 47 ESVs at genera-level, 34 at family-level, while 165 were poorly classified or unknown (<99% similarity to any well-characterised taxa) (Fig. 1). ESVs which could be annotated at species-level had an average identity of 99.92% (135 ESVs had 100% sequence similarity) and captured 67% of counts, those annotated at genera-level averaged 99.83% identity and captured 7% of counts, whereas those annotated at family-level averaged 99.92% identity and captured 11% of counts. ESVs identified from the phylum Firmicutes were the most prevalent, making up 64% of counts, while 7% were from Bacteroidetes, 6% from Actinobacteria, 6% from Verrucomicrobia, 2% from Proteobacteria and 15% were from unknown organisms.
Fig. 1.

Experimental design and overall microbiome composition of the Mars500 astronauts. A) Sample timepoints with long-term confinement symptoms reported in Strollo et al. [18], Gaffney et al. [20], Roda et al. [21] and Yi et al. [23]. B) Flower diagram of all 408 ESVs coloured by phyla. The size of the distal node (i.e. lowest taxonomic level for an ESV) is proportional to the total raw abundance. C) the distribution of counts across taxonomy levels, and D) the number of ESVs annotated at each taxonomy level.
The ESVs which could be confidently identified as putative species with the highest relative abundance across all astronauts in the phylum Firmicutes were all Clostridia, including Agathobacter_rectalis_1 with 10.1% of total counts, Gemmiger_formicilis_1 with 3.5%, Faecalibacterium_prausnitzii_3 with 3.3%, Fusicatenibacter_saccharivorans_1 with 2.5% and Blautia_wexlerae_1 with 2.1% (Supplementary file 1). In Verrucomicrobia, two distinct ESVs had high relative abundance, Akkermansia_muciniphilia_1 with 3.5% of total counts and Akkermansia_muciniphilia_2 with 2.3% (both having 100% similarity to distinct strain groups, ie. JCM30893 and BSH01), whereas Bacteroides_dorei_1 had the highest relative abundance in the phylum Bacteroidetes with 1.2% of total counts. The ESVs with the highest relative abundance from the phyla Proteobacteria and Actinobacteria were both ambiguous, with the amplified sequence identical between multiple species (ESVs labelled as _MS), Enterobacterales_MS_1 (sequence common to Brenneria alni, Escherichia coli, Escherichia fergusonii, Shigella flexneri or Shigella sonnei) and Bifidobacterium_MS_2 (sequence common to Bifidobacterium adolescentis, Bifidobacterium faecale or Bifidobacterium stercoris).
3.2. Significant microbiome changes identified across astronauts over time
To determine whether there were common microbiome changes over time, a simplified experimental design was used to compare the first five samples (7–45 days) and the last five samples (420–520 days) taken from all six astronauts (Fig. 2). When comparing early with late GIT microbiome samples taken from all six astronauts, alpha-diversity (Shannon and inverse Simpson) indices were not significantly different in estimated diversity between groups (t-tests p > 0.05). Canonical analysis of principal coordinates suggests samples separated by early and late groups (Fig. 2) and multivariate analysis identified significant variance between the groups (PERMANOVA, p < 0.001). To identify which ESVs were significantly altered in relative abundance over time, differential abundance analysis was performed. Thirty-one ESVs were significantly different between timepoints, including 16 significantly enriched and 15 significantly depleted in late samples compared to early samples.
3.2.1. ESVs higher in relative abundance in late astronaut samples
The 16 ESVs in significantly higher relative abundance in the astronauts after 420–520 days of confinement were all poorly characterised with the exception of Streptococcus_thermophilus_1 (Streptococcus salivarius subsp. thermophilus). Five ESVs have been putatively placed at genera or family levels (Fig. 2): Kineothrix_1, Lachnospiraceae_10, Ruminococcus_3, Ruminococcaceae_1 and Christensenellaceae_1. The remaining ten differentially abundant ESV are classified here as unknown (<99% similarity to previously identified taxa), although all have previously been observed as unknown bacteria at >99% sequence similarity.
Kineothrix_1 and Lachnospiraceae_10 were both most similar to the Kineothrix alysoides strain KNHs209, with 97.50% and 98.41% similar sequence identity, respectively. The ESV Kineothrix_1 did share 100% similarity to a genome assembled from work sequencing difficult to culture (yet-to-be-cultured) microbiome species from the human GIT (uncultured Clostridium sp. isolate 2789STDY5608883) [43]. Ruminococcus_3 is commonly observed at 100% sequence similarity (as an unknown bacteria) in human GIT microbiome studies (for example NCBI:AM275462 [44]) and has previously been classified as Ruminococcus sp. strain 95 (unpublished, but most similar to Ruminococcus bromii YE282 genome [45]) although the most similar well-characterised species was the type strain Ruminococcus bromii ATCC 27255 (97.97% similar). Ruminococcaceae_1 and Christensenellaceae_1, although also commonly observed as unknown bacteria in human faecal samples at 100% sequence similarity, were both highly dissimilar to any known bacterial species (<94% 16S rRNA sequence similarity).
The ten unknown sequences identified as significantly differentially abundant and enriched in astronauts after long-term confinement included the three ESVs, Unknown_254, Unknown_268 and Unknown_354, sharing 96–97% similarity to the known species, Anaerocolumna cellulosilytica, Monoglobus pectinilyticus and Intestinimonas butyriciproducens, respectively. The seven remaining unknown ESVs had <90% sequence similarity to any known species but have all been previously observed as unknown bacteria (at >99% sequence similarity) in GIT samples of humans as well as other animals [46], [47], [48], [49], [50], [51], [52]. Two of these ESVs, Unknown_309 (the highest in relative abundance) and Unknown_49, shared 100% sequence similarity with genomes recently assembled by Almeida et al. [53] in breakthrough research targeting yet-to-be-uncultured species in humans with de novo whole genome shotgun techniques (uncultured Clostridium sp. isolates UMGS1238 and UMGS1543) (Fig. 3). The Unknown_309 sequence has also recently been observed (100% sequence similarity) and classified by Hynönen et al. [54] as the “Ct85 cluster” of uncultured GIT bacteria in mammals (AP10s.319, LR595742.1 Ct85 type-f), alongside other ESVs present in astronauts but which did not significantly vary over time: Unknown_40 (AP07s.345 Ct85 type-d), Unknown_104 (AP07s.302 Ct85 untyped) and Unknown_38 (AP07s.190 Ct85 type-b).
Fig. 3.

Phylogenetic tree of differentially abundant ESVs and Faecalibacterium prausnitzii ESV characterisation by alignment. A) Phylogenetic tree of differentially abundant ESVs and their most similar well-characterised species (if >90% similarity) from the curated 16S rRNA gene NCBI RefSeq database. Genomes from uncultured candidate bacterial species assembled within Almeida et al. [53] were compared to unknown ESVs. Jukes–Cantor model with neighbour-joining with 10,000 replications and branch support is shown. The scale bar represents 1 substitution in 100 bp. B) Distinct Faecalibacterium prausnitzii ESVs were aligned against sequences from representative strains with genome assemblies. Phylogroup assignment derives from Benevides et al. [55] and Fitzgerald et al. [57].
3.2.2. ESVs lower in relative abundance in late astronaut samples
After 420–520 days in isolation, 15 ESVs were significantly lower in relative abundance in astronauts. These were better characterised than those enriched over time, including ten ESVs which could be annotated at species level (Fig. 2). These putative species included four distinct Faecalibacterium prausnitzii ESVs (labelled here as Faecalibacterium_prausnitzii_1, 3, 4 and 5), Ruminococcus_bromii_2, Blautia_luti_2, Anaerostipes_hadrus_1, Roseburia_faecis_1 and Lactobacillus_rogosae_1, as well as the ambiguous ESV Clostridium_MS_1, which shared 100% sequence similarity to both Clostridium disporicum and Clostridium saudiense. Additionally, two EVSs were poorly characterised at genera level, Roseburia_1 and Lachnospira_1, and three were unknown sequences, Unknown_181, Unknown_220 and Unknown_83.
Six F. prausnitzii ESVs in total were identified in astronauts, with 4/6 significantly changing in relative abundance, reducing over time in all four cases. All of the ESVs corresponded to known strain groups [55], [56], [57] with 100% similarity (Fig. 3); depleted ESVs were Faecalibacterium_prausnitzii_1 (identical to the type strain F. prausnitzii ATCC27768 in phylogroup I/subgroup-A), Faecalibacterium_prausnitzii_3 (identical to F. prausnitzii CNCM 4546; 4573; 4644; M21/2 in phylogroup I/subgroup-A), Faecalibacterium_prausnitzii_4 (identical to F. prausnitzii CNCM 4544; 4542 in phylogroup IIa/subgroup-C) and Faecalibacterium_prausnitzii_5 (identical to F. prausnitzii APC942/32 in phylogroup IIb/outgroup). The two F. prausnitzii ESVs which didn’t significantly vary between confinement time were Faecalibacterium_prausnitzii_2 (identical to F. prausnitzii CNCM 4543; 4574; A2-165 PacBio phylogroup IIb/subgroup-B) and Faecalibacterium_prausnitzii_6 (identical to F. prausnitzii CNCM 4575 phylogroup IIb/outgroup).
3.3. A direct comparison between the Mars500 astronaut and habitat microbiome communities
To assess the degree to which the astronauts’ microbiomes was associated with their habitat, the surface microbiome of the Mars500 modules, reported by Schwendner et al. [25], was directly compared after reanalysis. A total of 1494 ESVs were assembled from 135 habitat samples, capturing 88.02% of the total 23,417,169 amplicons sequenced (Fig. 4). Amplicon lengths (>0.1% of counts) ranging between 403 and 426 nt. Seven hundred and ninety ESVs could be annotated as putative species (including 341 which were ambiguous sequences to multiple species), 167 ESVs at genera-level, 21 at family-level, while 305 were poorly classified or unknown (<99% similarity to any well-characterised taxa). ESVs which could be annotated at species-level had an average identity of 99.95% (790 ESVs had 100% sequence similarity) and captured 88.39% of counts, those annotated at genera-level averaged 99.85% identity and captured 3.20% of counts, whereas those annotated at family-level averaged 99.88% identity and captured 0.40% of counts.
Fig. 4.

Overall microbiome composition of the Mars500 habitat. A) Mars500 habitat with the habitation, utility and medical modules highlighted (for further details see [25]). B) Flower diagram of all 1494 Mars500 habitat environment ESVs coloured by phyla (and Plantae). The size of the distal node (i.e. lowest taxonomic level for an ESV) is proportional to the total raw abundance. C) The distribution of counts across taxonomy levels, and D) the number of ESVs annotated at each taxonomy level.
The V3-V4 16S rRNA gene primer pair used to assess the astronaut GIT microbiome, 341F and 805R, was distinct to the V4 16S rRNA gene primer pair used to assess the Mars500 habitat microbiome, 515F and 926R [17], [25]. To directly compare the astronaut and habitat microbiome datasets, ESVs annotated at species level from each experiment were aligned directly. Alignment of each library revealed 79/162 astronaut ESVs had an identical overlapping V4 hypervariable sequence region (252–253 nts) with one or more of 98/790 habitat ESVs (12.4% of total species), 42 of which were single astronaut-habitat ESV pairs unique to a single species. When gene sequences from genome assemblies were used as scaffolds for astronaut-habitat (gut-environment) ESV pairs, a total of 49 Scaffolded Amplicons (ScAmps) aligned as 100% identical to reference genomes (Fig. 5). Astronaut-habitat ScAmps allowed for improved resolution of distinct 16S rRNA gene sequences and taxonomic annotation. Examples where two distinct taxa could be distinguished using ScAmps but could not from a single primer pair included distinct Anaerostipes hadrus, Bacteroides uniformis, Bacteroides caccae and Eggerthella lenta strain groups. The increased length and hypervariable region coverage of ScAmps, between 557 and 590 nt, resolved ESV annotation ambiguity in 8 cases, identifying two distinct Veillonella parvula strain groups (NCTC11810 and UTDB1-3) in the astronaut microbiome, Bifidobacterium longum subsp. longum, Bacteroides thetaiotaomicron, Streptococcus thermophilus and Lactococcus lactis in the habitat microbiome, and Bifidobacterium pseudocatenulatum and Bifidobacterium adolescentis in both.
Fig. 5.


Astronaut gut-habitat environment connection using sequences from reference genomes. A) Illustration of scaffolded amplicons (ScAmps) construction from paired ESVs and sequences from reference genomes, B) ScAmps shared between Mars500 astronauts and their habitat; gut and environment ESVs aligned as 100% identical to reference genomes.
4. Discussion
4.1. Mars500 astronaut gastrointestinal track microbiome community overview
Recent metagenomic studies indicate that the majority of gastrointestinal track (GIT) microbiome members are still unknown or uncharacterised species [53]. It is therefore not surprising that over half of the ESVs identified across the astronauts were uncharacterised (Fig. 1). This complexity is further complicated as substantial proportions of the human microbiome are often highly unique to individuals. The highly distinct microbiome compositions of each individual astronaut were well described by the initial Mars500 GIT microbiome research conducted by Turroni et al. [17] and make general patterns of microbiome change challenging to observe. The original analysis did, however, report similar phyla present across astronauts, including: Firmicutes, Bacteroidetes, Actinobacteria, Verrucomicrobia (although present in all astronauts, bacteria from within this group were originally not detected in two astronauts) and Proteobacteria. Instead of using a distinct normalisation strategy for each astronaut to observe change in steady states [17], [34], here, libraries were pooled from the first five samples and the last five samples to improve representation of early (7–45 days) and late (420–520 days) microbiome states (reducing technical noise common to single replicate stool sampling [35], [36], [37]) before all astronauts were compared directly to make statistical analysis of the common change over time more straightforward.
4.2. Enriched taxa in astronauts after long-term confinement
The presence of Streptococcus thermophilus (Streptococcus salivarius subspecies thermophilus) (Fig. 2) within the Mars500 habitat is not unexpected as the species is commonly used in the dairy industry and is added to yogurts as live culture to market as bestowing health benefits upon consumption (as a probiotic). Subsequent assessment of astronaut dietary reports during the experiment revealed that the Italian company Granarolo provided lyophilised ‘Yomo’ yogurts to the Mars500 project, which do indeed contain live Streptococcus thermophilus when sold commercially [58]. Interestingly, S. thermophilus is known to be particularly resilient to the freeze-drying process [59], so would likely have been present for consumption as live culture in the habitat. The observed significant increase in relative abundance between early and late confinement times is also coherent as the Italian astronaut reported that the team only ate the lyophilised yogurt in the final 8 months of the experiment (during the simulated “return journey”, reported in a July 2014 interview with astronaut Diego Urbina for the Italian Space Agency’s Outpost 42: Space food in training for Mars). Research suggests that culturing can sometimes capture as low as <1% of a microbial community [60]; however, culture-dependent approaches could have been attempted to confirm viability here. Although bacterial viability was not established, these findings do suggest the introduction of these species to the astronauts has been successfully tracked through to their respective microbiomes.
Three ESVs enriched in astronauts after isolation were identified as unknown but shared 97% sequence similarity to well-characterised bacteria A. cellulosilytica, M. pectinilyticus and I. butyriciproducens. A. cellulosilytica and M. pectinilyticus are plant cell wall degrading bacteria with carbohydrate active enzymes (CAZy) suites allowing degradation of cellulose and hemicellulose [61], and pectin [62], respectively, alongside corresponding fermentation of xylose, arabinose and galacturonic acid. I. butyriciproducens is a butyrate producing species [63] previously identified as increasing in relative abundance alongside a decrease in other common butyrate producers (such a Faecalibacterium prausnitzii) in patients with chronic pain [26]. While changes in bacteria similar to M. pectinilyticus and A. cellulosilytica could be associated with dietary modifications involving fruit or vegetables, alterations to the butyrate producing community could have important implications for GIT homeostasis when considered in the context of increased muscle loss and intestinal inflammation markers over astronaut confinement. Seven ESVs were dissimilar to any well-characterised species. In complex soil or rhizosphere (plant-soil interface) samples where the majority of microbial species are often yet-to-be-characterised [64], [65], difficult to culture groups of bacteria such as the TM7 (group 1) bacteria have previously been observed as differentially abundant [28]. In humans, uncharacterised species often share the most sequence similarity to the TM7 (group 3) bacteria, which are typified by recalcitrance to standard culturing techniques [66] currently thought to stem from their epibiont lifestyle (living on the surface of other microbes) [67]. However, the ubiquitous presence of unknown or poorly characterised microbes in human GIT samples is often not reported, hindering their study. The scale of uncharacterised human microbiome members was recently well-captured by Almeida et al. [53] using de novo whole genome shotgun metagenomics to assemble 1952 uncultured candidate bacterial species genomes from 11,850 human GIT microbiome samples, some of which shared 100% sequence identity with ESVs observed here (Fig. 3). While reporting unknown or poorly characterised organisms can be challenging, these ESVs are significantly associated with long-term isolation in astronauts. Although little is known as to the role that these microbes might play in health, they do also seem to be consistently present in humans and are here implicated as dynamic members of the human microbiome meriting further study as potentially having novel biological importance.
4.3. Depleted taxa in astronauts after long-term confinement
Although the microbiome species enriched after long-term confinement were largely uncharacterised organisms, the majority of the significantly depleted species were well known. F. prausnitzii is one of the best characterised inhabitants of a healthy human GIT and is a butyrate producer with well-documented anti-inflammatory properties whose reduction in relative abundance is consistently associated with intestinal inflammation [68], [69] and an increase in calprotectin [70], [71]. F. prausnitzii also almost always negatively associates with type 2 diabetes (4/5 controlled studies) [72], implicating a putative role in insulin resistance. The significant reduction in F. prausnitzii in astronauts after long-term confinement (Figs. 2 and 3) is therefore consistent with the intestinal inflammation, increased faecal calprotectin levels, moderate insulin resistance and lean body mass loss reported by Roda et al. [21], Yi et al. [23], Strollo et al. [18] and Gaffney et al. [20] in Mars500 astronauts over the 520 days of confinement. Interestingly, F. prausnitzii phylogroup II is considered to be the less sensitive marker of intestinal inflammation when depleted [57], [73]. This aligns to the pattern of depletion in only four putative strain-types observed here, as the two out of six F. prausnitzii ESVs which were not significantly depleted over time shared 100% similarity to members of phylogroup IIb [55], [56], [57]. Turroni et al. [17] reported a decreasing trend in OTUs associated to F. prausnitzii over time when first assessing the Mars500 astronaut microbiomes, but were limited in capability to statistically compare OTUs across astronauts owing to tailoring normalisation to each astronaut as well as because low taxonomic resolution would conflate the distinct patterns of relative abundance in these F. prausnitzii ESVs.
The five other putative species identified as significantly depleted in relative abundance after long-term confinement, Ruminococcus bromii, Blautia luti, Anaerostipes hadrus, Roseburia faecis, and Lactobacillus rogosae (Fig. 2), were each consistent with this association with intestinal inflammation and disruption of glucose metabolism. The Ruminococcus bromii ESV was only 99.10% similar to the type strain, Ruminococcus bromii strain ATCC 27255, but was 100% similar to the strain L2-36 (NCBI:GCA_002834165.1) (Fig. 3) which is considered a ‘keystone’ degrader of resistant starch in the human GIT [74], [75]. Robinson et al. [76], [77] first reported a direct relationship between dietary resistant starch and insulin sensitivity improvement but could not explain the association through investigation of host metabolism alone. Although a study in germ-free mice has suggested the impact of resistant starch on insulin resistance could be independent of intestinal bacteria [78], members of the GIT microbiome have largely been considered to underlie the relationship [79], [80], [81]. R. bromii has been more directly associated to insulin resistance through increased relative abundance, alongside F. prausnitzii, in patients with metabolic syndrome after faecal matter transplant from healthy donors which improved insulin sensitivity [82]. Similarly, Benitez-paez et al. [83] recently reported decreases in the relative abundance of B. luti (reclassified from Ruminococcus luti) associated with insulin resistance of obese children, alongside significant increases in proinflammatory cytokines similar to those observed by Yi et al. [23] in Mars500 astronauts after 520 days isolation. Benitez-paez et al. [83] also demonstrated B. luti had anti-inflammatory activity using in vitro cell cultures and speculated that a reduction of B. luti within the GIT may contribute to insulin resistance through increase intestinal inflammation. Both A. hadrus and R. faecis are butyrate producers with the former associated to insulin metabolism, significantly increasing in relative abundance (3-fold) in patients responding to FMT treatment with improved insulin sensitivity and decreased proinflammatory markers [84], and the latter whose reduction has been associated to increased inflammation alongside F. prausnitzii [85]. The L. rogosae ESV shares 100% sequence identity to the type-strain L. rogosae strain ATCC 27753. Although less well-studied and potentially misplaced taxonomically [86], L. rogosae was found to be significantly reduced in relative abundance in patients with systemic inflammatory response syndrome (alongside R. faecis and Faecalibacteria sp.) [87] and in MRSA positive patients with increased serum inflammatory markers (alongside F. prausnitzii) [88] when compared to healthy controls in both cases.
Despite the highly unique nature of each astronaut’s microbiome, these findings indicate common changes in specific microbiome species over the 520 days of isolation which are consistent with the reported common significant increases in proinflammatory markers and losses in strength and lean body mass. While the potential involvement of these observed microbiome species is discussed (alongside appropriate evidence), no causal relationship between their relative abundance and astronaut health is established in this work.
4.4. Commonalities between the Mars500 astronaut and habitat microbiome communities
Enrichment of in-built environments with human-associated bacteria is thought to occur rapidly [89] and surface microbiome research conducted in hospital environments (intensive care units and operating theatres), clean rooms and the international space station (ISS) revealed that the selective pressure of confinement and cleaning procedures can promote acquisition of broad resistance mechanisms in a microbial community adapted to human habitation [11], [90]. Other studies into the environmental microbiome of MIR [91] and the ISS [14], [92], [93], [94] have also revealed enrichment of human-associated microbes, in particular within compartments with the highest human inhabitancy (such as the crew quarters [12]). This phenomenon was also reported in the Mars500 confinement experiment, where the environmental microbiome was explored in samples taken from the habitation, utility and medical modules throughout the course of the 520-day experiment. Schwendner et al. [25] reported that the only bacteria detected in all three Mars500 modules were some of the most common human microbiome species: Staphylococcus aureus, Staphylococcus epidermidis, Staphylococcus haemolyticus and Staphylococcus hominis. The potential for opportunistic pathogen selection is of particular concern for long-duration space travel where astronaut health is at risk and medical facilities are limited.
Comparisons of 16S rRNA gene OTUs (97% clustered) have previously been performed comparing faecal matter and local water samples to investigate environmental contamination in Kenya [95] using SourceTracker [96]. Improved 16S rRNA gene bioinformatics approaches (ANCHOR [12], UPARSE [97], DADA2 [98] or QIIME2 [99]) are able to discern amplicon sequences with more confidence in complex metagenomic samples (Fig. 4), allowing for sequences to be compared directly between experiments (Fig. 5). Different primer pairs can have variable 16s rRNA gene amplification rates for different bacteria, potentially confounding direct quantitative integration of amplicon counts across two primer pairs; however, the Mars500 experiment, specifically the high quality datasets shared by Turroni et al. [17] and Schwendner et al. [25], provided a one-off opportunity for qualitative comparison of the microbiota commonality between a closed system environment and the gut of its entire inhabiting population over 520 days as both of these primer pairs have over 95% coverage of known bacterial species [100]. Direct sequence comparison indicated that 49% and 12% of species were shared between the Mars500 astronaut GIT and environmental habitat microbiomes, respectively, suggesting extensive interactions between the communities.
5. Conclusions
Significant changes in the relative abundance of astronaut microbiome species occurred over the 520 days of isolation. Some enrichment of known bacteria corresponded to changes in the crew’s diet, although significant enrichment of unknown species highlights the ongoing challenge faced in understanding how complex microbiome interactions influence human health. Depletion of major anti-inflammatory gastrointestinal tract bacteria over time is consistent with symptoms associated with the intestinal inflammation and insulin resistance measured during the Mars500 experiment and sometimes observed in astronauts during long-duration space flight. Sequence comparison of the astronauts’ faecal microbiome to the Mars500 environmental microbiome revealed direct large-scale associations between the gut and environmental microbiomes, an observation made possible due to the extreme experimental confinement. Identification of significant species-level microbiome alterations which align with astronaut symptoms connects the Russian, European, Chinese and now Canadian Space Agency Mars500 studies. This initial evidence of a potentially deleterious impact of long-term confinement upon microbiome health is an important step forward in the current drive to enable long-duration spaceflight.
Funding
The project was funded by the Canadian Space Agency, Health and Life Sciences Data and Samples Mining award as well as an NSERC Discovery Grant (FEP RGPIN-2017-05452).
Author contributions
NJBB, FEP and EG all analysed and interpreted the data and wrote the manuscript.
Declaration of Competing Interest
The authors declare that they have no known competing financial interests or personal relationships that could have appeared to influence the work reported in this paper.
Acknowledgements
We would like to thank the Canadian Space Agency for funding this research through a Health and Life Sciences Data and Samples Mining award. Funding for FEP was also provided by an NSERC Discovery Grant (FEP RGPIN-2017-05452). Thanks are extended to Silvia Turroni, Simone Rampelli, Elena Biagi, Clarissa Consolandi, Marco Severgnini, Clelia Peano, Sara Quercia, Matteo Soverini, Franck G. Carbonero, Giovanna Bianconi, Petra Rettberg, Francesco Canganella, Patrizia Brigidi and Marco Candela as well as Petra Schwendner, Alexander Mahnert, Kaisa Koskinen, Christine Moissl-Eichinger, Simon Barczyk, Reinhard Wirth, Gabriele Berg and Petra Rettberg for making the data from their research freely available and navigable for other researchers to explore. We hope to have constructively and respectfully built upon their strong research. Special thanks are also given to the incredible Mars500 astronauts: Diego Urbina, Alexander Smoleevskij, Yue Wang, Sukhrob Kamolov, Romain Charles and Alexey Sitev.
Footnotes
Supplementary data to this article can be found online at https://doi.org/10.1016/j.csbj.2021.03.040.
Contributor Information
N.J.B. Brereton, Email: Nicholas.brereton@umonteal.ca.
F.E. Pitre, Email: Frederic.pitre@umotreal.ca.
E. Gonzalez, Email: Emmanuel.gonzalez@mcgill.ca.
Appendix A. Supplementary data
The following are the Supplementary data to this article:
References
- 1.ISECG. The Global Exploration Roadmap. In: Group TISEC, editor.: National Aeronautics and Space Administration Headquarters, Washington, DC 20546-0001; 2018.
- 2.Agency CS. Evaluation of Human Space Missions and International Space Station Utilization. In: Directorate AE, editor. 2019.
- 3.Thirsk R, Hart D, Mihailidis A, E. Adams, Christopher A, Joanette Y, et al. Canadian Healthcare in Deep Space. In: Agency CS, editor.: Minister of Innovation, Science and Economic Development; 2019.
- 4.Nadia H. Agha, Satish K. Mehta, Bridgette V. Rooney, Mitzi S. Laughlin, Melissa M. Markofski, Duane L. Pierson, et al. Stress Challenges and Immunity in Space. Choukèr A, editor: Springer International Publishing 2020.
- 5.Perry R.J., Peng L., Barry N.A., Cline G.W., Zhang D., Cardone R.L. Acetate mediates a microbiome–brain–β-cell axis to promote metabolic syndrome. Nature. 2016;534(7606):213. doi: 10.1038/nature18309. [DOI] [PMC free article] [PubMed] [Google Scholar]
- 6.Sarkar A., Harty S., Lehto S.M., Moeller A.H., Dinan T.G., Dunbar R.I. The microbiome in psychology and cognitive neuroscience. Trends Cognitive Sci. 2018;22(7):611–636. doi: 10.1016/j.tics.2018.04.006. [DOI] [PubMed] [Google Scholar]
- 7.Erny D., de Angelis A.L.H., Jaitin D., Wieghofer P., Staszewski O., David E. Host microbiota constantly control maturation and function of microglia in the CNS. Nat Neurosci. 2015;18(7):965. doi: 10.1038/nn.4030. [DOI] [PMC free article] [PubMed] [Google Scholar]
- 8.Fung T.C., Olson C.A., Hsiao E.Y. Interactions between the microbiota, immune and nervous systems in health and disease. Nat Neurosci. 2017;20(2):145. doi: 10.1038/nn.4476. [DOI] [PMC free article] [PubMed] [Google Scholar]
- 9.Sampson T.R., Mazmanian S.K. Control of brain development, function, and behavior by the microbiome. Cell Host Microbe. 2015;17(5):565–576. doi: 10.1016/j.chom.2015.04.011. [DOI] [PMC free article] [PubMed] [Google Scholar]
- 10.Flint H.J., Scott K.P., Louis P., Duncan S.H. The role of the gut microbiota in nutrition and health. Nat Rev Gastroenterol Hepatol. 2012;9(10):577. doi: 10.1038/nrgastro.2012.156. [DOI] [PubMed] [Google Scholar]
- 11.Mora M., Mahnert A., Koskinen K., Pausan M.R., Oberauner-Wappis L., Krause R. Microorganisms in confined habitats: microbial monitoring and control of intensive care units, operating rooms, cleanrooms and the International Space Station. Front Microbiol. 2016;7:1573. doi: 10.3389/fmicb.2016.01573. [DOI] [PMC free article] [PubMed] [Google Scholar]
- 12.Gonzalez E., Pitre F., Brereton N. ANCHOR: A 16S rRNA gene amplicon pipeline for microbial analysis of multiple environmental samples. Environ Microbiol. 2019 doi: 10.1111/1462-2920.14632. [DOI] [PMC free article] [PubMed] [Google Scholar]
- 13.Singh N.K., Wood J.M., Karouia F., Venkateswaran K. Succession and persistence of microbial communities and antimicrobial resistance genes associated with International Space Station environmental surfaces. Microbiome. 2018;6(1):204. doi: 10.1186/s40168-018-0585-2. [DOI] [PMC free article] [PubMed] [Google Scholar]
- 14.Lang J.M., Coil D.A., Neches R.Y., Brown W.E., Cavalier D., Severance M. A microbial survey of the International Space Station (ISS) PeerJ. 2017;5 doi: 10.7717/peerj.4029. [DOI] [PMC free article] [PubMed] [Google Scholar]
- 15.Chen J., Wang Q., Hao Z., Li Z., Sahu S.K., Liu H. Relationship between the Gut Microbiome and Energy/Nutrient intake in a confined bioregenerative life support system. Appl Environ Microbiol. 2020;86(4) doi: 10.1128/AEM.02465-19. [DOI] [PMC free article] [PubMed] [Google Scholar]
- 16.Voorhies A.A., Lorenzi H.A. The challenge of maintaining a healthy microbiome during long-duration space missions. Front Astronomy Space Sci. 2016;3:23. [Google Scholar]
- 17.Turroni S., Rampelli S., Biagi E., Consolandi C., Severgnini M., Peano C. Temporal dynamics of the gut microbiota in people sharing a confined environment, a 520-day ground-based space simulation, MARS500. Microbiome. 2017;5(1):39. doi: 10.1186/s40168-017-0256-8. [DOI] [PMC free article] [PubMed] [Google Scholar]
- 18.Strollo F., Macchi C., Eberini I., Masini M., Botta M., Vassilieva G. Body composition and metabolic changes during a 520-day mission simulation to Mars. J Endocrinol Invest. 2018;41(11):1267–1273. doi: 10.1007/s40618-018-0861-9. [DOI] [PubMed] [Google Scholar]
- 19.Mellitus* ECotDCoD. Follow-up report on the diagnosis of diabetes mellitus. Diabetes Care. 2003;26(11):3160-7. [DOI] [PubMed]
- 20.Gaffney C.J., Fomina E., Babich D., Kitov V., Uskov K., Green D.A. The effect of long-term confinement and the efficacy of exercise countermeasures on muscle strength during a simulated mission to Mars: data from the Mars500 study. Sports Medicine-Open. 2017;3(1):1–11. doi: 10.1186/s40798-017-0107-y. [DOI] [PMC free article] [PubMed] [Google Scholar]
- 21.Roda A., Mirasoli M., Guardigli M., Simoni P., Festi D., Afonin B. Non-invasive panel tests for gastrointestinal motility monitoring within the MARS-500 Project. World Journal of Gastroenterology: WJG. 2013;19(14):2208. doi: 10.3748/wjg.v19.i14.2208. [DOI] [PMC free article] [PubMed] [Google Scholar]
- 22.Bjarnason I. The use of fecal calprotectin in inflammatory bowel disease. Gastroenterol Hepatol. 2017;13(1):53. [PMC free article] [PubMed] [Google Scholar]
- 23.Yi B., Rykova M., Jäger G., Feuerecker M., Hörl M., Matzel S. Influences of large sets of environmental exposures on immune responses in healthy adult men. Sci Rep. 2015;5:13367. doi: 10.1038/srep13367. [DOI] [PMC free article] [PubMed] [Google Scholar]
- 24.Gueguinou N., Huin-Schohn C., Bascove M., Bueb J.L., Tschirhart E., Legrand-Frossi C. Could spaceflight-associated immune system weakening preclude the expansion of human presence beyond Earth's orbit? J Leukoc Biol. 2009;86(5):1027–1038. doi: 10.1189/jlb.0309167. [DOI] [PubMed] [Google Scholar]
- 25.Schwendner P., Mahnert A., Koskinen K., Moissl-Eichinger C., Barczyk S., Wirth R. Preparing for the crewed Mars journey: microbiota dynamics in the confined Mars500 habitat during simulated Mars flight and landing. Microbiome. 2017;5(1):129. doi: 10.1186/s40168-017-0345-8. [DOI] [PMC free article] [PubMed] [Google Scholar]
- 26.Minerbi A., Gonzalez E., Brereton N.J., Anjarkouchian A., Dewar K., Fitzcharles M.-A. Altered microbiome composition in individuals with fibromyalgia. Pain. 2019 doi: 10.1097/j.pain.0000000000001640. [DOI] [PubMed] [Google Scholar]
- 27.Gonzalez E., Brereton N.J., Li C., Leyva L.L., Solomons N.W., Agellon L.B. Distinct changes occur in the human breast milk microbiome between early and established lactation in breastfeeding Guatemalan mothers. Front Microbiol. 2021;12:194. doi: 10.3389/fmicb.2021.557180. [DOI] [PMC free article] [PubMed] [Google Scholar]
- 28.Brereton N., Gonzalez E., Desjardins D., Labrecque M., Pitre F. Co-cropping with three phytoremediation crops influences rhizosphere microbiome community in contaminated soil. Sci Total Environ. 2019;135067 doi: 10.1016/j.scitotenv.2019.135067. [DOI] [PubMed] [Google Scholar]
- 29.Porter T.M., Hajibabaei M. Scaling up: A guide to high-throughput genomic approaches for biodiversity analysis. Mol Ecol. 2018;27(2):313–338. doi: 10.1111/mec.14478. [DOI] [PubMed] [Google Scholar]
- 30.Knight R., Vrbanac A., Taylor B.C., Aksenov A., Callewaert C., Debelius J. Best practices for analysing microbiomes. Nat Rev Microbiol. 2018;1 doi: 10.1038/s41579-018-0029-9. [DOI] [PubMed] [Google Scholar]
- 31.Callahan B.J., McMurdie P.J., Holmes S.P. Exact sequence variants should replace operational taxonomic units in marker-gene data analysis. ISME J. 2017;11(12):2639. doi: 10.1038/ismej.2017.119. [DOI] [PMC free article] [PubMed] [Google Scholar]
- 32.Edgar R.C. UNOISE2: improved error-correction for Illumina 16S and ITS amplicon sequencing. BioRxiv. 2016;081257 [Google Scholar]
- 33.Schloss P.D., Westcott S.L., Ryabin T., Hall J.R., Hartmann M., Hollister E.B. Introducing mothur: open-source, platform-independent, community-supported software for describing and comparing microbial communities. Appl Environ Microbiol. 2009;75(23):7537–7541. doi: 10.1128/AEM.01541-09. [DOI] [PMC free article] [PubMed] [Google Scholar]
- 34.David L.A., Materna A.C., Friedman J., Campos-Baptista M.I., Blackburn M.C., Perrotta A. Host lifestyle affects human microbiota on daily timescales. Genome Biol. 2014;15(7):R89. doi: 10.1186/gb-2014-15-7-r89. [DOI] [PMC free article] [PubMed] [Google Scholar]
- 35.Hernandez-Rodriguez J., Arandjelovic M., Lester J., de Filippo C., Weihmann A., Meyer M. The impact of endogenous content, replicates and pooling on genome capture from faecal samples. Mol Ecol Resour. 2018;18(2):319–333. doi: 10.1111/1755-0998.12728. [DOI] [PMC free article] [PubMed] [Google Scholar]
- 36.Wu G.D., Lewis J.D., Hoffmann C., Chen Y.-Y., Knight R., Bittinger K. Sampling and pyrosequencing methods for characterizing bacterial communities in the human gut using 16S sequence tags. BMC Microbiol. 2010;10(1):206. doi: 10.1186/1471-2180-10-206. [DOI] [PMC free article] [PubMed] [Google Scholar]
- 37.Ji B.W., Sheth R.U., Dixit P.D., Huang Y., Kaufman A., Wang H.H. Quantifying spatiotemporal variability and noise in absolute microbiota abundances using replicate sampling. Nat Methods. 2019;16(8):731–736. doi: 10.1038/s41592-019-0467-y. [DOI] [PMC free article] [PubMed] [Google Scholar]
- 38.Love M., Anders S., Huber W. Differential analysis of count data–the DESeq2 package. Genome Biol. 2014;15:550. doi: 10.1186/s13059-014-0550-8. [DOI] [PMC free article] [PubMed] [Google Scholar]
- 39.Thorsen J., Brejnrod A., Mortensen M., Rasmussen M.A., Stokholm J., Al-Soud W.A. Large-scale benchmarking reveals false discoveries and count transformation sensitivity in 16S rRNA gene amplicon data analysis methods used in microbiome studies. Microbiome. 2016;4(1):62. doi: 10.1186/s40168-016-0208-8. [DOI] [PMC free article] [PubMed] [Google Scholar]
- 40.Weiss S., Xu Z.Z., Peddada S., Amir A., Bittinger K., Gonzalez A. Normalization and microbial differential abundance strategies depend upon data characteristics. Microbiome. 2017;5(1):27. doi: 10.1186/s40168-017-0237-y. [DOI] [PMC free article] [PubMed] [Google Scholar]
- 41.Love M.I., Huber W., Anders S. Moderated estimation of fold change and dispersion for RNA-seq data with DESeq2. Genome Biol. 2014;15(12):550. doi: 10.1186/s13059-014-0550-8. [DOI] [PMC free article] [PubMed] [Google Scholar]
- 42.Oksanen J, Blanchet FG, Kindt R, Legendre P, Minchin PR, O’hara R, et al. Package ‘vegan’. Community ecology package, version2017.
- 43.Browne H.P., Forster S.C., Anonye B.O., Kumar N., Neville B.A., Stares M.D. Culturing of ‘unculturable’human microbiota reveals novel taxa and extensive sporulation. Nature. 2016;533(7604):543–546. doi: 10.1038/nature17645. [DOI] [PMC free article] [PubMed] [Google Scholar]
- 44.Kassinen A., Krogius-Kurikka L., Mäkivuokko H., Rinttilä T., Paulin L., Corander J. The fecal microbiota of irritable bowel syndrome patients differs significantly from that of healthy subjects. Gastroenterology. 2007;133(1):24–33. doi: 10.1053/j.gastro.2007.04.005. [DOI] [PubMed] [Google Scholar]
- 45.La Reau A.J., Meier-Kolthoff J.P., Suen G. Sequence-based analysis of the genus Ruminococcus resolves its phylogeny and reveals strong host association. Microb Genomics. 2016;2(12) doi: 10.1099/mgen.0.000099. [DOI] [PMC free article] [PubMed] [Google Scholar]
- 46.Li M., Wang B., Zhang M., Rantalainen M., Wang S., Zhou H. Symbiotic gut microbes modulate human metabolic phenotypes. Proc Natl Acad Sci. 2008;105(6):2117–2122. doi: 10.1073/pnas.0712038105. [DOI] [PMC free article] [PubMed] [Google Scholar]
- 47.Lin A., Bik E.M., Costello E.K., Dethlefsen L., Haque R., Relman D.A. Distinct distal gut microbiome diversity and composition in healthy children from Bangladesh and the United States. PLoS ONE. 2013;8(1) doi: 10.1371/journal.pone.0053838. [DOI] [PMC free article] [PubMed] [Google Scholar]
- 48.Ley R.E., Turnbaugh P.J., Klein S., Gordon J.I. Human gut microbes associated with obesity. Nature. 2006;444(7122):1022–1023. doi: 10.1038/4441022a. [DOI] [PubMed] [Google Scholar]
- 49.Ley R.E., Hamady M., Lozupone C., Turnbaugh P.J., Ramey R.R., Bircher J.S. Evolution of mammals and their gut microbes. Science. 2008;320(5883):1647–1651. doi: 10.1126/science.1155725. [DOI] [PMC free article] [PubMed] [Google Scholar]
- 50.Harrell L., Wang Y., Antonopoulos D., Young V., Lichtenstein L., Huang Y. Standard colonic lavage alters the natural state of mucosal-associated microbiota in the human colon. PLoS ONE. 2012;7(2) doi: 10.1371/journal.pone.0032545. [DOI] [PMC free article] [PubMed] [Google Scholar]
- 51.Ramadass B., Rani B.S., Srinivasan Pugazhendhi K., Ramakrishna B.S. Faecal microbiota of healthy adults in south India: comparison of a tribal & a rural population. Indian J Med Res. 2017;145(2):237. doi: 10.4103/ijmr.IJMR_639_14. [DOI] [PMC free article] [PubMed] [Google Scholar]
- 52.Walker A.W., Ince J., Duncan S.H., Webster L.M., Holtrop G., Ze X. Dominant and diet-responsive groups of bacteria within the human colonic microbiota. ISME J. 2011;5(2):220–230. doi: 10.1038/ismej.2010.118. [DOI] [PMC free article] [PubMed] [Google Scholar]
- 53.Almeida A., Mitchell A.L., Boland M., Forster S.C., Gloor G.B., Tarkowska A. A new genomic blueprint of the human gut microbiota. Nature. 2019;568(7753):499. doi: 10.1038/s41586-019-0965-1. [DOI] [PMC free article] [PubMed] [Google Scholar]
- 54.Hynönen U., Zoetendal E.G., Virtala A.-M.-K., Shetty S., Hasan S., Jakava-Viljanen M. Molecular ecology of the yet uncultured bacterial Ct85-cluster in the mammalian gut. Anaerobe. 2019;102104 doi: 10.1016/j.anaerobe.2019.102104. [DOI] [PubMed] [Google Scholar]
- 55.Benevides L., Burman S., Martin R., Robert V., Thomas M., Miquel S. New insights into the diversity of the genus Faecalibacterium. Front Microbiol. 2017;8:1790. doi: 10.3389/fmicb.2017.01790. [DOI] [PMC free article] [PubMed] [Google Scholar]
- 56.Martín R., Miquel S., Benevides L., Bridonneau C., Robert V., Hudault S. Functional characterization of novel Faecalibacterium prausnitzii strains isolated from healthy volunteers: a step forward in the use of F. prausnitzii as a next-generation probiotic. Front Microbiol. 2017;8:1226. doi: 10.3389/fmicb.2017.01226. [DOI] [PMC free article] [PubMed] [Google Scholar]
- 57.Fitzgerald C.B., Shkoporov A.N., Sutton T.D., Chaplin A.V., Velayudhan V., Ross R.P. Comparative analysis of Faecalibacterium prausnitzii genomes shows a high level of genome plasticity and warrants separation into new species-level taxa. BMC Genomics. 2018;19(1):931. doi: 10.1186/s12864-018-5313-6. [DOI] [PMC free article] [PubMed] [Google Scholar]
- 58.Vesely RC, Giani G, Maiocchi G, inventorsCompletely natural dessert cream comprising fructooligosaccharides. European Patent Office patent 98830393.9. 2008.
- 59.Santos G.d., Nogueira R.I., Rosenthal A. Powdered yoghurt produced by spray drying and freeze drying: a review. Braz J Food Technol. 2018;21 [Google Scholar]
- 60.Amann R.I., Ludwig W., Schleifer K.-H. Phylogenetic identification and in situ detection of individual microbial cells without cultivation. Microbiol Rev. 1995;59(1):143–169. doi: 10.1128/mr.59.1.143-169.1995. [DOI] [PMC free article] [PubMed] [Google Scholar]
- 61.Ueki A., Ohtaki Y., Kaku N., Ueki K. Descriptions of Anaerotaenia torta gen. nov., sp. nov. and Anaerocolumna cellulosilytica gen. nov., sp. nov. isolated from a methanogenic reactor of cattle waste and reclassification of Clostridium aminovalericum, Clostridium jejuense and Clostridium xylanovorans as Anaerocolumna species. Int J Syst Evol Micr. 2016;66(8):2936–2943. doi: 10.1099/ijsem.0.001123. [DOI] [PubMed] [Google Scholar]
- 62.Kim C.C., Kelly W.J., Patchett M.L., Tannock G.W., Jordens Z., Stoklosinski H.M. Monoglobus pectinilyticus gen. nov., sp. nov., a pectinolytic bacterium isolated from human faeces. Int J Syst Evol Micr. 2017;67(12):4992–4998. doi: 10.1099/ijsem.0.002395. [DOI] [PubMed] [Google Scholar]
- 63.Bui T.P.N., Shetty S.A., Lagkouvardos I., Ritari J., Chamlagain B., Douillard F.P. Comparative genomics and physiology of the butyrate-producing bacterium Intestinimonas butyriciproducens. Environ Microbiol Rep. 2016;8(6):1024–1037. doi: 10.1111/1758-2229.12483. [DOI] [PubMed] [Google Scholar]
- 64.Kou S., Vincent G., Gonzalez E., Pitre F.E., Labrecque M., Brereton N.J. The response of a 16S ribosomal RNA gene fragment amplified community to lead, zinc, and copper pollution in a shanghai field trial. Front Microbiol. 2018;9:366. doi: 10.3389/fmicb.2018.00366. [DOI] [PMC free article] [PubMed] [Google Scholar]
- 65.Gonzalez E., Pitre F., Pagé A., Marleau J., Nissim W.G., St-Arnaud M. Trees, fungi and bacteria: tripartite metatranscriptomics of a root microbiome responding to soil contamination. Microbiome. 2018;6(1):53. doi: 10.1186/s40168-018-0432-5. [DOI] [PMC free article] [PubMed] [Google Scholar]
- 66.Hugenholtz P., Tyson G.W., Webb R.I., Wagner A.M., Blackall L.L. Investigation of candidate division TM7, a recently recognized major lineage of the domain Bacteria with no known pure-culture representatives. Appl Environ Microbiol. 2001;67(1):411–419. doi: 10.1128/AEM.67.1.411-419.2001. [DOI] [PMC free article] [PubMed] [Google Scholar]
- 67.He X., McLean J.S., Edlund A., Yooseph S., Hall A.P., Liu S.-Y. Cultivation of a human-associated TM7 phylotype reveals a reduced genome and epibiotic parasitic lifestyle. Proc Natl Acad Sci. 2015;112(1):244–249. doi: 10.1073/pnas.1419038112. [DOI] [PMC free article] [PubMed] [Google Scholar]
- 68.Quévrain E., Maubert M., Michon C., Chain F., Marquant R., Tailhades J. Identification of an anti-inflammatory protein from Faecalibacterium prausnitzii, a commensal bacterium deficient in Crohn’s disease. Gut. 2016;65(3):415–425. doi: 10.1136/gutjnl-2014-307649. [DOI] [PMC free article] [PubMed] [Google Scholar]
- 69.Lopez-Siles M., Duncan S.H., Garcia-Gil L.J., Martinez-Medina M. Faecalibacterium prausnitzii: from microbiology to diagnostics and prognostics. ISME J. 2017;11(4):841–852. doi: 10.1038/ismej.2016.176. [DOI] [PMC free article] [PubMed] [Google Scholar]
- 70.Klingberg E., Magnusson M.K., Strid H., Deminger A., Ståhl A., Sundin J. A distinct gut microbiota composition in patients with ankylosing spondylitis is associated with increased levels of fecal calprotectin. Arthritis Res Ther. 2019;21(1):248. doi: 10.1186/s13075-019-2018-4. [DOI] [PMC free article] [PubMed] [Google Scholar]
- 71.Kowalska-Duplaga K., Gosiewski T., Kapusta P., Sroka-Oleksiak A., Wędrychowicz A., Pieczarkowski S. Differences in the intestinal microbiome of healthy children and patients with newly diagnosed Crohn’s disease. Sci Rep. 2019;9(1):1–11. doi: 10.1038/s41598-019-55290-9. [DOI] [PMC free article] [PubMed] [Google Scholar]
- 72.Gurung M., Li Z., You H., Rodrigues R., Jump D.B., Morgun A. Role of gut microbiota in type 2 diabetes pathophysiology. EBioMedicine. 2020;51 doi: 10.1016/j.ebiom.2019.11.051. [DOI] [PMC free article] [PubMed] [Google Scholar]
- 73.Lopez-Siles M., Martinez-Medina M., Surís-Valls R., Aldeguer X., Sabat-Mir M., Duncan S.H. Changes in the abundance of Faecalibacterium prausnitzii phylogroups I and II in the intestinal mucosa of inflammatory bowel disease and patients with colorectal cancer. Inflamm Bowel Dis. 2016;22(1):28–41. doi: 10.1097/MIB.0000000000000590. [DOI] [PubMed] [Google Scholar]
- 74.Mukhopadhya I., Moraïs S., Laverde-Gomez J., Sheridan P.O., Walker A.W., Kelly W. Sporulation capability and amylosome conservation among diverse human colonic and rumen isolates of the keystone starch-degrader Ruminococcus bromii. Environ Microbiol. 2018;20(1):324–336. doi: 10.1111/1462-2920.14000. [DOI] [PMC free article] [PubMed] [Google Scholar]
- 75.Ze X., Duncan S.H., Louis P., Flint H.J. Ruminococcus bromii is a keystone species for the degradation of resistant starch in the human colon. ISME J. 2012;6(8):1535–1543. doi: 10.1038/ismej.2012.4. [DOI] [PMC free article] [PubMed] [Google Scholar]
- 76.Robertson M.D., Bickerton A.S., Dennis A.L., Vidal H., Frayn K.N. Insulin-sensitizing effects of dietary resistant starch and effects on skeletal muscle and adipose tissue metabolism. Am J Clin Nutr. 2005;82(3):559–567. doi: 10.1093/ajcn.82.3.559. [DOI] [PubMed] [Google Scholar]
- 77.Robertson M.D., Currie J., Morgan L., Jewell D., Frayn K. Prior short-term consumption of resistant starch enhances postprandial insulin sensitivity in healthy subjects. Diabetologia. 2003;46(5):659–665. doi: 10.1007/s00125-003-1081-0. [DOI] [PubMed] [Google Scholar]
- 78.Bindels L.B., Munoz R.R.S., Gomes-Neto J.C., Mutemberezi V., Martínez I., Salazar N. Resistant starch can improve insulin sensitivity independently of the gut microbiota. Microbiome. 2017;5(1):12. doi: 10.1186/s40168-017-0230-5. [DOI] [PMC free article] [PubMed] [Google Scholar]
- 79.Keenan M.J., Zhou J., Hegsted M., Pelkman C., Durham H.A., Coulon D.B. Role of resistant starch in improving gut health, adiposity, and insulin resistance. Adv Nutr. 2015;6(2):198–205. doi: 10.3945/an.114.007419. [DOI] [PMC free article] [PubMed] [Google Scholar]
- 80.Birt D.F., Boylston T., Hendrich S., Jane J.-L., Hollis J., Li L. Resistant starch: promise for improving human health. Adv Nutr. 2013;4(6):587–601. doi: 10.3945/an.113.004325. [DOI] [PMC free article] [PubMed] [Google Scholar]
- 81.Yang X., Darko K.O., Huang Y., He C., Yang H., He S. Resistant starch regulates gut microbiota: structure, biochemistry and cell signalling. Cell Physiol Biochem. 2017;42(1):306–318. doi: 10.1159/000477386. [DOI] [PubMed] [Google Scholar]
- 82.Vrieze A., Van Nood E., Holleman F., Salojärvi J., Kootte R.S., Bartelsman J.F. Transfer of intestinal microbiota from lean donors increases insulin sensitivity in individuals with metabolic syndrome. Gastroenterology. 2012;143(4):913–936. doi: 10.1053/j.gastro.2012.06.031. [DOI] [PubMed] [Google Scholar]
- 83.Benítez-Páez A., del Pugar E.M.G., López-Almela I., Moya-Pérez Á., Codoñer-Franch P., Sanz Y. Depletion of Blautia species in the microbiota of obese children relates to intestinal inflammation and metabolic phenotype worsening. mSystems. 2020;5(2) doi: 10.1128/mSystems.00857-19. [DOI] [PMC free article] [PubMed] [Google Scholar]
- 84.de Groot P., Scheithauer T., Bakker G.J., Prodan A., Levin E., Khan M.T. Donor metabolic characteristics drive effects of faecal microbiota transplantation on recipient insulin sensitivity, energy expenditure and intestinal transit time. Gut. 2020;69(3):502–512. doi: 10.1136/gutjnl-2019-318320. [DOI] [PMC free article] [PubMed] [Google Scholar]
- 85.Bodogai M., O’Connell J., Kim K., Kim Y., Moritoh K., Chen C. Commensal bacteria contribute to insulin resistance in aging by activating innate B1a cells. Sci Transl Med. 2018;10(467) doi: 10.1126/scitranslmed.aat4271. [DOI] [PMC free article] [PubMed] [Google Scholar]
- 86.Tindall B. The status of the name Lactobacillus rogosae Holdeman and Moore 1974. Opinion 88. Judicial Commission of the International Committee on Systematics of Prokaryotes. Int J Syst Evol Micr. 2014;64(10):3578-9. [DOI] [PubMed]
- 87.Stadlbauer V., Horvath A., Komarova I., Schmerboeck B., Feldbacher N., Klymiuk I. Dysbiosis in early sepsis can be modulated by a multispecies probiotic: a randomised controlled pilot trial. Beneficial Microbes. 2019;10(3):265–278. doi: 10.3920/BM2018.0067. [DOI] [PubMed] [Google Scholar]
- 88.Zhao J., Nian L., Kwok L., Sun T. Reduction in fecal microbiota diversity and short-chain fatty acid producers in methicillin-resistant Staphylococcus aureus infected individuals as revealed by PacBio single molecule, real-time sequencing technology. Eur J Clin Microbiol Infect Dis. 2017;36(8):1463–1472. doi: 10.1007/s10096-017-2955-2. [DOI] [PubMed] [Google Scholar]
- 89.Lax S., Smith D.P., Hampton-Marcell J., Owens S.M., Handley K.M., Scott N.M. Longitudinal analysis of microbial interaction between humans and the indoor environment. Science. 2014;345(6200):1048–1052. doi: 10.1126/science.1254529. [DOI] [PMC free article] [PubMed] [Google Scholar]
- 90.Lax S., Sangwan N., Smith D., Larsen P., Handley K.M., Richardson M. Bacterial colonization and succession in a newly opened hospital. Sci Transl Med. 2017;9(391) doi: 10.1126/scitranslmed.aah6500. [DOI] [PMC free article] [PubMed] [Google Scholar]
- 91.Kawamura Y., Li Y., Liu H., Huang X., Li Z., Ezaki T. Bacterial population in Russian space station “Mir”. Microbiol Immunol. 2001;45(12):819–828. doi: 10.1111/j.1348-0421.2001.tb01321.x. [DOI] [PubMed] [Google Scholar]
- 92.Ichijo T, Yamaguchi N, Tanigaki F, Shirakawa M, Nasu M. Four-year bacterial monitoring in the International Space Station—Japanese Experiment Module “Kibo” with culture-independent approach. npj Microgravity. 2016;2:16007. [DOI] [PMC free article] [PubMed]
- 93.Venkateswaran K., Vaishampayan P., Cisneros J., Pierson D.L., Rogers S.O., Perry J. International Space Station environmental microbiome—microbial inventories of ISS filter debris. Appl Microbiol Biotechnol. 2014;98(14):6453–6466. doi: 10.1007/s00253-014-5650-6. [DOI] [PubMed] [Google Scholar]
- 94.Sielaff A.C., Urbaniak C., Mohan G.B.M., Stepanov V.G., Tran Q., Wood J.M. Characterization of the total and viable bacterial and fungal communities associated with the International Space Station surfaces. Microbiome. 2019;7(1):1–21. doi: 10.1186/s40168-019-0666-x. [DOI] [PMC free article] [PubMed] [Google Scholar]
- 95.Bauza V., Madadi V., Ocharo R.M., Nguyen T.H., Guest J.S. Microbial source tracking using 16S rRNA amplicon sequencing identifies evidence of widespread contamination from young children’s feces in an urban slum of Nairobi, Kenya. Environ Sci Technol. 2019;53(14):8271–8281. doi: 10.1021/acs.est.8b06583. [DOI] [PubMed] [Google Scholar]
- 96.Knights D., Kuczynski J., Charlson E.S., Zaneveld J., Mozer M.C., Collman R.G. Bayesian community-wide culture-independent microbial source tracking. Nat Methods. 2011;8(9):761–763. doi: 10.1038/nmeth.1650. [DOI] [PMC free article] [PubMed] [Google Scholar]
- 97.Edgar R.C. UPARSE: highly accurate OTU sequences from microbial amplicon reads. Nat Methods. 2013;10:996. doi: 10.1038/nmeth.2604. [DOI] [PubMed] [Google Scholar]
- 98.Callahan B.J., McMurdie P.J., Rosen M.J., Han A.W., Johnson A.J.A., Holmes S.P. DADA2: high-resolution sample inference from Illumina amplicon data. Nat Methods. 2016;13(7):581–583. doi: 10.1038/nmeth.3869. [DOI] [PMC free article] [PubMed] [Google Scholar]
- 99.Bolyen E., Rideout J.R., Dillon M.R., Bokulich N.A., Abnet C.C., Al-Ghalith G.A. Reproducible, interactive, scalable and extensible microbiome data science using QIIME 2. Nat Biotechnol. 2019;37(8):852–857. doi: 10.1038/s41587-019-0209-9. [DOI] [PMC free article] [PubMed] [Google Scholar]
- 100.Klindworth A., Pruesse E., Schweer T., Peplies J., Quast C., Horn M. Evaluation of general 16S ribosomal RNA gene PCR primers for classical and next-generation sequencing-based diversity studies. Nucleic Acids Res. 2013;41(1) doi: 10.1093/nar/gks808. e1-e. [DOI] [PMC free article] [PubMed] [Google Scholar]
Associated Data
This section collects any data citations, data availability statements, or supplementary materials included in this article.
Supplementary Materials
Data Availability Statement
ANCHOR code is available at https://github.com/gonzalezem/ANCHOR. ESV tables including relative abundance, annotation, count distribution, blast statistics, alternative database hits, and sequences are provided in Supplementary file 1.