

Abstract
Down syndrome is the phenotypic consequence of trisomy 21, with clinical presentation including both neurodevelopmental and neurodegenerative components. Although the intellectual disability typically displayed by individuals with Down syndrome is generally global, it also involves disproportionate deficits in hippocampally-mediated cognitive processes. Hippocampal dysfunction may also relate to Alzheimer’s disease-type pathology, which can appear in as early as the first decade of life and becomes universal by age 40. Using 7-tesla MRI of the brain, we present an assessment of the structure and function of the hippocampus in 34 individuals with Down syndrome (mean age 24.5 years ± 6.5) and 27 age- and sex-matched typically developing healthy controls. In addition to increased whole-brain mean cortical thickness and lateral ventricle volumes (P < 1.0 × 10⁻⁴), individuals with Down syndrome showed selective volume reductions in bilateral hippocampal subfields cornu Ammonis field 1, dentate gyrus, and tail (P < 0.005). In the group with Down syndrome, bilateral hippocampi showed widespread reductions in the strength of functional connectivity, predominately to frontal regions (P < 0.02). Age was not related to hippocampal volumes or functional connectivity measures in either group, but both groups showed similar relationships of age to whole-brain volume measures (P < 0.05). Finally, we performed an exploratory analysis of a subgroup of individuals with Down syndrome with both imaging and neuropsychological assessments. This analysis indicated that measures of spatial memory were related to mean cortical thickness, total grey matter volume and right hemisphere hippocampal subfield volumes (P < 0.02). This work provides a first demonstration of the usefulness of high-field MRI to detect subtle differences in structure and function of the hippocampus in individuals with Down syndrome, and suggests the potential for development of MRI-derived measures as surrogate markers of drug efficacy in pharmacological studies designed to investigate enhancement of cognitive function.
Keywords: Down syndrome, functional connectivity, hippocampus, MRI, spatial memory
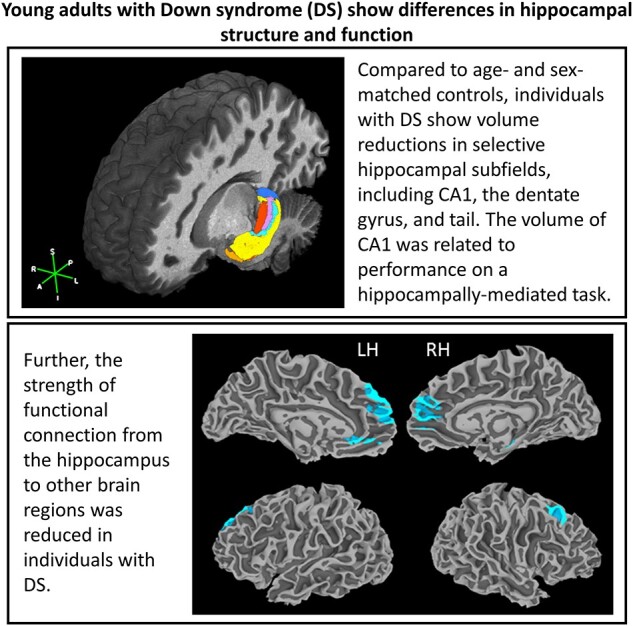
Individuals with Down syndrome show distinct deficits in cognitive processes that are mediated by the hippocampus. Using high-resolution MRI, Koenig et al. find volume reductions of select hippocampal subfields and widespread changes in synchronicity of the hippocampus in individuals with Down syndrome.
Graphical Abstract
Graphical Abstract.
Introduction
Down syndrome (DS) is the most prevalent of the genetic disorders that give rise to cognitive impairment, with 95% of cases caused by trisomy of chromosome 21 (T21). Individuals with DS show well-described physical characteristics and are at an increased risk for a long list of comorbidities, such as thyroid dysfunction, congenital heart disease and Alzheimer’s disease-like dementia.1–3 Cognitive function is variable in those with DS, but moderate intellectual disability is common.4 Although DS-associated cognitive impairment is generally global in nature, disproportionate deficits in expressive language,5,6 verbal short-term memory7 and hippocampally-mediated long-term memory8,9 have been described. Neuroanatomical characteristics of DS include decreased brain volume, delayed myelination, decreased dendritic arborization and regional reductions in the size of the cerebellum, prefrontal cortex and hippocampus.10–14
The hippocampal formation is an intricate, elongated structure that runs along the anterior–posterior axis of the medial temporal lobe. It is composed of architectonically distinct subregions that correspond to the flow of hippocampal input and output. It is involved in multiple cognitive functions including episodic memory15 and spatial processing.16 In addition to reductions in overall hippocampal size,11,12 histological studies provide evidence that, in DS, different hippocampal subfields may be differently impacted. Compared to controls, brains of foetuses with T21 show increased phagocytic activity in cornu Ammonis field 1 (CA1) and subiculum (SUB),17 and decreased thickness, reduced percentage of neurons, and reduced cell density in the SUB.18 An analysis of the hippocampal formation (including CA1 and the SUB) and the dentate gyrus (DG) in foetal brains with T21 showed lower volume and cell number in both regions compared to controls, but similar cell density.19 In addition, the DG shows reduced cell proliferation20 and decreased density of myelinated axons in the hilar region.21
Hippocampal atrophy is a common finding in non-DS Alzheimer’s disease, and dementia-related hippocampal atrophy has also been reported in DS.22,23 In non-DS Alzheimer’s disease and mild cognitive impairment (MCI), hippocampal subfields CA1 and the SUB tend to show the first signs of neuropathology, including neuronal loss and the development of neurofibrillary tangles.24 In cognitively preserved elderly without DS, CA1 and the SUB showed volume loss in those who later converted to MCI,25 and a sample of cognitively preserved elderly with amyloid-β pathology showed smaller volumes of the SUB, presubiculum, and hippocampal tail.26 These findings suggest that early development of Alzheimer’s disease neuropathology leads to preferential volume loss in specific hippocampal subfields, and also suggest another potential mechanism for hippocampal dysfunction in DS. Increased levels of amyloid precursor protein have been reported in foetal T21 hippocampi,27 with amyloid plaques found in the CA1 region even in the first decade of life.28 Widespread distribution of amyloid plaques in the hippocampus has been shown to occur after age 30, with the development of hippocampal neurofibrillary tangles after age 40.29
In addition to structural changes, multiple studies report altered function of the hippocampal formation in non-DS Alzheimer’s disease and MCI.30–32 The hippocampus has strong structural and functional connections to the posterior cingulate cortex (PCC), which are reported to decrease in strength in Alzheimer’s disease and MCI.30,33,34 The PCC is a key component of the default mode network (DMN), itself widely reported to be disrupted in clinical and preclinical Alzheimer’s disease.35,36 Although we found no reports describing hippocampal functional connectivity in individuals with DS, a decrease in global connectivity of the PCC was reported.37 Recent work in the Ts65Dn mouse model of DS found that young mice showed increased synchronization between the hippocampus and prefrontal regions at rest, and disruptions in hippocampal–prefrontal interaction during memory acquisition and retrieval and object familiarization.38
In this work, we use high resolution MRI to measure hippocampal subfield volumes and functional connectivity in teenagers and young adults with DS and in a sample of age-matched typical controls. We hypothesize that, compared to controls, individuals with DS will show reductions in the size of CA1, the SUB and the DG. We also investigate functional connectivity of the hippocampus, hypothesizing reduced strength of connection to the PCC in those with DS.
Materials and methods
Participants
Participants included 37 teenagers and non-demented adults with DS, determined by a medical diagnosis of T21 [mean age (years) 24.0 ± 6.6, range 15–35; 23 males] and 27 age-matched healthy controls (mean age 24.9 ± 6.1, range 15–36; 17 males). Prior to data collection, participants were consented in accordance with the Declaration of Helsinki. Data included in this analysis were collected under three Cleveland Clinic Institutional Review Board-approved protocols (141523; 16390; 13058). Detailed information regarding the composition of participants from each protocol can be found in the Supplementary materials. The three protocols ran concurrently, and all participants were scanned on the same MRI scanner using identical sequences. For all three protocols, MRI data collection occurred in a single scanning session.
Prior to enrolment, all participants (and their caregivers, if applicable) were interviewed to assess eligibility for study participation. Exclusion criteria for all participants included: (i) History of major psychiatric disorder such as schizophrenia, bipolar disorder, autism, Alzheimer’s disease or major depressive disorder; (ii) History of neurologic diagnosis such as traumatic brain injury, stroke or a diagnosis of seizure disorder in the past three years; (iii) Cognitive or physical limitations that resulted in the inability to complete study procedures; (iv) Confirmed clinical symptoms of dementia; and (v) MRI-specific exclusion criteria.
Behavioural testing
All participants with DS met with a psychiatrist specializing in developmental disabilities for clinical assessment, which included medical history, a psychiatric diagnostic interview with the participant and caregiver, and mental status examination. Particular attention was paid to changes that might be related to dementia. No participants were found to have symptoms of dementia.
Individuals with DS who participated under Protocol 2 underwent neuropsychological testing. The test battery used here was previously described,39 and is detailed in the Supplementary materials. These measures were used in a supplementary analysis of the relationship of cognition to anatomical volumes.
MR imaging
All participants were scanned on a Siemens 7T Magnetom scanner with SC72 gradient (Siemens Medical Solutions, Erlangen) using a head-only CP transmit and 32-channel phased-array receive coil (Nova Medical, Wilmington). Respiratory and cardiac fluctuations were measured using a plethysmograph and respiratory bellows during scanning. A whole-brain, T1-weighted MP2RAGE (0.75 mm3 isotropic voxel size) was acquired for all participants. A sub-sample of participants underwent a resting state functional connectivity scan. (132 repetitions, 81 axial slices, voxel size 0.75 × 0.75 × 1.5 mm3, TE/TR = 21 ms/2800 ms, matrix 160 × 160, FOV 210 × 210 mm2, receive bandwidth = 1562 Hz/pixel, scan time 7 min). Directly prior to the resting state scan, the scanner technician talked to the participants, making sure they were awake and asking them to keep their eyes closed for the next scan.
Volumetric analysis
To assess whole-brain volumes, mean volume of the left and right lateral ventricles, mean cortical thickness, and volumes of cerebral white matter (WM) and total and subcortical grey matter (GM) were calculated using the MP2RAGE processed using Freesurfer 6.0.40 Using the MP2RAGE, hippocampal subfield volumes were calculated using the Automated Segmentation of Hippocampal Subfields (ASHS) software41 and the ASHS 1.0 Compatible 7T atlas.42 ASHS returns intracranial volume (ICV) and volumes for the entorhinal cortex, SUB, CA1, CA2, CA3, DG and tail (Fig. 1). To account for differences in ICV, and for the sake of consistency, ASHS ICV measures were used to correct both ASHS and Freesurfer volumes. Corrected volumes were calculated as: (volume/ICV)*100.
Figure 1.
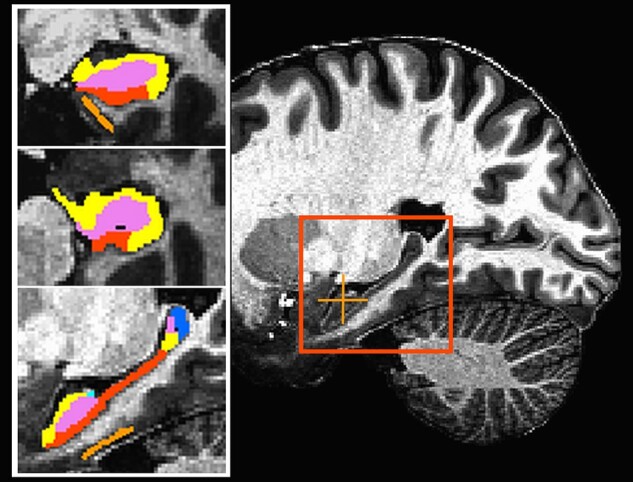
Representative slices from the image used to calculate anatomical volumes. The inset at left shows the same image with the hippocampal segmentation overlaid. The orange crosshair marks the location of the coronal (top) and axial (middle) slices. The red square outlines the enlarged sagittal slice at bottom. orange = entorhinal cortex; red = subiculum; yellow = CA1; light blue = CA2/CA3; violet = dentate gyrus; blue = tail.
Statistical analysis
Unpaired t-tests compared ICV-corrected volumes between groups, and linear correlations were used to test the relationship of age to volume in each group. The false discovery rate (FDR) was used to adjust for multiple comparisons.43
Within-group differences in hemispheric asymmetry were determined by entering left and right ICV-corrected volumes into a paired Student’s t-test. Between-group differences in hemispheric asymmetry were assessed using the asymmetry index (AI). Using uncorrected hippocampal volumes, AI was calculated for each measure as: [(left—right)/(left + right)]*100. Unpaired t-tests compared AI between groups, with FDR adjustment.
Functional connectivity
Post-processing
The first 4 volumes of the functional time series were removed. RETROICOR was used to regress out measured cardiac and respiratory signals at the voxel level.44 Concurrently, volumetric and slice-wise motion was regressed using SLOMOCO.45 The data were spatially filtered using a 2 mm filter,46 detrended, and fluctuations above 0.08 Hz were removed. The MP2RAGE was aligned to the functional volume using the AFNI program align_epi_anat.py.47 A supplementary analysis, undertaken to assess the impact of individual motion estimates on our results, is described in the Supplementary materials.
Seed selection
Although our functional data are high resolution, the undulating and sometimes thin hippocampal structure contributes to a risk of inclusion of signals measured from non-brain tissue. To mitigate this risk, we chose to undertake a seed-based functional analysis focussed on the head of the hippocampus. This region is relatively thick, and includes large portions of the subfields of interest (CA1, the SUB and the DG). Using both anatomical and functional data, right and left seed locations in the head of the hippocampus were identified in native space for each participant. First, the head of the hippocampus was identified anatomically on the MP2RAGE using a previously described method.48 Next, the Yeo 7 network functional connectivity cortical parcellation,49 available in Freesurfer, was used to define the DMN. In this parcellation, Network 7 is identified as most representative of the DMN. Bilateral regions of interest (ROIs) from Network 7, covering the PCC and precuneus regions, were combined with individual-subject cortical ROIs from Freesurfer to create a conjunction mask representing GM voxels within the PCC. The hippocampal ROIs and PCC mask were aligned to the functional volume and used to create a masked functional time series containing only the hippocampal and PCC regions. For each hemisphere, the masked functional time series was used to identify the final hippocampal seed. The time series of each voxel in the head of the hippocampus was cross-correlated to that of each voxel in the conjunction mask, to identify the hippocampal voxel with the highest correlation to GM of the PCC (Fig. 2). That hippocampal voxel was taken as the center of a 9-voxel in-plane ROI, which represented the seed used in the connectivity analysis.
Figure 2.

Hippocampal seed definition in a representative subject. (A and B) Functional connectivity from the head of the hippocampus within the specified ROI (shown in cyan). For display purposes, the correlation map is thresholded at Pearson’s correlation coefficient >0.30.(A) Functional connectivity in the head of the hippocampus, with the black crosshair noting the location of the voxel with the highest cross-correlation to the PCC. (B) Functional connectivity of the PCC ROI measured from the seed location in A. The black crosshair notes the location of the voxel with the highest cross-correlation to the hippocampus. Panel C shows the average location of the hippocampal ROIs for the control (red; n = 22) and DS (yellow; n = 22) groups. The overlap is shown in cyan. HIP, hippocampus.
Connectivity map creation
For each participant, whole-brain functional connectivity maps were created for the left and right hippocampus. The mean time series of each seed was linearly detrended and correlated with the linearly detrended time series of each voxel located within brain tissue. Each correlation was converted to a Student’s t-score and the whole-brain distribution was normalized to unit variance and zero mean in order to correct for individual variations in global signal.50 The resulting connectivity maps represent the strength of left and right hippocampi to the whole brain.
Individuals with DS are known to have specific neuroanatomical differences compared to controls, which may introduce bias to analyses in common space. For this reason, we chose to measure our final connectivity values in native space using an ROI mask rather than undertake a whole-brain voxel-wise analysis in common space. By necessity, creation of the ROI mask first required the transformation of individual connectivity maps to Talairach space, which were then averaged by group. Figure 3A–D shows each of the four group-averaged maps: left and right hippocampus in DS and controls (single voxel threshold P < 0.0005, cluster size 500). The left and right hippocampal maps showed similar connectivity patterns in each group, so the four maps in Fig. 3 were added to create a conjunction mask of regions that were significantly connected to the right or left hippocampus in either group (Fig. 3E). For each participant, the conjunction mask was transformed to individual space and the mean z-score was calculated for each ROI in the mask.
Figure 3.

Average functional connectivity of the hippocampus. Average functional connectivity z-maps for: (A) left hippocampus, controls; (B) left hippocampus, DS; (C) right hippocampus, controls; (D) right hippocampus, DS. Single voxel threshold P < 0.0005, cluster size 500 (n = 22 in each group). (E) Conjunction mask used to define ROIs for group analysis. DS, Down syndrome; HC, healthy control; HIP, hippocampus; LH, left hemisphere; RH, right hemisphere.
Statistical analysis
Unpaired t-tests were used to compare connectivity between groups. Linear correlations were used to test the relationship of age to connectivity measures in each group. In regions that showed group differences in connectivity strength, linear correlation was used to assess the relationship of functional connectivity to hippocampal volumes. The FDR was used to adjust for multiple comparisons in each of the analyses above.
Data availability
The data that support the findings of this study are available on request from the corresponding author, dependent on a formal data sharing agreement with the administering institution.
Results
Volumetric analysis
Sample
The final sample for the brain volume analysis was 34 individuals with DS [mean age (years) 24.5 ± 6.5, range 15–35; 22 males] and 27 controls (described above). There were no group differences in age (P = 0.817) or sex (P = 0.888). Due to motion during scanning, three DS participants from Protocol 2 did not have MP2RAGE scans of sufficient quality to run using the ASHS software, and were excluded from further analysis (see Supplementary material for details).
Supplementary Table 1 shows cognitive scores for participants with DS in Protocol 2. An exploratory analysis of the relationship between volumetric and cognitive measures was undertaken for the 18 individuals with both data types, detailed in Supplementary materials: cognitive data analysis and in Supplementary Tables 1 and 2.
Group differences
ICV was smaller in the DS group (P = 3.5 × 10⁻⁷), and correlations between ICV and age were not significant in either group. The remainder of the results refer to ICV-corrected volumes. The DS group had increased mean cortical thickness (P = 1.35 × 10⁻⁸) and larger mean lateral ventricle volume (P = 6.09 × 10⁻⁵; Table 1). Cerebral WM volume was decreased in the DS group (P = 0.0388), though this comparison did not survive FDR correction. There were no group differences in total or subcortical GM volumes. In both groups, age was positively related to cerebral WM volume (DS: r = 0.549, P = 0.0008; controls: r = 0.567, P = 0.0021; Fig. 4A), and negatively related to total GM volume (DS: r = −0.553, P = 0.0007; controls: r = −0.692, P = 6.4 × 10⁻⁵; Fig. 4B) and mean cortical thickness (DS: r = −0.374, P = 0.029; controls: r = −0.399, P = 0.039, Fig. 4C). Subcortical GM was related to age in controls (r = −0.519, P = 0.0056), but not in the DS group (P = 0.214). Mean lateral ventricle volume was not related to age in either group. For variables that showed a significant relationship to age, linear regression using group, age, and an age*group interaction term was used to assess group differences in the relationship between age and volume measures. No variables showed a significant age*group interaction, and results did not differ from those reported above.
Table 1.
Group-averaged anatomical volumes and results of t-tests assessing group differences in ICV-corrected volumes (DS n = 34; HC n = 27)
| Region | Mean volume (mm3) |
Mean volume, % ICV |
|||
|---|---|---|---|---|---|
| DS | HC | DS | HC | P | |
| Whole brain | |||||
| Cerebral WM | 315 131 ± 81 831 | 415 217 ± 94 079 | 26.004 | 28.960 | 0.0388 |
| Lateral ventricle | 9271 ± 3399 | 6909 ± 2768 | 0.7719 | 0.4896 | 6.09 × 10⁻⁵ |
| Total GM | 622 305 ± 123 963 | 735 875 ± 139 052 | 51.542 | 51.808 | 0.9078 |
| Subcortical GM | 40 661 ± 4919 | 46 818 ± 4625 | 3.371 | 3.289 | 0.1434 |
| Thickness (mm) | 2.64 ± 0.18 | 2.55 ± 0.12 | 2.2 × 10⁻⁴ | 1.8 × 10⁻⁴ | 1.35 × 10⁻⁸ |
| Hippocampus, Left | |||||
| ERC | 289 ± 112 | 368 ± 53 | 0.0238 | 0.0258 | 0.2068 |
| SUB | 563 ± 91 | 653 ± 75 | 0.0468 | 0.0459 | 0.5369 |
| CA1 | 1021 ± 137 | 1446 ± 153 | 0.0849 | 0.1020 | 6.6 × 10⁻⁹ |
| CAt | 1048 ± 146 | 1496 ± 163 | 0.0870 | 0.1054 | 1.9 × 10⁻⁹ |
| DG | 571 ± 99 | 810 ± 116 | 0.0473 | 0.0569 | 6.6 × 10⁻⁷ |
| Tail | 110 ± 27 | 156 ± 27 | 0.0092 | 0.0110 | 7.7 × 10⁻⁴ |
| HIP | 2292 ± 298 | 3115 ± 319 | 0.1903 | 0.2192 | 6.2 × 10⁻⁸ |
| Hippocampus, Right | |||||
| ERC | 323 ± 108 | 371 ± 61 | 0.0265 | 0.0260 | 0.7666 |
| SUB | 483 ± 70 | 555 ± 67 | 0.0401 | 0.0391 | 0.4319 |
| CA1 | 1220 ± 151 | 1614 ± 127 | 0.1014 | 0.1138 | 5.2 × 10⁻⁶ |
| CAt | 1230 ± 151 | 1636 ± 129 | 0.1022 | 0.1154 | 1.6 × 10⁻⁶ |
| DG | 616 ± 112 | 844 ± 120 | 0.0510 | 0.0593 | 3.1 × 10⁻⁵ |
| Tail | 86 ± 19 | 121 ± 26 | 0.0072 | 0.0086 | 0.0025 |
| HIP | 2415 ± 293 | 3156 ± 280 | 0.2005 | 0.2223 | 7.6 × 10⁻⁶ |
Bold values survived correction for multiple comparisons.
CA1, cornu Ammonis field 1; CAt, CA total; DG, dentate gyrus; DS, Down syndrome; ERC, entorhinal cortex; GM, grey matter; HC, healthy control; HIP, total hippocampus; WM, white matter; SUB, subiculum; Thickness, cortical thickness.
Figure 4.
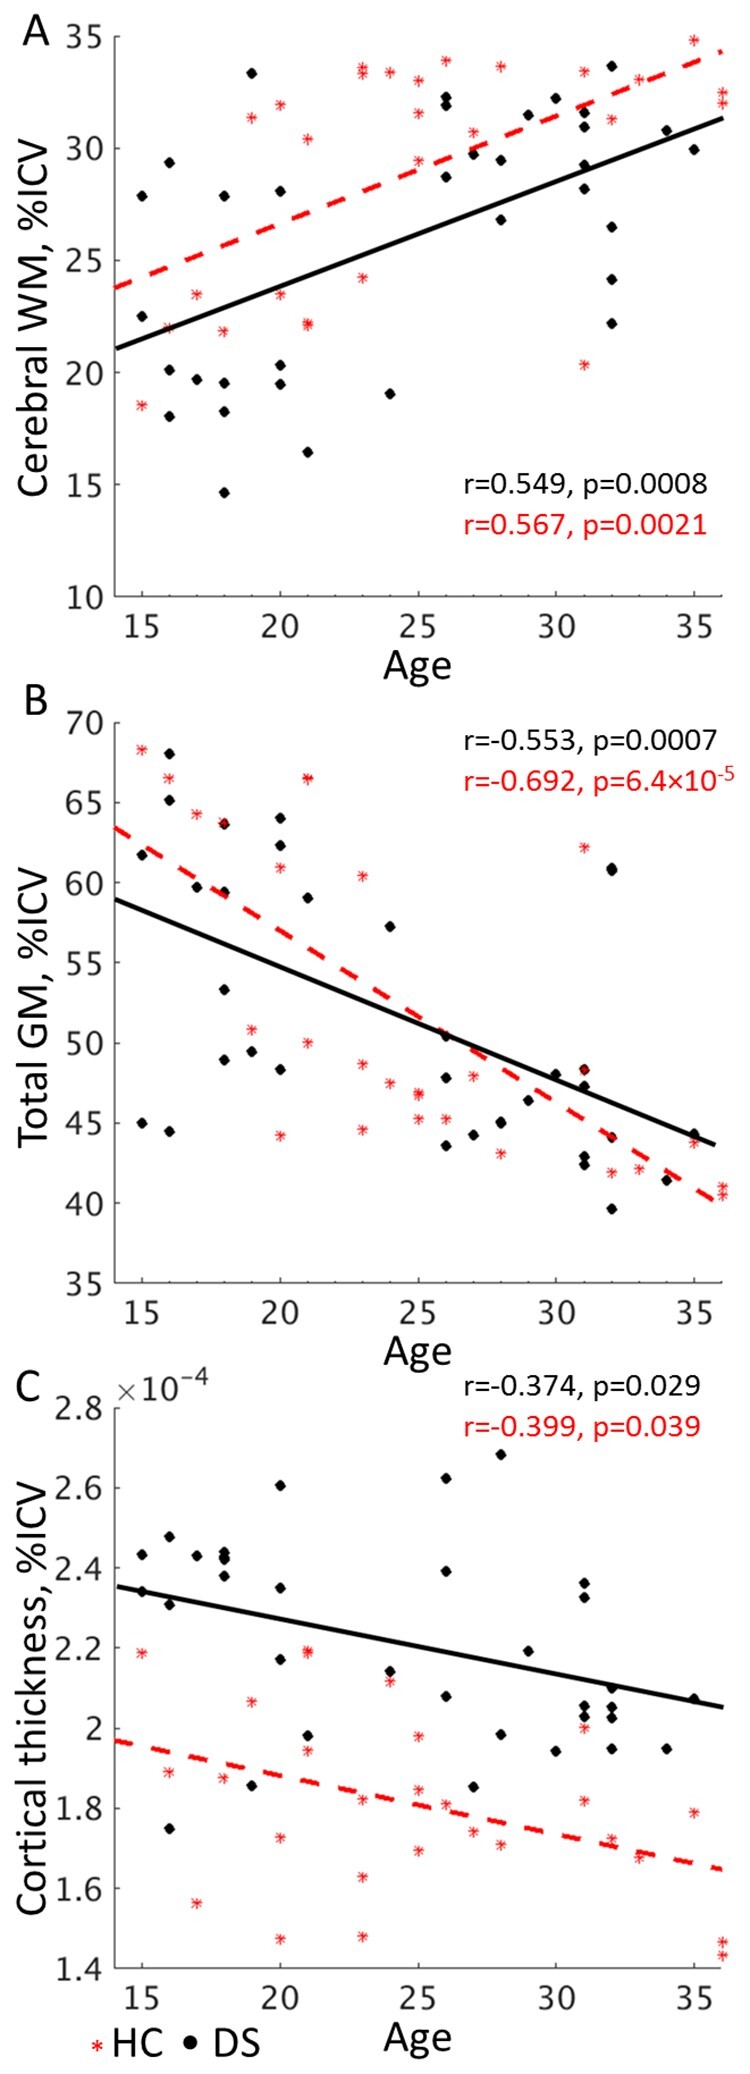
The relationship between whole brain measures and age. The relationship of (A) cerebral WM and (B) total GM volume and (C) mean cortical thickness measures to age in the control (n = 27) and DS (n = 34) groups. Although cerebral WM volume is reduced in the DS group, both groups show similar slopes, suggesting that age-related volume changes proceed similarly. DS, Down syndrome; GM, grey matter; HC, healthy control; ICV, intracranial volume; WM, white matter.
Measures of CA2 and CA3 were highly variable among participants, and were not analysed individually. Volumes used for analysis included left and right entorhinal cortex (ERC), SUB, CA1, CA total (CAt; the sum of CA1, CA2 and CA3), DG, tail, and total hippocampus (HIP; the sum of all included measures). Compared to controls, individuals with DS had disproportionately smaller bilateral CA1, CAt, DG, tail and HIP volumes (Table 1; Supplementary Fig. 1). Hippocampal volume measures were not significantly related to age in either group. In the group with DS, total GM was the only whole brain measure that was significantly related to any hippocampal measure—left and right ERC volumes (r = 0.534, P = 0.0011 and r = 0.461, P = 0.0061, respectively). These measures showed a weak relationship in controls, but did not survive FDR correction (P < 0.034). In controls, mean cortical thickness was related to left and right CA1 (r = 0.599, P = 0.0010 and r = 0.720, P = 2.3 × 10⁻⁵, respectively), CAt (r = 0.580, P = 0.0015 and r = 0.718, P = 2.5 × 10⁻⁵, respectively) and HIP (r = 0.551, P = 0.0029 and r = 0.659, P = 0.0002, respectively). Although these measures showed positive relationships in DS, they did not survive FDR correction (P < 0.124). There were no other significant relationships between hippocampal and whole-brain volumes in either group.
Hemispheric asymmetry
In both groups, SUB and tail volumes were larger on the left (P < 7.4 × 10⁻⁷), and CA1, CAt, and the DG were larger on the right (P < 0.0036, Table 2). In controls, left and right HIP and ERC volumes did not differ. In the DS group, HIP was larger on the right (P = 0.0010), as was ERC (P = 0.016), although the ERC comparison did not survive FDR. CA1 (P = 0.0095) and CAt (P = 0.0072) AI were larger in the DS group, indicating that the difference between left and right volumes was greater in DS compared to controls. ERC, SUB, DG, tail and HIP did not show group differences in AI.
Table 2.
Hemispheric asymmetry of hippocampal subfield volumes (DS n = 34; HC n = 27)
| Region |
Within-group
Left versus right volumes |
Between-group
AI |
|||||
|---|---|---|---|---|---|---|---|
| DS | HC | DS | HC | ||||
| P a | Side | P a | Side | Mean | Mean | P b | |
| ERC | 0.0158 | – | 0.7083 | – | −6.023 | −0.221 | 0.0381 |
| SUB | 7.4 × 10⁻⁷ | L | 1.2 × 10⁻⁹ | L | 7.500 | 8.136 | 0.6933 |
| CA1 | 1.3 × 10⁻¹⁰ | R | 1.6 × 10⁻¹⁰ | R | −8.875 | −5.602 | 0.0095 |
| CAt | 1.4 × 10⁻⁹ | R | 2.9 × 10⁻⁸ | R | −8.044 | −4.600 | 0.0072 |
| DG | 0.0027 | R | 0.0036 | R | −3.702 | −2.083 | 0.2791 |
| Tail | 2.8 × 10⁻⁸ | L | 1.9 × 10⁻⁸ | L | 11.944 | 12.770 | 0.7206 |
| HIP | 0.0010 | R | 0.1173 | – | −2.652 | −0.727 | 0.0395 |
AI, asymmetry index; CA1, cornu Ammonis field 1; CAt, CA total; DG, dentate gyrus; DS, Down syndrome; ERC, entorhinal cortex; HC, healthy control; HIP, total hippocampus; L, left; R, right; SUB, subiculum.
Results of within-group paired t-tests showing the difference in left and right volumes, specifying the hemisphere with larger volume.
Results of unpaired t-tests showing group differences in AI. Negative AI values indicates rightward asymmetry. Bold values survived correction for multiple comparisons.
Connectivity analysis
Sample
The final connectivity sample included 22 individuals with DS (mean age 25.5 ± 6.5, range 15–35; 13 males) and 22 controls (mean age 25.1 ± 6.8, range 15–36; 13 males). There were no differences in age (P = 0.8387) or sex (P = 1.0) distribution. Of the 34 participants with DS, seven participants had no or only partial connectivity scans, and five were excluded due to motion, detailed below. In order to match the sample size and demographics of the DS group, 22 controls subjects were chosen that mostly closely matched the DS group in age and sex. Additional details can be found in the Supplementary material.
Motion
After preprocessing and prior to additional analysis, each time series was visually inspected for scanner or extreme motion-related artifacts, such as visible signal loss or obviously non-physiological correlation patterns. Two participants with DS were excluded from further analysis due to multiple large head movements that resulted in visible signal loss. For the remaining participants, slice-wise mean and maximum motion estimates were used to exclude participants with values greater than 2.5 standard deviations from the mean. This resulted in the removal of three additional participants with DS and no controls. Despite removal of these participants, the DS group still had higher mean (P = 8.4 × 10⁻⁵) and max (P = 0.0001) motion values compared to controls, which must be considered when interpreting the results reported below.
Group differences
Table 3 includes all regions showing significant functional connections to the hippocampus in either group. With the exception of the connection from the right hippocampus to the left precuneus, all regions that showed significant group differences had weaker connectivity in the DS group (Fig. 5). Multiple frontal lobe regions showed lower connectivity to bilateral hippocampi in the DS group, including the bilateral medial frontal gyri (P < 0.0036), the right middle/superior frontal gyrus (P = 0.0039), the left superior frontal gyrus (P = 0.0002), the left anterior cingulate (P = 0.0002), and the right precentral gyrus (P = 0.0054). Connectivity between the left and right hippocampus was also weaker in the DS group (P = 0.0179), though note that this difference was not significant in the supplementary analysis assessing the impact of individual motion estimates (Supplementary Table 3). Connections were also weaker in the DS group from the right hippocampus to the right middle temporal gyrus (P = 0.0050). The DS group showed a stronger connection from the right hippocampus to the left precuneus (P = 0.0090). No connections showed a significant correlation to age in either group.
Table 3.
Group differences in regions showing significant connectivity to the left and right hippocampus (n = 22 in both groups)
| Talairach coordinates |
P
a
|
||||||
|---|---|---|---|---|---|---|---|
| Region | BA | x | y | z | Left | Right | |
| L | superior frontal gyrus | 8 | −11 | 32 | 47 | 2.4 × 10⁻⁵ | 0.0002 |
| L | middle/superior frontal gyrus | 8 | −21 | 26 | 46 | 0.1006 | 0.0988 |
| R | middle/superior frontal gyrus | 8 | 24 | 29 | 45 | 0.0021 | 0.0039 |
| L | medial frontal gyrus | 9 | −3 | 49 | 28 | 0.0036 | 0.0001 |
| R | medial frontal gyrus | 9 | 5 | 49 | 26 | 0.0009 | 4.2 × 10⁻⁵ |
| R | precentral gyrus | 4 | 56 | −13 | 38 | 0.0867 | 0.0054 |
| L | anterior cingulate | 24 | −4 | 37 | 1 | 0.0002 | 4.3 × 10⁻⁵ |
| L | posterior cingulate | 30 | −6 | −50 | 17 | 0.6676 | 0.7268 |
| R | posterior cingulate | 31 | 5 | −50 | 18 | 0.3129 | 0.3916 |
| L | middle temporal gyrus | 21 | −57 | −3 | −13 | 0.0566 | 0.1751 |
| R | middle temporal gyrus | 21 | 52 | −1 | −20 | 0.0312 | 0.0050 |
| L | superior/middle temporal gyrus | 39 | −47 | −65 | 32 | 0.6163 | 0.7120 |
| R | superior/middle temporal gyrus | 39 | 46 | −64 | 24 | 0.8190 | 0.3507 |
| L | lingual gyrus | 17 | −4 | −82 | 0 | 0.0241 | 0.0763 |
| R | lingual gyrus | 17 | 4 | −78 | 5 | 0.1154 | 0.0589 |
| L | Precuneus | 7 | −27 | −69 | 33 | 0.1205 | 0.0090 b |
| L | Hippocampus | 24 | −15 | −14 | – | 0.0073 | |
| R | Hippocampus | −24 | −16 | −10 | 0.0179 | – | |
| L | parahippocampal gyrus | 35 | −22 | −35 | −7 | 0.9267 | 0.5625 |
| R | parahippocampal gyrus | 35 | 22 | −34 | −11 | 0.8038 | 0.8259 |
BA, Brodmann area; L, left; R, right.
Results of Student's t-tests between groups. Values in bold survived correction for multiple comparisons.
Regions where connectivity is stronger in DS as compared to controls.
Figure 5.

Group differences in hippocampal connectivity. Group differences in functional connectivity measured from the left hippocampus (top) and right hippocampus (bottom; n = 22 in each group). Red denotes regions showing differences in connectivity strength to both left and right hippocampi, while yellow denotes regions showing unilateral differences. The L PREC ROI is transparent, indicating a non-surface region. All regions showed stronger connectivity in HC (P < 0.0200) with the exception of L PREC, which showed stronger connectivity in DS (P = 0.0090). ACC, anterior cingulate cortex; HIP, hippocampus; L, left; MFG, medial frontal gyrus; M/SFG, middle/superior frontal gyrus; MTG, middle temporal gyrus; PG, precentral gyrus; PREC, precuneus; R, right; SFG, superior frontal gyrus.
Hemispheric asymmetry
In the control group, connectivity to the left middle temporal gyrus was stronger from the left than from the right hippocampus (P = 0.0015). The DS group did not show differences in the strength of connectivity from the right or left hippocampus.
Relationship to hippocampal volumes
In the DS group, inter-hemispheric hippocampal connectivity was significantly related to CA1 and CAt volumes. Connectivity from the left to the right hippocampus was related to left CA1 (r = 0.641, P = 0.0013) and CAt (r = 0.607, P = 0.0027) volumes. Connectivity from the right to the left hippocampus was related to right CA1 (r = 0.604, P = 0.0029) and CAt (r = 0.596, P = 0.0034) volumes. In the control group, connectivity from the left hippocampus to the bilateral medial frontal gyri was positively related to bilateral HIP (P < 0.0383), but these relationships did not survive FDR correction. No other connections were related to hippocampal volumes in either group.
Discussion
This work used high resolution, 7T MRI to assess structure and function of the hippocampus in individuals with DS. The gains in signal-to-noise ratio, tissue contrast and spatial resolution achievable at 7T provide a level of detail and accuracy that has not previously been attainable in in-vivo studies of individuals with DS. In addition to increased whole-brain mean cortical thickness and lateral ventricle volumes, hippocampal subfield volumes showed selective reductions in bilateral volumes of CA1, DG, and tail in the DS group, but no differences in ERC or SUB volumes. In the DS group, bilateral hippocampi showed widespread decreases in the strength of connectivity, predominately to frontal regions. Both groups showed similar relationships of age to whole-brain volume measures, but not to hippocampal volumes or connectivity.
Our results are consistent with reports of reduced hippocampal volume in individuals with DS compared to controls.11,12,51–54 The few investigations of hippocampal subfields in DS used T21 foetal brain tissue, and while not directly comparable to adult brains, provide some comparison for our findings. Our finding of reduced DG volume in DS is consistent with reports of fewer myelinated axons,21 decreased volume,19 and reduced cell proliferation20 in T21 foetal brains. The finding of decreased volume of CA1, but not the SUB, is surprising in light of the reported involvement of these regions in both DS and Alzheimer’s disease pathology. In T21 foetal brains, CA1 and the SUB are reported to show decreased volumes18,19 and increased phagocytic activity.17 In non-DS Alzheimer’s disease and MCI, CA1 and the SUB are the earliest hippocampal regions to show pathology, and the SUB, presubiculum, and tail showed reductions in a sample of elderly individuals with amyloid-β pathology but no signs of cognitive decline.26 Perhaps less surprising is the lack of difference in ERC volume seen in the present sample, given reports of increased volume of the parahippocampal gyrus in DS.11,12,54 The hippocampus shows reliable hemispheric asymmetry in the general population, with larger volume on the right.55 Our findings of rightward asymmetry in CA1, CAt and DG agree with those of a report of subfield lateralization in 100 healthy controls.56 However, our sample showed an increase in SUB volume to the left that was not found in the larger study, which contributed to the lack of lateralization of overall hippocampal volume reported in our control group. Increased AI of CA regions in the DS group is notable in light of increased asymmetry of the hippocampus in non-DS Alzheimer’s disease and MCI,56 although subfields showing some of the largest AI differences in that report (the SUB and DG) were not significant here.
Whole-brain anatomical measures were not the focus of this investigation, but were reported for completeness. Our findings support reports of reduced intracranial and increased ventricular volumes in individuals with DS.11,53,54,57 While cerebral WM volume showed a non-significant reduction in the DS group, cortical and subcortical GM volumes were not significantly different. Previous investigations of brain volumes in individuals with DS often focussed on regional rather than whole-brain measures, and have reported volume increases and decreases.11,54 This may explain why the coarser whole-brain measures reported here did not show group differences. We did find increased cortical thickness in the DS group, in agreement with previous reports,58,59 although we did not account for the impact of grey–white matter contrast, previously reported as altered in DS.60 Of note, both groups showed relationships of a similar magnitude between age and increased WM and decreased cortical GM. These relationships are in line with reported age-related volume changes in the general population,61,62 and suggest that, despite potential differences in baseline level, whole-brain volume measures in young, non-demented individuals with DS may follow a similar trajectory as those in the general population.
The hippocampus has widespread cortical connections, including strong reciprocal connections to the PCC through the cingulum bundle.63 Deep brain stimulation of the PCC has been shown to modulate hippocampal activity and impair episodic memory performance,64 and the integrity of posterior cingulum bundle WM has been related to memory and executive function in patients with early Alzheimer’s disease.65 These findings, along with reports of disrupted functional connectivity between the hippocampus and PCC in Alzheimer’s disease and MCI30,33,34 and the strong functional connections between the head of the hippocampus and regions comprising the DMN,66 led us to focus on the hippocampal–PCC relationship for creation of seed ROIs. Indeed, the resulting connectivity maps showed substantial overlap with regions considered to be part of the DMN.67 Reports of decreased functional connectivity of the DMN in preclinical and clinical Alzheimer’s disease,35,36 and of decreased global brain connectivity to the PCC in DS,37 suggested that hippocampal connectivity may also be reduced in the DS group.
Previous studies of functional connectivity in DS report widespread changes. Studies reporting between-network connectivity have generally found increased connection strength in those with DS,68,69 suggesting disrupted between-network interactions. Studies assessing regional connectivity have returned mixed results. Wilson et al.70 found decreased connectivity strength to the medial frontal gyrus in individuals with DS, with more reductions in older individuals with positive amyloid PET scans. Pujol et al.37 found that individuals with DS showed both increased and decreased regional connectivity compared to controls, and connectivity strength showed both positive and negative relationships to behavioural measures. These findings suggest that both increased and decreased synchrony contribute to cognitive dysfunction in DS, with directionality likely dependent on regional relationships and network dynamics. By limiting our analysis to regions that were synchronous with the hippocampus in either group, we focussed on within-network connectivity. We did not find group differences in our primary measure of interest, hippocampal-PCC connectivity. Instead, we found bilateral reductions in connectivity to frontal regions and to the contralateral hippocampus in the DS group. Only one region showed increased connectivity in the DS group, that of the left precuneus to the right hippocampus. That most of the changes were in the frontal lobe and anterior temporal regions is in line with Pujol et al.,38 who found increased connectivity in DS in ventral regions of the frontal and temporal lobes and decreased connectivity in dorsal regions. The suggestion of regionally specific changes may explain an inconsistency between the current results and that of a recent study in the Ts65Dn mouse model of DS. Compared to control animals, neural activity measured in the Ts65Dn mice showed increased phase synchronization of the prefrontal cortex and hippocampus during rest at multiple frequencies. It is possible that the opposite relationship found in our study is related to the functional and anatomical specificity achievable with high-field MRI, allowing us to focus on discrete regions of the frontal lobe.
Head motion is an issue for all MRI studies, and leads to measurable changes in connectivity.71 Previous studies of functional connectivity in DS have dealt with motion in various ways, including censoring volumes with large motion estimates68 and using motion estimates as regressors in group analysis.37,69 The motion correction algorithm used here accounts for both volumetric and slice-specific motion, resulting in more accurate motion correction than methods that account for volumetric motion alone.45 A number of factors increase our confidence in the accuracy of our results, including the finding of both increased and decreased connectivity in the DS group, highly consistent and symmetric findings from both hippocampi, and significant relationships with volumetric measures. Additionally, a supplementary analysis showed that accounting for individual residual motion estimates did not lead to substantial changes in our results. Still, as with all studies showing group differences in motion level, our results should be interpreted with caution.
Previous studies have reported selective deficits in hippocampally-mediated cognitive functions in individuals with DS.9,72 Of note, we found an intriguing association between hippocampally-mediated long term visual memory performance and the volume of CA1. Reduced CA1 volume may reflect changes in cell function, number, and/or structure, impacting cognitive performance. Note that our sample includes only participants who were able to successfully complete an MRI, which results in a bias towards higher levels of functioning. In addition to further histological work, longitudinal measures, ideally in a sample including individuals across the range of function, will be required to describe the interplay between volumes and cognitive performance.
Using high-resolution imaging, the present work confirms smaller hippocampal volumes in individuals with DS. To our knowledge, this is the first in-vivo comparison of hippocampal subfield volumes between individuals with DS and typically-developing controls. We found preferential decreases in CA regions, DG, and tail. Further, individuals with DS show reductions in functional connectivity of the hippocampus, primarily to frontal lobe regions, with increased connectivity between the hippocampus and precuneus. We also found significant relationships between volumetric and cognitive measures. Although future work to validate these exploratory findings will be necessary, these results support the investigation of specific MRI-derived measures as surrogate markers of drug efficacy in pharmacological studies designed to investigate the possible enhancement of cognitive function in persons with DS. Lastly, the finding that neither hippocampal volume nor functional connectivity changes were associated with age in this sample of teenagers and young adults with DS is important from the perspective of studying neurodegenerative processes and their potential prevention in those with DS. As even young individuals with DS can display Alzheimer’s disease-like neuropathology, this finding points toward a window of time during which, although pathology may be present, it may exist in the context of well-preserved neural structure and function, i.e. in a state in which potential therapeutic interventions would have their best chance of being effective.
Supplementary material
Supplementary material is available at Brain Communications online.
Supplementary Material
Acknowledgements
The authors thank Tobias Kober and Thomas Benner of Siemens Healthineers for use of WIP 944 and WIP 770B.
Funding
This work was supported by Alzheimer’s Association (2016-NIRG-395687) and Alana USA Foundation (Contract 200381). As a trainee of the research education component of the Cleveland Alzheimer’s Disease Research Center, the work of K. Koenig was in part supported by the National Institute on Aging (P30 AG062428 01). A. Costa was also supported by the Awakening Angels Foundation. J. Leverenz was supported by the National Institute on Aging (P30 AG062428 01).
Competing interests
The authors report no competing interests.
Glossary
- AI =
asymmetry index
- ASHS =
Automated Segmentation of Hippocampal Subfields
- CA1 =
cornu Ammonis field 1
- CAt =
CA total
- DG =
dentate gyrus
- DMN =
default mode network
- DS =
Down syndrome
- ERC =
entorhinal cortex
- FDR =
false discovery rate
- GM =
grey matter
- HC =
healthy control
- HIP =
total hippocampus
- ICV =
intracranial volume
- MCI =
mild cognitive impairment
- PCC =
posterior cingulate cortex
- ROI =
region of interest
- SUB =
subiculum
- T21 =
trisomy of chromosome 21
- WM =
white matter
References
- 1.Roizen NJ, Patterson D.. Down’s syndrome. Lancet. 2003;361(9365):1281–1289. [DOI] [PubMed] [Google Scholar]
- 2.Capone GT, Chicoine B, Bulova P, et al. Down Syndrome Medical Interest Group DSMIG-USA Adult Health Care Workgroup. Co-occurring medical conditions in adults with Down syndrome: A systematic review toward the development of health care guidelines. Am J Med Genet A. 2018;176(1):116–133. [DOI] [PubMed] [Google Scholar]
- 3.Capone G, Stephens M, Santoro S, et al. Down Syndrome Medical Interest Group (DSMIG‐USA) Adult Health Workgroup. Co-occurring medical conditions in adults with Down syndrome: A systematic review toward the development of health care guidelines part II. Am J Med Genet A. 2020;182(7):1832–1814. [DOI] [PubMed] [Google Scholar]
- 4.Hamburg S, Lowe B, Startin CM, et al. Assessing general cognitive and adaptive abilities in adults with Down syndrome: A systematic review. J Neurodev Disord. 2019;11(1):1–16. [DOI] [PMC free article] [PubMed] [Google Scholar]
- 5.Nelson L, Johnson JK, Freedman M, et al. Learning and memory as a function of age in Down syndrome: A study using animal-based tasks. Prog Neuropsychopharmacol Biol Psychiatry. 2005;29(3):443–453. [DOI] [PubMed] [Google Scholar]
- 6.Abbeduto L, Murphy MM, Cawthon SW, et al. Receptive language skills of adolescents and young adults with Down or Fragile X syndrome. Am J Ment Retard. 2003;108(3):149–160. [DOI] [PubMed] [Google Scholar]
- 7.Jarrold C, Baddeley AD, Hewes AK.. Verbal short-term memory deficits in Down syndrome: A consequence of problems in rehearsal? J Child Psychol Psychiatry. 2000;41(2):233–244. [PubMed] [Google Scholar]
- 8.Carlesimo GA, Marotta L, Vicari S.. Long-term memory in mental retardation: Evidence for a specific impairment in subjects with Down's syndrome. Neuropsychologia. 1997;35(1):71–79. [DOI] [PubMed] [Google Scholar]
- 9.Pennington BF, Moon J, Edgin J, Stedron J, Nadel L.. The neuropsychology of Down syndrome: Evidence for hippocampal dysfunction. Child Dev. 2003;74(1):75–93. [DOI] [PubMed] [Google Scholar]
- 10.Kates WR, Folley BS, Lanham DC, Capone GT, Kaufmann WE.. Cerebral growth in Fragile X syndrome: Review and comparison with Down syndrome. Microsc Res Tech. 2002;57(3):159–167. [DOI] [PubMed] [Google Scholar]
- 11.Raz N, Torres IJ, Briggs SD, et al. Selective neuroanatomic abnormalities in Down’s syndrome and their cognitive correlates: Evidence from MRI morphology. Neurology. 1995;45(2):356–366. [DOI] [PubMed] [Google Scholar]
- 12.Kesslak JP, Nagata SF, Lott IT, Nalcioglu O.. MRI analysis of age-related changes in the brains of individuals with DS. Neurology. 1994;44(6):1039–1045. [DOI] [PubMed] [Google Scholar]
- 13.Teipel SJ, Alexander GE, Schapiro MB, Möller H‐J, Rapoport SI, Hampel H.. Age-related cortical grey matter reductions in non-demented Down's sydrome adults determined by MRI with voxel-based morphometry. Brain. 2004;127(4):811–824. [DOI] [PubMed] [Google Scholar]
- 14.Śmigielska-Kuzia J, Boćkowski L, Sobaniec W, et al. A volumetric magnetic resonance imaging study of brain structures in children with Down syndrome. Neurol Neurochir Pol. 2011;45(4):363–369. [DOI] [PubMed] [Google Scholar]
- 15.Eichenbaum H, Yonelinas AR, Ranganath C.. The medial temporal lobe and recognition memory. Annu Rev Neurosci. 2007;30(1):123–152. [DOI] [PMC free article] [PubMed] [Google Scholar]
- 16.Bird CM, Burgess N.. The hippocampus and memory: Insights from spatial processing. Nat Rev Neurosci. 2008;9(3):182–194. [DOI] [PubMed] [Google Scholar]
- 17.Kanaumi T, Milenkovic I, Adle-Biassette H, Aronica E, Kovacs GG.. Non-neuronal cell responses differ between normal and Down syndrome developing brains. Int J Dev Neurosci. 2013;31(8):796–803. [DOI] [PubMed] [Google Scholar]
- 18.Stagni F, Giacomini A, Emili M, et al. Subicular hypotrophy in fetuses with Down syndrome and in the Ts65Dn model of Down syndrome. Brain Pathol. 2019;29(3):366–379. [DOI] [PMC free article] [PubMed] [Google Scholar]
- 19.Guidi S, Bonasoni P, Ceccarelli C, et al. Neurogenesis impairment and increased cell death reduce total neuron number in the hippocampal region of fetuses with Down syndrome. Brain Pathol. 2007;18(2):180–197. [DOI] [PMC free article] [PubMed] [Google Scholar]
- 20.Contestabile A, Fila T, Ceccarelli C, et al. Cell cycle alteration and decreased cell proliferation in the hippocampal dentate gyrus and in the neocortical germinal matrix of fetuses with Down syndrome and in Ts65Dn mice. Hippocampus. 2007;17(8):665–678. [DOI] [PubMed] [Google Scholar]
- 21.Ábrahám H, Vincze A, Veszprémi B, et al. Impaired myelination of the human hippocampal formation in Down syndrome. Int J Dev Neurosci. 2012;30(2):147–158. [DOI] [PubMed] [Google Scholar]
- 22.Pujol J, Fenoll R, Ribas-Vidal N, et al. A longitudinal study of brain anatomy changes preceding dementia in Down syndrome. Neuroimage Clin. 2018;18:160–166. [DOI] [PMC free article] [PubMed] [Google Scholar]
- 23.Beacher F, Daly E, Simmons A, et al. Alzheimer’s disease and Down’s syndrome: An in vivo MRI study. Psychol Med. 2009;39(4):675–684. [DOI] [PubMed] [Google Scholar]
- 24.de Flores R, La Joie R, Chételat G.. Structural imaging of hippocampal subfields in healthy aging and Alzheimer's disease. Neuroscience. 2015;309:29–50. [DOI] [PubMed] [Google Scholar]
- 25.Apostolova LG, Mosconi L, Thompson PM, et al. Subregional hippocampal atrophy predicts Alzheimer's dementia in the cognitively normal. Neurobiol Aging. 2010;31(7):1077–1088. [DOI] [PMC free article] [PubMed] [Google Scholar]
- 26.Hsu PJ, Shou H, Benzinger T, et al. Amyloid burden in cognitively normal elderly is associated with preferential hippocampal subfield volume loss. J Alzheimers Dis. 2015;45(1):27–33. [DOI] [PMC free article] [PubMed] [Google Scholar]
- 27.Milenkovic I, Stojanovic T, Aronica E, et al. GABAA receptor subunit deregulation in the hippocampus of human foetuses with Down syndrome. Brain Struct Funct. 2018;223(3):1501–1518. [DOI] [PMC free article] [PubMed] [Google Scholar]
- 28.Leverenz JB, Raskind MA.. Early amyloid deposition in the medial temporal lobe of young Down syndrome patients: A regional quantitative analysis. Exp Neurol. 1998;150(2):296–304. [DOI] [PubMed] [Google Scholar]
- 29.Davidson YS, Robinson A, Prasher VP, Mann DMA.. The age of onset and evolution of Braak tangle stage and Thal amyloid pathology of Alzheimer's disease in individuals with Down syndrome. Acta Neuropathol Commun. 2018;6(1):1–11. [DOI] [PMC free article] [PubMed] [Google Scholar]
- 30.Wang L, Zang Y, He Y, et al. Changes in hippocampal connectivity in the early stages of Alzheimer's disease: Evidence from resting state fMRI. NeuroImage. 2006;31(2):496–504. [DOI] [PubMed] [Google Scholar]
- 31.Xue J, Guo H, Gao Y, et al. Altered directed functional connectivity of the hippocampus in mild cognitive impairment and Alzheimer's disease: A resting-state fMRI study. Front Aging Neurosci. 2019;11(326):1–15. [DOI] [PMC free article] [PubMed] [Google Scholar]
- 32.Zarei M, Beckmann CF, Binnewijzend MA, et al. Functional segmentation of the hippocampus in the healthy human brain and in Alzheimer's disease. NeuroImage. 2013;66:28–35. [DOI] [PubMed] [Google Scholar]
- 33.Dunn CJ, Duffy SL, Hickie IB, et al. Deficits in episodic memory retrieval reveal impaired default mode network connectivity in amnestic mild cognitive impairment. Neuroimage Clin. 2014;4:473–480. [DOI] [PMC free article] [PubMed] [Google Scholar]
- 34.Zhou Y, Dougherty JH, Hubner KF, Bai B, Cannon RL, Hutson RK.. Abnormal connectivity in the posterior cingulate and hippocampus in early Alzheimer's disease and mild cognitive impairment. Alzheimers Dement. 2008;4(4):265–270. [DOI] [PubMed] [Google Scholar]
- 35.Palmqvist S, Schöll M, Strandberg O, et al. Earliest accumulation of β-amyloid occurs within the default-mode network and concurrently affects brain connectivity. Nat Commun. 2017;8(1):1214. [DOI] [PMC free article] [PubMed] [Google Scholar]
- 36.Wu X, Li R, Fleisher AS, et al. Altered default mode network connectivity in Alzheimer's disease – A resting functional MRI and Bayesian network study. Hum Brain Mapp. 2011;32(11):1868–1881. [DOI] [PMC free article] [PubMed] [Google Scholar]
- 37.Pujol J, del Hoyo L, Blanco-Hinojo L, et al. Anomalous brain functional connectivity contributing to poor adaptive behavior in Down syndrome. Cortex. 2015;64:148–156. [DOI] [PubMed] [Google Scholar]
- 38.Alemany-González M, Gener T, Nebot P, Vilademunt M, Dierssen M, Puig MV.. Prefrontal–hippocampal functional connectivity encodes recognition memory and is impaired in intellectual disability. PNAS. 2020;117(21):11788–11798. [DOI] [PMC free article] [PubMed] [Google Scholar]
- 39.Basten IA, Boada R, Taylor HG, et al. On the design of broad-based neuropsychological test batteries to assess the cognitive abilities of individuals with Down syndrome in the context of clinical trials. Brain Sci. 2018;8(12):205. [DOI] [PMC free article] [PubMed] [Google Scholar]
- 40.Dale AM, Fischl B, Sereno MI.. Cortical surface-based analysis. I. Segmentation and surface reconstruction. NeuroImage. 1999;9(2):179–194. [DOI] [PubMed] [Google Scholar]
- 41.Yushkevich PA, Pluta J, Wang H, et al. Automated volumetry and regional thickness analysis of hippocampal subfields and medial temporal cortical structures in mild cognitive impairment. Hum Brain Mapp. 2015;36(1):258–287. [DOI] [PMC free article] [PubMed] [Google Scholar]
- 42.Wisse LEM, Kuijf HJ, Honingh AM, et al. Automated hippocampal subfield segmentation at 7T MRI. Am J Neuroradiol. 2016;37(6):1050–1057. [DOI] [PMC free article] [PubMed] [Google Scholar]
- 43.Benjamini Y, Hochberg Y.. On the adaptive control of the false discovery rate in multiple testing with independent statistics. J Educ Behav Stat. 2000;25(1):60–83. [Google Scholar]
- 44.Glover GH, Li T, Ress D.. Image-based method for retrospective correction of physiological motion effects in fMRI: RETROICOR. Magn Reson Med. 2000;44(1):162–167. [DOI] [PubMed] [Google Scholar]
- 45.Beall EB, Lowe MJ.. SimPACE: Generating simulated motion corrupted BOLD data with synthetic-navigated acquisition for the development and evaluation of SLOMOCO: A new, highly effective slicewise motion correction. NeuroImage. 2014;101:21–34. [DOI] [PMC free article] [PubMed] [Google Scholar]
- 46.Cox R.AFNI: Software for analysis and visualization of functional magnetic resonance neuroimages. Comput Biomed Res. 1996;29(3):162–173. [DOI] [PubMed] [Google Scholar]
- 47.Saad ZS, Glen DR, Chen G, Beauchamp MS, Desai R, Cox RW.. A new method for improving functional-to-structural alignment using local Pearson correlation. NeuroImage. 2009;44(3):839–848. [DOI] [PMC free article] [PubMed] [Google Scholar]
- 48.Poppenk J, Moscovitch M.. A hippocampal marker of recollection memory ability among healthy young adults: Contributions of posterior and anterior segments. Neuron. 2011;72(6):931–937. [DOI] [PubMed] [Google Scholar]
- 49.Yeo BT, Krienen FM, Sepulcre J, et al. The organization of the human cerebral cortex estimated by intrinsic functional connectivity. J Neurophysiol. 2011;106(3):1125–1165. [DOI] [PMC free article] [PubMed] [Google Scholar]
- 50.Lowe MJ, Mock BJ, Sorenson JA.. Functional connectivity in single and multislice echoplanar imaging using resting-state fluctuations. NeuroImage. 1998;7(2):119–132. [DOI] [PubMed] [Google Scholar]
- 51.Carducci F, Onorati P, Condoluci C, et al. Whole-brain voxel-based morphometry study of children and adolescents with Down syndrome. Funct Neurol. 2013;28(1):19–28. [PMC free article] [PubMed] [Google Scholar]
- 52.Teipel SJ, Schapiro MB, Alexander GE, et al. Relation of corpus callosum and hippocampal size to age in nondemented adults with Down’s syndrome. Am J Psychiatry. 2003;160(10):1870–1878. [DOI] [PubMed] [Google Scholar]
- 53.Aylward EH, Li Q, Honeycutt NA, et al. MRI volumes of the hippocampus and amygdala in adults with Down’s syndrome with and without dementia. Am J Psychiatry. 1999;156:564–568. [DOI] [PubMed] [Google Scholar]
- 54.White NS, Alkire MT, Haier RJ.. A voxel-based morphometric study of nondemented adults with Down syndrome. NeuroImage. 2003;20(1):393–403. [DOI] [PubMed] [Google Scholar]
- 55.Pedraza O, Bowers D, Gilmore R.. Asymmetry of the hippocampus and amygdala in MRI volumetric measurements of normal adults. J Int Neuropsychol Soc. 2004;10(5):664–678. [DOI] [PubMed] [Google Scholar]
- 56.Sarica A, Vasta R, Novellino F, et al. The Alzheimer's Disease Neuroimaging Initiative. MRI asymmetry index of hippocampal subfields increases through the continuum from the mild cognitive impairment to the Alzheimer's disease. Front Neurosci. 2018;12:576. [DOI] [PMC free article] [PubMed] [Google Scholar]
- 57.Beacher F, Daly E, Simmons A, et al. Brain anatomy and ageing in non-demented adults with Down's syndrome: An in vivo MRI study. Psychol Med. 2010;40(4):611–629. [DOI] [PubMed] [Google Scholar]
- 58.Levman J, MacDonald A, Baumer N, et al. Structural magnetic resonance imaging demonstrates abnormal cortical thickness in Down syndrome: Newborns to young adults. Neuroimage Clin. 2019;23:101874–101878. [DOI] [PMC free article] [PubMed] [Google Scholar]
- 59.Lee NR, Adeyemi EI, Lin A, et al. Dissociations in cortical morphometry in youth with Down syndrome: Evidence for reduced surface area but increased thickness. Cereb Cortex. 2016;26(7):2982–2990. [DOI] [PMC free article] [PubMed] [Google Scholar]
- 60.Bletsch A, Mann C, Andrews DS, et al. Down syndrome is accompanied by significantly reduced cortical grey–white matter tissue contrast. Hum Brain Mapp. 2018;39(10):4043–4054. [DOI] [PMC free article] [PubMed] [Google Scholar]
- 61.Mills KL, Goddings A, Herting MM, et al. Structural brain development between childhood and adulthood: Convergence across four longitudinal samples. NeuroImage. 2016;141:273–281. [DOI] [PMC free article] [PubMed] [Google Scholar]
- 62.Coupé P, Catheline G, Lanuza E, Manjón JV, Initiative ADN., Alzheimer's Disease Neuroimaging Initiative. Towards a unified analysis of brain maturation and aging across the entire lifespan: A MRI analysis. Hum Brain Mapp. 2017;38(11):5501–5518. [DOI] [PMC free article] [PubMed] [Google Scholar]
- 63.Wakana S, Jiang H, Nagae-Poetscher LM, van Zijl PC, Mori S.. Fiber tract-based atlas of human white matter anatomy. Radiology. 2004;230(1):77–87. [DOI] [PubMed] [Google Scholar]
- 64.Natu VS, Lin J, Burks A, Arora A, Rugg MD, Lega B.. Stimulation of the posterior cingulate cortex impairs episodic memory encoding. J Neurosci. 2019;39(36):7173–7182. [DOI] [PMC free article] [PubMed] [Google Scholar]
- 65.Lin Y-C, Shih Y-C, Tseng W-YI, et al. Cingulum correlates of cognitive functions in patients with mild cognitive impairment and early Alzheimer’s disease: A diffusion spectrum imaging study. Brain Topogr. 2014;27(3):393–402. [DOI] [PubMed] [Google Scholar]
- 66.Zhong Q, Xu H, Qin J, Zeng L-L, Hu D, Shen H.. Functional parcellation of the hippocampus from resting-state dynamic functional connectivity. Brain Res. 2019;1715:165–175. [DOI] [PubMed] [Google Scholar]
- 67.Horn A, Ostwald D, Reisert M, Blankenburg F.. The structural‐functional connectome and the default mode network of the human brain. NeuroImage. 2014;102(1):142–151. [DOI] [PubMed] [Google Scholar]
- 68.Anderson JS, Nielsen JA, Ferguson MA, et al. Abnormal brain synchrony in Down syndrome. NeuroImage Clin. 2013;2:703–715. [DOI] [PMC free article] [PubMed] [Google Scholar]
- 69.Vega JN, Hohman TJ, Pryweller JR, Dykens EM, Thornton-Wells TA.. Resting-state functional connectivity in individuals with Down syndrome and Williams syndrome compared with typically developing controls. Brain Connectivity. 2015;5(8):461–475. [DOI] [PMC free article] [PubMed] [Google Scholar]
- 70.Wilson LR, Vatansever D, Annus T, et al. Differential effects of Down's syndrome and Alzheimer's neuropathology on default mode connectivity. Hum Brain Mapp. 2019;40(15):4551–4563. [DOI] [PMC free article] [PubMed] [Google Scholar]
- 71.Van Dijk KRA, Sabuncu MR, Buckner RL.. The influence of head motion on intrinsic functional connectivity MRI. NeuroImage. 2012;59(1):431–438. [DOI] [PMC free article] [PubMed] [Google Scholar]
- 72.Clark CAC, Fernandez F, Sakhon S, Spanò G, Edgin JO.. The medial temporal memory system in Down syndrome: Translating animal models of hippocampal compromise. Hippocampus. 2017;27(6):683–691. [DOI] [PMC free article] [PubMed] [Google Scholar]
Associated Data
This section collects any data citations, data availability statements, or supplementary materials included in this article.
Supplementary Materials
Data Availability Statement
The data that support the findings of this study are available on request from the corresponding author, dependent on a formal data sharing agreement with the administering institution.