

Abstract
Introduction
Pembrolizumab was approved with an accompanying companion diagnostic (CDx) assay (PD‐L1 DAKO 22C3) for urothelial carcinoma (UC). In this study, we further characterize the clinicopathologic and genomic features of UC that are programmed death‐ligand 1 (PD‐L1) positive.
Materials and Methods
The cohort of this study consisted of a total of 528 consecutive UC patients with PD‐L1 immunohistochemistry (IHC) and comprehensive genomic profiling (CGP). All PD‐L1 IHC testing was performed using the DAKO 22C3 CDx assay for UC. PD‐L1 positivity was determined at a combined positive score ≥ 10.
Results
A total of 44.5% (235/528) patients with UC were PD‐L1positive. A lower PD‐L1 positivity rate was detected in primary (42.3%, 148/350) versus metastatic sites (48.9%, 87/178). PD‐L1 positivity was dependent on the location of the metastatic sites. CGP revealed PD‐L1positive patients had more frequent genomic alterations (GAs) in TP53 (p = .006) and RB1 (p = .003) and less frequent GAs in FGFR3 (p = .001) and MTAP (p = .028). The APOBEC mutational signature and tumor mutational burden (TMB)‐high were more common in PD‐L1positive patients. By testing patients with UC with CGP, in addition to PD‐L1 IHC, an additional 97 patients (18.4%) in the total cohort were eligible for immunotherapy based on TMB status.
Conclusion
PD‐L1positive and PD‐L1negative urothelial carcinomas are genomically different. Also, our study provides the framework for future clinical investigation with regard to specimen site selection for PD‐L1 testing as well as candidate biomarker genomic alterations that may predict for better response or lack of response to immune checkpoint inhibitors.
Implications for Practice
In this study, a higher prevalence of TP53 and RB1 alterations and APOBEC mutational signatures in the PD‐L1positive urothelial carcinoma disease subset and enrichment of FGFR3 alterations in the PD‐L1negative disease subset were found. These data provide the basis for future investigation into the role of these genomic changes as positive and negative predictors of immunotherapy response. Also, differences wer seen in PD‐L1 positivity based on the collection site of the sample, which can provide a framework for future clinical trial design and could influence sample selection for PD‐L1 testing in patients with urothelial carcinoma when multiple samples are available.
Keywords: Urothelial carcinoma, PD‐L1 immunohistochemistry, Comprehensive genomic profiling, Biomarkers
Short abstract
This study evaluated 528 patients with urothelial carcinoma and provides insight into the genetics and clinical features that distinguish PD‐L1 positive and PD‐L1 negative tumors.
Introduction
In 2019, 80,470 new cases of bladder cancer and 17,670 deaths from bladder cancer were estimated to have occurred in the U.S. [1]. Within developed countries, urothelial carcinoma (UC) is the most common type of bladder cancer. Traditionally, depending on the stage of urothelial carcinoma, standard‐of‐care therapy includes a combination of surgery, chemotherapy, and radiation. Recently, new treatment options for patients with UC with associated biomarkers have been approved. Specifically, erdafitinib has been approved for patients with locally advanced or metastatic UC with select FGFR3 genomic alterations (GAs) and programmed death‐ligand 1/programmed cell death protein 1 (PD‐L1/PD‐1) immunotherapies have been approved in patients with locally advanced or metastatic UC with PD‐L1 expression [2].
Although PD‐L1 immunohistochemistry (IHC) is the only companion diagnostic (CDx) currently approved for immunotherapy specifically in urothelial carcinoma, patients with a tumor mutational burden (TMB) ≥10 mutations per Mb via FoundationOneCDx and/or who have microsatellite instability‐high (MSI‐H) status are eligible for pembrolizumab based on pan‐tumor approvals [3, 4]. Additional positive predictive biomarkers include CD274 (PD‐L1) gene amplification, which has shown some evidence as a predictor to PD‐L1/PD‐1 therapy response in solid tumors [5]. Importantly, potential resistance biomarkers (STK11 and KEAP1 alterations) for patients treated with immune checkpoint inhibitors (ICPIs) have emerged in several tumor types [6, 7]. Last, we were interested in investigating the APOBEC mutational signature in UC because of its known association with increased survival of patients with bladder cancer [8].
Although the clinical use of anti‐PD‐L1/PD1 axis immunotherapies has increased dramatically in multiple tumor types in recent years, immunotherapy in the form of Bacillus Calmette–Guérin intravesical therapy has been used in low grade non‐muscle invasive bladder cancer for more than 30 years [9]. Recently, several PD‐L1/PD1 immunotherapies have been approved by the U.S. Food and Drug Administration (FDA) for use in UC as both first‐ and second‐line therapies [10]. Within first‐line therapies, two PD‐L1/PD‐1 agents, atezolizumab and pembrolizumab, are currently approved for use in cisplatin‐ineligible patients. In 2018, FDA warned against use of these agents in a first‐line setting in patients with low PD‐L1 expression as measured by their respective companion diagnostic (CDx) assays. For atezolizumab, the CDx assay is the SP142 IHC assay with an immune cell cutoff of 5%; and for pembrolizumab, the CDx assay is the DAKO 22C3 PharmDx Assay at a combined positive score (CPS) cutoff of 10 [2].
These therapies (with required companion diagnostics) illustrate the importance of PD‐L1 IHC when making treatment decisions for patients with UC. With these new companion diagnostic approvals, clinically meaningful disease subsets that predict therapy response have emerged based on PD‐L1 IHC status. For urothelial carcinoma, these samples can now be defined by PD‐L1 positivity by either the DAKO 22C3 CDx or SP142 CDx assays. In this study we sought to further characterize the clinicopathologic and genomic features of patients with UC who are PD‐L1 positive with the DAKO 22C3 CDx assay and also underwent comprehensive genomic profiling (CGP).
Materials and Methods
Patient Cohort Selection
We reviewed all 528 consecutive UC cases that were tested with PD‐L1 DAKO 22C3 CDx IHC assay between September 2018 and May 2019. These cases were sent to Foundation Medicine for CGP and PD‐L1 IHC during routine clinical care. Age and sex of patient and specimen site of sample were extracted from accompanying pathology reports. Approval for this study was obtained from the Western Institutional Review Board Protocol No. 20152817.
PD‐L1 IHC
All PD‐L1 IHC testing was performed using the DAKO 22C3 PharmDx assay per manufacturer's instructions in a Clinical Laboratory Improvement Amendments (CLIA)‐certified and College of American Pathologists (CAP)‐accredited reference laboratory (Foundation Medicine, Morrisville, NC). In brief, the DAKO PD‐L1 22C3 PharmDx assay consists of a monoclonal mouse anti–PD‐L1, the 22C3 clone, with the envision flex visualization system on the Autostainer Link 48 using the staining protocol provided by the package insert and interpreted with the guidelines of the DAKO interpretation guide [11, 12]. All cases have accompanying controls, H&E‐stained patient slide, negative reagent control–stained patient slide, and a DAKO PD‐L1 22C3–stained patient slide. PD‐L1 IHC slides were interpreted by board‐certified pathologists using the CPS, which is the number of PD‐L1 staining cells (tumor cells, lymphocytes, macrophages) divided by the total number of viable tumor cells, multiplied by 100 [12]. The CPS score differs from the tumor proportion score in that it accounts for certain immune cells (lymphocyte, macrophages) staining in addition to the tumor cell staining in the score. As per DAKO's interpretation guide, any convincing partial or complete linear membrane staining (≥1+) of viable tumor cells that is perceived as distinct from cytoplasmic staining and any convincing membrane and/or cytoplasmic staining (≥1+) of lymphocytes and macrophages (mononuclear inflammatory cells) within tumor nests and/or immediately adjacent supporting stroma were counted for scoring [12]. A CPS ≥ 10 is considered positive for PD‐L1 (PD‐L1pos) in patients with UC per the CDx claim.
Comprehensive Genomic Profiling
CGP was performed using the FDA approved FoundationOneCDx assay (Foundation Medicine, Cambridge, MA) using previously described methods in a CLIA‐certified and CAP‐accredited laboratory [13]. FoundationOneCDx uses a hybrid capture methodology and detects base substitutions, insertions and deletions, and copy number alterations in 324 genes and select gene rearrangements in 36 genes, as well as TMB and microsatellite instability (MSI). A board‐certified pathologist reviewed a H&E slide from each sample under light microscopy to determine tumor adequacy (at least 20% tumor nuclei present) and to confirm these cases were UC before sequencing. After sequencing each case and processing the data through the bioinformatics pipeline, a board‐certified pathologist reviewed the report before releasing it to the patient. The FoundationOneCDx assay sequences the FGFR3 gene and detects the same mutations as the QIAGEN FGFR RT‐PCR CDx kit. The specific alterations the QIAGEN kit detects are two point mutations in exon 7 [p.R248C (c.742C>T), p.S249C (c.746C>G)], two point mutations in exon 10 [p.G370C (c.1108G>T) and p.Y373C (c.1118A>G)], and two fusions (FGFR3‐TACC3v1 and FGFR3‐TACC3v3) [2]. The FoundationOneCDx assay also identifies many additional genomic GA and FGFR3 gene mutations that are not currently detected by the QIAGEN kit. Tumor mutational burden was determined on 0.79 Mb of sequenced DNA and assessment of microsatellite instability was performed from DNA sequencing across 114 loci as previously described [14, 15]. TMB positivity (TMB‐high [H]) was defined as ≥ 10 mutations per Mb. CD274 amplification was defined as specimen ploidy plus four. Genomic ancestry of patients was determined using a principle component analysis of genomic single nucleotide polymorphisms trained on data from the 1000 Genomes Project, and each patient was classified as belonging to one of the following superpopulations: African, Central and South American, East Asian, European, and South Asian [16, 17]. APOBEC mutational signatures were called as described by Zehir et al. [18].
Analysis Methodology
We analyzed patient characteristic differences in gender, sex, predominant genetic ancestry, and APOBEC mutational signature between PD‐L1pos and PD‐L1‐negative (neg) disease subsets. In addition, differences between PD‐L1pos and PD‐L1neg disease subsets in the immunotherapy biomarkers of TMB, MSI, and CD274 amplification were also examined. Statistical analysis was performed using analysis of variance (ANOVA), χ2 contingency test, or Fisher exact test.
To examine the genomic biomarker landscape of our patient cohort, we identified the top 25 genes that have GAs and compared these same genes between the UC PD‐L1pos and PD‐L1neg disease subsets with a Fisher exact test. The p value was adjusted for multiple comparisons using the Bonferroni method, and p < .05 was considered significant [19].
Results
Clinicopathologic Features of Patient Cohort
A total of 528 consecutive patients with UC were tested at Foundation Medicine between September 2018 and May 2019. There were more men (76.5%, 404/528) in the cohort, and the median age was 71 years, with a range between 31 and > 80 years; however, no significant differences in sex and age were identified between PD‐L1pos and PD‐L1neg disease subsets (Fisher exact test, p = .079; ANOVA, p = .775, respectively; Table 1). Most patients were of predominant European genetic ancestry, with no significant differences in predominant genetic ancestry between the PD‐L1pos and PD‐L1neg disease subsets (χ2 contingency test, p = .798; Table 1). A majority of the specimens were from primary sites (66.3%, 350/528), with a lower PD‐L1 positivity rate in specimens from primary (42.3%, 148/350) versus metastatic sites (48.9%, 87/178). Most of the primary urothelial carcinoma specimens were from the bladder (88.0%, 308/350) and a minority were from the ureter (7.4%, 26/350), kidney pelvis (3.4%, 12/250), and urethra (1.1%, 4/350; Table 2). Of the primary site specimens, a majority (76%, 266/350) were obtained from either a cystectomy or a transurethral resection of a bladder tumor (TURBT), with the PD‐L1 positivity rate in the cystectomy specimen (50.6%, 39/77) higher than the TURBT specimens (42.3%, 80/189). In addition, a difference in PD‐L1 positivity based on the location of the metastatic specimen was observed with metastatic specimens to the prostate with the highest positivity rate (83.3%, 5/6) and metastatic specimens in the bone having the lowest positivity rates (20%, 1/5; Table 2).
Table 1.
Gender, age, predominant genetic ancestry, and APOBEC mutational signature difference between PD‐L1pos and PD‐L1neg urothelial carcinoma disease subsets
| Patient characteristics | PD‐L1 positive (n = 235) | PD‐L1 negative (n = 293) | p value |
|---|---|---|---|
| Gender, n (%) | .079 a | ||
| Female | 27.2 (64) | 20.5 (60) | |
| Male | 72.8 (171) | 79.5 (233) | |
| Age, years | .775 b | ||
| Median | 71 | 71 | |
| Mean | 70 | 69.7 | |
| Predominant genetic ancestry, n (%) | .798 c | ||
| African | 6.0 (14) | 8.5 (25) | |
| Central and South American | 6.0 (14) | 4.8 (14) | |
| East Asian | 3.0 (7) | 3.4 (10) | |
| European | 84.7 (199) | 82.9 (243) | |
| South Asian | 0.4 (1) | 0.3 (1) | |
| APOBEC mutational signature, n (%) | 35.7 (84) | 24.6 (72) | .006 a |
Fisher exact test.
Analysis of risk.
χ2 contingency test.
Abbreviation: PD‐L1, programmed death‐ligand 1.
Table 2.
Percent of primary and metastatic samples from each specimen site and percent of PD‐L1 positivity in each specimen site
| Specimen site | PD‐L1 positivity rate, % | PD‐L1 positive, n | Total (specimen site), n |
|---|---|---|---|
| Primary | |||
| Lower tract urothelial carcinoma | 42.90 | 134 | 312 |
| Bladder | 42.50 | 131 | 308 |
| Urethra | 75.00 | 3 | 4 |
| Upper tract urothelial carcinoma | 36.80 | 14 | 38 |
| Kidney pelvis | 8.30 | 1 | 12 |
| Ureter | 50.00 | 13 | 26 |
| Metastatic | |||
| Lymph node | 46.00 | 23 | 50 |
| Soft tissue | 55.20 | 16 | 29 |
| Lung | 32.00 | 8 | 25 |
| Liver | 38.10 | 8 | 21 |
| Pelvis | 25.00 | 2 | 8 |
| Prostate | 83.30 | 5 | 6 |
| Abdomen | 80.00 | 4 | 5 |
| Bone | 20.00 | 1 | 5 |
| Retroperitoneum | 100.00 | 3 | 3 |
| Brain | 66.70 | 2 | 3 |
| Spine | 66.70 | 2 | 3 |
| Omentum | 0.00 | 0 | 3 |
| Adrenal gland | 100.00 | 2 | 2 |
| Colon | 100.00 | 2 | 2 |
| Small intestine | 100.00 | 2 | 2 |
| Uterus | 100.00 | 2 | 2 |
| Cervix | 100.00 | 1 | 1 |
| Endometrium | 100.00 | 1 | 1 |
| Fallopian tube | 100.00 | 1 | 1 |
| Gallbladder | 100.00 | 1 | 1 |
| Pituitary | 100.00 | 1 | 1 |
| Pleura | 0.00 | 0 | 1 |
| Skin | 0.00 | 0 | 1 |
| Thyroid gland | 0.00 | 0 | 1 |
| Vagina | 0.00 | 0 | 1 |
Abbreviation: PD‐L1, programmed death‐ligand 1.
Genomic Differences Between PD‐L1pos and PD‐L1neg UC Disease Subsets
Comutation plots of the top 25 genes with GAs in the PD‐L1pos and PD‐L1neg UC disease subsets are shown in Figure 1A and B. The top five genes with GAs in the PD‐L1pos disease subset were TERT (70.2%), TP53 (70.2%), CDKN2A (35.7%), MLL2 (31.5%), and CDKN2B (28.5%); in the PD‐L1neg disease subset they were TERT (75.1%), TP53 (54.3%), CDKN2A (44.7%), CDKN2B (36.9%), and MTAP (32.8%).
Figure 1.
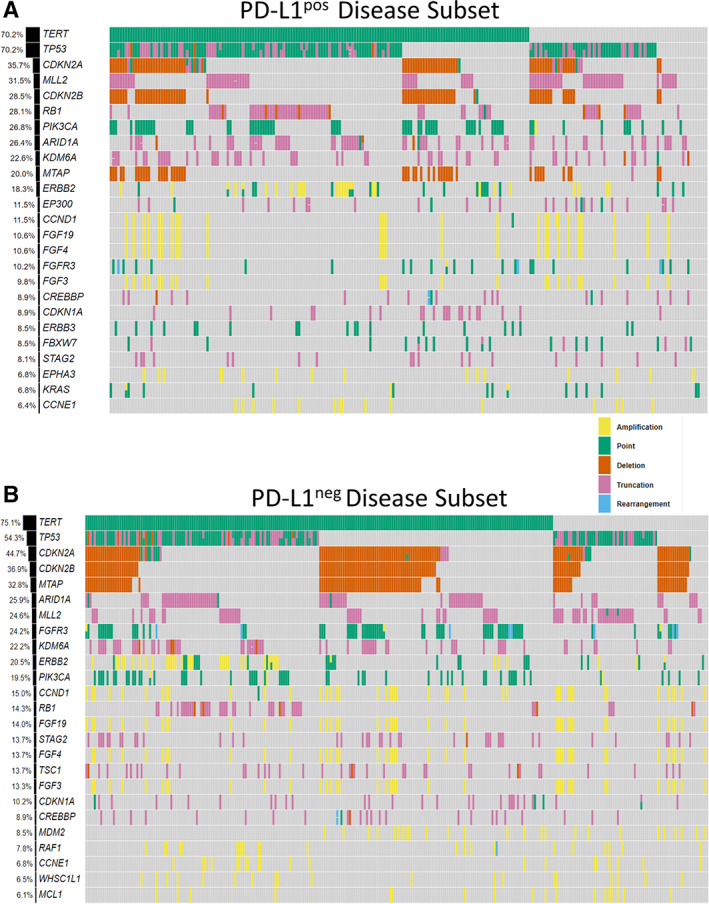
(A): Comutation plots of the top 25 genes with genomic alterations in the PD‐L1pos and (B) PD‐L1neg urothelial carcinoma disease subsets. The top five genes with genomic alterations in the PD‐L1pos disease subset were TERT (70.2%), TP53 (70.2%), CDKN2A (35.7%), MLL2 (31.5%), and CDKN2B (28.5%); in the PD‐L1neg disease subset they were TERT (75.1%), TP53 (54.3%), CDKN2A (44.7%), CDKN2B (36.9%), and MTAP (32.8%).Abbreviations: PD‐L1neg, programmed death‐ligand 1 negative; PD‐L1pos, programmed death‐ligand 1 positive.
Of the top 25 genes with GAs in the overall UC cohort, four genes had significantly different frequencies between the PD‐L1pos and PD‐L1neg disease subsets, suggesting that PD‐L1pos and PD‐L1neg disease subsets have different genomic profiles (supplemental online Fig. 1; supplemental online Table 1). The frequency of GAs in TP53 (p = .006) and RB1 (p = .003) were significantly higher in the PD‐L1pos disease subsets and MTAP (p = .028) and FGFR3 (p = .001) were significantly decreased. Importantly, although we saw a lower rate of FGFR3 GAs in the PD‐L1pos disease subset, when we examined the FGFR3 GAs that were approved as a CDx for erdafitinib, we saw that 22.9% (67/293) of patients in the PD‐L1neg disease subset were positive for this biomarker (Fig. 2A). In addition, CGP identified four additional PD‐L1neg patients with FGFR3 GAs that were not part of the CDx (p.S371C, c.1111A>T; p.G380R, c.1138G>A; p.K650E, c.1948A>G; FGFR3‐CCDC149). Last, a significantly higher rate of APOBEC mutational signature was observed in the PD‐L1pos disease subset when compared with the PD‐L1neg disease subset (Fisher exact test, p = .006; Table 1).
Figure 2.

(A): Diagram represents patients with urothelial carcinoma eligible for therapy based on PD‐L1 immunohistochemistry (IHC) and select FGFR3 alterations. Here, we first examined the rates of PD‐L1 positivity in the overall cohort. In the PD‐L1 negative cohort, we also looked at select FGFR3 mutations and rearrangements as per the companion diagnostic (CDx) approval for erdafitinib [point mutations: p.R248C (c.742C > T), p.S249C (c.746C > G), p.G370C (c.1108G > T) and p.Y373C (c.1118A > G); and fusions: FGFR3‐TACC3v1 and FGFR3‐TACC3v3]. (B): Left pane (H&E stain, 200× magnification) and right pane (PD‐L1 22C3 IHC, 200× magnification), are from a urothelial carcinoma sample, which was positive for the PD‐L1 22C3 assay. In this case, both tumor cells and immune cells are staining for PD‐L1 IHC, and this sample has a combined positive score (CPS) ≥ 10. (C): Figure of relationship between PD‐L1 status using the DAKO 22C3 CDx Assay, TMB ≥ 10 mutations per Mb (TMB‐H), and MSI‐H. PD‐L1pos was defined as CPS ≥ 10 as per U.S. Food and Drug Administration companion diagnostic approval for pembrolizumab.Abbreviations: MSS, microsatellite stable; MSI‐H, microsatellite instability‐high; PD‐L1neg, programmed death‐ligand 1 negative; PD‐L1pos, programmed death‐ligand 1 positive; TMB‐H, tumor mutational burden‐high.
Immunotherapy Biomarkers
Slightly less than half of the cohort (44.5%) is PD‐L1pos. An example of a positive PD‐L1 CPS score is shown in Figure 2B. The mean and median (mutations per Mb) TMB in the overall UC cohort is 10.9 and 7.5; the PD‐L1pos disease subset is 12.9 and 8.8, and the PD‐L1neg disease subset is 9.3 and 6.3. Taken together, TMB is significantly higher in the PD‐L1pos disease subset when compared with PD‐L1neg disease subset (ANOVA, p = .002). At the TMB CDx cutoff of 10 mutations per Mb, the PD‐L1pos disease subset had a significantly higher frequency (44.3%, 104/235) of TMB‐H when compared with the PD‐L1neg disease subset (33.1%, 97/293; Fisher exact test, p = .009; supplemental online Table 2). Although there was a higher prevalence of TMB‐H in the PD‐L1pos disease subset, the overall distribution of TMB scores was similar between the PD‐L1pos and PD‐L1neg disease subsets (supplemental online Fig. 2). MSI was high in 0.8% (4/528) of the overall cohort, all of which were PD‐L1pos (Fisher exact test, p = .039). CD274 amplification was higher in the PD‐L1pos cohort (2.6%, 6/235) when compared with the PD‐L1neg cohort (0.75%, 2/293), although no significance was found (Fisher exact test, p = .148).
By testing patients with UC with CGP at the TMB CDx cutoff of 10 mutations per Mb in addition to PD‐L1 IHC, an additional 97 patients (18.4%, 97/528) in the total cohort were eligible for ICPI based on TMB biomarker status (Fig. 2C). All four MSI‐H patients were PD‐L1pos and TMB‐H.
The resistance biomarkers that have been described in other tumor types were also present in this UC cohort. In the PD‐L1pos disease subset there were 4.3% (10/235) STK11 alterations, and 0.9% (2/235) KEAP1 alterations; in the PD‐L1neg disease subset, there were 0.7% (2/293) STK11 alterations, and 2.4% (7/293) KEAP1 alterations.
Discussion
Although the relationship of PD‐L1 IHC, TMB, MSI, and CD274 amplification has been recently studied by Huang et al. in >48,000 samples tested with both PD‐L1 IHC and CGP, the investigation of clinicopathologic and genomic features of PD‐L1 positive tumors in most tumor types is lacking in the literature [20, 21]. To the best of our knowledge, this is the first study that examined the clinicopathologic and genomic features of patients with PD‐L1pos and PD‐L1neg (as defined by the DAKO 22C3 CDx assay) UC in a large cohort of clinical samples. In our PD‐L1pos disease subset, we saw an increased association with GAs in RB1 and TP53. RB1 and TP53 are both tumor suppressor genes that have been well studied in urothelial carcinoma. Investigators have found that genomic alterations of these two genes led to a worse prognosis and comutations in these two genes are important in whether a urothelial lesion is invasive or not [22, 23, 24, 25, 26]. Interestingly, TP53 alterations have been associated with PD‐L1 expression in lung adenocarcinoma and has been hypothesized to have potential positive predictive value for immunotherapies [27, 28]. In addition, we examined the APOBEC mutational signature because of the known association of APOBEC mutational signature with urothelial carcinoma [8, 29]. We found that there was an increased association with APOBEC mutational signature in the PD‐L1pos disease subset when compared with the PD‐L1neg disease subset. TP53 alterations, RB1 alterations, and/or APOBEC mutations signature are potential biomarkers that can further segregate the PD‐L1pos disease subset. Whether PD‐L1pos patients with these genomic changes highlight responders or nonresponders to ICPI is currently unknown and should be included in future analysis of patients with UC in clinical studies with outcomes data.
In the BLC2001 clinical trial that led to the approval of erdafitinib, the authors concluded that patients with FGFR alterations may be less likely to have a response to ICPIs [30]. In that trial, 22 patients with FGFR alterations had been previously treated with ICPIs and only 5% (1/22) had a history of response to previous ICPI treatment, whereas 59% of the 22 FGFR3‐mutated patients had a response to erdafitinib in the BLC2001 trial. In our study, we saw higher rates of FGFR3 GAs in the PD‐L1neg disease subsets, which further suggests that FGFR3 alterations are a potential resistance biomarker for ICPIs in urothelial carcinoma. We also examined the specific FGFR3 alterations that were approved as a CDx for erdafitinib and found that 22.9% (67/293) of PD‐L1neg patients had positivity for this biomarker.
TMB and MSI are well‐studied predictive biomarkers for immunotherapy response and are currently companion diagnostics in the pan‐solid tumor setting. MSI‐high was detected in only a small number of patients in our cohort (4/528), and all these patients were positive for PD‐L1 IHC and TMB. In this study, we also saw that TMB was significantly higher in the PD‐L1pos patients when compared with PD‐L1neg patients. Importantly, at the TMB CDx cutoff of 10 mutations per Mb, by testing patients with UC with CGP in addition to PD‐L1 IHC, an additional 97 patients (18.4%, 97/528) in the total UC cohort were eligible for ICPI based on the TMB biomarker status. Last, we saw the presence of biomarkers for resistance to ICPIs that have been established in other tumor types present in our cohort of patients with UC.
Depending on the status of the PD‐L1 DAKO 22C3 CDx assay, a patient with UC can be potentially eligible for pembrolizumab. With our large cohort of PD‐L1pos and PD‐L1neg cases, we performed some additional analyses to describe variations in PD‐L1 status based on site of specimen collection. We found a lower PD‐L1 positivity rate in specimens from primary (42.3%, 148/350) versus metastatic sites (48.9%, 87/178). In addition, we discovered differences in the PD‐L1 positivity based on the specific primary site and metastatic site. For metastatic samples, metastasis to the bone had the lowest PD‐L1 positivity rate and metastasis or extension into the prostate had the highest PD‐L1 positivity rate. We hypothesize that the low rates of PD‐L1 positivity in the bone could be due to decalcification process that usually occurs for bone specimens. Although the sample sizes for these specific sites are low, the data suggest that the specimen site of the collected sample might influence whether the patient is eligible for pembrolizumab.
Conclusion
We characterized the clinicopathologic and genomics features of patients with PD‐L1pos UC as defined by the DAKO 22C3 CDx assay. We found a higher prevalence of TP53 and RB1 alterations and APOBEC mutational signatures in the patients with PD‐L1pos UC. Whether PD‐L1pos patients with these genomic changes highlight responders or nonresponders to ICPIs is currently unknown and should be included in future analysis of patients with UC in clinical studies with outcomes data. Also, enrichment of FGFR3 GAs in the PD‐L1neg disease subsets further suggests the potential role of FGFR3 GAs as a resistance biomarker in urothelial carcinoma. In addition, the addition of TMB to PD‐L1 IHC increases the number of patients with UC eligible for ICPI, suggesting that PD‐L1 staining is not sufficient for routine care, and patients should also undergo CGP testing. Importantly, we saw differences in PD‐L1 positivity based on the collection site of the sample, which can provide a framework for future clinical trial design and could influence sample selection for PD‐L1 testing in patients with UC when multiple samples are available.
Author Contributions
Conception/design: Richard S.P. Huang, Jeffrey S. Ross, Shakti H. Ramkissoon
Provision of study material or patients: Richard S.P. Huang, Eric Severson, Daniel L. Duncan, N. Lynn Ferguson, Amanda Hemmerich, Claire Edgerly, Matthew Hiemenz, Julia A. Elvin, Douglas I. Lin, Jeffrey S. Ross, Shakti H. Ramkissoon
Collection and/or assembly of data: Richard S.P. Huang, James Haberberger, Lukas Harries, Jinpeng Xiao
Data analysis and interpretation: Richard S.P. Huang, James Haberberger, Lukas Harries, Eric Severson, Daniel L Duncan, N. Lynn Ferguson, Amanda Hemmerich, Claire Edgerly, Karthikeyan Murugesan, Jinpeng Xiao, Deborah McEwan, Oliver Holmes, Matthew Hiemenz, Jeffrey Venstrom, Julia A. Elvin, James Creeden, Douglas I. Lin, Jeffrey S. Ross, Shakti H. Ramkissoon
Manuscript writing: Richard S.P. Huang, James Haberberger, Lukas Harries, Eric Severson, Daniel L. Duncan, N. Lynn Ferguson, Amanda Hemmerich, Claire Edgerly, Karthikeyan Murugesan, Jinpeng Xiao, Deborah McEwan, Oliver Holmes, Matthew Hiemenz, Jeffrey Venstrom, Julia A. Elvin, James Creeden, Douglas I. Lin, Jeffrey S. Ross, Shakti H. Ramkissoon
Final approval of manuscript: Richard S.P. Huang, James Haberberger, Lukas Harries, Eric Severson, Daniel L. Duncan, N. Lynn Ferguson, Amanda Hemmerich, Claire Edgerly, Karthikeyan Murugesan, Jinpeng Xiao, Deborah McEwan, Oliver Holmes, Matthew Hiemenz, Jeffrey Venstrom, Julia A. Elvin, James Creeden, Douglas I. Lin, Jeffrey S. Ross, Shakti H. Ramkissoon
Disclosures
Richard S.P. Huang: Foundation Medicine, Inc. (E, OI); James Haberberger: Foundation Medicine, Inc. (E, OI); Lukas Harries: Foundation Medicine, Inc. (E, OI); Eric Severson: Foundation Medicine, Inc. (E, OI); Daniel L. Duncan: Foundation Medicine, Inc. (E, OI); N. Lynn Ferguson: Foundation Medicine, Inc. (E, OI); Amanda Hemmerich: Foundation Medicine, Inc. (E, OI); Claire Edgerly: Foundation Medicine, Inc. (E, OI); Karthikeyan Murugesan: Foundation Medicine, Inc. (E, OI); Jinpeng Xiao: Foundation Medicine, Inc. (E, OI); Deborah McEwan: Foundation Medicine, Inc. (E, OI); Oliver Holmes: Foundation Medicine, Inc. (E, OI); Matthew Hiemenz: Foundation Medicine, Inc. (E, OI); Jeffrey Venstrom: Foundation Medicine, Inc. (E, OI); Julia A. Elvin: Foundation Medicine, Inc. (E, OI); James Creeden: Foundation Medicine, Inc. (E, OI); Douglas I. Lin: Foundation Medicine, Inc. (E, OI); Jeffrey S. Ross: Foundation Medicine, Inc. (E, OI); Shakti H. Ramkissoon Foundation Medicine, Inc. (E, OI)
(C/A) Consulting/advisory relationship; (RF) Research funding; (E) Employment; (ET) Expert testimony; (H) Honoraria received; (OI) Ownership interests; (IP) Intellectual property rights/inventor/patent holder; (SAB) Scientific advisory board
Supporting information
See http://www.TheOncologist.com for supplemental material available online.
Figure S1 Top 25 genes with the most genomic alterations in the PD‐L1pos vs PD‐L1neg disease subsets. Genomic alterations prevalence was determined for the overall cohort and the PD‐L1pos and PD‐L1neg disease subsets were compared with a Fisher Exact test. The p‐value was adjusted for multiple comparisons using the Bonferroni method. Analysis showed increased enrichment in PD‐L1pos patients of genomic alterations in TP53 (p = 0.006) and RB1 (p = 0.003); and conversely found increased enrichment of genomic alterations in PD‐L1neg patients of MTAP (p = 0.028) and FGFR3 (p = 0.001)
Figure S2. Violin plot of log10.TMB scores in the PD‐L1pos and PD‐L1neg disease subsets
Table S1 Genomic alteration (GA) prevalence of the top 25 genes with GA in the PD‐L1pos vs PD‐L1neg urothelial carcinoma disease subsets. Fisher Exact Test performed, and p values were adjusted with Bonferroni method.
Table S2. Immunotherapy biomarker difference between PD‐L1pos and PD‐L1neg urothelial carcinoma disease subsets
Disclosures of potential conflicts of interest may be found at the end of this article.
No part of this article may be reproduced, stored, or transmitted in any form or for any means without the prior permission in writing from the copyright holder. For information on purchasing reprints contact commercialreprints@wiley.com. For permission information contact permissions@wiley.com.
Footnotes
For Further Reading: Rohan Garje, Josiah An, Mohammad Obeidat et al. Fibroblast Growth Factor Receptor (FGFR) Inhibitors in Urothelial Cancer. The Oncologist 2020;25:e1711–e1719.
Implications for Practice: Dysregulated fibroblast growth factor receptor (FGFR) signaling is associated with several cancers, including urothelial carcinoma. Preclinical studies with FGFR inhibitors have shown significant antitumor activity, which has led to clinical evaluation of multiple FGFR inhibitors. Most recently, erdafitinib was approved by the U.S. Food and Drug Administration for advanced urothelial carcinoma with FGFR gene alterations as the first molecularly targeted therapy. Additional ongoing clinical trials with other types of FGFR inhibitors have shown encouraging results. This review summarizes the oncogenic signaling of FGFR alterations, completed and ongoing clinical trials of FGFR inhibitors, and resistance patterns.
References
- 1. American Cancer Society . Bladder cancer, 2019. Available at https://www.cancer.org/cancer/bladder-cancer.html. Accessed December 12, 2019.
- 2. List of cleared or approved companion diagnostic devices (in vitro and imaging tools). U.S. Food and Drug Administration. Available at https://www.fda.gov/medical-devices/vitro-diagnostics/list-cleared-or-approved-companion-diagnostic-devices-vitro-and-imaging-tools. Accessed December 12, 2019.
- 3. FDA approves pembrolizumab for adults and children with Tmb‐H solid tumors. 2020. Available at https://www.fda.gov/drugs/drug-approvals-and-databases/fda-approves-pembrolizumab-adults-and-children-tmb-h-solid-tumors. Accessed December 12, 2019.
- 4. FDA grants accelerated approval to pembrolizumab for first tissue/site agnostic indication. U.S. Food and Drug Administration. 2017. https://www.fda.gov/drugs/resources-information-approved-drugs/fda-grants-accelerated-approval-Pembrolizumab-first-tissuesite-agnostic-indication. Accessed December 12, 2019.
- 5. Goodman AM, Piccioni D, Kato S et al. Prevalence of PDL1 amplification and preliminary response to immune checkpoint blockade in solid tumors. JAMA Oncol 2018;4:1237–1244. [DOI] [PMC free article] [PubMed] [Google Scholar]
- 6. Skoulidis F, Goldberg ME, Greenawalt DM et al. STK11/LKB1 mutations and PD‐1 inhibitor resistance in kras‐mutant lung adenocarcinoma. Cancer Discov 2018;8:822–835. [DOI] [PMC free article] [PubMed] [Google Scholar]
- 7. Marinelli D, Mazzotta M, Scalera S et al. KEAP1‐driven co‐mutations in lung adenocarcinoma unresponsive to immunotherapy despite high tumor mutational burden. Ann Oncol 2020;31:1746–1754. [DOI] [PubMed] [Google Scholar]
- 8. Glaser AP, Fantini D, Wang Y et al. APOBEC‐mediated mutagenesis in urothelial carcinoma is associated with improved survival, mutations in DNA damage response genes, and immune response. Oncotarget 2017;9:4537–4548. [DOI] [PMC free article] [PubMed] [Google Scholar]
- 9. Douglass L, Schoenberg M. The future of intravesical drug delivery for non‐muscle invasive bladder cancer. Bladder Cancer 2016;2:285–292. [DOI] [PMC free article] [PubMed] [Google Scholar]
- 10. Tripathi A, Plimack ER. Immunotherapy for urothelial carcinoma: Current evidence and future directions. Curr Urol Rep 2018;19:109. [DOI] [PubMed] [Google Scholar]
- 11. Dako PD‐L1 IHC 22C3. [package insert] Dako. 2020.
- 12. DAKO. PD‐L1 IHC 22C3 pharmDx Interpretation Manual – Urothelial Carcinoma. Dako. 2019.
- 13. Frampton GM, Fichtenholtz A, Otto GA et al. Development and validation of a clinical cancer genomic profiling test based on massively parallel DNA sequencing. Nat Biotechnol 2013;31:1023–1031. [DOI] [PMC free article] [PubMed] [Google Scholar]
- 14. Chalmers ZR, Connelly CF, Fabrizio D et al. Analysis of 100,000 human cancer genomes reveals the landscape of tumor mutational burden. Genome Med 2017;9:34. [DOI] [PMC free article] [PubMed] [Google Scholar]
- 15. Trabucco SE, Gowen K, Maund SL et al. A novel next‐generation sequencing approach to detecting microsatellite instability and pan‐tumor characterization of 1000 microsatellite instability‐high cases in 67,000 patient samples. J Mol Diagn 2019;21:1053–1066. [DOI] [PMC free article] [PubMed] [Google Scholar]
- 16. Newberg J, Connelly C, Frampton G. Determining patient ancestry based on targeted tumor comprehensive genomic profiling. Cancer Res 2019;79:1599a. [Google Scholar]
- 17. Carrot‐Zhang J, Chambwe N, Damrauer JS et al. Comprehensive analysis of genetic ancestry and its molecular correlates in cancer. Cancer Cell 2020;37:639–654.e636. [DOI] [PMC free article] [PubMed] [Google Scholar]
- 18. Zehir A, Benayed R, Shah RH et al. Mutational landscape of metastatic cancer revealed from prospective clinical sequencing of 10,000 patients. Nat Med 2017;23:703–713. [DOI] [PMC free article] [PubMed] [Google Scholar]
- 19. Goeman JJ, Solari A. Multiple hypothesis testing in genomics. Stat Med 2014;33:1946–1978. [DOI] [PubMed] [Google Scholar]
- 20. Huang RSP, Haberberger J, Severson E et al. A pan‐cancer analysis of Pd‐L1 immunohistochemistry and gene amplification, tumor mutation burden and microsatellite instability in 48,782 cases. Mod Pathol 2020;34:252–263. [DOI] [PubMed] [Google Scholar]
- 21. Huang RSP, Li X, Haberberger J et al. Biomarkers in breast cancer: An integrated analysis of comprehensive genomic profiling and Pd‐L1 immunohistochemistry biomarkers in 312 patients with breast cancer. The Oncologist 2020;25:943–953. [DOI] [PMC free article] [PubMed] [Google Scholar]
- 22. Yin M, Grivas P, Emamekhoo H et al. ATM/RB1 mutations predict shorter overall survival in urothelial cancer. Oncotarget 2018;9:16891–16898. [DOI] [PMC free article] [PubMed] [Google Scholar]
- 23. Soini Y, Turpeenniemi‐Hujanen T, Kamel D et al. p53 immunohistochemistry in transitional cell carcinoma and dysplasia of the urinary bladder correlates with disease progression. Br J Cancer 1993;68:1029–1035. [DOI] [PMC free article] [PubMed] [Google Scholar]
- 24. Lipponen PK. Over‐expression of p53 nuclear oncoprotein in transitional‐cell bladder cancer and its prognostic value. Int J Cancer 1993;53:365–370. [DOI] [PubMed] [Google Scholar]
- 25. Shariat SF, Tokunaga H, Zhou J et al. P53, p21, prb, and p16 expression predict clinical outcome in cystectomy with bladder cancer. J Clin Oncol 2004;22:1014–1024. [DOI] [PubMed] [Google Scholar]
- 26. He F, Mo L, Zheng XY et al. Deficiency of pRb family proteins and p53 in invasive urothelial tumorigenesis. Cancer Res 2009;69:9413–9421. [DOI] [PMC free article] [PubMed] [Google Scholar]
- 27. Serra P, Petat A, Maury JM et al. Programmed cell death‐ligand 1 (PD‐L1) expression is associated with RAS/TP53 mutations in lung adenocarcinoma. Lung Cancer 2018;118:62–68. [DOI] [PubMed] [Google Scholar]
- 28. Dong ZY, Zhong WZ, Zhang XC et al. Potential predictive value of TP53 and KRAS mutation status for response to PD‐1 blockade immunotherapy in lung adenocarcinoma. Clin Cancer Res 2017;23:3012–3024. [DOI] [PubMed] [Google Scholar]
- 29. Ju YS. The mutational signatures and molecular alterations of bladder cancer. Transl Cancer Res 2017:S689–S701. [Google Scholar]
- 30. Loriot Y, Necchi A, Park SH et al. Erdafitinib in locally advanced or metastatic urothelial carcinoma. N Engl J Med 2019;381:338–348. [DOI] [PubMed] [Google Scholar]
Associated Data
This section collects any data citations, data availability statements, or supplementary materials included in this article.
Supplementary Materials
See http://www.TheOncologist.com for supplemental material available online.
Figure S1 Top 25 genes with the most genomic alterations in the PD‐L1pos vs PD‐L1neg disease subsets. Genomic alterations prevalence was determined for the overall cohort and the PD‐L1pos and PD‐L1neg disease subsets were compared with a Fisher Exact test. The p‐value was adjusted for multiple comparisons using the Bonferroni method. Analysis showed increased enrichment in PD‐L1pos patients of genomic alterations in TP53 (p = 0.006) and RB1 (p = 0.003); and conversely found increased enrichment of genomic alterations in PD‐L1neg patients of MTAP (p = 0.028) and FGFR3 (p = 0.001)
Figure S2. Violin plot of log10.TMB scores in the PD‐L1pos and PD‐L1neg disease subsets
Table S1 Genomic alteration (GA) prevalence of the top 25 genes with GA in the PD‐L1pos vs PD‐L1neg urothelial carcinoma disease subsets. Fisher Exact Test performed, and p values were adjusted with Bonferroni method.
Table S2. Immunotherapy biomarker difference between PD‐L1pos and PD‐L1neg urothelial carcinoma disease subsets