

Abstract
Background
Brachyury is a transcription factor overexpressed in chordoma and is associated with chemotherapy resistance and epithelial‐to‐mesenchymal transition. GI‐6301 is a recombinant, heat‐killed Saccharomyces cerevisiae yeast‐based vaccine targeting brachyury. A previous phase I trial of GI‐6301 demonstrated a signal of clinical activity in chordomas. This trial evaluated synergistic effects of GI‐6301 vaccine plus radiation.
Materials and Methods
Adults with locally advanced, unresectable chordoma were treated on a randomized, placebo‐controlled trial. Patients received three doses of GI‐6301 (80 × 107 yeast cells) or placebo followed by radiation, followed by continued vaccine or placebo until progression. Primary endpoint was overall response rate, defined as a complete response (CR) or partial response (PR) in the irradiated tumor site at 24 months. Immune assays were conducted to evaluate immunogenicity.
Results
Between May 2015 and September 2019, 24 patients enrolled on the first randomized phase II study in chordoma. There was one PR in each arm; no CRs were observed. Median progressive‐free survival for vaccine and placebo arms was 20.6 months (95% confidence interval [CI], 5.7–37.5 months) and 25.9 months (95% CI, 9.2–30.8 months), respectively. Hazard ratio was 1.02 (95% CI, 0.38–2.71). Vaccine was well tolerated with no vaccine‐related serious adverse events. Preexisting brachyury‐specific T cells were detected in most patients in both arms. Most patients developed T‐cell responses during therapy, with no difference between arms in frequency or magnitude of response.
Conclusion
No difference in overall response rate was observed, leading to early discontinuation of this trial due to low conditional power to detect statistical difference at the planned end of accrual.
Implications for Practice
Chordoma is a rare neoplasm lacking effective systemic therapies for advanced, unresectable disease. Lack of clinically actionable somatic mutations in chordoma makes development of targeted therapy quite challenging. While the combination of yeast‐brachyury vaccine (GI‐6301) and standard radiation therapy did not demonstrate synergistic antitumor effects, brachyury still remains a good target for developmental therapeutics in chordoma. Patients and their oncologists should consider early referral to centers with expertise in chordoma (or sarcoma) and encourage participation in clinical trials.
Keywords: Chordoma, Immunotherapy, Therapeutic vaccine, Radiation therapy, Randomized clinical trial
Short abstract
The use of a therapeutic cancer vaccine that stimulates the immune system to fight brachyury‐expressing cancer cells is a promising alternative to targeted molecular therapies. This article evaluates the concurrent use of a yeast‐brachyury vaccine in combination with radiation therapy in patients with advanced or metastatic chordoma.
Introduction
Chordoma is a rare, slow‐growing sarcoma derived from remnants of the primitive notochord [1, 2, 3]. Chordomas are known to overexpress brachyury, a transcription factor present in the notochord during development [4, 5, 6, 7, 8]. Brachyury is a member of the T‐box family of transcription factors, characterized by a highly conserved DNA‐binding domain designated as T‐domain and is associated with chemotherapy resistance, metastasis, poor prognosis, and epithelial‐to‐mesenchymal transition (EMT) [9, 10, 11, 12]. EMT is a reversible process during which cells switch from a polarized, epithelial phenotype into a highly motile mesenchymal phenotype that is more difficult to treat [11]. At the biochemical level, EMT involves the downregulation of epithelial proteins such as E‐cadherin and cytokeratins and the induction of mesenchymal proteins, including fibronectin, N‐cadherin, and vimentin [13, 14]. Expression of brachyury by chordoma cells has been identified as a potential target for the treatment of chordoma, but the limited availability of targeted molecular therapies has restricted the targeting of brachyury [15]. An alternative and promising approach is use of a therapeutic cancer vaccine that stimulates the immune system to fight brachyury‐expressing cancer cells.
Since 2012, five therapeutic cancer vaccines targeting brachyury have been studied in humans across 11 clinical trials to activate cytotoxic T cells and stimulate immune‐based killing. The first vaccine to undergo human testing was GI‐6301, a yeast‐brachyury vaccine composed of heat‐killed recombinant Saccharomyces cerevisiae expressing brachyury (NCT01519817). Compared with other vaccine vehicles, heat‐killed yeast vaccines are easy to develop [16, 17], are known to be safe, and can be used in combination with other therapies in patients with preneoplastic lesions and/or in the neoadjuvant or adjuvant setting [18, 19, 20, 21, 22, 23]. Preclinical studies from the National Cancer Institute's (NCI's) Laboratory of Tumor Immunology and Biology showed that the yeast‐brachyury vaccine effectively expanded CD8+ brachyury‐specific T cells obtained from normal donor blood and that isolated CD8+ T‐cell fractions lysed brachyury+ tumor cells in vitro [7]. The phase I dose‐escalation study of the yeast‐brachyury vaccine GI‐6301 (NCT01519817) enrolled 34 patients with advanced malignancies (11 with chordoma). GI‐6301 vaccine demonstrated brachyury‐specific immunogenicity, an excellent safety profile, and some evidence of clinical activity in two patients with previously irradiated chordoma [24].
Because cancer vaccine monotherapy does not induce a robust immune response, combination strategies have been explored. In vitro studies have shown that chordoma cell lines are killed in significantly higher numbers by brachyury‐specific T cells after either proton beam or gamma radiation therapy (RT) [25]. Other preclinical studies have demonstrated that RT can modulate tumor to become an immunostimulatory milieu and that its combination with an immunotherapeutic vaccine may have synergistic effects [26, 27, 28]. RT‐induced immunogenic modulation increases the susceptibility of tumor cells to antigen‐specific cytotoxic T lymphocytes by changing the tumor surface phenotype and increasing translocation of calreticulin to the tumor surface [29]. RT upregulates cellular expression of death receptor Fas/CD95, intercellular adhesion molecule‐1, and major histocompatibility complex (MHC) class I [30]. Fas/Fas ligand binding promotes tumor‐cell death via antigen‐specific immune cells and proapoptotic mechanisms [31, 32]. RT‐induced costimulatory molecules decrease immunosuppressive regulatory T cells [33]. Several ongoing clinical trials are investigating the combination of RT with therapeutic cancer vaccines, including dendritic‐cell vaccines, whole tumor‐cell vaccines, viral‐based vaccines, peptide/protein vaccines, nucleic‐acid vaccines, and bacterial‐based vaccines.
The overall goal of the study reported here was to expand the immunotherapeutic approach for the treatment of chordoma by combining a yeast‐brachyury vaccine with RT. This was the first study to evaluate concurrent use of GI‐6301 vaccine in combination with RT in patients with advanced or metastatic chordoma.
Materials and Methods
Eligibility
The study population consisted of adults with advanced or metastatic chordoma not considered resectable, with planned RT to at least one targeted lesion with evidence of growth prior to enrollment. As RT was administered separately from the vaccine treatment site, the choice of RT modality (photon or proton) and dosing schema (standard or hypofractionated) was per the decision of the local treating radiation oncologist. Prior RT was allowed provided the previously irradiated field could safely be irradiated again. Patients were required to have measurable disease per RECIST v1.1, with an Eastern Cooperative Oncology Group performance status of 0 to 2 at study entry. Normal organ and bone marrow function were required with standard parameters. Men and women of child‐bearing potential agreed to use effective birth control or abstinence during and for a period of 4 months after the last vaccination. The study did not enroll patients with serious intercurrent illness, active autoimmune disease, human immunodeficiency virus, chronic hepatitides, or hypersensitivity to yeast‐based products or pregnant or breast‐feeding women. Systemic steroid use was prohibited within 4 weeks of study enrollment; physiologic replacement dosing was permitted. The study was approved by the NCI's Institutional Review Board and was registered on ClinicalTrials.gov (NCT02383498).
Assessment of Toxicities
Adverse events were graded according to the NCI's Common Terminology Criteria for Adverse Events v4.0 [34]. Toxicities were identified by review of laboratory studies, medical history, and physical examination. The trial was monitored in an unblinded manner by an independent data safety monitoring board. No dose‐limiting toxicities were observed in previous phase I trials of GI‐6301.
Study Design
Patients were randomized 1:1 to the vaccine or placebo arm (Fig. 1). Patients assigned to the vaccine arm received the investigational biologic product, GI‐6301, at a dose of 80 yeast units. Each dose of 80 × 107 yeast cells was given as four equal subcutaneous injections (20 × 107 yeast cells per syringe). Patients assigned to the placebo arm received an equal volume of 0.9% sodium chloride dispensed in identical 3‐mL syringes wrapped in brown opaque labeling to maintain blinding. (See supplemental online Fig. 1 for study schema.) The study agent (vaccine or placebo) was given at 2‐week (±3 days) intervals for three doses prior to starting definitive RT to the locally advanced tumor(s). Whereas vaccine was administered at the National Institutes of Health (NIH) Clinical Center in Bethesda, MD, RT was performed at the patients’ home institutions. Following completion of RT, patients returned to the NIH Clinical Center where the study agent was resumed 14–28 days following RT. Doses continued every 2 weeks (±3 days) until subjects received 6 doses total (until completion of cycle 2). Thereafter, the study agent was given monthly (every 28 days ±7 days) for four doses (cycles 3, 4, 5, 6) and then every 3 months (–7/+28 days, cycles 7 and beyond) for at least 2 years. Patients assigned to the placebo arm could cross over to unblinded treatment with vaccine at time of confirmed disease progression. The primary endpoint of the study was overall response rate (ORR), defined as a complete response (CR) or partial response (PR) at the irradiated tumor site(s) after up to 24 months of treatment. Response was assessed per RECIST v1.1 [35, 36]. Secondary endpoints included progression‐free survival (PFS) and overall survival (OS). Subjects were assessed at baseline and then at fixed intervals (3, 6, 9, 12, 18, and 24 months) from time of completion of RT. Exploratory analysis using volumetric segmentation was performed on responding patients using 3D Slicer version 4.6.2 (Brigham and Women's Hospital, Harvard Medical School) and Vitrea Software 7.11.6.38 (Vital Images Inc., Minnetonka, MN). Lesion boundaries were manually traced at baseline and follow‐up using postcontrast fluid‐attenuated inversion recovery imaging (thickness = 1 mm, spacing = 1 mm) and axial short inversion time inversion recovery imaging (thickness = 1.5 mm, spacing = 1 mm). After manual tracing of the lesion outline, lesion volume was automatically calculated per the software algorithm.
Figure 1.
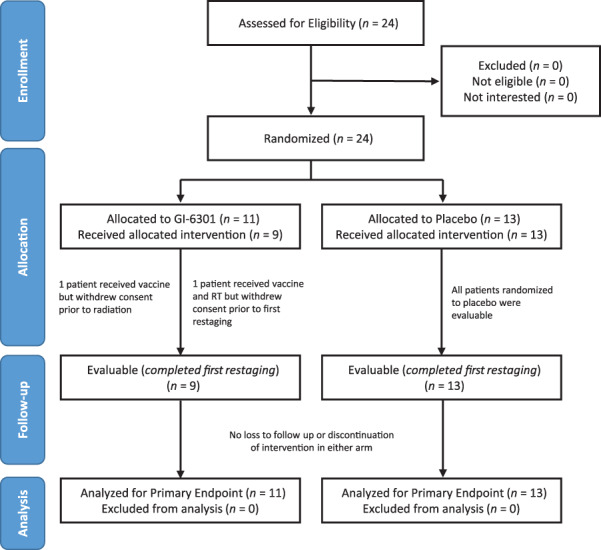
Consort flow diagram. Note that all patients who were assessed for eligibility on this protocol were enrolled and randomized. A separate National Cancer Institute screening protocol is used for the general screening of new patients, but these data are not reported. Of 24 patients who gave signed informed consent and enrolled on study, 11 were randomized to the interventional (vaccine) arm and 13 to the placebo arm. Two patients on the vaccine arm left the study before first restaging and were considered not evaluable; these two patients were included in the intention‐to‐treat analysis. Patients who received placebo were allowed to cross over to vaccine after progression, but data postcrossover are not part of the primary efficacy analysis. Abbreviation: RT, radiation therapy.
Immune Assays
Research blood samples for immune correlatives were collected at baseline, after two vaccine doses, after radiation, and after nine vaccine doses. Immune correlative studies were performed by the NCI's Laboratory of Tumor Immunology and Biology. Peripheral blood mononuclear cells (PBMCs) collected from patients before and during therapy were assessed for T‐cell responses against brachyury, the target antigen encoded by the vaccine, as well as against mucin‐1 (MUC1) and carcinoembrionic antigen (CEA), antigens not encoded by the vaccine. This assay, which has been previously described, involves stimulating PBMCs with overlapping peptide pools and measuring CD4+ and CD8+ T cells for the production of cytokines (interferon [IFN]‐γ, tumor necrosis factor [TNF]‐α, interleukin [IL]‐2) or for a degranulation marker (CD107a) by flow cytometry [24]. Peptide pools encoding human leukocyte antigen (HLA) and CEFT (a mixture of peptides of cytomegalovirus, Epstein‐Barr virus, influenza, and tetanus toxin) served as negative and positive controls, respectively. The absolute number of viable CD4+ or CD8+ T cells producing cytokine or positive for CD107a at the end of the expansion was calculated per 1 × 10⁶ cells plated at the start of the stimulation assay. The background signal (obtained with the HLA peptide pool) and any value obtained prior to treatment were subtracted from those obtained after treatment ([post‐tumor‐associated antigens (TAA) – post‐HLA] – [pre‐TAA – pre‐HLA]). Following this calculation, a patient was scored as developing any response to a TAA if a patient had more than 250 CD4+ or CD8+ T cells that produced IFN‐γ, TNF‐α, or IL‐2 or were positive for CD107a at the end of the stimulation assay per 1 × 10⁶ cells that were plated at the start of the assay. Multifunctional T cells, defined as CD4+ or CD8+ T cells expressing 2 or more of IFN‐γ, TNF‐α, IL‐2, or CD107a, were also evaluated. Patients were classified as developing a multifunctional T‐cell response during therapy if there was a more than threefold increase after versus before therapy.
Statistical Analysis
Prespecified statistical assumptions estimated a 5% 24‐month objective response by RECIST 1.1 in the placebo‐RT arm and a 30% response in the vaccine‐RT arm. To detect a difference between 5% and 30% with 80% power using a 0.10 α level one‐tailed Fisher's exact test, 50 evaluable subjects (25 per arm) were planned. PFS was determined using the Kaplan‐Meier method from on‐study date until the date of progression or death without progression or censored at last follow‐up if alive without progression. OS was determined from the on‐study date until the date of death or last follow‐up. Analyses were performed on an intention‐to‐treat basis. The statistician created randomized treatment assignments using blocked randomization, stratified for fractionation (standard vs. hypofractionation) and prior radiation (proton vs. photon). All statistical analyses were done using SAS version 9.4 (SAS Institute, Inc., Cary, NC). Data were last updated on October 27, 2020.
Results
Patient Population
Between May 2015 and September 2019, 24 patients were randomized and treated at the National Institutes of Health Clinical Center in Bethesda, MD. Eleven patients were randomized to vaccine and 13 were randomized to placebo. Two of the 11 patients in the vaccine arm received at least one cycle of vaccine but were not present for restaging and thus were not evaluable for response evaluation. One of these two patients received the first cycle of vaccine but withdrew consent prior to RT; the second patient received the first cycle of vaccine, RT, and the second cycle of vaccine but withdrew from the study prior to first restaging. The overall patient population included 16 men (67%) and 8 women (33%), with a median age of 61 years (range, 30–76). The majority of patients were White (88%) and non‐Hispanic (96%). All possible primary chordoma tumor sites were represented, the most common being clival (38%) followed by sacral (33%), spinal (21%), retroclival (4%), and occipital (4%). The median duration on study was 570 days (range, 76–1,506). Baseline characteristics are summarized in Table 1.
Table 1.
Patient baseline characteristics
| Characteristics | Overall | GI‐6301 (vaccine) | Placebo |
|---|---|---|---|
| Gender, n (%) | |||
| Male | 16 (67) | 8 (73) | 8 (62) |
| Female | 8 (33) | 3 (27) | 5 (38) |
| Age, median (range), yr | 61 (30–76) | 60 (30–75) | 61 (48–76) |
| Stage n (%) | |||
| Advanced, unresectable | 24 (100) | 11 (100) | 13 (100) |
| ECOG performance status, n (%) | |||
| 0 | 13 (54) | 5 (45) | 8 (62) |
| 1 | 11 (46) | 6 (55) | 5 (38) |
| Ethnicity, n (%) | |||
| Hispanic or Latino | 1 (4) | 0 (0) | 1 (8) |
| Not Hispanic or Latino | 23 (96) | 11 (100) | 12 (92) |
| Race, n (%) | |||
| American Indian or Alaskan Native | 1 (4) | 0 (0) | 1 (8) |
| Asian | 1 (4) | 0 (0) | 1 (8) |
| Black or African heritage | 1 (4) | 1 (9) | 0 (0) |
| White | 21 (88) | 10 (91) | 11 (85) |
| Tumor location, n (%) | |||
| Clival | 9 (38) | 3 (27) | 6 (46) |
| Retroclival | 1 (4) | 1 (9) | 0 (0) |
| Occipital | 1 (4) | 1 (9) | 0 (0) |
| Spinal (cervical, thoracic, lumbar) | 5 (21) | 3 (27) | 2 (15) |
| Sacral | 8 (33) | 3 (27) | 5 (38) |
Safety
GI‐6301 was well tolerated, with no observed dose‐limiting toxicities. Treatment‐related adverse events (TRAEs) for the vaccine and placebo arms are summarized in Tables 2 and 3, respectively. The most common TRAEs were decreased lymphocyte count (n = 19), injection‐site reactions (n = 16), and fatigue (n = 13). Serious TRAEs (Table 4) related to RT included nausea and emesis (n = 2), fatigue (n = 2), dehydration (n = 2), diarrhea (n = 1), radiation necrosis (n = 1), stroke (n = 1), and sepsis (n = 1). No serious adverse events (SAEs) were attributed to vaccine.
Table 2.
Adverse events in the vaccine arm
| Adverse events, GI‐6301, all cycles | NC/NA, % | Grade 1, % | Grade 2, % | Grade 3, % | Grade 4, % | Grade 5, % | All grades, % |
|---|---|---|---|---|---|---|---|
| Injection‐site reaction | 9 | 64 | 18 | 9 | 0 | 0 | 91 |
| Lymphocyte count decreased | 18 | 18 | 27 | 36 | 0 | 0 | 82 |
| Fatigue | 45 | 27 | 9 | 18 | 0 | 0 | 55 |
| Mucositis oral | 64 | 0 | 36 | 0 | 0 | 0 | 36 |
| Anemia | 73 | 27 | 0 | 0 | 0 | 0 | 27 |
| Dermatitis radiation | 73 | 18 | 9 | 0 | 0 | 0 | 27 |
| Diarrhea | 73 | 9 | 0 | 18 | 0 | 0 | 27 |
| Dry mouth | 73 | 9 | 18 | 0 | 0 | 0 | 27 |
| Nausea | 73 | 9 | 9 | 9 | 0 | 0 | 27 |
| White blood cells decreased | 73 | 27 | 0 | 0 | 0 | 0 | 27 |
| Anorexia | 82 | 9 | 0 | 9 | 0 | 0 | 18 |
| Dysgeusia | 82 | 0 | 18 | 0 | 0 | 0 | 18 |
| Headache | 82 | 18 | 0 | 0 | 0 | 0 | 18 |
| Oral pain | 82 | 18 | 0 | 0 | 0 | 0 | 18 |
| Paresthesia | 82 | 18 | 0 | 0 | 0 | 0 | 18 |
| Sore throat | 82 | 18 | 0 | 0 | 0 | 0 | 18 |
| Vomiting | 82 | 9 | 0 | 9 | 0 | 0 | 18 |
| Weight loss | 82 | 9 | 0 | 9 | 0 | 0 | 18 |
| Anal hemorrhage | 91 | 9 | 0 | 0 | 0 | 0 | 9 |
| Chills | 91 | 9 | 0 | 0 | 0 | 0 | 9 |
| Cough | 91 | 9 | 0 | 0 | 0 | 0 | 9 |
| Dehydration | 91 | 0 | 0 | 9 | 0 | 0 | 9 |
| Dysphagia | 91 | 0 | 0 | 9 | 0 | 0 | 9 |
| Erythema multiforme | 91 | 9 | 0 | 0 | 0 | 0 | 9 |
| Fall | 91 | 9 | 0 | 0 | 0 | 0 | 9 |
| Fever | 91 | 9 | 0 | 0 | 0 | 0 | 9 |
| Flatulence | 91 | 9 | 0 | 0 | 0 | 0 | 9 |
| Flu‐like symptoms | 91 | 9 | 0 | 0 | 0 | 0 | 9 |
| Hiccups | 91 | 9 | 0 | 0 | 0 | 0 | 9 |
| Hypothyroidism | 91 | 9 | 0 | 0 | 0 | 0 | 9 |
| Infections and infestations, other | 91 | 9 | 0 | 0 | 0 | 0 | 9 |
| Malaise | 91 | 9 | 0 | 0 | 0 | 0 | 9 |
| Mucosal infection | 91 | 0 | 9 | 0 | 0 | 0 | 9 |
| Myalgia | 91 | 9 | 0 | 0 | 0 | 0 | 9 |
| Nasal congestion | 91 | 0 | 9 | 0 | 0 | 0 | 9 |
| Neck edema | 91 | 0 | 9 | 0 | 0 | 0 | 9 |
| Neck pain | 91 | 9 | 0 | 0 | 0 | 0 | 9 |
| Platelet count decreased | 91 | 9 | 0 | 0 | 0 | 0 | 9 |
| Postnasal drip | 91 | 9 | 0 | 0 | 0 | 0 | 9 |
| Presyncope | 91 | 0 | 9 | 0 | 0 | 0 | 9 |
| Rash acneiform | 91 | 9 | 0 | 0 | 0 | 0 | 9 |
| Salivary duct inflammation | 91 | 0 | 9 | 0 | 0 | 0 | 9 |
| Sepsis | 91 | 0 | 0 | 0 | 9 | 0 | 9 |
| Sinusitis | 91 | 0 | 9 | 0 | 0 | 0 | 9 |
| Stroke | 91 | 0 | 0 | 9 | 0 | 0 | 9 |
| Voice alteration | 91 | 9 | 0 | 0 | 0 | 0 | 9 |
Highest adverse event grade is noted for each patient. Adverse events at least possibly related to research (vaccine and/or radiation therapy).
Abbreviation: NC/NA, no change from baseline/no adverse event.
Table 3.
Adverse events in the placebo arm
| All cycles | NC/NA, % | Grade 1, % | Grade 2, % | Grade 3, % | Grade 4, % | Grade 5, % | All grades, % |
|---|---|---|---|---|---|---|---|
| Lymphocyte count decreased | 23 | 23 | 46 | 8 | 0 | 0 | 77 |
| Fatigue | 46 | 38 | 15 | 0 | 0 | 0 | 54 |
| Injection‐site reaction | 54 | 46 | 0 | 0 | 0 | 0 | 46 |
| Anemia | 77 | 23 | 0 | 0 | 0 | 0 | 23 |
| Headache | 77 | 15 | 8 | 0 | 0 | 0 | 23 |
| Nausea | 77 | 15 | 8 | 0 | 0 | 0 | 23 |
| Back pain | 85 | 0 | 8 | 8 | 0 | 0 | 15 |
| Dry mouth | 85 | 15 | 0 | 0 | 0 | 0 | 15 |
| Dysgeusia | 85 | 8 | 8 | 0 | 0 | 0 | 15 |
| Flu‐like symptoms | 85 | 15 | 0 | 0 | 0 | 0 | 15 |
| Hearing impaired | 85 | 0 | 8 | 8 | 0 | 0 | 15 |
| Malaise | 85 | 15 | 0 | 0 | 0 | 0 | 15 |
| Pain | 85 | 15 | 0 | 0 | 0 | 0 | 15 |
| Paresthesia | 85 | 8 | 8 | 0 | 0 | 0 | 15 |
| Vomiting | 85 | 15 | 0 | 0 | 0 | 0 | 15 |
| White blood cells decreased | 85 | 15 | 0 | 0 | 0 | 0 | 15 |
| Arthralgia | 92 | 8 | 0 | 0 | 0 | 0 | 8 |
| Burn | 92 | 8 | 0 | 0 | 0 | 0 | 8 |
| Constipation | 92 | 8 | 0 | 0 | 0 | 0 | 8 |
| Dermatitis radiation | 92 | 8 | 0 | 0 | 0 | 0 | 8 |
| Dizziness | 92 | 0 | 8 | 0 | 0 | 0 | 8 |
| Dysphagia | 92 | 0 | 8 | 0 | 0 | 0 | 8 |
| Ear and labyrinth disorders, other | 92 | 8 | 0 | 0 | 0 | 0 | 8 |
| Edema limbs | 92 | 8 | 0 | 0 | 0 | 0 | 8 |
| Fall | 92 | 8 | 0 | 0 | 0 | 0 | 8 |
| Hypertension | 92 | 0 | 0 | 8 | 0 | 0 | 8 |
| Hyperthyroidism | 92 | 8 | 0 | 0 | 0 | 0 | 8 |
| Hyponatremia | 92 | 8 | 0 | 0 | 0 | 0 | 8 |
| Hypothyroidism | 92 | 0 | 8 | 0 | 0 | 0 | 8 |
| Mucositis oral | 92 | 0 | 8 | 0 | 0 | 0 | 8 |
| Musculoskeletal and connective tissue disorder, other | 92 | 8 | 0 | 0 | 0 | 0 | 8 |
| Myalgia | 92 | 8 | 0 | 0 | 0 | 0 | 8 |
| Nasal congestion | 92 | 8 | 0 | 0 | 0 | 0 | 8 |
| Platelet count decreased | 92 | 8 | 0 | 0 | 0 | 0 | 8 |
| Rash acneiform | 92 | 8 | 0 | 0 | 0 | 0 | 8 |
| Skin and subcutaneous tissue disorders, other | 92 | 0 | 8 | 0 | 0 | 0 | 8 |
| Skin induration | 92 | 0 | 8 | 0 | 0 | 0 | 8 |
| Sore throat | 92 | 0 | 8 | 0 | 0 | 0 | 8 |
| Stroke | 92 | 0 | 0 | 8 | 0 | 0 | 8 |
| Urinary retention | 92 | 8 | 0 | 0 | 0 | 0 | 8 |
| Weight loss | 92 | 0 | 8 | 0 | 0 | 0 | 8 |
Highest adverse event grade is noted for each patient. Adverse events at least possibly related to research (vaccine and/or radiation therapy).
Abbreviation: NC/NA, no change from baseline/no adverse event.
Table 4.
Serious adverse events, both arms
| Name | Grade | Attribution |
|---|---|---|
| Fatigue | 3 | Definite |
| Nausea | 3 | Possible |
| Vomiting | 3 | Possible |
| Dehydration | 3 | Probable |
| Diarrhea | 3 | Probable |
| Radiation necrosis | 3 | Probable |
| Stroke | 3 | Probable |
| Sepsis | 4 | Possible |
All serious adverse events were felt to be related to radiation treatment, not vaccine.
Response to Therapy
Primary endpoint results at time of interim analysis are shown in Table 5. The best response per RECIST v1.1 in the overall patient population included two PRs (9%) but no CRs (0%). Stable disease (SD) was observed in seven patients (29%), and progressive disease (PD) was observed in 13 patients (54%). There was one PR in the vaccine arm (9%) and one PR in the placebo arm (8%). There was no difference in the primary endpoint of ORR between the study arms.
Table 5.
Study results
| Response per RECIST 1.1 | Overall, n (%) | GI‐6301 (vaccine), n (%) | Placebo, n (%) |
|---|---|---|---|
| PD | 13 (54) | 5 (45) | 8 (62) |
| SD | 7 (29) | 3 (27) | 4 (31) |
| ORR (PR + CR) | 2 (8) | 1 (9) | 1 (8) |
| PR | 2 (8) | 1 (9) | 1 (8) |
| CR | 0 (0) | 0 (0) | 0 (0) |
| Nonevaluable | 2 (8) | 2 (18) | 0 (0) |
Abbreviations: CR, complete response; ORR, overall response rate; PD, progressive disease; PR, partial response; SD, stable disease.
Among patients receiving blinded vaccine, the median number of cycles of vaccine received was six (range, 1–13 cycles) and median time on study was 434 days (range, 76–978). In the vaccine arm, PD was noted in five patients (45%), four with radiographic progression and one with clinical progression. SD was noted in three patients (27%); two patients with SD came off study early because of patient request (i.e., to pursue fertility) and one patient had ongoing SD at the time of study closure. No patients on the vaccine arm died while on study, but eight patients expired after coming off study (seven as a natural consequence of terminal illness and one after accidentally aspirating food). Two patients on vaccine arm were not evaluable, as they withdrew from the study prior to first restaging. These patients were not censored and were considered to have progressed at time of study withdrawal.
Among patients receiving placebo, the median number of cycles of placebo received was eight (range, 1–13 cycles), and the median time on study was 774 days (range, 76–978 days). In the placebo arm, PD was noted in eight patients (62%), five with radiographic progression and three with clinical progression. All eight patients with PD elected to cross over to treatment with unblinded vaccine at time of progression. Although response data following crossover was not part of the interim analysis, no PRs were observed among the eight patients who received unblinded crossover vaccine. SD was noted in four patients (31%), all with ongoing SD at time of study closure. No patients on the placebo arm died while on study, but four patients died after coming off study as a natural consequence of terminal illness. There was no attrition on the placebo arm, and no patients were censored. Individual patient‐level response data are presented in supplemental online Fig. 2.
In the interventional arm, median PFS for vaccine was 20.6 months (95% confidence interval [CI], 5.7–37.5 months), 12‐month PFS for vaccine was 72.7% (95% CI, 37.1–90.3%), and 24‐month PFS for vaccine was 39.0% (95% CI, 10.6–67.3%). In the control arm, median PFS for placebo was 25.9 months (95% CI, 9.2–30.8 months), 12‐month PFS for placebo was 76.9% (95% CI, 44.2–91.9%), and 24‐month PFS for placebo was 57.7% (95% CI, 25.6–80.1%). There was no difference in PFS between the arms (p = .97). PFS hazard ratio for vaccine versus placebo was 1.02 (95% CI, 0.38–2.71). Kaplan‐Meier survival analysis is shown in Fig. 2A. Median OS for vaccine was 37.5 months (95% CI, 21.6–50.6 months); median OS for placebo was not reached. OS hazard ratio for vaccine versus placebo was 2.65 (95% CI, 0.79–8.81). There was little difference in OS between the arms (p = .10), although the trend favored placebo. Kaplan‐Meier survival analysis is shown in Fig. 2B.
Figure 2.
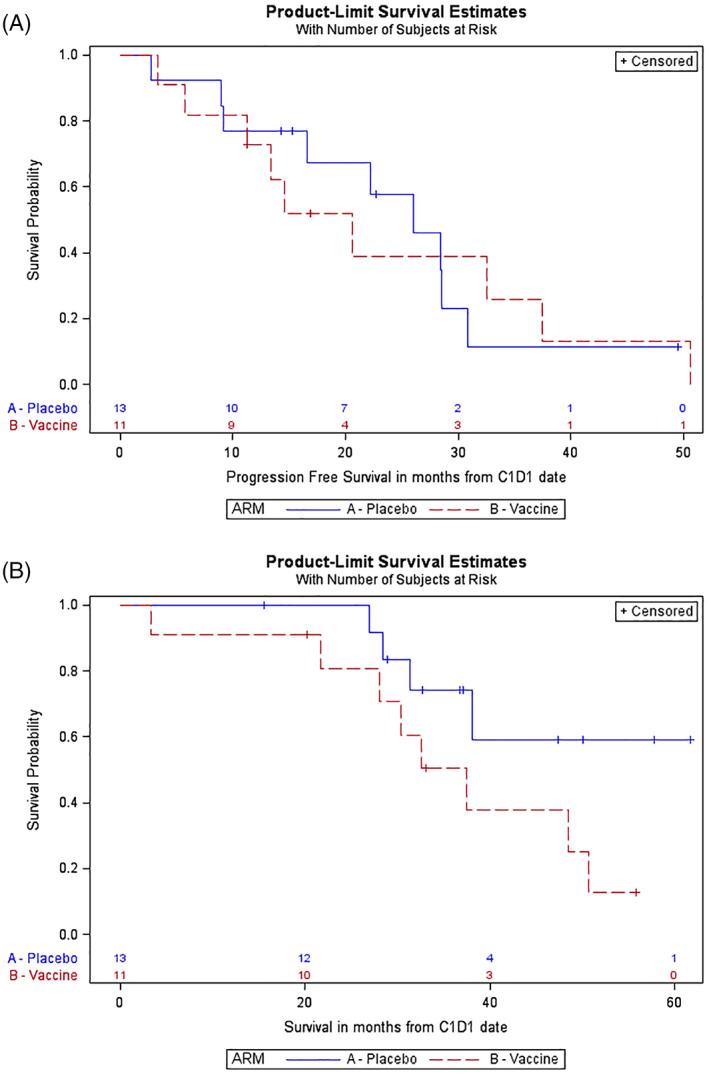
(A): Kaplan‐Meier curve of progression‐free survival (PFS). In the interventional arm (vaccine), median PFS was 20.6 months (95% confidence interval [CI], 5.7–37.5 months), 12‐month PFS was 72.7% (95% CI, 37.1–90.3 months), and 24‐month PFS was 39.0% (95% CI: 10.6–67.3%). In the control (placebo) arm, median PFS was 25.9 months (95% CI, 9.2–30.8 months), 12‐month PFS was 76.9% (95% CI, 44.2–91.9%), and 24‐month PFS was 57.7% (95% CI, 25.6–80.1%). There was no difference between the arms (p = .97). Hazard ratio (PFS) for vaccine versus placebo was 1.02 (95% CI, 0.38–2.71). (B): Kaplan‐Meier curve of overall survival (OS). In the interventional arm (vaccine), median OS was 37.5 months (95% CI, 21.6–50.6 months). In the control (placebo) arm, median OS was not reached. Hazard ratio (OS) for vaccine versus placebo was 2.65 (95% CI, 0.79–8.81). There was little difference between the arms (p = .10), but results somewhat favor placebo.
Although the study did not show a difference in the primary endpoint of ORR per RECIST v1.1, RECIST assessment is limited by its ability to detect small changes in chordoma or account for irregularly shaped tumor burden [35, 36, 37, 38, 39]. Volumetric segmentation is a newer, three‐dimensional assessment technique using computed tomography or magnetic resonance imaging that may more accurately predict clinical outcomes in chordoma earlier than RECIST [40]. Because volumetric segmentation is resource‐intensive, we performed it on two patients with confirmed RECIST responses. The first patient with a confirmed PR was a 60‐year‐old man with sacrococcygeal chordoma, randomized to the vaccine arm. Assessment per RECIST v1.1 showed the sacral tumor decreased 30% in size from 9.9 cm to 6.9 cm and crossed the PR threshold at cycle 7 restaging. Retrospective volumetric assessment showed the tumor shrinking more rapidly, with a 52% reduction by cycle 3, a 58% reduction by cycle 6, and a 66% reduction by cycle 7. The second patient with a confirmed PR was a 48‐year‐old woman with clival chordoma, randomized to the placebo arm. Assessment per RECIST v1.1 showed that the clival lesion decreased 40% in size from 3 cm to 1.8 cm and crossed the PR threshold at cycle 8 restaging. Retrospective volumetric assessment showed that the tumor underwent a period of initial growth (+67.8% at cycle 3) before decreasing in size. By cycle 8, the 40% decrease in volume mirrored the RECIST response. Although volumetric measurement may have utility in detecting early response or pseudoprogression, this assessment was only exploratory in this study (supplemental online Fig. 3).
Immune Assays
PBMC quality was evaluated by measuring T‐cell responses against a pool of viral antigens including CMV, EBV, flu, and tetanus toxin and was shown to be good, with the majority of samples tested (70/77, 91%) reacting to the viral peptides. Prior to therapy, 62% of patients had brachyury‐specific T cells, 43% had T cells against MUC1, and 62% had T cells targeting CEA. The presence of preexisting T‐cell responses at baseline did not correspond with the development of TAA responses during therapy. During the course of therapy, most patients developed T‐cell responses against brachyury, MUC1, and CEA, regardless of treatment arm (Fig. 3). TAA responses developed after two, three, and nine administrations of vaccine or placebo are shown in individual patients in supplemental online Fig. 4. There was no difference between treatment arms in the magnitude of T cells developed against any of the antigens at any of the time points tested during therapy.
Figure 3.
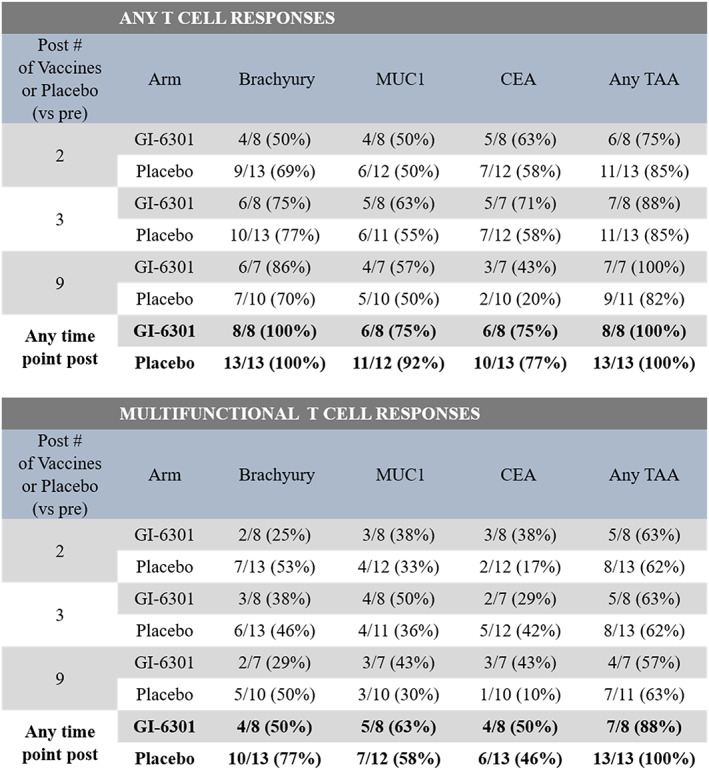
Frequency of patients developing T‐cell responses against the TAAs brachyury, MUC1, and CEA during therapy. Immune responses were calculated by comparing the absolute number of CD4+ or CD8+ T cells producing cytokine (IFN‐γ, TNF‐α, IL‐2) or positive for CD107a per 1 × 10⁶ PBMCs plated at the start of the in vitro stimulation assay. For analysis of the development of any T‐cell response, background (obtained with the negative control peptide pool, human leukocyte antigen [HLA]) and any response prior to therapy were subtracted: [TAA after therapy – HLA after therapy] – [TAA before therapy – HLA before therapy]; the frequency of patients developing any immune response (>250 positive cells) after therapy is indicated. Multifunctional T‐cell responses, or CD4+ and CD8+ T cells expressing two or more of IFN‐γ, TNF‐α, IL‐2, or CD107a, were also evaluated. The frequency of patients developing a more than threefold increase in multifunctional T cells after therapy is shown. Abbreviations: TAA, tumor‐associated antigen.
Discussion
With an incidence of 300 cases per year and prevalence of 3,000 patients in the U.S., chordoma is a very rare disease [1, 2, 3]. Surgery is the primary treatment modality, but when not feasible, standard treatment is definitive RT [41, 42, 43, 44, 45]. Surgery and RT are the standard of care only for localized disease, as there are no effective therapies for advanced or metastatic disease. As of September 2020, no systemic therapy has received approval by the U.S. Food and Drug Administration for chordoma, highlighting the urgent need for new therapies.
Expression of brachyury by chordoma has been identified as a potential target for treatment [4, 5], because brachyury is expressed in 100% of chordomas. Brachyury has been shown to mediate EMT, along with other factors such as IL‐8 and TGF‐β. It confers a mesenchymal phenotype onto tumor cells, as well as migratory and invasive qualities, and enhances tumor progression [7, 11, 12]. Preclinical studies in both murine models in vivo and human tumor cells in vitro have demonstrated that RT can induce inflammation, causing an influx of immune cells and subsequent immunogenic modulation such as higher levels of MHC–peptide complexes and death receptors, resulting in greater antitumor effects [25]. These findings prompted this clinical trial evaluating the combination of vaccine and RT in chordomas.
The trial reported here was the first randomized, placebo‐controlled phase II trial in chordoma. The primary objective was to assess the synergistic effect of vaccine plus RT, measured as ORR at irradiated lesions at 24 months post‐treatment. The vaccine was well tolerated, with no dose reductions or treatment discontinuation. Observed toxicities were attributed to standard‐of‐care RT, and no SAEs were attributed to the vaccine. Vaccine‐related toxicities were mild and consistent with expected vaccine toxicities such as mild fatigue and injection‐site reaction. The only grade 2 toxicities attributed to vaccine were injection‐site reactions in seven patients and decreased absolute lymphocyte count in two patients who had grade 1 decreased absolute lymphocyte count at baseline. TRAEs included nausea and emesis (n = 2), fatigue (n = 2), dehydration (n = 2), diarrhea (n = 1), radiation necrosis (n = 1), stroke (n = 1), and sepsis (n = 1), all related to standard‐of‐care RT. Because of low patient accrual, we conducted an unplanned interim futility analysis which showed that the level of activity in the vaccine arm was lower than anticipated. The study was terminated for low conditional power to detect a difference in the primary endpoint.
Although the study was not powered to detect a difference in the primary (ORR) or secondary endpoints (PFS, OS) at this interim analysis, the observed trends were not favorable. Using Kaplan‐Meier methodology, intention‐to‐treat analysis did not show a difference in median PFS or OS between the two arms.
Immune correlative studies showed interesting results. Prior to therapy, 62% of patients already had brachyury‐specific T cells, 43% had T cells against MUC1, and 62% had T cells targeting CEA, suggesting anticancer immunity prior to vaccination that was not sufficient to provide clinical benefits. The presence of preexisting T‐cell responses did not correspond with the development of TAA responses during therapy. During therapy, the majority of patients receiving GI‐6301 in combination with radiation developed peripheral T‐cell responses against brachyury, as well as the cascade antigens MUC1, and CEA; however, it should be noted that the majority of patients receiving placebo in combination with radiation also developed peripheral T‐cell responses to these same antigens during the course of their treatment. There was no difference between treatment arms in the magnitude of T cells developed against any of the antigens at any of the time points tested during therapy. In the phase I trial of GI‐6301, patients were assessed for T‐cell responses to brachyury after six vaccinations; similar to the findings in the current study, the majority of patients developed brachyury‐specific T cells after versus before vaccination [24]. However, in the phase I trial, there was no placebo control, and patients did not receive GI‐6301 in combination with radiation.
Conclusion
This is the first trial to investigate the effects of GI‐6301 plus RT in patients with chordoma. Although GI‐6301 was shown to be safe, the observed clinical outcomes and immune correlative data did not show that the yeast‐brachyury vaccine enhanced in vivo efficacy of RT in patients with chordoma. The primary endpoint was not met, and this trial was not powered to evaluate PFS or OS. As of September 2020, a similar phase II clinical trial (NCT03595228) of a modified vaccinia Ankara viral vector‐based vaccine expressing brachyury (BN‐Brachyury; Bavarian Nordic) in combination with RT in chordoma remains active. Pending the results of that study, the utility of brachyury‐specific therapeutic cancer vaccines in chordoma remains unclear. Future trials will evaluate potential synergies between brachyury‐targeting vaccines and other immuno‐oncology therapies.
Author Contributions
Conception/design: Christopher R. Heery, Seth M. Steinberg, Jeffrey Schlom, James L. Gulley
Provision of study material or patients: Peter Joseph DeMaria, Marijo Bilusic, Deric M. Park, Christopher R. Heery, Renee N. Donahue, Ravi A. Madan, Julius Strauss, Jennifer L. Marté, Jeffrey Schlom, Mark R. Gilbert, James L. Gulley
Collection and/or assembly of data: Peter Joseph DeMaria, Marijo Bilusic, Deric M. Park, Christopher R. Heery, Renee N. Donahue, Ravi A. Madan, Mohammad Hadi Bagheri, Julius Strauss, Victoria Shen, Jennifer L. Marté, Seth M. Steinberg, Jeffrey Schlom, Mark R. Gilbert, James L. Gulley
Data analysis and interpretation: Peter Joseph DeMaria, Marijo Bilusic, Deric M. Park, Christopher R. Heery, Renee N. Donahue, Ravi A. Madan, Mohammad Hadi Bagheri, Julius Strauss, Jennifer L. Marté, Seth M. Steinberg, Jeffrey Schlom, Mark R. Gilbert, James L. Gulley
Manuscript writing: Peter Joseph DeMaria, Marijo Bilusic, Deric M. Park, Christopher R. Heery, Renee N. Donahue, Ravi A. Madan, Mohammad Hadi Bagheri, Julius Strauss, Jennifer L. Marté, Seth M. Steinberg, Jeffrey Schlom, Mark R. Gilbert, James L. Gulley
Final approval of manuscript: Peter Joseph DeMaria, Marijo Bilusic, Deric M. Park, Christopher R. Heery, Renee N. Donahue, Ravi A. Madan, Mohammad Hadi Bagheri, Julius Strauss, Victoria Shen, Jennifer L. Marté, Seth M. Steinberg, Jeffrey Schlom, Mark R. Gilbert, James L. Gulley
Disclosures
Christopher R. Heery: Precision Biosciences (E). The other authors indicated no financial relationships.
(C/A) Consulting/advisory relationship; (RF) Research funding; (E) Employment; (ET) Expert testimony; (H) Honoraria received; (OI) Ownership interests; (IP) Intellectual property rights/inventor/patent holder; (SAB) Scientific advisory board
Supporting information
See http://www.TheOncologist.com for supplemental material available online.
Figure S1 Study schema. Following randomization, blinded vaccine was administered on cycle 1 days 1, 15, and 29. After completing the first cycle of treatment, proton or photon RT was given at the discretion of the patient's local radiation oncologist. Post‐RT, patients returned to the NIH Clinical Center where they continued to receive blinded vaccine until progression.
Figure S2. Tumor Response per RECIST 1.1. This spider plot of RECIST v1.1 measurement data shows percentage change in the targeted lesion sum over time, represented by cycle number. Patients on the vaccine arm are shown in green; patients on the placebo arm are shown in red. No observable trend is identified.
Figure S3. 2D RECIST vs 3D Volumetric Measurement of Chordomas. Comparison of 2‐dimensional (RECIST) and 3‐dimensional volumetric tumor measurement. Images of sacrococcygeal chordoma from patient who developed partial response on vaccine arm.
Figure S4. Immune analysis of patient level antigen‐specific data. Absolute number of CD4+ or CD8+ T cells producing cytokine (IFNg, TNFa, IL‐2) or positive for CD107a per 1 × 10⁶ PBMCs plated at the start of the in vitro stimulation assay. Numbers in bold are positive responses after vs before therapy and following subtraction of background [TAA after therapy – HLA after therapy] – [TAA before therapy – HLA before therapy] >250 per 1 × 10⁶ PBMCs. Grey rows indicate time points at which PBMCs were insufficient for analysis. In the current study, antigen‐specific responses fluctuated in many patients over time. This phenomenon has been observed in numerous cancer vaccine trials [41, 42, 43, 44, 45] and may be due to T‐cell trafficking into and out of the tumor, as well as homeostatic regulation by regulatory T cells to suppress an immune response against self‐antigens.
Acknowledgments
This research was supported by the Intramural Research Program of the Center for Cancer Research, National Cancer Institute, National Institutes of Health. We acknowledge and thank the patients, associated study staff, and sponsor for their support of this study. The authors thank Bonnie L. Casey for editorial assistance in the preparation of this manuscript.
The datasets analyzed during the current study are available from the corresponding author on reasonable request.
All patient data used in this analysis came from patients enrolled on a phase II clinical trial, which was reviewed by the Center for Cancer Research (CCR), National Cancer Institute (NCI) Institutional Review Board (IRB). All patients were informed of the risks and benefits of trial participation and publication of clinical data. All patients reviewed and signed informed consent, approved by the IRB of the CCR/NCI, after having all questions answered.
Disclosures of potential conflicts of interest may be found at the end of this article.
References
- 1. Yu E, Koffer PP, DiPetrillo TA et al. Incidence, treatment, and survival patterns for sacral chordoma in the United States, 1974–2011. Front Oncol 2016;6:203. [DOI] [PMC free article] [PubMed] [Google Scholar]
- 2. McMaster ML, Goldstein AM, Bromley CM et al. Chordoma: Incidence and survival patterns in the United States, 1973‐1995. Cancer Causes Control 2001;12:1–11. [DOI] [PubMed] [Google Scholar]
- 3. Chambers KJ, Lin DT, Meier J et al. Incidence and survival patterns of cranial chordoma in the United States. Laryngoscope 2014;124:1097–1102. [DOI] [PubMed] [Google Scholar]
- 4. Vujovic S, Henderson S, Presneau N et al. Brachyury, a crucial regulator of notochordal development, is a novel biomarker for chordomas. J Pathol 2006;209:157–165. [DOI] [PubMed] [Google Scholar]
- 5. Tirabosco R, Mangham DC, Rosenberg AE et al. Brachyury expression in extra‐axial skeletal and soft tissue chordomas: A marker that distinguishes chordoma from mixed tumor/myoepithelioma/parachordoma in soft tissue. Am J Surg Pathol 2008;32:572–580. [DOI] [PubMed] [Google Scholar]
- 6. Presneau N, Shalaby A, Ye H et al. Role of the transcription factor T (brachyury) in the pathogenesis of sporadic chordoma: A genetic and functional‐based study. J Pathol 2011;223:327–335. [DOI] [PubMed] [Google Scholar]
- 7. Palena C, Polev DE, Tsang KY et al. The human T‐box mesodermal transcription factor Brachyury is a candidate target for T‐cell‐mediated cancer immunotherapy. Clin Cancer Res 2007;13:2471–2478. [DOI] [PubMed] [Google Scholar]
- 8. Kispert A, Koschorz B, Herrmann BG. The T protein encoded by Brachyury is a tissue‐specific transcription factor. EMBO J 1995;14:4763–4772. [DOI] [PMC free article] [PubMed] [Google Scholar]
- 9. Thiery JP, Sleeman JP. Complex networks orchestrate epithelial‐mesenchymal transitions. Nat Rev Mol Cell Biol 2006;7:131–142. [DOI] [PubMed] [Google Scholar]
- 10. Kalluri R, Weinberg RA. The basics of epithelial‐mesenchymal transition. J Clin Invest 2009;119:1420–1428. [DOI] [PMC free article] [PubMed] [Google Scholar]
- 11. Fernando RI, Litzinger M, Trono P et al. The T‐box transcription factor Brachyury promotes epithelial‐mesenchymal transition in human tumor cells. J Clin Invest 2010;120:533–544. [DOI] [PMC free article] [PubMed] [Google Scholar]
- 12. Du R, Wu S, Lv X et al. Overexpression of brachyury contributes to tumor metastasis by inducing epithelial‐mesenchymal transition in hepatocellular carcinoma. J Exp Clin Cancer Res 2014;33:105. [DOI] [PMC free article] [PubMed] [Google Scholar]
- 13. Gravdal K, Halvorsen OJ, Haukaas SA et al. A switch from E‐cadherin to N‐cadherin expression indicates epithelial to mesenchymal transition and is of strong and independent importance for the progress of prostate cancer. Clin Cancer Res 2007;13:7003–7011. [DOI] [PubMed] [Google Scholar]
- 14. Onder TT, Gupta PB, Mani SA et al. Loss of E‐cadherin promotes metastasis via multiple downstream transcriptional pathways. Cancer Res 2008;68:3645–3654. [DOI] [PubMed] [Google Scholar]
- 15. Lambert M, Jambon S, Depauw S et al. Targeting transcription factors for cancer treatment. Molecules 2018;23:1479. [DOI] [PMC free article] [PubMed] [Google Scholar]
- 16. Ardiani A, Higgins JP, Hodge JW. Vaccines based on whole recombinant Saccharomyces cerevisiae cells. FEMS Yeast Res 2010;10:1060–1069. [DOI] [PMC free article] [PubMed] [Google Scholar]
- 17. Nielsen J. Production of biopharmaceutical proteins by yeast: Advances through metabolic engineering. Bioengineered 2013;4:207–211. [DOI] [PMC free article] [PubMed] [Google Scholar]
- 18. Franzusoff A, Duke RC, King TH et al. Yeasts encoding tumour antigens in cancer immunotherapy. Expert Opin Biol Ther 2005;5:565–575. [DOI] [PubMed] [Google Scholar]
- 19. Haller AA, Lauer GM, King TH et al. Whole recombinant yeast‐based immunotherapy induces potent T cell responses targeting HCV NS3 and Core proteins. Vaccine 2007;25:1452–1463. [DOI] [PubMed] [Google Scholar]
- 20. Richards DA, Muscarella P, Ritch PS, Fisher WE, Flynn PJ, Whiting SH, et al. A randomized phase II adjuvant trial of resected patients with ras mutation bearing pancreas cancer treated with GI‐4000 and gemcitabine or gemcitabine alone: A safety analysis of the first 100 treated patients. 2010 ASCO Gastrointestinal Cancers Symposium. Abstract No. 229.
- 21. Wansley EK, Chakraborty M, Hance KW et al. Vaccination with a recombinant Saccharomyces cerevisiae expressing a tumor antigen breaks immune tolerance and elicits therapeutic antitumor responses. Clin Cancer Res 2008;14:4316–4325. [DOI] [PMC free article] [PubMed] [Google Scholar]
- 22. Stubbs AC, Martin KS, Coeshott C et al. Whole recombinant yeast vaccine activates dendritic cells and elicits protective cell‐mediated immunity. Nat Med 2001;7:625–629. [DOI] [PubMed] [Google Scholar]
- 23. Stubbs AC, Wilson CC. Recombinant yeast as a vaccine vector for the induction of cytotoxic T‐lymphocyte responses. Curr Opin Mol Ther 2002;4:35–40. [PubMed] [Google Scholar]
- 24. Heery CR, Singh BH, Rauckhorst M et al. Phase I trial of a yeast‐based therapeutic cancer vaccine (GI‐6301) targeting the transcription factor brachyury. Cancer Immunol Res 2015;3:1248–1256. [DOI] [PMC free article] [PubMed] [Google Scholar]
- 25. Gameiro SR, Malamas AS, Bernstein MB et al. Tumor cells surviving exposure to proton or photon radiation share a common immunogenic modulation signature, rendering them more sensitive to T cell‐mediated killing. Int J Radiat Oncol Biol Phys 2016;95:120–130. [DOI] [PMC free article] [PubMed] [Google Scholar]
- 26. Garnett‐Benson C, Hodge JW, Gameiro SR. Combination regimens of radiation therapy and therapeutic cancer vaccines: Mechanisms and opportunities. Semin Radiat Oncol 2015;25:46–53. [DOI] [PMC free article] [PubMed] [Google Scholar]
- 27. Formenti SC, Demaria S. Combining radiotherapy and cancer immunotherapy: A paradigm shift. J Natl Cancer Inst 2013;105:256–265. [DOI] [PMC free article] [PubMed] [Google Scholar]
- 28. Formenti SC. Silvia Formenti on the promise of combining radiotherapy and immunotherapy to treat cancer. Oncology (Williston Park) 2016;30:289, 292. [PubMed] [Google Scholar]
- 29. Gameiro SR, Jammeh ML, Wattenberg MM et al. Radiation‐induced immunogenic modulation of tumor enhances antigen processing and calreticulin exposure, resulting in enhanced T‐cell killing. Oncotarget 2014;5:403–416. [DOI] [PMC free article] [PubMed] [Google Scholar]
- 30. Chakraborty M, Abrams SI, Camphausen K et al. Irradiation of tumor cells up‐regulates Fas and enhances CTL lytic activity and CTL adoptive immunotherapy. J Immunol 2003;170:6338–6347. [DOI] [PubMed] [Google Scholar]
- 31. Griffith TS, Brunner T, Fletcher SM et al. Fas ligand‐induced apoptosis as a mechanism of immune privilege. Science 1995;270:1189–1192. [DOI] [PubMed] [Google Scholar]
- 32. Abrahams VM, Kamsteeg M, Mor G. The Fas/Fas ligand system and cancer: Immune privilege and apoptosis. Mol Biotechnol 2003;25:19–30. [DOI] [PubMed] [Google Scholar]
- 33. Gameiro SR, Ardiani A, Kwilas A et al. Radiation‐induced survival responses promote immunogenic modulation to enhance immunotherapy in combinatorial regimens. Oncoimmunology 2014;3:e28643. [DOI] [PMC free article] [PubMed] [Google Scholar]
- 34. National Cancer Institute . Common Terminology Criteria for Adverse Events (CTCAE). Available at http://ctep.cancer.gov/protocolDevelopment/electronic_applications/ctc.htm. Accessed September 27, 2020.
- 35. Eisenhauer EA, Therasse P, Bogaerts J et al. New response evaluation criteria in solid tumours: Revised RECIST guideline (version 1.1). Eur J Cancer 2009;45:228–247. [DOI] [PubMed] [Google Scholar]
- 36. Wolchok JD, Hoos A, O'Day S et al. Guidelines for the evaluation of immune therapy activity in solid tumors: Immune‐related response criteria. Clin Cancer Res 2009;15:7412–7420. [DOI] [PubMed] [Google Scholar]
- 37. Heery CR, Palena C, McMahon S et al. Phase I study of a poxviral TRICOM‐based vaccine directed against the transcription factor brachyury. Clin Cancer Res 2017;23:6833–6845. [DOI] [PMC free article] [PubMed] [Google Scholar]
- 38. Dillon PM, Petroni GR, Smolkin ME et al. A pilot study of the immunogenicity of a 9‐peptide breast cancer vaccine plus poly‐ICLC in early stage breast cancer. J Immunother Cancer 2017;5:92. [DOI] [PMC free article] [PubMed] [Google Scholar]
- 39. Melssen MM, Petroni GR, Chianese‐Bullock KA et al. A multipeptide vaccine plus toll‐like receptor agonists LPS or polyICLC in combination with incomplete Freund's adjuvant in melanoma patients. J Immunother Cancer 2019;7:163. [DOI] [PMC free article] [PubMed] [Google Scholar]
- 40. Engelhard VH, Obeng RC, Cummings KL et al. MHC‐restricted phosphopeptide antigens: Preclinical validation and first‐in‐humans clinical trial in participants with high‐risk melanoma. J Immunother Cancer 2020;8:e000262. [DOI] [PMC free article] [PubMed] [Google Scholar]
- 41. Walcott BP, Nahed BV, Mohyeldin A et al. Chordoma: Current concepts, management, and future directions. Lancet Oncol 2012;13:e69–76. [DOI] [PubMed] [Google Scholar]
- 42. Stacchiotti S, Sommer J; Chordoma Global Consensus Group . Building a global consensus approach to chordoma: A position paper from the medical and patient community. Lancet Oncol 2015;16:e71–83. [DOI] [PubMed] [Google Scholar]
- 43. Heery CR. Chordoma: The quest for better treatment options. Oncol Ther 2016;4:35–51. [DOI] [PMC free article] [PubMed] [Google Scholar]
- 44. Amichetti M, Cianchetti M, Amelio D et al. Proton therapy in chordoma of the base of the skull: A systematic review. Neurosurg Rev 2009;32:403–416. [DOI] [PubMed] [Google Scholar]
- 45. Liu H, Zha Y, Choudhury N et al. WT1 peptide vaccine in Montanide in contrast to poly ICLC, is able to induce WT1‐specific immune response with TCR clonal enrichment in myeloid leukemia. Exp Hematol Oncol 2018;7:1. [DOI] [PMC free article] [PubMed] [Google Scholar]
Associated Data
This section collects any data citations, data availability statements, or supplementary materials included in this article.
Supplementary Materials
See http://www.TheOncologist.com for supplemental material available online.
Figure S1 Study schema. Following randomization, blinded vaccine was administered on cycle 1 days 1, 15, and 29. After completing the first cycle of treatment, proton or photon RT was given at the discretion of the patient's local radiation oncologist. Post‐RT, patients returned to the NIH Clinical Center where they continued to receive blinded vaccine until progression.
Figure S2. Tumor Response per RECIST 1.1. This spider plot of RECIST v1.1 measurement data shows percentage change in the targeted lesion sum over time, represented by cycle number. Patients on the vaccine arm are shown in green; patients on the placebo arm are shown in red. No observable trend is identified.
Figure S3. 2D RECIST vs 3D Volumetric Measurement of Chordomas. Comparison of 2‐dimensional (RECIST) and 3‐dimensional volumetric tumor measurement. Images of sacrococcygeal chordoma from patient who developed partial response on vaccine arm.
Figure S4. Immune analysis of patient level antigen‐specific data. Absolute number of CD4+ or CD8+ T cells producing cytokine (IFNg, TNFa, IL‐2) or positive for CD107a per 1 × 10⁶ PBMCs plated at the start of the in vitro stimulation assay. Numbers in bold are positive responses after vs before therapy and following subtraction of background [TAA after therapy – HLA after therapy] – [TAA before therapy – HLA before therapy] >250 per 1 × 10⁶ PBMCs. Grey rows indicate time points at which PBMCs were insufficient for analysis. In the current study, antigen‐specific responses fluctuated in many patients over time. This phenomenon has been observed in numerous cancer vaccine trials [41, 42, 43, 44, 45] and may be due to T‐cell trafficking into and out of the tumor, as well as homeostatic regulation by regulatory T cells to suppress an immune response against self‐antigens.