Abstract
In the development of sensory prosthetic devices based on intracortical microstimulation (ICMS) an important objective is to optimize the stimulus waveform. However, because of the large design space such optimization is an imposing challenge. This study highlights the ability of individual rats, trained using a conditioned avoidance paradigm and performing an adaptive task, to generate highly consistent and significant data. Three experiments on the effects of phase delay, stimulus pulse rate, and waveform asymmetry were completed and revealed detailed and significant results. These results, consisting of 244 individual thresholds, were generated by one rat in 19 days.
I. INTRODUCTION
Reliable sensory prostheses based on electrical stimulation of neural activity in sensory cortical structures are a long standing goal for the field of neural engineering [1–4]. Currently, research aimed at developing treatment options for the blind [5–6], the paralyzed [7–8], and the deaf [9–10] is based almost exclusively on intracortical microstimulation (ICMS). This technology places microelectrodes into layers of the cortex, allowing higher stimulation specificity, and lower detection thresholds when compared to surface stimulation [11].
Nevertheless, the potential of ICMS is currently limited partly due to its lack of proven safety. Careful histology and physiology studies have shown that ICMS can result in local tissue damage; furthermore, these studies indicate that the dominant factors resulting in pathological results, either physically [12] or physiologically [13], are pulse rate and charge transferred to the tissue per phase of a biphasic pulse.
These two important findings suggest that the pursuit of waveforms beyond the traditional, i.e. symmetric, cathode leading, biphasic (100 to 200 μs per phase) pulse that can efficiently and reliably evoke physiological and behavioral responses is a worthwhile effort in the development of ICMS for sensory prostheses. Nonetheless, the design space is relatively large and traditional low-throughput study is not feasible.
Assuming the well-accepted waveform constraints of biphasic, constant-current, charge-balanced pulses, several important design space factors remain. These include: 1) anatomical factors: such as a) cortical region, b) columnar function, and c) electrode laminar depth; 2) stimulation factors: such as a) phase duration, b) phase order, c) phase asymmetry, d) phase delay, e) pulse rate, f) bias voltage, and g) stimulation polarity (e.g. monopolar, bipolar, etc.), which is necessarily associated with h) site-site distance; 3) electrode factors: a) electrode site material, b) electrode surface area, c) shank geometry and size, d) shank elastic modulus; finally, 4) tissue response factors: a) degree of surgical trauma, b) time post implant, c) immune response and d) neural plasticity. Furthermore, considering the potential for interaction between the factors non-exhaustively listed above, extensive sampling of the design space with traditional methods is unrealistic. Hence, a high-throughput and high-fidelity experimental preparation enabling rapid and repeatable evaluation of this parameter space is required.
Here, we demonstrate the performance of a high-throughput rat behavioral model using three experiments performed on a single rat over the course of a month, which are aimed at elucidating the behavioral detectability of three of the factors listed above: 1) pulse rate, 2) phase delay, and 3) the interaction between asymmetry and pulse rate in the primary auditory cortex. This study is not intended to be definitive about these factors. Instead it is intended to be illustrative of the potential this high-throughput behavioral model has for discovering a wealth of information on the effects of waveform parameters on the behavior detection of ICMS. This rat was not selected because his performance was in anyway exemplary, and those who are familiar with the behavioral detection of ICMS will note his thresholds are relatively high. Here we demonstrate the efficiency of the experimental design.
II. MATERIALS AND METHODS
A. Experimental Design
A single male Sprague-Dawley rat (450 g) was used for this study in order to assess the effects of stimulus waveform parameters in a three part experiment. All experiments were performed as a complete block design in which the rat generated a single threshold for each parameter combination in the experiment every day. The order in which the parameter combinations were presented to the rat during each block was randomized to eliminate the potential of a sensitization or desensitization bias.
The first experiment, titled “Phase Delay,” explored three effects: 1) the effect of the addition of a phase delay between the first and second phase of the 205 μs/Ph., constant current pulse delivered at 150 pulses per second (P.P.S.), 2) how that effect was altered by the length of the delay (0, 41, 205 and 1024 μs), 3) and whether the first phase’s direction (anodal or cathodal) altered the effect. Given the complete block design, 8 parameter combinations constituted the block. Eight blocks were completed.
The second experiment, titled “Pulse Rate,” explored the effect of pulse rate (P.P.S.) on the rat’s behavioral detection threshold for the cathode leading 205 μs/Ph. constant current pulse. For this study 12 pulse rates were used. Spaced logarithmically between 16 and 338 P.P.S., they were 16, 21, 28, 37, 49, 64, 84, 111, 147, 194, 256, and 338 P.P.S. Five blocks were completed.
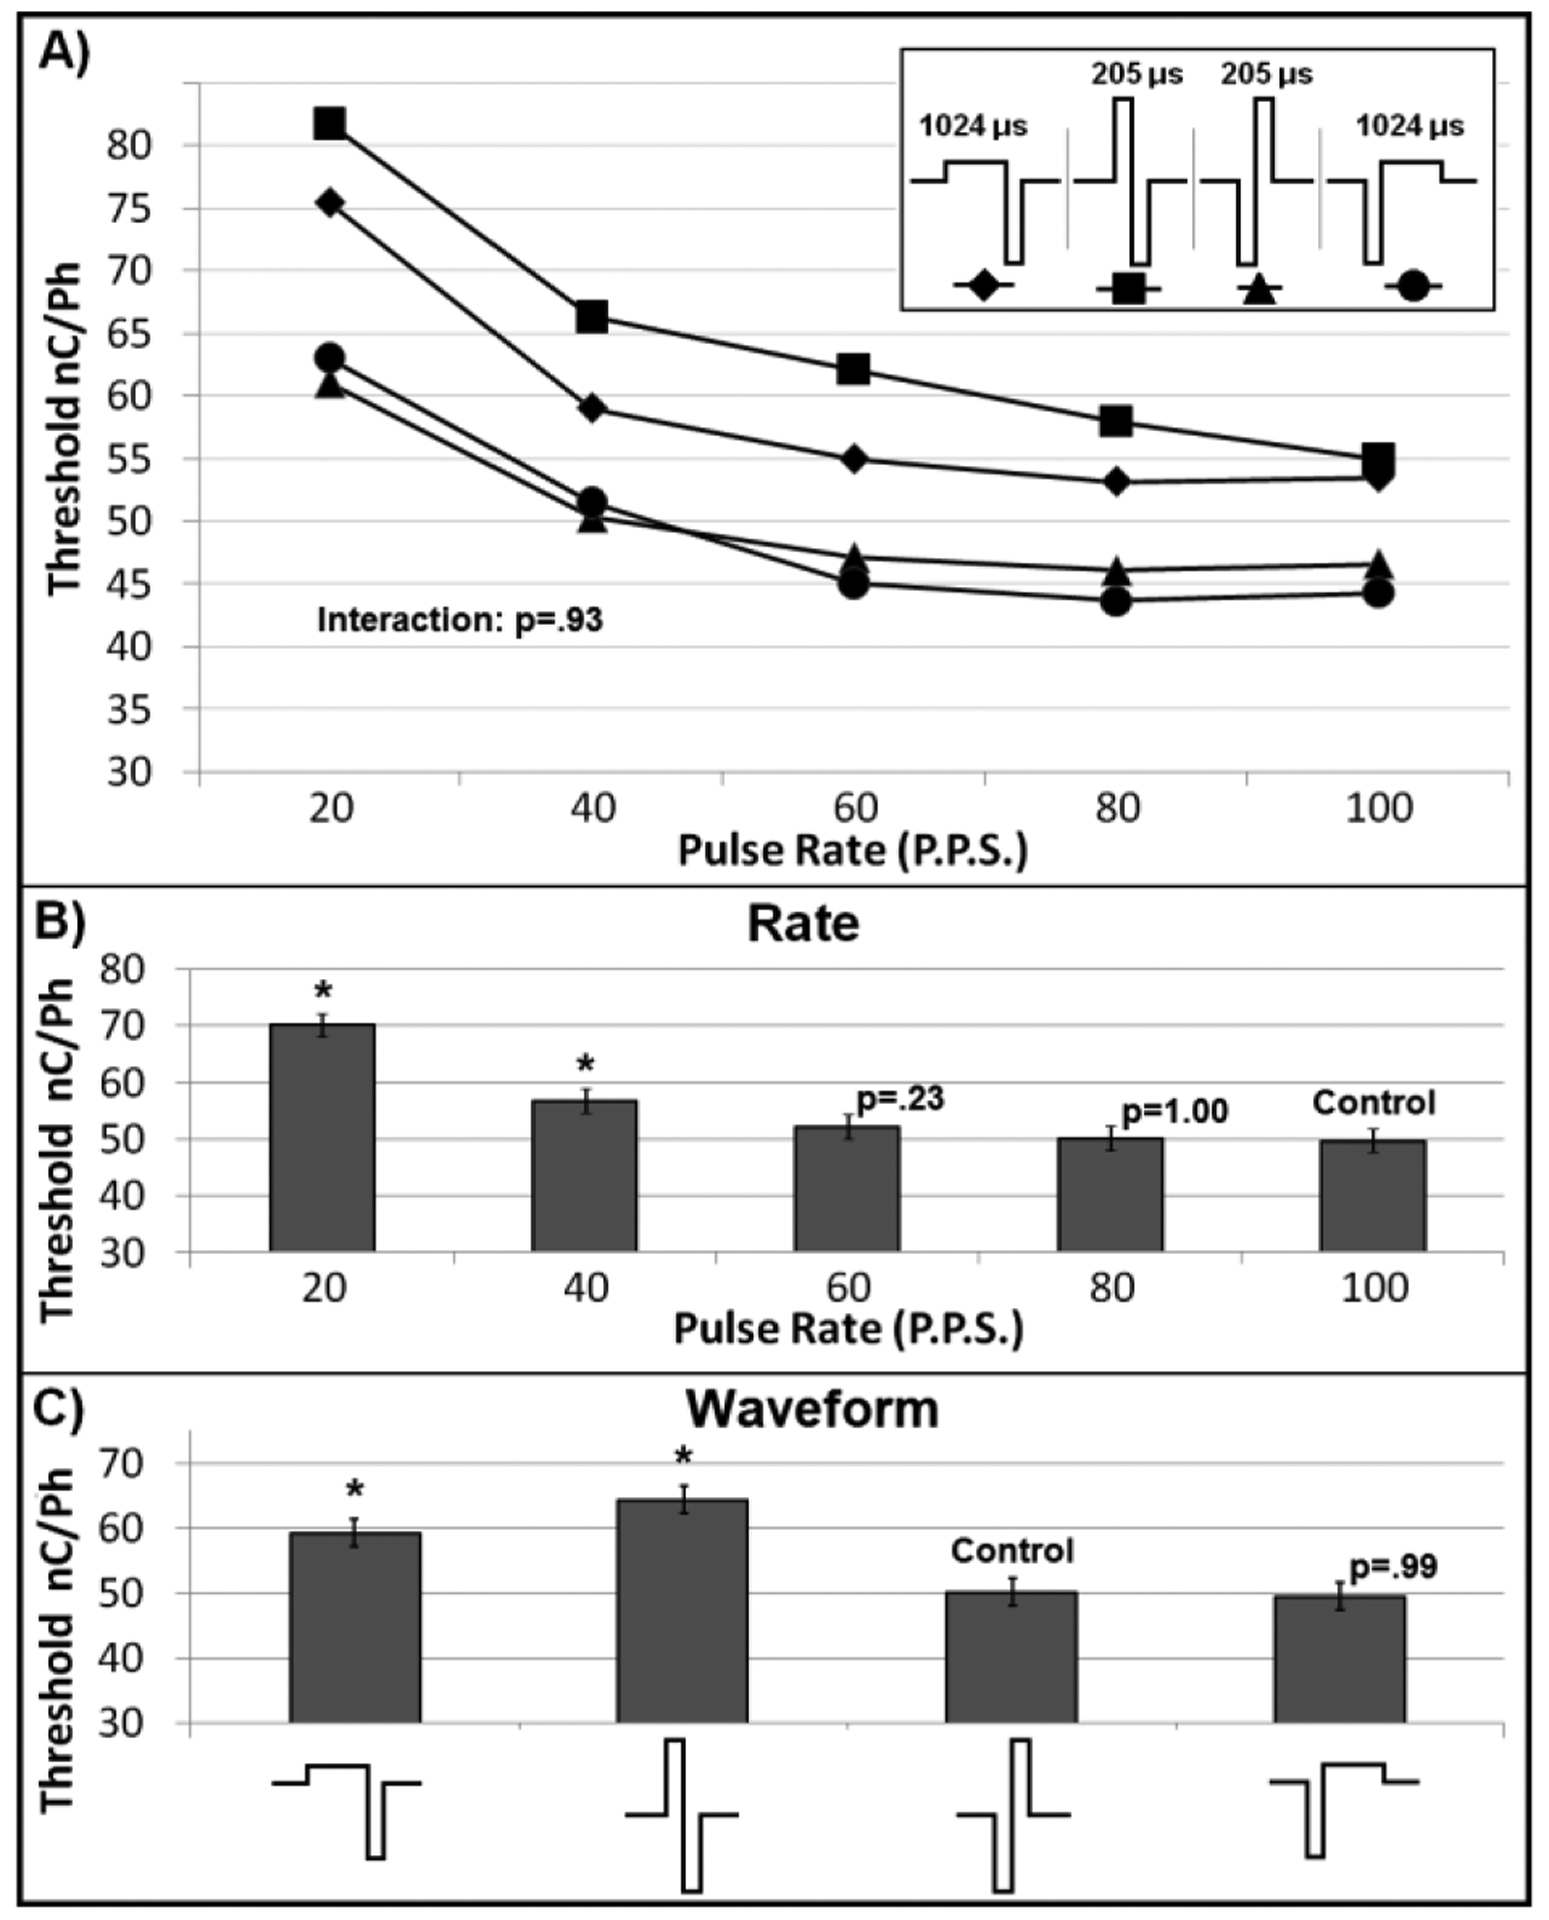
Finally, the third experiment, titled “Asymmetry and Pulse Rate,” explored the effect of waveform asymmetry simultaneously with pulse rate. For this experiment, the cathode phase of the stimulus was fixed at 205 μs/Ph., while the order and duration of the anode phase was varied as follows: 1024 μs/Ph. – first, 205 μs/Ph. – first, 205 μs/Ph. – second, and 1024 μs/Ph. – second. For all asymmetric pulses, the amplitude of the anode phase was altered to maintain the charge balance of the pulse. These waveforms are most easily grasped visually and are represented as such in Fig. 3. Based on the results of the Pulse Rate experiment, pulse rates of 20, 40, 60, 80, and 100 P.P.S. were selected as representative of the region of interest. Given the complete block design, 20 parameter combinations constituted the block. Six blocks were completed
Fig. 3. Pulse Rate and Asymmetry.

A) No interaction effect was seen between waveform and pulse rate. B&C) comparisons were made with regard to Control. “*” indicate statistical significance (p < 0.0001).
B. Statistical Analysis
Statistical analysis was performed using SAS version 9.2 (Cary, NC). The least squares estimate of the mean for each detection threshold and its corresponding 95% confidence interval were calculated by MANOVA, the day the thresholds were obtained was used as the experimental block.
For the Phase Delay experiment, interaction between leading phase direction and phase delay was statistically significant (p<0.0001); therefore, analysis of the main effects was not performed. Tukey’s test for multiple pairwise comparisons was used and important significant differences were noted.
For the Pulse Rate experiment, strong trends were seen in the data and regression analysis of the least square estimates of the mean was used to summarize the findings.
Finally, for the Asymmetry and Pulse Rate experiment, interaction between waveform shape and pulse rate was not statistically significant (p=0.93) and, therefore, analysis of the main effects was performed. Because symmetric cathode lead pulse delivered at a rate of 100 P.P.S. was seen as relatively standard for IMCS experiments, these were designated as control. Dunnett’s test for multiple pairwise comparisons to control was used to test for significance.
C. Behavioral Paradigm & Electrical Stimulation
In brief, a water deprived rat was trained using a conditioned avoidance task. Training was daily with no breaks. The rat learned to stop licking a water spout in response to a 650 ms warning tone in order to avoid a 1.6 mA cutaneous shock delivered through the spout. Warning trials were randomly presented amid safe trials with a 20% probability. For safe trials, no sound was played; however, the rat’s presence on the spout was monitored as a control measure of the periodicity of licking in absence of a stimulus. This data was used to calculate a false alarm rate. If the false alarm rate it exceeded 20% for a given series, the series was removed from analysis and repeated. After the electrode implantation, electrical pulse trains of 650 ms replaced the tone as the warning. The parameters of the pulse train were determined based on the experimental conditions. The stimulation was delivered by an MS16 stimulus isolator with 4 serial NC48 batteries, enabling a +/− 96V compliance voltage (Tucker-Davis Technologies, Alachua, FL).
To estimate the rat’s threshold, an adaptive paradigm was used in which correct detections were followed by a lower amplitude warning stimulus and every miss was followed by a higher amplitude stimulus. The rat was allowed to make five or seven reversals, defined as a switch from a run of correct detection to a run of misses. In this way the rat reached a amplitude for which he had approximately a 50% chance of detecting, which was estimated by averaging his final four reversal values and defined as his threshold. The rat reliably performed the electric task by the 6th day post-op.
D. Surgery
Specifics of the implant procedures are fully described in other publications [14–15]. Briefly, prior to surgery, an areflexive state was achieved by anesthetic induction through an intraperitoneal injection of a combination of ketamine hydrochloride (80 mg/kg body wt) and xylazine (5 mg/kg). The depth of anesthesia was monitored and anesthesia was supplemented by ketamine hydrochloride (20 mg/kg body wt) if the animal withdrew a limb in response to a toe pinch or if spontaneous movement was noted.
The skull over the primary auditory cortex of the right hemisphere was drilled open using a burr. Vascular landmarks and/or stereotaxic coordinates were used to identify the primary auditory cortex [16].
A 16-channel, linear, single silicon microelectrode array with 1250 μm2 iridium oxide site areas spaced on 100 μm pitch (c1×16–6mm100–1250, NeuroNexus Technologies, Ann Arbor, MI), which had been activated 48 hours prior to surgery [17], was lowered to the surface by hand using microforceps (Fine Science Tools Inc., Foster City, CA) and inserted into the cortical mantle. The intracortical electrodes were inserted with a radial penetration such that the recording sites were positioned spanning 0 – 1.5 millimeters from the cortical surface (microscopic visual inspection confirmed that the most superficial electrode site was at the surface of the cortex). A small wire was attached to an implanted titanium bone screw (size 2–56) for an electrical ground point.
Neural recordings were made during surgery (Tucker-Davis Technologies, Alachua, FL) to assess the neurophysiological responses to pure tone or click stimuli and to ensure primary auditory cortex placement. Upon confirmation of primary auditory cortex placement, the electrode array and silicon cable were encased in silicone elastomer. A final layer of dental acrylic was then applied over the silicone and all remaining visible bone to seal the craniotomy and anchor the implant in place.
III. RESULTS AND DISCUSSION
A. Phase Delay
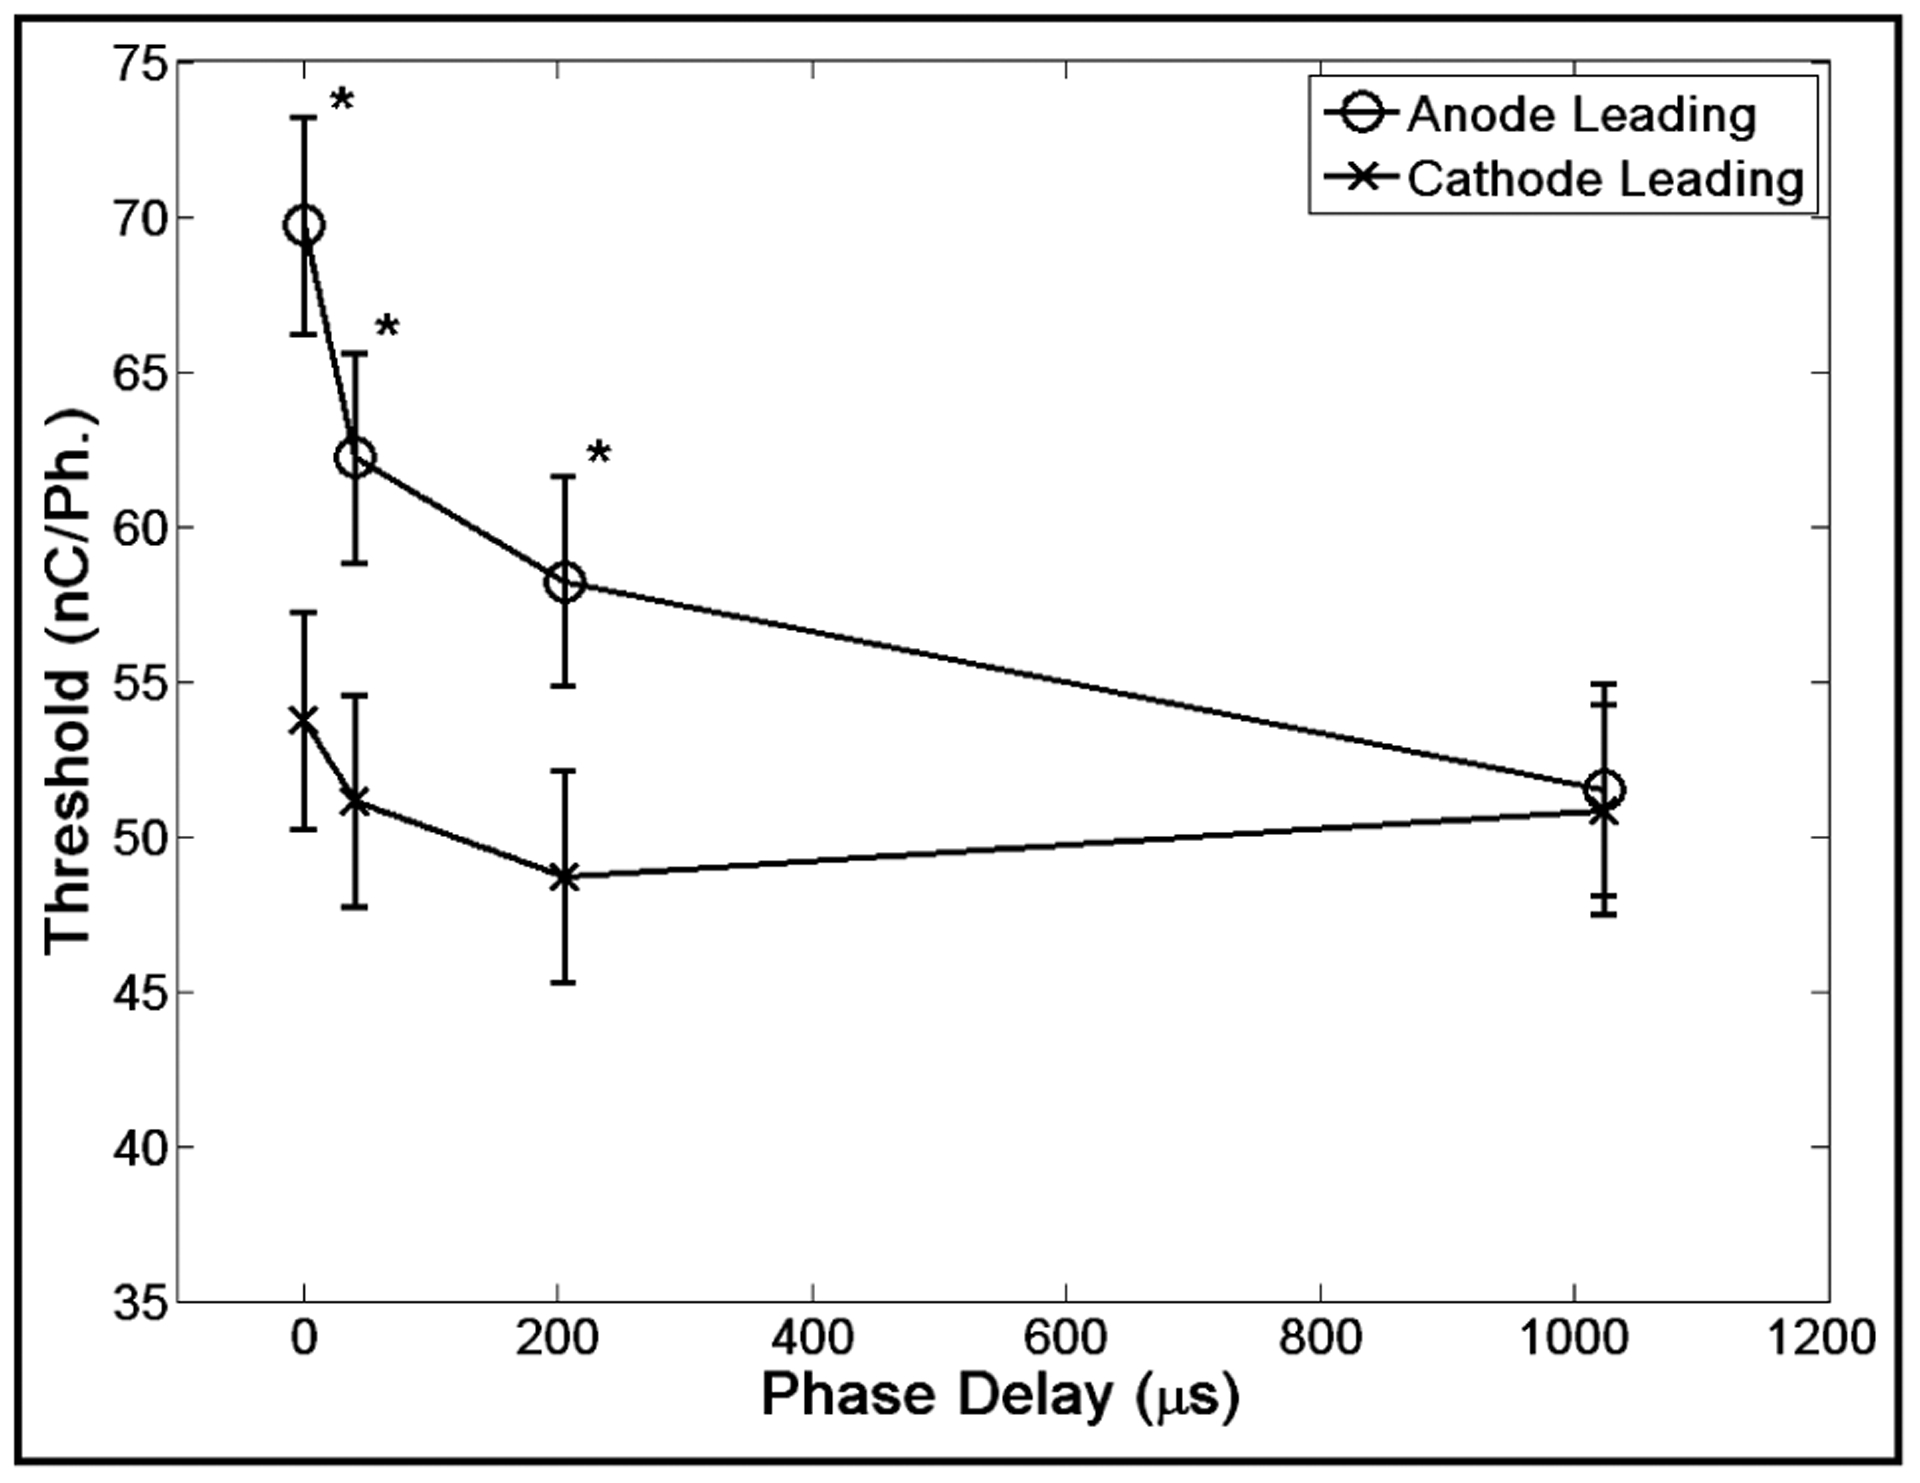
Analysis of the phase delay data revealed three important findings (Fig. 1). First, anode leading symmetric pulses in almost all cases had significantly higher thresholds than cathode leading pulses of equal phase delays (p < 0.0001). Second, the longer the phase delay the greater the decrease in threshold. Third, once the phase delay reached 1 ms there no longer was a significant difference between anode leading and cathode leading pulses.
Fig. 1. Phase Delay.

Error bars represent 95% CI of the least squares estimate of the mean of all thresholds. * indicates a significant difference (P<0.0001) between anode and cathode leading pulses of equal phase delay.
B. Pulse Rate
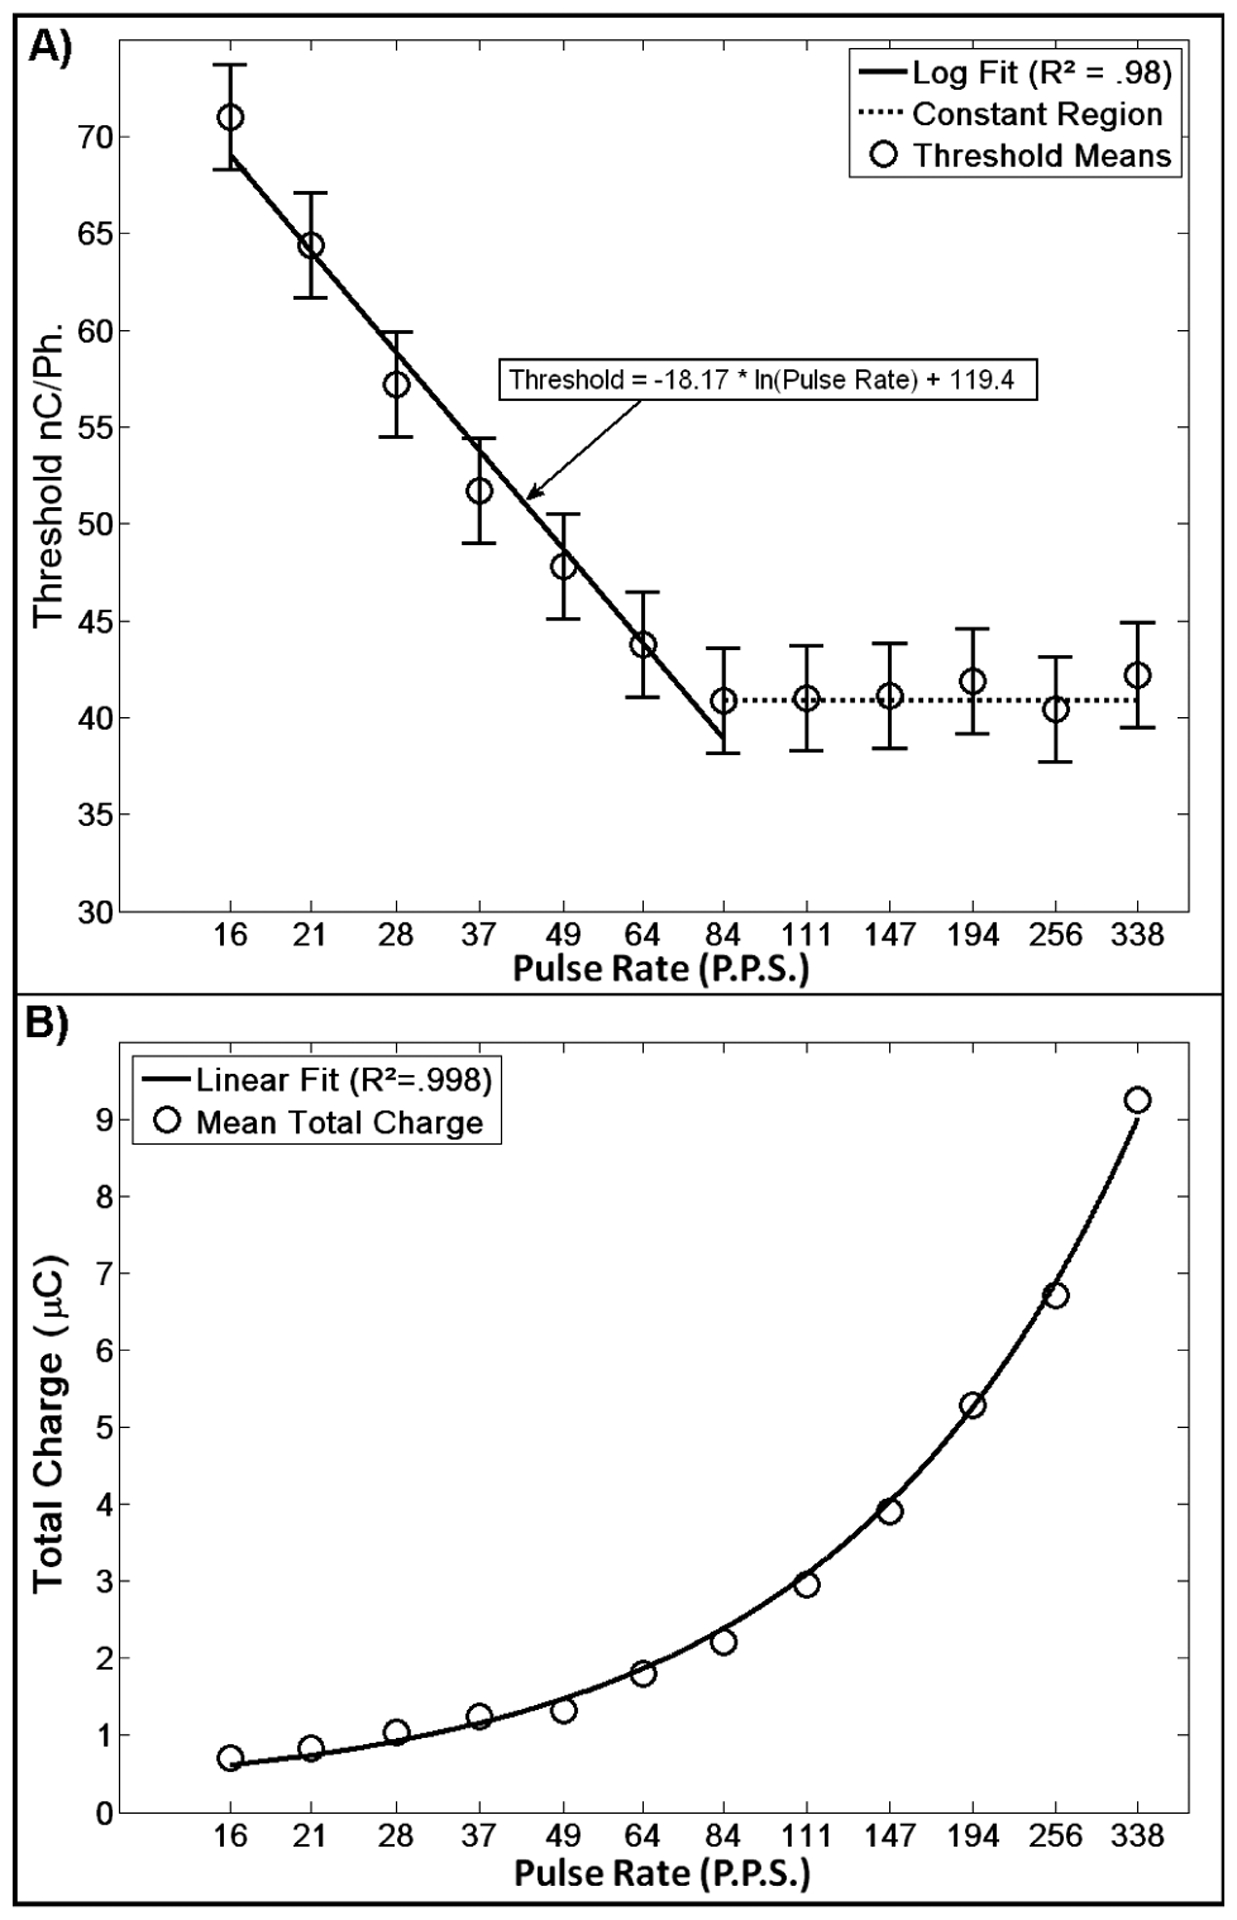
The Pulse Rate data show three strong trends (Fig. 2). First, there is a strong logarithmic relationship between pulse rate and detection threshold in the domain of 16 to 84 P.P.S. (R2 = 0.98 for regression to least squares estimates of the mean). Second, after 84 P.P.S. there is no change in detection threshold for a change in pulse rate. Finally, converting the threshold from charge transferred per phase to total charge delivered per warning (the product of the number of pulses in the warning and the detection threshold in charge per phase for that warning), one sees a strongly linear relationship (note the logarithmic x-axis; R2 = 0.998 for regression to least squares estimates of the mean).
Fig. 2. Pulse Rate.

A) Pulse rate exhibits a strong logarithmic relationship with detection threshold for the domain of 16 to 84 P.P.S., while above 84 P.P.S. it exhibits no correlation. B) When thresholds are converted to the total charge delivered during the warning, a strong linear relationship is seen with respect to pulse rate. Error bars represent 95% confidence intervals of least squared estimates of the mean.
C. Asymmetry and Pulse Rate
The Asymmetry and Pulse Rate experiment corroborated the findings of the first two experiments (Fig. 3). Analysis of the main effects reiterated the relationship between pulse rate and threshold as described in the Pulse Rate experiment (Fig. 3B). With regard to the effect of the waveform, this experiment demonstrated that anode leading pulses have higher thresholds than cathode leading pulses – confirming the finding in the phase delay experiment – and that the asymmetric waveform had a lower threshold than the symmetric waveform (Fig 3C). Further, it demonstrated no significant difference between the cathode leading symmetric and asymmetric pulses. Finally, statistical analysis found no interaction between stimulus pulse rate and waveform geometry (p = 0.93).
IV. CONCLUSION
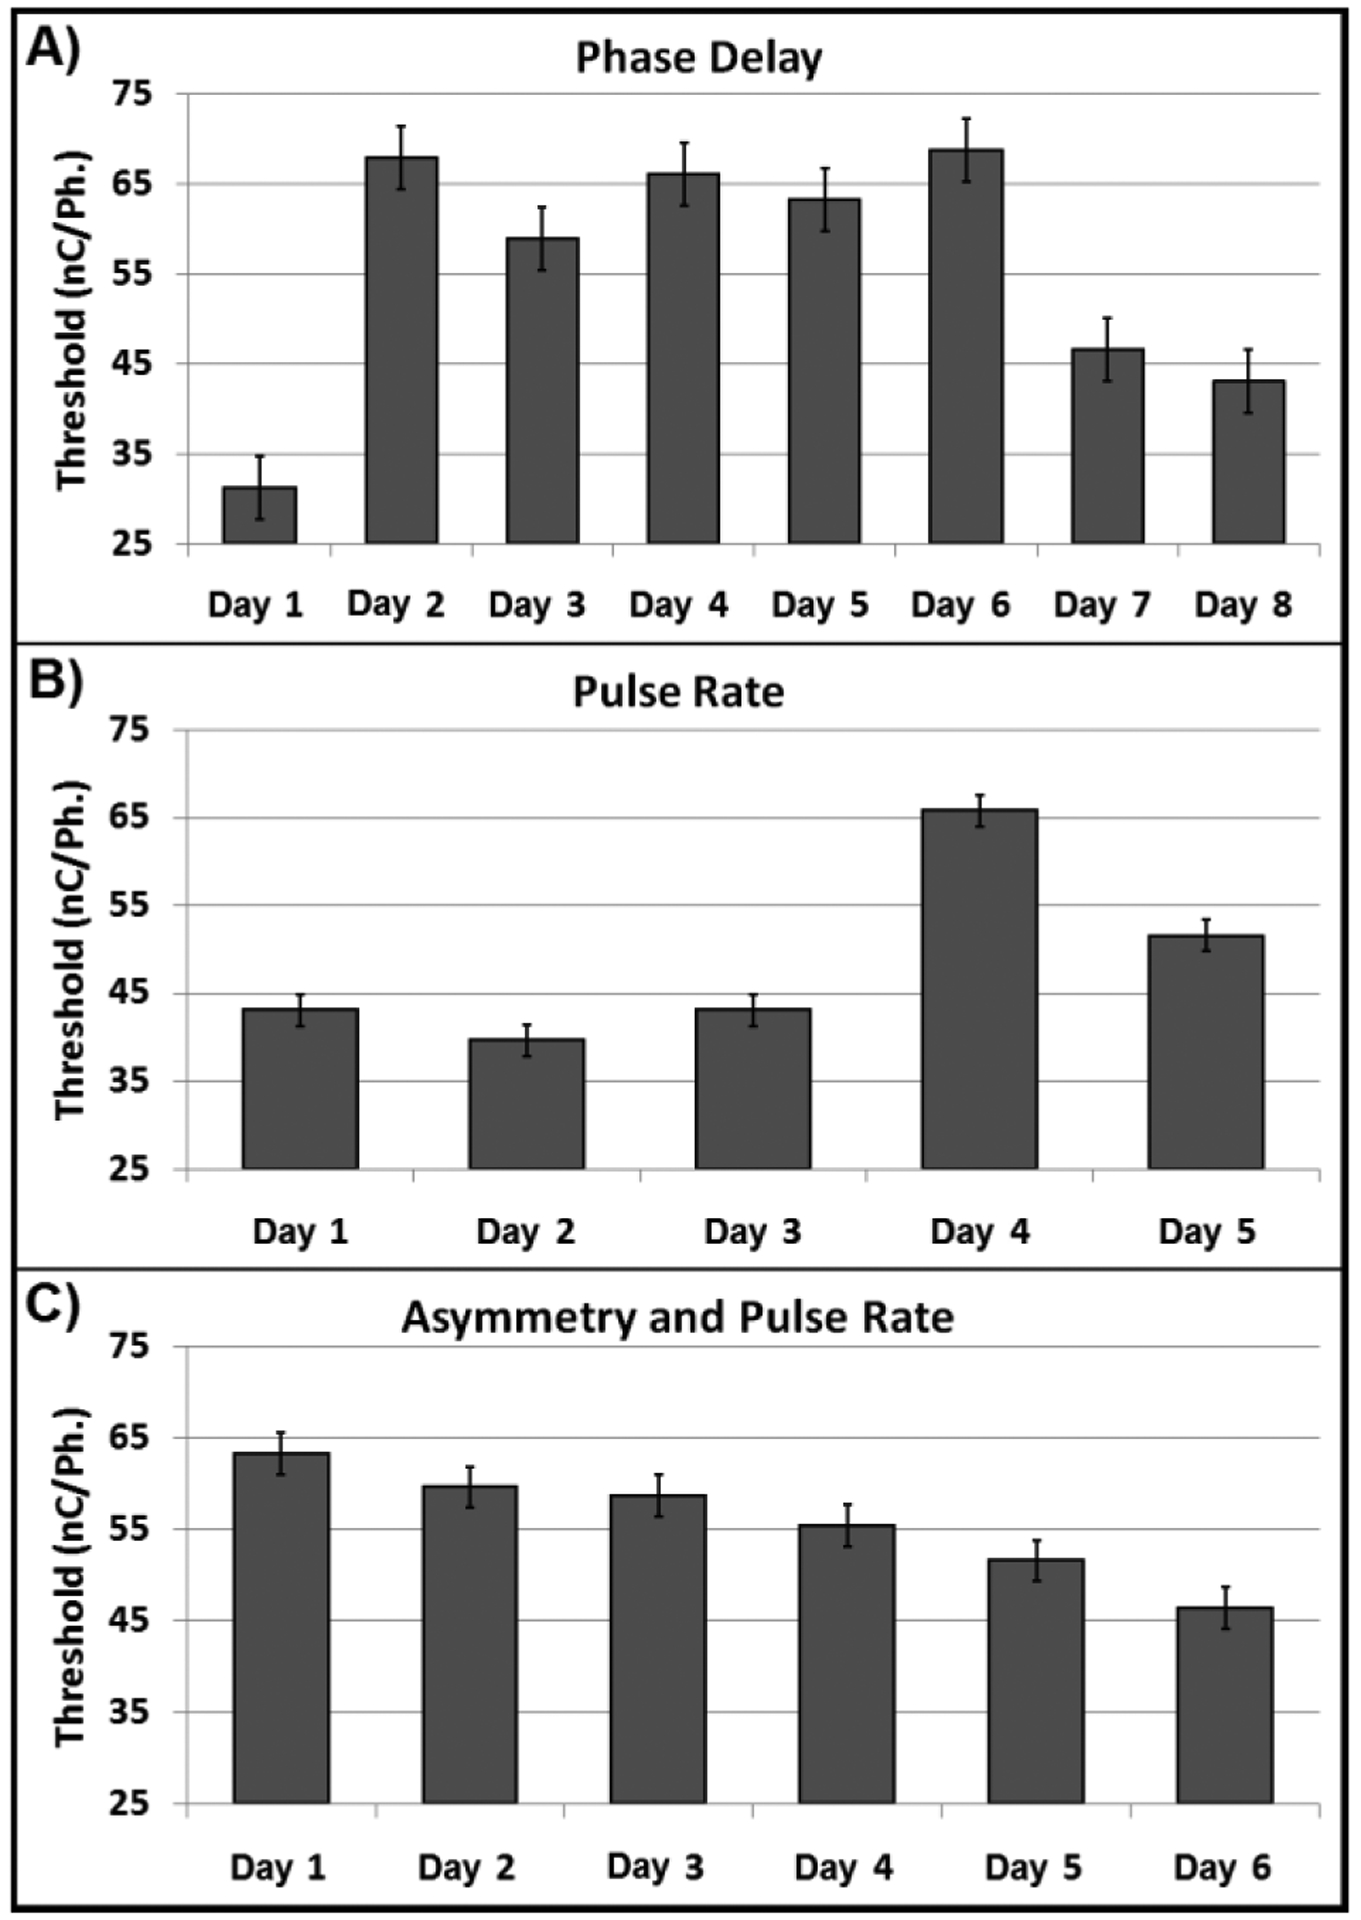
The purpose of this work was to preliminarily answer questions regarding the behavioral detection of ICMS. More importantly, it details the power of this behavioral model, enabling this data collection from a single rat subject over 19 days. While this approach does not generate a full psychophysical curve, it maximizes the number of thresholds generated in a day. Therefore, all factor levels can be assessed within a day and repeated on subsequent days. Fig. 4 shows the blocking data for all three experiments. If this daily variance is not effectively blocked through a large number of trials in a given day, then statistical analysis may be limited and results obscured. Our future work on chronic ICMS will focus on measuring and controlling for such variability using high-throughput behavioral tasks such as this adaptive task.
Fig. 4. Value of Blocking.

Block analysis for all experiments shows a high degree of day to day variability in mean threshold levels for all experiments. Unaccounted for, this variance can negatively affect data analysis requiring a larger number of replicates to achieve significance.
Acknowledgments
Manuscript received April 15, 2011. This work was supported in part by the NIH/NIDCD RO3-DC009339.
Contributor Information
Andrew S. Koivuniemi, Weldon School of Biomedical Engineering, Purdue University, West Lafayette, IN 47907 USA
Oliver B. Regele, Weldon School of Biomedical Engineering, Purdue University, West Lafayette, IN 47907 USA
Jessica H. Brenner, Department of Biological Sciences, Purdue University, West Lafayette, IN 47907 USA
Kevin J. Otto, Department of Biological Sciences and the Weldon School of Biomedical Engineering, Purdue University, West Lafayette, IN 47907 USA.
REFERENCES
- [1].Dobelle WH and Mladejovsky MG, “Phosphenes produced by electrical stimulation of human occipital cortex, and their application to the development of a prosthesis for the blind.,” Journal of Physiology, vol. 243, pp. 553–76, December 1974. [DOI] [PMC free article] [PubMed] [Google Scholar]
- [2].Brindley GS and Lewin WS, “The sensations produced by electrical stimulation of the visual cortex.,” Journal of Physiology, vol. 196, pp. 479–93, May 1968. [DOI] [PMC free article] [PubMed] [Google Scholar]
- [3].Bartlett JR and Doty RW, “An exploration of the ability of macaques to detect microstimulation of striate cortex.,” Acta Neurobiologiae Experimentalis, vol. 40, pp. 713–27, 1980. [PubMed] [Google Scholar]
- [4].Pollen DA, “Some perceptual effects of electrical stimulation of the visual cortex in man.,” in The Nervous System. vol. 2, Tower DB, Ed., ed New York: Raven, 1975, pp. 519–528. [Google Scholar]
- [5].Tehovnik EJ and Slocum WM, “Depth-dependent detection of microampere currents delivered to monkey V1,” Eur J Neurosci, vol. 29, pp. 1477–89, April 2009. [DOI] [PMC free article] [PubMed] [Google Scholar]
- [6].Schmidt EM, et al. , “Feasibility of a visual prosthesis for the blind based on intracortical microstimulation of the visual cortex.,” Brain, vol. 119 (Pt 2), pp. 507–22, April 1996. [DOI] [PubMed] [Google Scholar]
- [7].Fitzsimmons NA, et al. , “Primate reaching cued by multichannel spatiotemporal cortical microstimulation,” J Neurosci, vol. 27, pp. 5593–602, May 23 2007. [DOI] [PMC free article] [PubMed] [Google Scholar]
- [8].O’Doherty JE, et al. , “A brain-machine interface instructed by direct intracortical microstimulation,” Frontiers in Integrative Neuroscience, vol. 3, 2009-September-01 2009. [DOI] [PMC free article] [PubMed] [Google Scholar]
- [9].Scheich H and Breindl A, “An animal model of auditory cortex prostheses.,” Audiology & Neuro-Otology, vol. 7, pp. 191–4, 2002. [DOI] [PubMed] [Google Scholar]
- [10].Otto KJ, et al. , “Cortical microstimulation in auditory cortex of rat elicits best-frequency dependent behaviors,” Journal of Neural Engineering, vol. 2, pp. 42–51, June 2005. [DOI] [PubMed] [Google Scholar]
- [11].Bak MJ, et al. , “Visual sensations produced by intracortical microstimulation of the human occipital cortex.,” Medical & Biological Engineering & Computing, vol. 28, pp. 257–9, May 1990. [DOI] [PubMed] [Google Scholar]
- [12].McCreery D and et al. , “Neuronal loss due to prolonged controlled-current stimulation with chronically implanted microelectrodes in the cat cerebral cortex,” Journal of Neural Engineering, vol. 7, p. 036005, 2010. [DOI] [PMC free article] [PubMed] [Google Scholar]
- [13].McCreery DB, et al. , “The effects of prolonged intracortical microstimulation on the excitability of pyramidal tract neurons in the cat,” Annals of Biomedical Engineering, vol. 30, pp. 107–19, January 2002. [DOI] [PubMed] [Google Scholar]
- [14].Kipke DR, et al. , “Silicon-substrate intracortical microelectrode arrays for long-term recording of neuronal spike activity in cerebral cortex,” IEEE Transactions on Neural Systems and Rehabilitation Engineering, vol. 11, pp. 151–155, June 2003. [DOI] [PubMed] [Google Scholar]
- [15].Vetter RJ, et al. , “Chronic neural recording using silicon-substrate microelectrode arrays implanted in cerebral cortex.,” IEEE Transactions on Biomedical Engineering, vol. 51, pp. 896–904, 2004. [DOI] [PubMed] [Google Scholar]
- [16].Sally SL and Kelly JB, “Organization of auditory cortex in the albino rat: sound frequency.,” Journal of Neurophysiology, vol. 59, pp. 1627–38, May 1988. [DOI] [PubMed] [Google Scholar]
- [17].Robblee LS, et al. , “Activated Ir - an electrode suitable for reversible charge injection in saline solution.,” Journal of the Electrochemical Society, vol. 130, pp. 731–733, 1983. [Google Scholar]


