

Key Points
Question
What is the importance of gender and racial/ethnic intersectionality along the surgical pipeline?
Findings
In this cross-sectional study of US surgical faculty, female faculty who identify as members of a racial/ethnic minority group experienced an increase in representation at nearly all junior and midcareer faculty positions, with a more favorable trajectory than their male colleagues. However, representation of racial/ethnic minority groups among female full professors decreased, whereas representation increased marginally among their male colleagues.
Meaning
Intersectionality of gender and race/ethnicity may leave female surgeons in minority groups more disadvantaged than their male colleagues in achieving leadership positions, despite superior trends in representation at junior and midcareer faculty positions.
This cross-sectional study evaluates trends among racial/ethnical minority groups stratified by gender along the surgical pipeline, as well as in surgical leadership.
Abstract
Importance
Diversity in academic surgery is lacking, particularly among positions of leadership.
Objective
To evaluate trends among racial/ethnical minority groups stratified by gender along the surgical pipeline, as well as in surgical leadership.
Design, Setting, and Participants
This cross-sectional and longitudinal analysis assessed US surgical faculty census data obtained from the Association of American Medical Colleges faculty roster in the Faculty Administrative Management Online User System database. Surgical faculty members captured in census data from December 31, 2013, to December 31, 2019, were included in the analysis. Faculty were identified from the surgery category of the faculty roster, which includes general surgeons and subspecialists, neurosurgeons, and urologists.
Main Outcomes and Measures
Gender and race/ethnicity were obtained for surgical faculty stratified by rank. Descriptive statistics with annual percentage of change in representation are reported based on faculty rank.
Results
A total of 15 653 US surgical faculty, including 3876 women (24.8%), were included in the data set for 2019. Female faculty from racial/ethnic minority groups experienced an increase in representation at instructor and assistant and associate professorship appointments, with a more favorable trajectory than male faculty from racial/ethnic minority groups across nearly all ranks. White faculty maintain most leadership positions as full professors (3105 of 3997 [77.7%]) and chairs (294 of 380 [77.4%]). The greatest magnitude of underrepresentation along the surgical pipeline has been among Black (106 of 3997 [2.7%]) and Hispanic/Latinx (176 of 3997 [4.4%]) full professors. Among full professors, although Black and Hispanic/Latinx male representation increased modestly (annual change, 0.07% and 0.10%, respectively), Black female representation remained constant (annual change, 0.00004%) and Hispanic/Latinx female representation decreased (annual change, −0.16%). Overall Hispanic/Latinx (20 of 380 [5.3%]) and Black (13 of 380 [3.4%]) representation as chairs has not changed, with only 1 Black and 1 Hispanic/Latinx woman ascending to chair from 2013 to 2019.
Conclusions and Relevance
A disproportionately small number of faculty from minority groups obtain leadership positions in academic surgery. Intersectionality may leave female members of racial/ethnic minority groups more disadvantaged than their male colleagues in achieving leadership positions. These findings highlight the urgency to diversify surgical leadership.
Introduction
The US population has become increasingly diverse as a result of our country’s rich history of immigration. In 2020, the US population was estimated to be 57.7% White, 18.7% Hispanic, 13.4% Black, and 6.0% Asian.1 The country is projected to become even more diverse by 2065, with the White population decreasing to 44.3%, while the Hispanic population increases to 27.5%, the Black population increases to 15.0%, and the Asian population increases to 9.1%.1 The proportion of people who identify as multiracial is projected to more than double (2.9% in 2020 to 6.2% in 2065).1 By 2045, the US is estimated to be predominantly non-White, representing a demographic shift from previous generations.1
The field of medicine has historically been dominated by White men. Recent efforts by US medical schools to increase the representation of women and races/ethnicities in medicine have been undertaken to provide a workforce that is more representative of the population it serves and to address health care disparities.2,3,4,5 There is now parity between genders among medical students and, in fact, the number of female students entering medical schools recently surpassed that of male students.6 At the resident physician level, the Accreditation Council for Graduate Medical Education has likewise instituted a policy to address diversity.7 In 2013, Yu et al8 estimated that it will take nearly 1000 years for the proportion of Black physicians to reflect the Black population in the US. The study also noted that women constituted only 11% of departmental chairs throughout academic medicine.8 This study was among the first to document female and racial/ethnic minority representation in academic faculty and leadership.
Recognition of a deficit of racial/ethnic minority and female surgeons has led to publications and initiatives addressing diversity in surgery.9,10,11,12,13,14 The effect of racial/ethnic minority faculty members on minority candidate interview selection and match into a surgical residency program was investigated. Although greater minority representation of residents and faculty did not affect the likelihood of being offered an interview, minority representation among residents and faculty were positively correlated,15 suggesting that underrepresented applicants value program diversity and may have a better perceived fit at more diverse programs. Other studies have evaluated racial/ethnic minority groups along various levels of training and academic rank. Abelson et al16 noted increases among Hispanic/Latinx surgical residents, associate and full professors, and tenured surgeons, but that the trajectory of Hispanic/Latinx general surgery trainees fell short of population trends. In contrast, Valenzuela and Romero Arenas17 reported no change in the percentage of Black faculty from 2005 to 2018, whereas a significant decrease in Hispanic/Latinx assistant and associate professors was noted. Other recent studies18,19,20 have reported alarmingly low percentages of Black women holding higher academic ranks, no Black female chairs, and only 0.34% of grants from the National Institutes of Health being awarded to Black female surgeons.
Because medical schools have achieved gender parity among students and have trained a more racially/ethnically diverse physician pool, we sought to understand how the field of surgery has responded, with a focus on trends in leadership positions. Attention has been drawn to the leaky pipeline in surgery for women12,21,22,23,24 and underrepresented minority groups15,16,17,23,24,25 separately, as well as mentorship and leadership affecting diversity.26,27,28 Underrepresentation in medicine data has historically been presented without stratification by gender, leaving a paucity of data on how the trajectory may differ between men and women. This is of particular importance given the historical predominance of White men and the more recent rise of women and racial/ethnic minority groups in medicine. In addition, intersectionality, a term first coined in 1989 by Crenshaw,29 a civil rights advocate and professor of law, may exert an influence. Intersectionality describes the phenomenon whereby multiple social categorizations, such as race and sex/gender, collide, leading to interdependent systems of exclusion, discrimination, or bias. The intersection of these multiple identities that are individually disadvantaged is complex and not necessarily summative. In this study, we aim to evaluate trends among racial/ethnic groups stratified by gender along the surgical pipeline. We hypothesize that although surgical faculty are becoming more diverse, the trajectory of male and female racial/ethnic minority representation differs, particularly among leadership positions.
Methods
This study is a cross-sectional and longitudinal analysis of national aggregated data. Deidentifed clinical faculty data, including faculty rank, gender, and race/ethnicity, were obtained from the Association of American Medical Colleges (AAMC) faculty roster, which is derived from the Faculty Administrative Management Online User System (FAMOUS) database.30 The University of Florida institutional review board deemed this study exempt from review and informed consent owing to the use of roster data. The study was performed in accordance with the Strengthening the Reporting of Observational Studies in Epidemiology (STROBE) reporting guideline.
Faculty data may be self-reported or derived from other integrated AAMC information systems, requiring only verification of demographics from the institution’s designated official. The faculty roster is not government regulated and participation is voluntary, although all AAMC member medical schools participate. Data are refreshed annually in January and are submitted to the FAMOUS database by designated medical school staff. The faculty roster is highly regarded and used by many organizations, including medical schools, federal agencies, the National Institutes of Health, and private organizations, for a variety of purposes such as research and policy making.
According to reporting in the faculty roster, the surgery specialty category includes general surgeons, general surgery subspecialists, neurosurgeons, and urologists. Race/ethnicity were self-reported, including White, Asian, Black, Hispanic/Latinx, non-Hispanic multi–race/ethnicity, American Indian/Alaska Native, Native Hawaiian/Pacific Islander, and other. Those of unknown race or ethnicity were excluded. The faculty roster is considered to have comprehensive data on full-time faculty and departmental chairs; however, the way in which race/ethnicity is reported may vary (ie, some medical schools may report only 1 race/ethnicity vs some may report multi–race/ethnicity for individuals who identify with more than 1 race or ethnicity).
Data analysis was performed for December 31, 2013, through December 31, 2019. Descriptive statistics with mean annual percentage of change in subgroups based on gender, race/ethnicity, and faculty rank were performed using the R statistical software program, version 3.6.3 (R Program for Statistical Computing).31
Results
Representation Among Junior and Midcareer Faculty
A total of 15 653 US surgical faculty, including 3876 women (24.8%), were included in the data set for 2019. Instructors, assistant professors, and associate professors represent junior and midcareer faculty members of increasing rank. The percentage of White instructors was similar in 2013 and 2019 (675 of 992 [68.0%] and 636 of 950 [66.9%], respectively), as was the percentage of assistant professors (4038 of 6064 [66.6%] and 4542 of 6948 [65.4%], respectively), whereas diversity improved among associate professors (2214 of 3030 White associate professors [73.1%] in 2013 and 2299 of 3378 White associate professors [68.1%] in 2019). By 2019, proportions of non-White faculty were similar across instructors, assistant professors, and associate professors, closing a gap of less racial/ethnic diversity among associate professors. However, divergent patterns were seen when non-White races/ethnicities were evaluated individually (Figure 1, Table, and eFigures 1-3 in the Supplement). Asian faculty were consistently overrepresented compared with the US population. Representation of Asian associate professors rose from 2013 (512 of 3030 [16.9%]) to 2019 (692 of 3378 [20.5%]), reaching a proportion comparable to that of instructors (180 of 950 [18.9%]) and assistant professors (1407 of 6948 [20.3%]) by 2019. This increase in non-White associate professors can mostly be attributed to an increase in Asian faculty. Among Black faculty, who remain underrepresented at all levels, there were modest improvements in representation as the percentage of instructors (29 of 992 [2.9%] in 2013 to 43 of 950 [4.5%] in 2019) and associate professors (83 of 3030 [2.7%] in 2013 to 126 of 3378 [3.7%] in 2019) increased, whereas representation among assistant professors remained stable (259 of 6064 [4.3%] in 2013 to 294 of 6948 [4.2%] in 2019). Hispanic/Latinx faculty also remain underrepresented at junior and midcareer faculty ranks, and their representation overall did not improve from 2013 to 2019. There was only a slight increase in Hispanic/Latinx assistant professors (372 of 6064 [6.1%] in 2013 to 471 of 6948 [6.8%] in 2019), whereas proportions of associate professors remained stable (159 of 3030 [5.2%] in 2013 to 171 of 3378 [5.1%] in 2019) and instructors decreased (59 of 992 [5.9%] in 2013 to 53 of 950 [5.6%] in 2019). Faculty of multi–racial/ethnic heritage represented 2.5% or less of junior and midcareer faculty, without appreciable change. Native Hawaiian/Pacific Islander, American Indian/Alaska Native, and other groups remained a miniscule percentage of junior and midcareer faculty with no change in representation.
Figure 1. Representation of Non-White Surgical Faculty by Year.
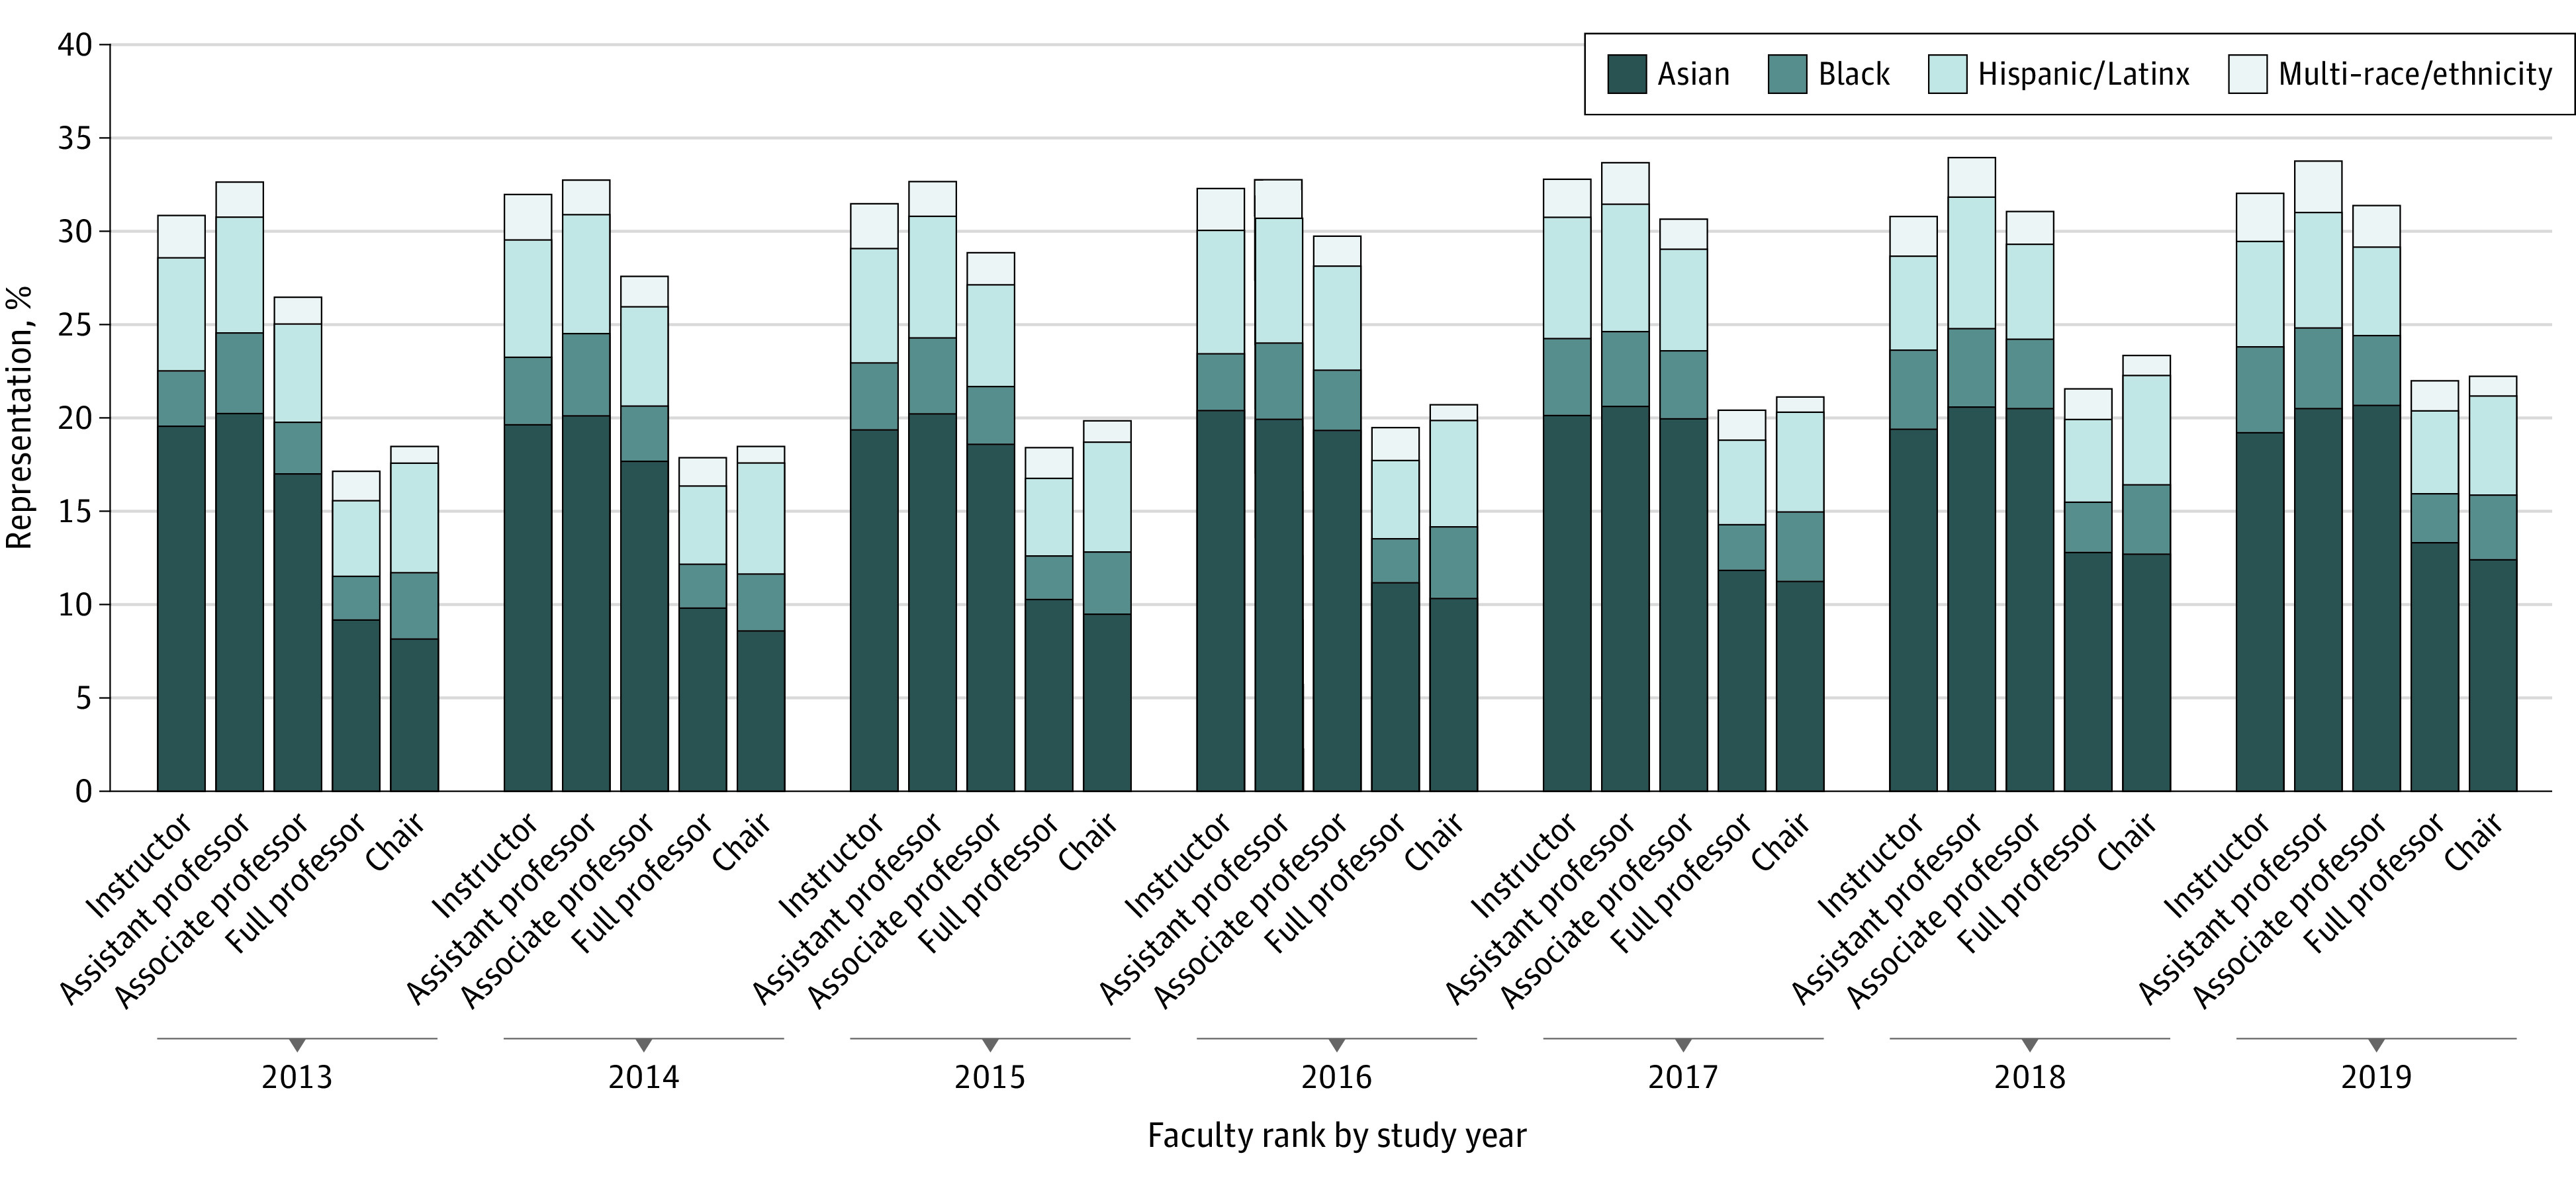
Overall representation of non-White surgical faculty has increased from 2013 to 2019 across all ranks. Non-White faculty represent a disproportionately low percentage of full professors and chairs compared with instructors and assistant and associate professors. Native Hawaiian/Pacific Islander, American Indian/Alaska Native, and other races/ethnicities were excluded from this Figure because their cumulative representation was less than 1%.
Table. Racial/Ethnic Representation of Surgical Faculty by Rank and Mean Annual Percentage of Change in Representation.
| Race/ethnicity | Study year, No./total No. (%) | Mean annual change in representation from 2013 to 2019, %a | |||
|---|---|---|---|---|---|
| 2013 | 2019 | All | Male | Female | |
| Instructors | |||||
| White | 675/992 (68.0) | 636/950 (66.9) | −0.08 | 0.05 | −0.49 |
| Black | 29/992 (2.9) | 43/950 (4.5) | 0.22 | 0.20 | 0.26 |
| Hispanic/Latinx | 59/992 (5.9) | 53/950 (5.6) | −0.11 | −0.37 | 0.20 |
| Asian | 191/992 (19.3) | 180/950 (18.9) | −0.02 | 0.18 | −0.02 |
| Multi–racial/ethnic | 22/992 (2.2) | 24/950 (2.5) | 0.00003 | −0.04 | 0.04 |
| American Indian/Alaska Native | 0/992 | 3/950 (0.3) | 0.06 | 0.00002 | 0.11 |
| Native Hawaiian/Pacific Islander | 6/992 (0.6) | 2/950 (0.2) | −0.06 | −0.10 | −0.01 |
| Other | 10/992 (1.0) | 2/950 (0.2) | −0.01 | 0.07 | −0.10 |
| Assistant professors | |||||
| White | 4038/6064 (66.6) | 4542/6948 (65.4) | −0.25 | −0.08 | −0.62 |
| Black | 259/6064 (4.3) | 294/6948 (4.2) | −0.02 | −0.10 | 0.11 |
| Hispanic/Latinx | 372/6064 (6.1) | 471/6948 (6.8) | 0.12 | 0.14 | 0.11 |
| Asian | 1214/6064 (20.0) | 1407/6948 (20.3) | 0.07 | −0.01 | 0.21 |
| Multi–racial/ethnic | 114/6064 (1.9) | 143/6948 (2.1) | 0.05 | −0.01 | 0.18 |
| American Indian/Alaska Native | 25/6064 (0.4) | 15/6948 (0.2) | −0.03 | −0.04 | 0.01 |
| Native Hawaiian/Pacific Islander | 12/6064 (0.2) | 10/6948 (0.1) | −0.01 | 0.01 | −0.05 |
| Other | 30/6064 (0.5) | 66/6948 (0.9) | 0.07 | 0.08 | 0.05 |
| Associate professors | |||||
| White | 2214/3030 (73.1) | 2299/3378 (68.1) | −0.86 | −0.92 | −0.66 |
| Black | 83/3030 (2.7) | 126/3378 (3.7) | 0.18 | 0.16 | 0.22 |
| Hispanic/Latinx | 159/3030 (5.2) | 171/3378 (5.1) | −0.04 | −0.12 | 0.32 |
| Asian | 512/3030 (16.9) | 692/3378 (20.5) | 0.63 | 0.77 | 0.10 |
| Multi–racial/ethnic | 43/3030 (1.4) | 61/3378 (1.8) | 0.04 | 0.05 | 0.04 |
| American Indian/Alaska Native | 5/3030 (0.2) | 5/3378 (0.1) | −0.01 | 0.01 | −0.09 |
| Native Hawaiian/Pacific Islander | 3/3030 (0.1) | 3/3378 (0.09) | 0.00002 | −0.01 | 0.06 |
| Other | 11/3030 (0.4) | 21/3378 (0.6) | 0.05 | 0.06 | 0.00004 |
| Full professors | |||||
| White | 2903/3516 (82.6) | 3105/3997 (77.7) | −0.86 | −0.84 | −0.87 |
| Black | 82/3516 (2.3) | 106/3997 (2.7) | 0.06 | 0.07 | 0.00004 |
| Hispanic/Latinx | 142/3516 (4.0) | 176/3997 (4.4) | 0.07 | 0.10 | −0.16 |
| Asian | 322/3516 (9.2) | 530/3997 (13.3) | 0.71 | 0.65 | 1.01 |
| Multi–racial/ethnic | 55/3516 (1.6) | 64/3997 (1.6) | 0.01 | 0.01 | 0.04 |
| American Indian/Alaska Native | 1/3516 (0.03) | 2/3997 (0.05) | 0.00002 | 0.00003 | −0.02 |
| Native Hawaiian/Pacific Islander | 0/3516 | 1/3997 (0.03) | 0.01 | 0.01 | NA |
| Other | 11/3516 (0.3) | 13/3997 (0.3) | 0.00003 | 0.01 | −0.02 |
| Chairs | |||||
| White | 278/343 (81.0) | 294/380 (77.4) | −0.78 | −0.63 | −5.30 |
| Black | 12/343 (3.5) | 13/380 (3.4) | 0.05 | 0.02 | 0.87 |
| Hispanic/Latinx | 20/343 (5.8) | 20/380 (5.3) | −0.09 | −0.09 | 0.57 |
| Asian | 28/343 (8.2) | 47/380 (12.4) | 0.81 | 0.67 | 3.86 |
| Multi–racial/ethnic | 3/343 (0.9) | 4/380 (1.1) | 0.02 | 0.03 | NA |
| American Indian/Alaska Native | 0/343 | 0/380 | NA | NA | NA |
| Native Hawaiian/Pacific Islander | 0/343 | 0/380 | NA | NA | NA |
| Other | 2/343 (0.6) | 2/380 (0.5) | −0.01 | −0.00005 | NA |
Abbreviation: NA, not applicable.
Indicates slope of best-fit line in percentage per year with stratification by gender to demonstrate differing trends in representation between male and female surgical faculty over time.
Differing trends are seen between male and female faculty by racial/ethnic minority groups. From 2013 to 2019, the large gap in diversity between male instructors (from 34.8% to 34.7% non-White instructors) and associate professors (from 26.8% to 31.6% non-White instructors) narrowed, but this was partially due to a decrease in non-White representation of instructors from 2017 to 2018 (from 36.7% to 33.9%) (Figure 2). Among female junior and midcareer faculty, instructors (from 25.5% to 29.9%) and associate professors (from 25.1% to 30.6%) have similarly experienced an increase in non-White faculty representation, whereas assistant professors maintained much greater racial/ethnic diversity (from 34.2% to 37.2%) from 2013 to 2019 (Figure 3). Among these faculty appointments, Black women consistently experienced more favorable trends in representation (annual change, 0.26% for instructors, 0.11% for assistant professors, and 0.22% for associate professors) than their male colleagues (Table and eFigures 1-3 in the Supplement). However, Black male assistant professors constituted the only subgroup of Black junior and midcareer faculty to experience a decrease in representation (annual change, −0.10%) (Figure 2, Table, and eFigure 3 in the Supplement). Similarly, Hispanic/Latinx women had more favorable trends in representation compared with Hispanic/Latinx men among instructors (annual change, 0.20% vs −0.37%) and associate professors (annual change, 0.32% vs −0.12%) (Table and eFigures 1 and 3 in the Supplement). In fact, representation of Hispanic/Latinx male instructors and associate professors decreased from 2013 to 2019. Conversely, Asian men fared better than their female colleagues with greater growth rates among instructors (annual change, 0.18% vs −0.02%) and associate professors (annual change, 0.77% vs 0.10%) (Table and eFigures 1 and 3 in the Supplement). Female faculty who are underrepresented in medicine had superior trends in representation among most junior and midcareer faculty appointments compared with their male colleagues.
Figure 2. Representation of Non-White Male Surgical Faculty by Year.
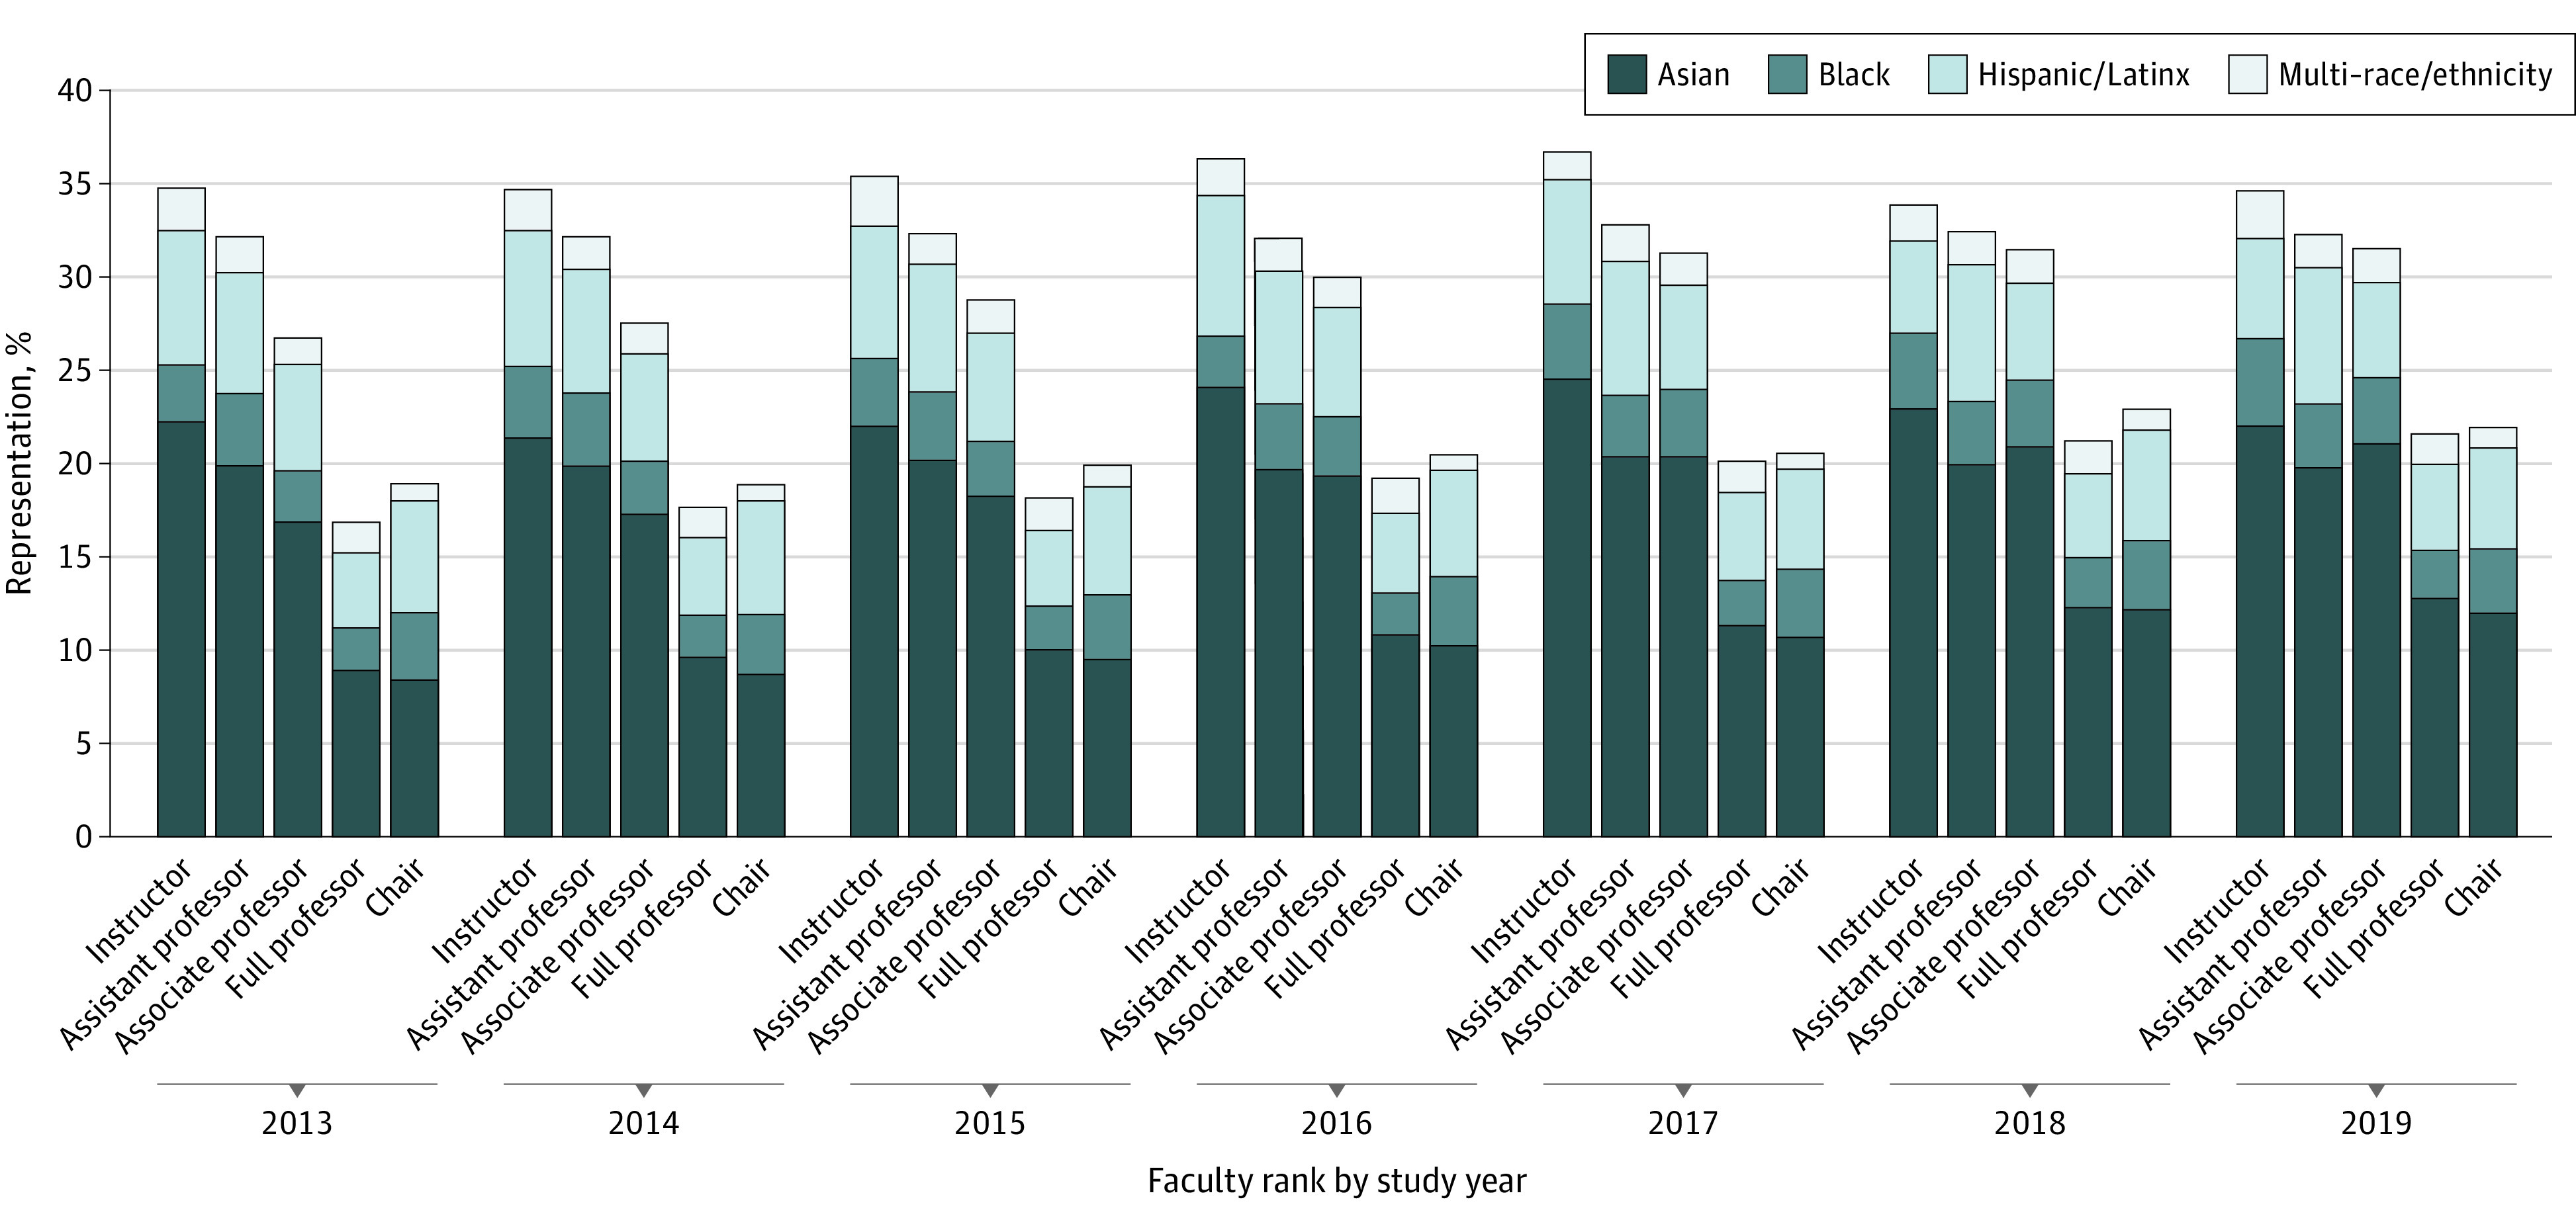
Overall representation of non-White male surgical faculty has increased from 2013 to 2019, across all ranks except instructor. Non-White male faculty representation remains a disproportionately low percentage of full professors and chairs compared with instructors and assistant and associate professors. Native Hawaiian/Pacific Islander, American Indian/Alaska Native, and other races/ethnicities were excluded from this Figure because their cumulative representation was less than 1%.
Figure 3. Representation of Non-White Female Surgical Faculty by Year.

Female surgical faculty have become more racially/ethnically diverse from 2013 to 2019. There were no racial/ethnic minority female chairs of surgery until 2015. Diversity among female surgical faculty is greatest among assistant professors. Native Hawaiian/Pacific Islander, American Indian/Alaska Native, and other races/ethnicities were excluded from this Figure because their cumulative representation was less than 1%.
Racial/Ethnic Diversification Among Surgical Leadership
Full professors and chairs of surgical departments were less likely to be White in 2019 (3105 of 3997 [77.7%] and 294 of 380 [77.4%], respectively) compared with 2013 (2903 of 3516 [82.6%] and 278 of 343 [81.0%], respectively) but were strikingly less diverse than the remainder of the surgical pipeline (Figure 1). Asian faculty realized the greatest increase of full professors (322 of 3516 [9.2%] in 2013 vs 530 of 3997 [13.3%] in 2019) (Figure 1, Table, and eFigure 4 in the Supplement). The greatest magnitude of underrepresentation along the entire surgical pipeline has been among full professors who were Black (82 of 3516 [2.3%] in 2013 vs 106 of 3997 [2.7%] in 2019) and Hispanic/Latinx (142 of 3516 [4.0%] in 2013 vs 176 of 3997 [4.4%] in 2019) (Table and eFigure 4 in the Supplement). Among full professors, 64 of 3997 (1.6%) identified as multi–race/ethnicity, and nearly all of these faculty were male, far less than the remainder of the pipeline. In 2019, only 2 of 3997 full professors (0.05%) were American Indian/Alaska Native and 1 of 3997 (0.03%) was Native Hawaiian/Pacific Islander. The rate of increase among non-White full professors was similar among male and female faculty (Figure 2, Figure 3, and Table). However, there has been no change in the percentage of Black female full professors (annual change, 0.00004%) and trivial growth in the percentage of Black male full professors (annual change, 0.07%). From 2013 to 2019, there was a decrease in Hispanic/Latinx female full professors from 14 of 335 (4.2%) to 18 of 521 (3.5%; annual change, −0.16%), whereas Hispanic/Latinx male full professors increased from 128 of 3181 (4.0%) to 158 of 3476 (4.5%; annual change, 0.10%). The most rapid increase in representation of full professors was by Asian women (annual change, 1.01%), followed by Asian men (annual change, 0.65%) (Table). Women who are racially/ethnically underrepresented in medicine had inferior trends compared with their male colleagues at the rank of full professor.
Among chairs, a slow but steady increase in racial/ethnic diversity has been observed (Figure 1, Table, and eFigure 5 in the Supplement), with Asian faculty realizing the greatest increase (28 of 343 [8.2%] in 2013 vs 47 of 380 [12.4%] in 2019). In 2019, Black faculty represented 13 of 380 chairs (3.4%), whereas Hispanic/Latinx faculty represented 20 of 380 (5.3%), and only 4 of 380 (1.1%) identified as multi–race/ethnicity. White women experienced a much larger decrease in representation compared with White men (annual change, −5.30% vs −0.63%) (Figures 2 and 3, Table, and eFigure 5 in the Supplement). However, it should be noted that there were no female chairs from racial/ethnic minority groups until 2015 (Figure 3). The increasing representation of Asian female chairs occurred much more rapidly than among their male colleagues. Black male chair representation remained similar (annual change, 0.02%), whereas there was a decrease in Hispanic/Latinx male chairs (annual change, −0.09%) (Figure 2, Table, and eFigure 5 in the Supplement). By 2019, only 1 Black woman and 1 Hispanic/Latinx woman had ascended to chair. Diversification among surgical leadership has not been inclusive of groups underrepresented in medicine and was experienced almost exclusively by Asian faculty (annual change, 0.81%).
Discussion
This study is the first, to our knowledge, to evaluate trends in racial/ethnic diversification and intersectionality with gender in academic surgery, focusing on the evolution of surgical leadership in comparison with the remainder of the surgical pipeline. As hypothesized, the trajectory of male and female faculty who are underrepresented in medicine differ along the surgical pipeline. Underrepresented male faculty experienced a more positive trajectory among full professors, whereas underrepresented female faculty fared better than their male colleagues across nearly all junior or midcareer faculty positions. Underrepresented groups in female faculty had a positive trajectory in all positions other than the highest faculty appointment (full professors), suggesting that intersectionality may leave them more disadvantaged than male faculty in achieving leadership positions.
The shift away from White full professors and chairs has heavily favored Asian faculty along the entire surgical pipeline. At the level of chair, underrepresented groups have experienced virtually no progress. Importantly, racial/ethnic trends among female chairs are difficult to interpret, because the promotion of 1 individual increases the percentage of representation drastically owing to the low denominator (28 female chairs in 2019). We report the recent addition of 1 Black female chair, a urologist, which differs from previous work that did not include urology,18 as well as 1 Hispanic/Latinx female chair, highlighting an enormous gap that remains in the diversity of surgical leaders. Although it is likely that most people of multi–race/ethnicity constitute underrepresented heritages based on data before the addition of this category, this remains uncertain. Regardless, the perspectives and experiences of multi–racial/ethnic groups are unique.
Opportunities to increase the representation of groups of color exist, particularly among leadership positions with the hope of not only promoting diversity, equity, and inclusion among our leaders, but also to positively affect recruitment and advancement of these groups in surgical specialties. As the percentage of female full professors and chairs has increased, so too has the percentage of women entering surgical residencies. Perhaps an analogous increase in underrepresented faculty among leadership would lead to increases along the pipeline. There is opportunity for the promotion of Black faculty to leadership positions given the positive trend in Black associate professors, the metaphorical stepping-stone to full professor. Modest increases in Black and Hispanic/Latinx male full professors have occurred, but not yet with chairs. These men are at risk of losing traction in junior and midlevel faculty positions, creating an even more urgent need for mentorship and recruitment of Black and Hispanic/Latinx men graduating from medical schools into surgical careers. In addition, there is great opportunity for the promotion of Black and Hispanic/Latinx women to leadership positions, because these women have experienced growth in representation among all preceding faculty ranks.
The underrepresentation of racial/ethnic minority groups and women in academic leadership positions may be partially attributable to implicit bias, lack of mentorship or sponsorship, recruitment processes, National Institutes of Health funding disparities, systemic racism or bias, and other factors.20,21,28,32 A study on barriers and facilitators to success for women in academic surgery identified the following 3 major themes that mediate and affect professional advancement: (1) organizational culture and institutional policies, (2) interactions with leadership, mentors, colleagues, and staff, and (3) individual characteristics.21 It has been reported that women are less likely to be full professors after adjusting for years since residency, publications, grants, clinical trials participation, and subspecialty.33 A survey of the American College of Surgeons Board of Governors showed that the perception of gender equality, as well as equal pay and promotion, differs between male and female governors, raising concern for lack of problem recognition.34 These gender themes may be translated to underrepresented groups in medicine as well. Mentorship also has an important influence on career development and achievement of leadership positions. Many factors contribute to identifying a mentor and developing a fruitful relationship, including someone with whom one can resonate or identify (ie, a mentor of the same gender or race/ethnicity). Minority junior faculty members may lack mentors and thus be disadvantaged in their career growth if those who hold leadership positions seem to fit the same pedigree. In addition, strong mentorship in medical school is highly influential in guiding one’s career and choosing a specialty.26,27 Medical students who are underrepresented in medicine may struggle to identify surgical mentors with whom they resonate and thus not feel that the specialty is a good fit.26,35 Another potential contributing factor to differences in academic advancement between genders is the effect of parental leave, which disproportionately affects women in the US. Although supporting data are lacking, parental leave is more equally shared between men and women in some countries, potentially equalizing career opportunities and professional advancement. Undoubtedly, work remains to be done to address the challenges that women and underrepresented groups in medicine face in achieving leadership positions.
Limitations
This study is not without limitations. Although leaders in surgery were limited to full professors and chairs, similar patterns are likely present among other leadership positions.36,37,38,39 In addition, data on trends in promotion and tenure track of faculty members were beyond the scope of this study. Black assistant professors hired between 2003 and 2006 were previously found to have the lowest 10-year promotion rates, whereas retention rates for groups underrepresented in medicine were significantly lower than for White faculty, suggesting a glass ceiling that limits the professional development of underrepresented faculty.25 It remains unknown whether their promotion trajectory has changed in more recent years. The addition of multi–racial/ethnic heritage and variable use of this category likely affects the proportion of other racial/ethnic categories, but this is unlikely to affect the overall results given the low percentage of multi–racial/ethnic surgical leaders. Finally, the surgery specialty category in the faculty roster included general surgeons and their subspecialists, neurosurgeons, and urologists, which may all have slightly different diversity landscapes, although they are unlikely to have vast differences.
Conclusions
The findings of this cross-sectional study suggest that little progress has occurred in racial/ethnic diversification among surgical leaders. Although gender and race/ethnicity are not the only forms of diversity, inclusion of groups underrepresented in medicine, particularly female racial/ethnic minority faculty, is urgently needed in positions of surgical leadership. Diversification to the point of achieving equal representation of the US population will take decades to achieve, because trends among surgical leadership show that significant work remains to be done. Many surgeons of racial/ethnic minority groups and female surgeons aspire to lead and have the necessary qualifications to excel in such roles. Cultivation of environments that are more conducive to diversity will allow departments to achieve representation reflective of the communities we serve, rather than maintaining the traditional pedigree. Increased diversification of surgical leadership will allow for a top-down approach to improving both the surgical pipeline and the care of patients who undergo surgery.
eFigure 1. Racial/Ethnic Diversity Among Instructors, 2013-2019
eFigure 2. Racial/Ethnic Diversity Among Assistant Professors, 2013-2019
eFigure 3. Racial/Ethnic Diversity Among Associate Professors, 2013-2019
eFigure 4. Racial/Ethnic Diversity Among Full Professors, 2013-2019
eFigure 5. Racial/Ethnic Diversity Among Chairs, 2013-2019
References
- 1.US Census Bureau . 2017 National population projections tables: main series. Revised February 20, 2020. Accessed June 16, 2020. https://www.census.gov/data/tables/2017/demo/popproj/2017-summary-tables.html
- 2.Silver JK, Bean AC, Slocum C, et al. Physician workforce disparities and patient care: a narrative review. Health Equity. 2019;3(1):360-377. doi: 10.1089/heq.2019.0040 [DOI] [PMC free article] [PubMed] [Google Scholar]
- 3.Kington R, Tisnado D, Carlisle D. Increasing Racial and Ethnic Diversity Among Physicians: An Intervention to Address Health Disparities? Institute of Medicine; 2001. [Google Scholar]
- 4.AAMC . Underrepresented in medicine definition. Updated March 19, 2004. Accessed July 10, 2020. https://www.aamc.org/what-we-do/mission-areas/diversity-inclusion/underrepresented-in-medicine
- 5.Marrast LM, Zallman L, Woolhandler S, Bor DH, McCormick D. Minority physicians’ role in the care of underserved patients: diversifying the physician workforce may be key in addressing health disparities. JAMA Intern Med. 2014;174(2):289-291. doi: 10.1001/jamainternmed.2013.12756 [DOI] [PubMed] [Google Scholar]
- 6.Association of American Medical Colleges . The majority of US medical students are women, new data show. Published December 9, 2019. Accessed July 10, 2020. https://www.aamc.org/news-insights/press-releases/majority-us-medical-students-are-women-new-data-show
- 7.Accreditation Council for Graduate Medical Education . Common program requirements. Updated February 2, 2020. Accessed July 10, 2020. https://www.acgme.org/What-We-Do/Accreditation/Common-Program-Requirements
- 8.Yu PT, Parsa PV, Hassanein O, Rogers SO, Chang DC. Minorities struggle to advance in academic medicine: a 12-y review of diversity at the highest levels of America’s teaching institutions. J Surg Res. 2013;182(2):212-218. doi: 10.1016/j.jss.2012.06.049 [DOI] [PubMed] [Google Scholar]
- 9.Butler PD, Britt LD, Green ML Jr, et al. The diverse surgeons initiative: an effective method for increasing the number of under-represented minorities in academic surgery. J Am Coll Surg. 2010;211(4):561-566. doi: 10.1016/j.jamcollsurg.2010.06.019 [DOI] [PubMed] [Google Scholar]
- 10.Butler PD, Britt LD, Richard CE, et al. The diverse surgeons’ initiative: longitudinal assessment of a successful national program. J Am Coll Surg. 2015;220(3):362-369. doi: 10.1016/j.jamcollsurg.2014.12.006 [DOI] [PubMed] [Google Scholar]
- 11.Society of Black Academic Surgeons . About SBAS. Updated February 1, 2017. Accessed July 13, 2020. https://sbas.net/about/
- 12.Abelson JS, Chartrand G, Moo TA, Moore M, Yeo H. The climb to break the glass ceiling in surgery: trends in women progressing from medical school to surgical training and academic leadership from 1994 to 2015. Am J Surg. 2016;212(4):566-572.e1. doi: 10.1016/j.amjsurg.2016.06.012 [DOI] [PubMed] [Google Scholar]
- 13.Butler PD, Longaker MT, Britt LD. Major deficit in the number of underrepresented minority academic surgeons persists. Ann Surg. 2008;248(5):704-711. doi: 10.1097/SLA.0b013e31817f2c30 [DOI] [PubMed] [Google Scholar]
- 14.Butler PD, Longaker MT, Britt LD. Addressing the paucity of underrepresented minorities in academic surgery: can the “Rooney Rule” be applied to academic surgery? Am J Surg. 2010;199(2):255-262. doi: 10.1016/j.amjsurg.2009.05.021 [DOI] [PubMed] [Google Scholar]
- 15.Jarman BT, Borgert AJ, Kallies KJ, et al. Underrepresented minorities in general surgery residency: analysis of interviewed applicants, residents, and core teaching faculty. J Am Coll Surg. 2020;231(1):54-58. doi: 10.1016/j.jamcollsurg.2020.02.042 [DOI] [PubMed] [Google Scholar]
- 16.Abelson JS, Symer MM, Yeo HL, et al. Surgical time out: our counts are still short on racial diversity in academic surgery. Am J Surg. 2018;215(4):542-548. doi: 10.1016/j.amjsurg.2017.06.028 [DOI] [PubMed] [Google Scholar]
- 17.Valenzuela F, Romero Arenas MA. Underrepresented in surgery: (lack of) diversity in academic surgery faculty. J Surg Res. 2020;254:170-174. doi: 10.1016/j.jss.2020.04.008 [DOI] [PubMed] [Google Scholar]
- 18.Berry C, Khabele D, Johnson-Mann C, et al. A call to action: Black/African American women surgeon scientists, where are they? Ann Surg. 2020;272(1):24-29. doi: 10.1097/SLA.0000000000003786 [DOI] [PubMed] [Google Scholar]
- 19.Butler PD, Pugh CM, Meer E, et al. Benchmarking accomplishments of leaders in American surgery and justification for enhancing diversity and inclusion. Ann Surg. 2020;272(6):897-903. doi: 10.1097/SLA.0000000000004151 [DOI] [PubMed] [Google Scholar]
- 20.Crown A, Berry C, Khabele D, et al. The role of race and gender in the career experiences of Black/African-American academic surgeons: a survey of the Society of Black Academic Surgeons and a call to action. Ann Surg. 2020. doi: 10.1097/SLA.0000000000004502 [DOI] [PubMed] [Google Scholar]
- 21.Thompson-Burdine JA, Telem DA, Waljee JF, et al. Defining barriers and facilitators to advancement for women in academic surgery. JAMA Netw Open. 2019;2(8):e1910228. doi: 10.1001/jamanetworkopen.2019.10228 [DOI] [PMC free article] [PubMed] [Google Scholar]
- 22.Sexton KW, Hocking KM, Wise E, et al. Women in academic surgery: the pipeline is busted. J Surg Educ. 2012;69(1):84-90. doi: 10.1016/j.jsurg.2011.07.008 [DOI] [PMC free article] [PubMed] [Google Scholar]
- 23.Bingmer K, Ofshteyn A, Bliggenstorfer JT, Steinhagen E, Stein SL. Where is the leak in the surgeon pipeline? Am J Surg. 2020;220(5):1174-1178. doi: 10.1016/j.amjsurg.2020.06.048 [DOI] [PubMed] [Google Scholar]
- 24.Aggarwal A, Rosen CB, Nehemiah A, et al. Is there color or sex behind the mask and sterile blue? examining sex and racial demographics within academic surgery. Ann Surg. 2021;273(1):21-27. doi: 10.1097/SLA.0000000000004461 [DOI] [PubMed] [Google Scholar]
- 25.Abelson JS, Wong NZ, Symer M, Eckenrode G, Watkins A, Yeo HL. Racial and ethnic disparities in promotion and retention of academic surgeons. Am J Surg. 2018;216(4):678-682. doi: 10.1016/j.amjsurg.2018.07.020 [DOI] [PubMed] [Google Scholar]
- 26.Roberts SE, Shea JA, Sellers M, Butler PD, Kelz RR. Pursing a career in academic surgery among African American medical students. Am J Surg. 2020;219(4):598-603. doi: 10.1016/j.amjsurg.2019.08.009 [DOI] [PubMed] [Google Scholar]
- 27.Bettis J, Thrush CR, Slotcavage RL, Stephenson K, Petersen E, Kimbrough MK. What makes them different? an exploration of mentoring for female faculty, residents, and medical students pursuing a career in surgery. Am J Surg. 2019;218(4):767-771. doi: 10.1016/j.amjsurg.2019.07.029 [DOI] [PubMed] [Google Scholar]
- 28.Columbus AB, Lu PW, Hill SS, Fields AC, Davids JS, Melnitchouk N. Factors associated with the professional success of female surgical department chairs: a qualitative study. JAMA Surg. 2020;155(11):1028-1033. doi: 10.1001/jamasurg.2020.3023 [DOI] [PMC free article] [PubMed] [Google Scholar]
- 29.Crenshaw K. Demarginalizing the intersection of race and sex: a black feminist critique of antidiscrimination doctrine, feminist theory and antiracist politics. University of Chicago Legal Forum. 1989;(1, article 8):139-167. Accessed February 18, 2021. https://chicagounbound.uchicago.edu/uclf/vol1989/iss1/8 [Google Scholar]
- 30.Association of American Medical Colleges. Faculty roster: US medical school faculty. FAMOUS (Faculty Administrative Management Online User System) . Accessed February 29, 2020. https://www.aamc.org/data-reports/faculty-institutions/report/faculty-roster-us-medical-school-faculty
- 31.R Core Team . R: A Language and Environment for Statistical Computing. R Program for Statistical Computing; 2017. Accessed December 26, 2020. https://www.R-project.org/.
- 32.Lewit RA, Black CM, Camp L, et al. Association of sex and race/ethnicity with National Institutes of Health funding of surgeon-scientists. JAMA Surg. 2021;156(2):195-197. doi: 10.1001/jamasurg.2020.5016 [DOI] [PMC free article] [PubMed] [Google Scholar]
- 33.Blumenthal DM, Bergmark RW, Raol N, Bohnen JD, Eloy JA, Gray ST. Sex differences in faculty rank among academic surgeons in the United States in 2014. Ann Surg. 2018;268(2):193-200. doi: 10.1097/SLA.0000000000002662 [DOI] [PubMed] [Google Scholar]
- 34.Aziz HA, Ducoin C, Welsh DJ, et al. 2018 ACS Governors Survey: gender inequality and harassment remain a challenge in surgery. Published September 1, 2019. Accessed December 15, 2020. https://bulletin.facs.org/2019/09/2018-acs-governors-survey-gender-inequality-and-harassment-remain-a-challenge-in-surgery/
- 35.Peel JK, Schlachta CM, Alkhamesi NA. A systematic review of the factors affecting choice of surgery as a career. Can J Surg. 2018;61(1):58-67. doi: 10.1503/cjs.008217 [DOI] [PMC free article] [PubMed] [Google Scholar]
- 36.Kassam AF, Taylor M, Cortez AR, Winer LK, Quillin RC. Gender and ethnic diversity in academic general surgery department leadership. Am J Surg. 2021;221(2):363-368. doi: 10.1016/j.amjsurg.2020.11.046 [DOI] [PubMed] [Google Scholar]
- 37.Kuo LE, Parangi S, Cho NL. Diversity and inclusion in a surgical society: a longitudinal investigation. Surgery. 2019;165(4):808-813. doi: 10.1016/j.surg.2018.10.027 [DOI] [PubMed] [Google Scholar]
- 38.Arora TK, Dent D, Morris-Wiseman L, Nfonsam V. Diversity in the last decade of the Association of Program Directors in Surgery: a descriptive analysis of leadership and future directions. J Surg Educ. 2019;76(6):e125-e131. doi: 10.1016/j.jsurg.2019.08.016 [DOI] [PubMed] [Google Scholar]
- 39.Teh J, Nzenza TC, Hoog SO, Lawrentschuk N. Towards gender diversity in urological leadership. Nat Rev Urol. 2018;15(8):463-464. doi: 10.1038/s41585-018-0039-4 [DOI] [PubMed] [Google Scholar]
Associated Data
This section collects any data citations, data availability statements, or supplementary materials included in this article.
Supplementary Materials
eFigure 1. Racial/Ethnic Diversity Among Instructors, 2013-2019
eFigure 2. Racial/Ethnic Diversity Among Assistant Professors, 2013-2019
eFigure 3. Racial/Ethnic Diversity Among Associate Professors, 2013-2019
eFigure 4. Racial/Ethnic Diversity Among Full Professors, 2013-2019
eFigure 5. Racial/Ethnic Diversity Among Chairs, 2013-2019