

Abstract
Synucleinopathies are neurodegenerative disorders characterized by abnormal α-synuclein deposition that include Parkinson’s disease (PD), dementia with Lewy bodies (DLB), and multiple system atrophy (MSA). The pathology of these conditions also includes neuronal loss and neuroinflammation. Neuron-released α-synuclein has been shown to induce neurotoxic, pro-inflammatory microglial responses through Toll-like receptor 2 (TLR2) but the molecular mechanisms involved are poorly understood. Here, we showed that Leucine-rich repeat kinase 2 (LRRK2) plays a critical role in the activation of microglia by extracellular α-synuclein. Exposure to α-synuclein was found to enhance LRRK2 phosphorylation and activity in mouse primary microglia. Furthermore, genetic and pharmacological inhibition of LRRK2 markedly diminished α-synuclein-mediated microglial neurotoxicity via lowering of TNFα and IL-6 expression in mouse cultures. We determined that LRRK2 promoted a neuroinflammatory cascade by selectively phosphorylating and inducing nuclear translocation of the immune transcription factor nuclear factor of activated T-cells, cytoplasmic 2 (NFATc2). NFATc2 activation was seen in patients with synucleinopathies and in a mouse model of synucleinopathy, where administration of a LRRK2 pharmacological inhibitor restored motor behavioral deficits. Our results suggest that modulation of LRRK2 and its downstream signaling mediator NFATc2 might be therapeutic targets for treating synucleinopathies.
One Sentence Summary:
LRRK2 modulates nucleus translocation of NFATc2 in microglia.
INTRODUCTION
Synucleinopathies such as Parkinson’s disease (PD), dementia with Lewy bodies (DLB), and multiple system atrophy (MSA) are neurodegenerative diseases mostly affecting aging individuals characterized by progressive and abnormal accumulation of soluble and insoluble α-synuclein in neurons and glia (1, 2). A large body of evidence supports the cell-autonomous neurotoxicity of soluble α-synuclein aggregates, involving disruptions in vesicle recycling, mitochondrial energy production, and protein homeostasis (2, 3). Recently, however, non-cell-autonomous mechanisms, such as the pathological transmission of α-synuclein from neuron to neuron and from neuron to glia, have been identified (4). Although α-synuclein is typically a neuronal cytosolic protein, it can be secreted into the extracellular environment (4). Extracellular α-synuclein can be taken up by neighboring cells, promoting neurotoxic α-synuclein accumulation in neurons and a series of neuroinflammatory responses in microglia (5–7).
Neuroinflammation has been strongly associated with the pathogenesis of PD and DLB (8). We have previously shown that oligomeric forms of neuron-released α-synuclein can induce neurotoxic microglial activation through Toll-like receptor 2 (TLR2) (7, 9). Through NFκB and p38 MAPK downstream signaling pathways, TLR2-activated microglia release neurotoxic pro-inflammatory cytokines such as TNFα and IL-6 (7, 10). Corroborating this mechanism, functional inhibition of TLR2 via a neutralizing antibody substantially reduced neuroinflammation and ameliorated neurodegeneration in a synucleinopathy mouse model (11).
Leucine-rich repeat kinase 2 (LRRK2) is a serine/threonine kinase belonging to the ROCO protein family (12). Missense mutations in LRRK2 are associated with autosomal dominant PD (12). LRRK2 contains multiple functional domains, including a WD40 repeat, leucine-rich repeat (LRR), GTP-binding regulatory domain, and kinase domain (12). Multiple LRRK2 residues can be phosphorylated by autophosphorylation or other upstream kinases (13). Although LRRK2 has been extensively studied in neurons, increasing evidence suggests an essential role for LRRK2 in microglia-mediated neuroinflammation (14). Exposure to lipopolysaccharide (LPS) induces microglial LRRK2 expression in vivo and in vitro (15, 16). Furthermore, knockdown of LRRK2 reduced the transcriptional activity of NFκB, a master regulator of pro-inflammatory gene expression in LPS-exposed microglia (17). However, the specific neuroinflammation cascade orchestrated by LRRK2 in microglia and its relevance to the pathogenesis of PD and DLB has not been fully elucidated.
In this study, we characterized a LRRK2-dependent pathway in microglial activation and the associated inflammatory response to neuron-released α-synuclein. Specifically, we identified nuclear factor of activated T cells, cytoplasm 2 (NFATc2) as a kinase substrate for LRRK2 in mouse. In this cascade, neuron-released α-synuclein activates LRRK2 kinase activity in microglia via TLR2 to induce the nuclear translocation of NFATc2, where NFATc2 transcriptional activity can promote a neurotoxic inflammatory environment in synucleinopathies. Therefore, we suggest that the LRKK2-NFATc2 signaling cascade might be a therapeutic target for PD and DLB.
RESULTS
Neuron-released α-synuclein activates microglial LRRK2
To investigate the role of LRRK2 in the process of microglial activation by extracellular α-synuclein, we treated mouse non-transgenic primary microglia cells with conditioned medium obtained from neuronal cells expressing either β-galactosidase (LZCM) or human α-synuclein (αSCM) (Fig. 1A) (7, 18). Primary microglia cells were isolated from the brains of one-day old mice and cultured for 10–12 days before exposure to αSCM. We previously demonstrated that microglial activation is dependent on the α-synuclein concentration in the conditioned media (7). αSCM used in this study contained 1.06 ± 0.371 μg ml−1 α-synuclein (7).
Fig. 1. Neuron-released α-synuclein activates microglial LRRK2.
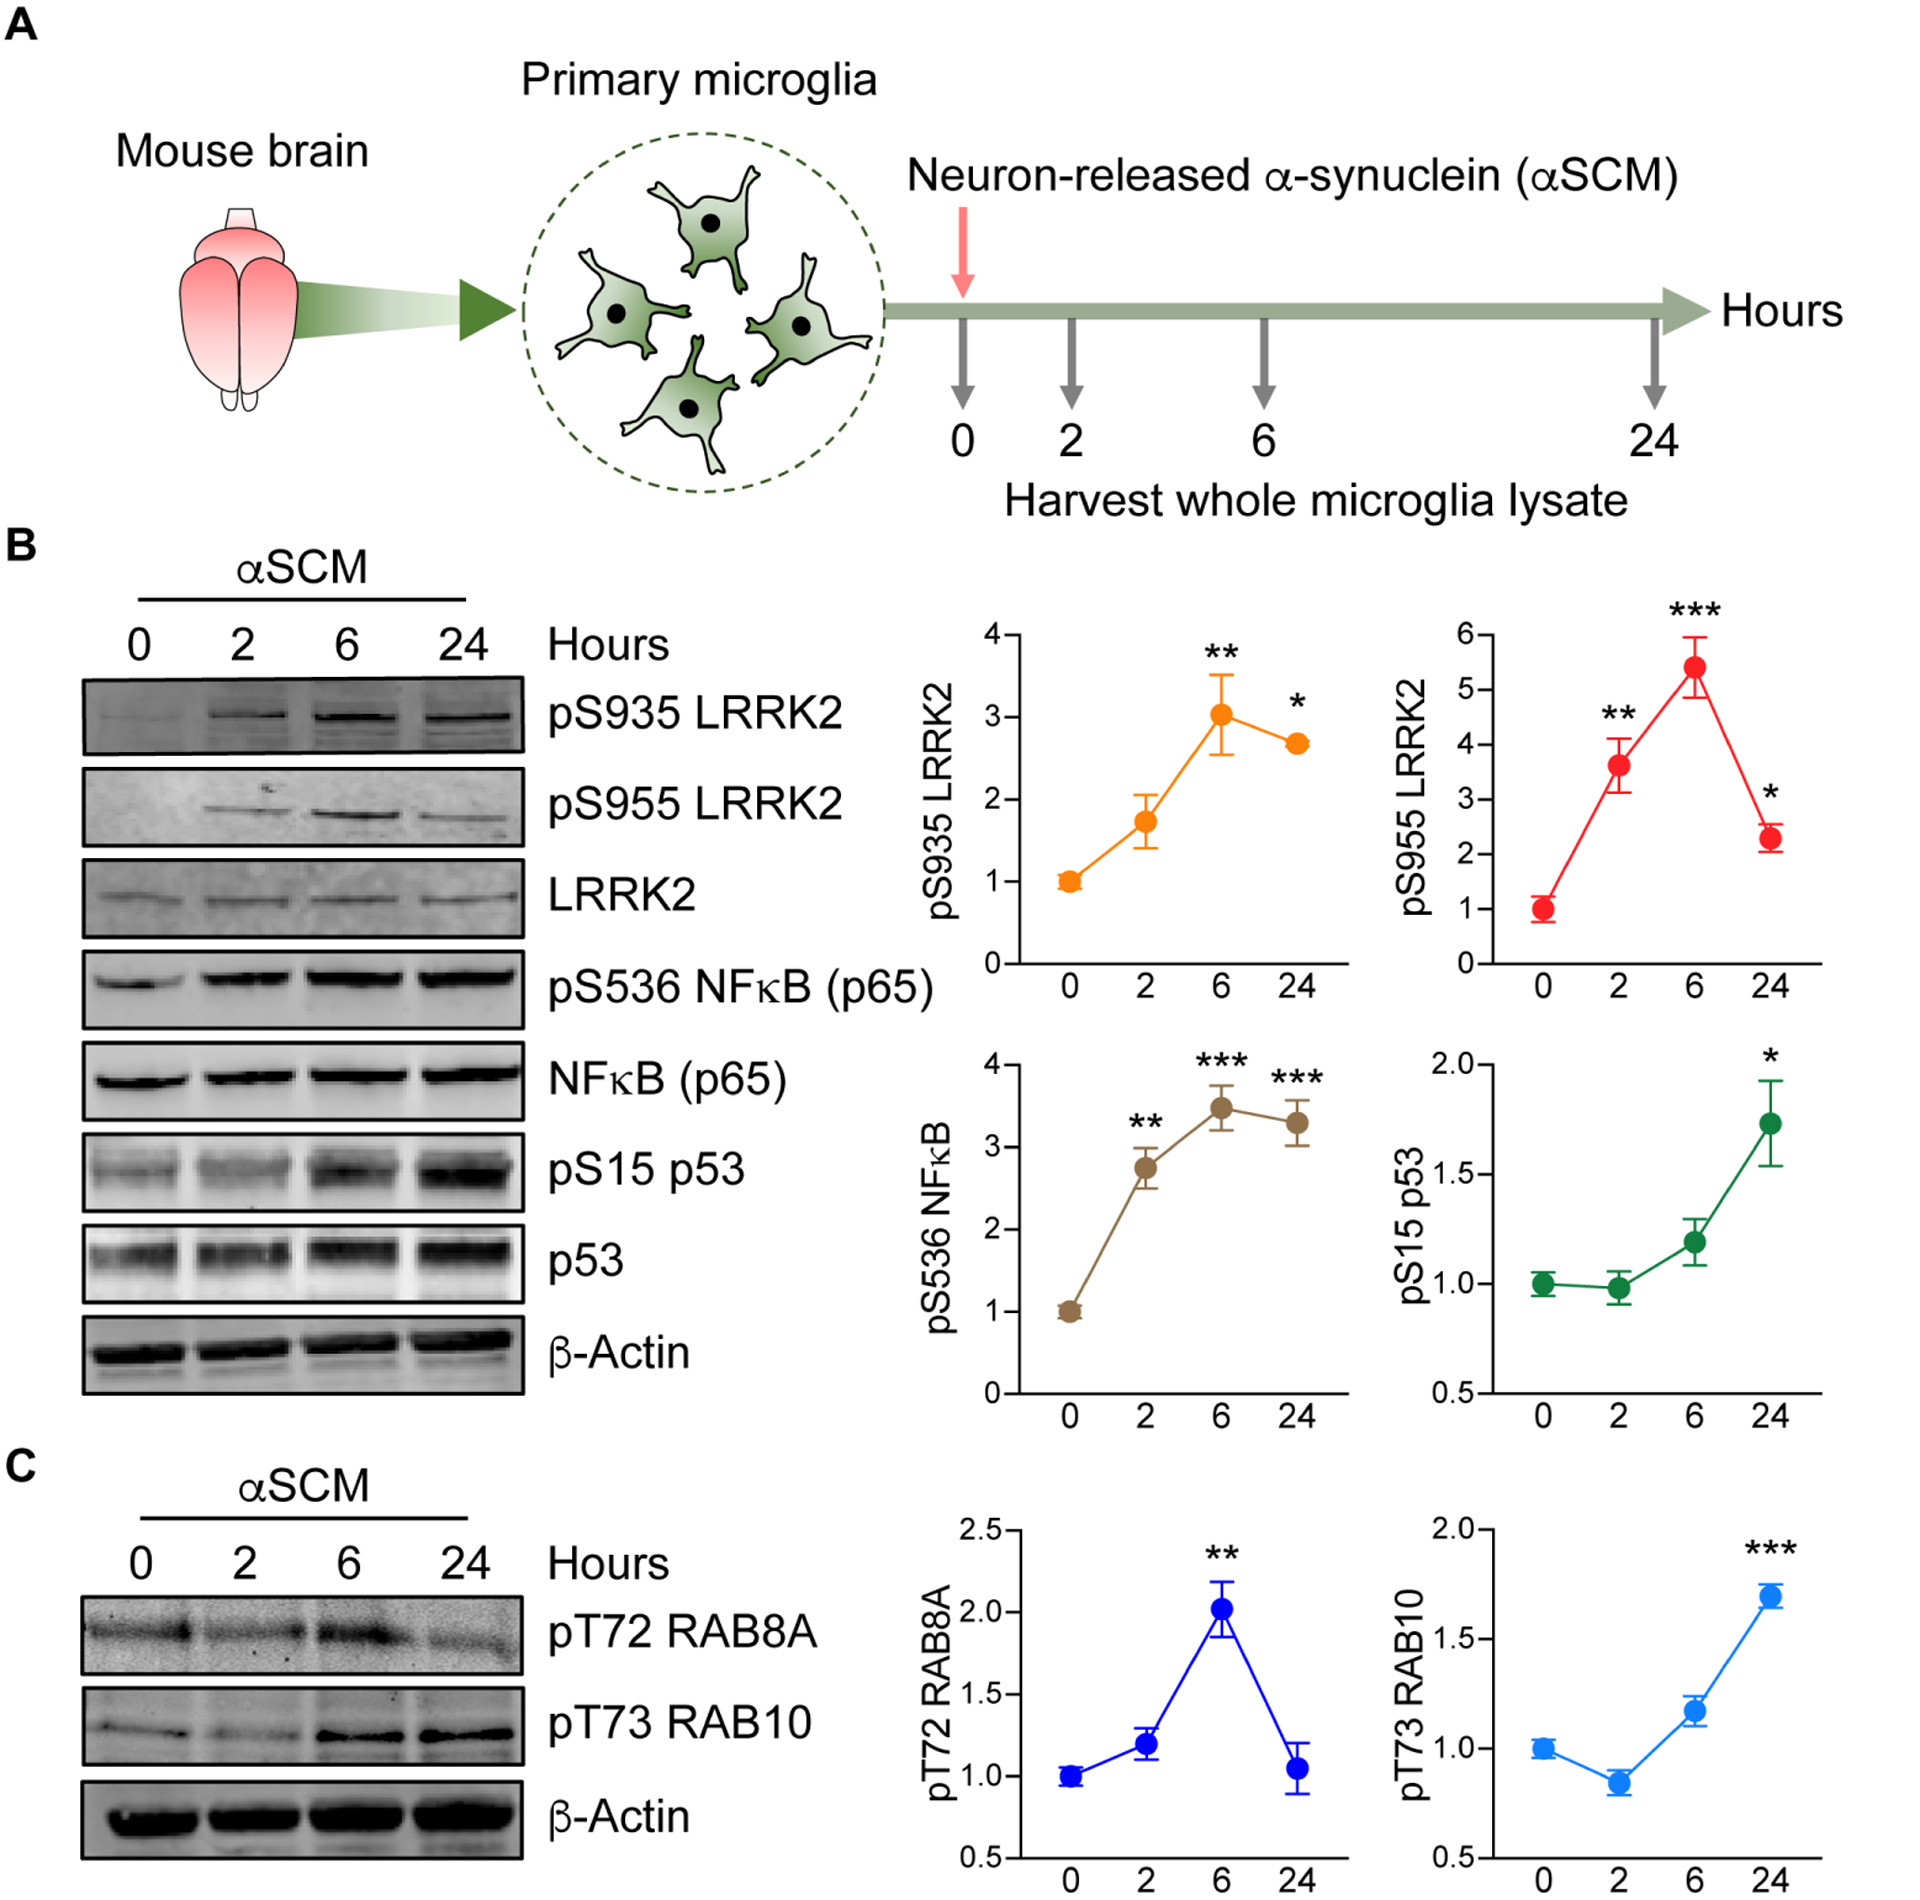
(A) Schematic illustration of treatment of primary microglia with neuron-released α-synuclein (αSCM). (B) Primary wild type mouse microglia were treated with αSCM for 0, 2, 6, and 24 hours and whole cell lysates were analyzed by western blot. The band intensities of phosphorylated LRRK2, NFκB, and p53 were quantified by densitometric quantification and normalized to the respective total protein. Data are means ± SEM. *P < 0.05, **P < 0.01, and ***P < 0.001 (One-way ANOVA with Tukey’s multiple comparison post-hoc test). n = 3 per group. (C) Phosphorylation of RAB8A and RAB10 in αSCM-exposed microglia were visualized by western blot analysis. Phospho-T72 RAB8A and phospho-T73 RAB10 were determined by densitometric quantification and normalized to total RAB8A and RAB10, respectively. Data are means ± SEM. **P < 0.01 and ***P < 0.001 (One-way ANOVA with Tukey’s multiple comparison post-hoc test). n = 3 per group.
Following incubation for 0, 2, 6, or 24 hours, whole microglia lysates were analyzed by western blot for the expression of inflammatory mediators (Fig. 1B). Exposure to αSCM, but not LZCM, increased phosphorylation of both NFκB and p53 in a time-dependent manner (Fig. 1B and fig. S1A). Lrrk2 phosphorylation (S935 and S955) was acutely increased in αSCM-exposed microglia whereas unaffected by LZCM or recombinant α-synuclein fibril treatment (Fig. 1B and fig. S1, A and B).
We have previously shown that neuronally released α-synuclein in αSCM activates TLR2 on the surface of microglia (7). Consistent with our previous observations, pre-treating αSCM-exposed primary mouse microglia with TLR2 functional blocking antibody T2.5 (10 μg ml−1), but not IgG (10 μg ml−1), significantly (P < 0.001) inhibited phosphorylation of NFκB, p38 MAPK, and LRRK2 (fig. S2, A and B).
Given that pharmacological inhibition of LRRK2 is known to disrupt phosphorylation at S935 and S955 (19–22), we next monitored the phosphorylation of LRRK2 kinase substrates Ras-related protein Rab-8A (RAB8A) and Ras-related protein Rab-10 (RAB10) as an indicator of LRRK2 activity in microglia (23–26). Both RAB8A (T72) and RAB10 (T73) displayed increased phosphorylation following αSCM-exposure (Fig. 1C). Together, these results demonstrate that neuron-released α-synuclein increases LRRK2 kinase activity in cultured mouse primary microglia.
LRRK2 modulates neuron-released α-synuclein-mediated microglial neurotoxicity
Having demonstrated that neuron-released extracellular α-synuclein increases LRRK2 kinase activity in microglia, we sought to further elucidate the role of LRRK2 in microglial activation by treating wild type and Lrrk2 knockout (Lrrk2−/−) primary microglia cells with αSCM. Among brain-resident cells, microglia are the most efficient at clearing extracellular α-synuclein (27). In addition, LRRK2 has been suggested to modulate cell-to-cell transmission of α-synuclein (28, 29). To support a critical role for microglial LRRK2 in α-synuclein clearance, we found that genetic depletion (fig. S3A) and pharmacological inhibition (fig. S3B) of LRRK2 delayed the microglial uptake of extracellular α-synuclein. Extracellular α-synuclein is also known to elevate proinflammatory cytokine and chemokine gene expression in wild type microglia (Fig. 2, A to H) (7). Genetic deletion of Lrrk2 was only able to reduce the expression of two cytokines following αSCM exposure, Tnfα and Il-6 (Fig. 2, A and B). Il-1β and Ccl2 were unaffected by Lrrk2 gene deletion, whereas Il-10, inos, Cxcl1, and Ccl5 were enhanced (Fig. 2, C to H). Similarly, pharmacological inhibition of LRRK2 kinase activity attenuated αSCM-induced expression of Tnfα and Il-6, whereas Il-1β expression was unaffected (fig. S4, A to C). Lrrk2−/− microglia also displayed reduced secretion of TNFα and IL-6 compared to wild type controls (Fig. 2, I and J). Further supporting these observations, double immunolabeling analysis revealed a significant (P < 0.001) reduction of αSCM-induced TNFα and IL-6 expression in Lrrk2−/− compared to wild type microglia (Fig. 2K).
Fig. 2. LRRK2-dependent microglial-mediated neurotoxicity after exposure to neuron-released α-synuclein.
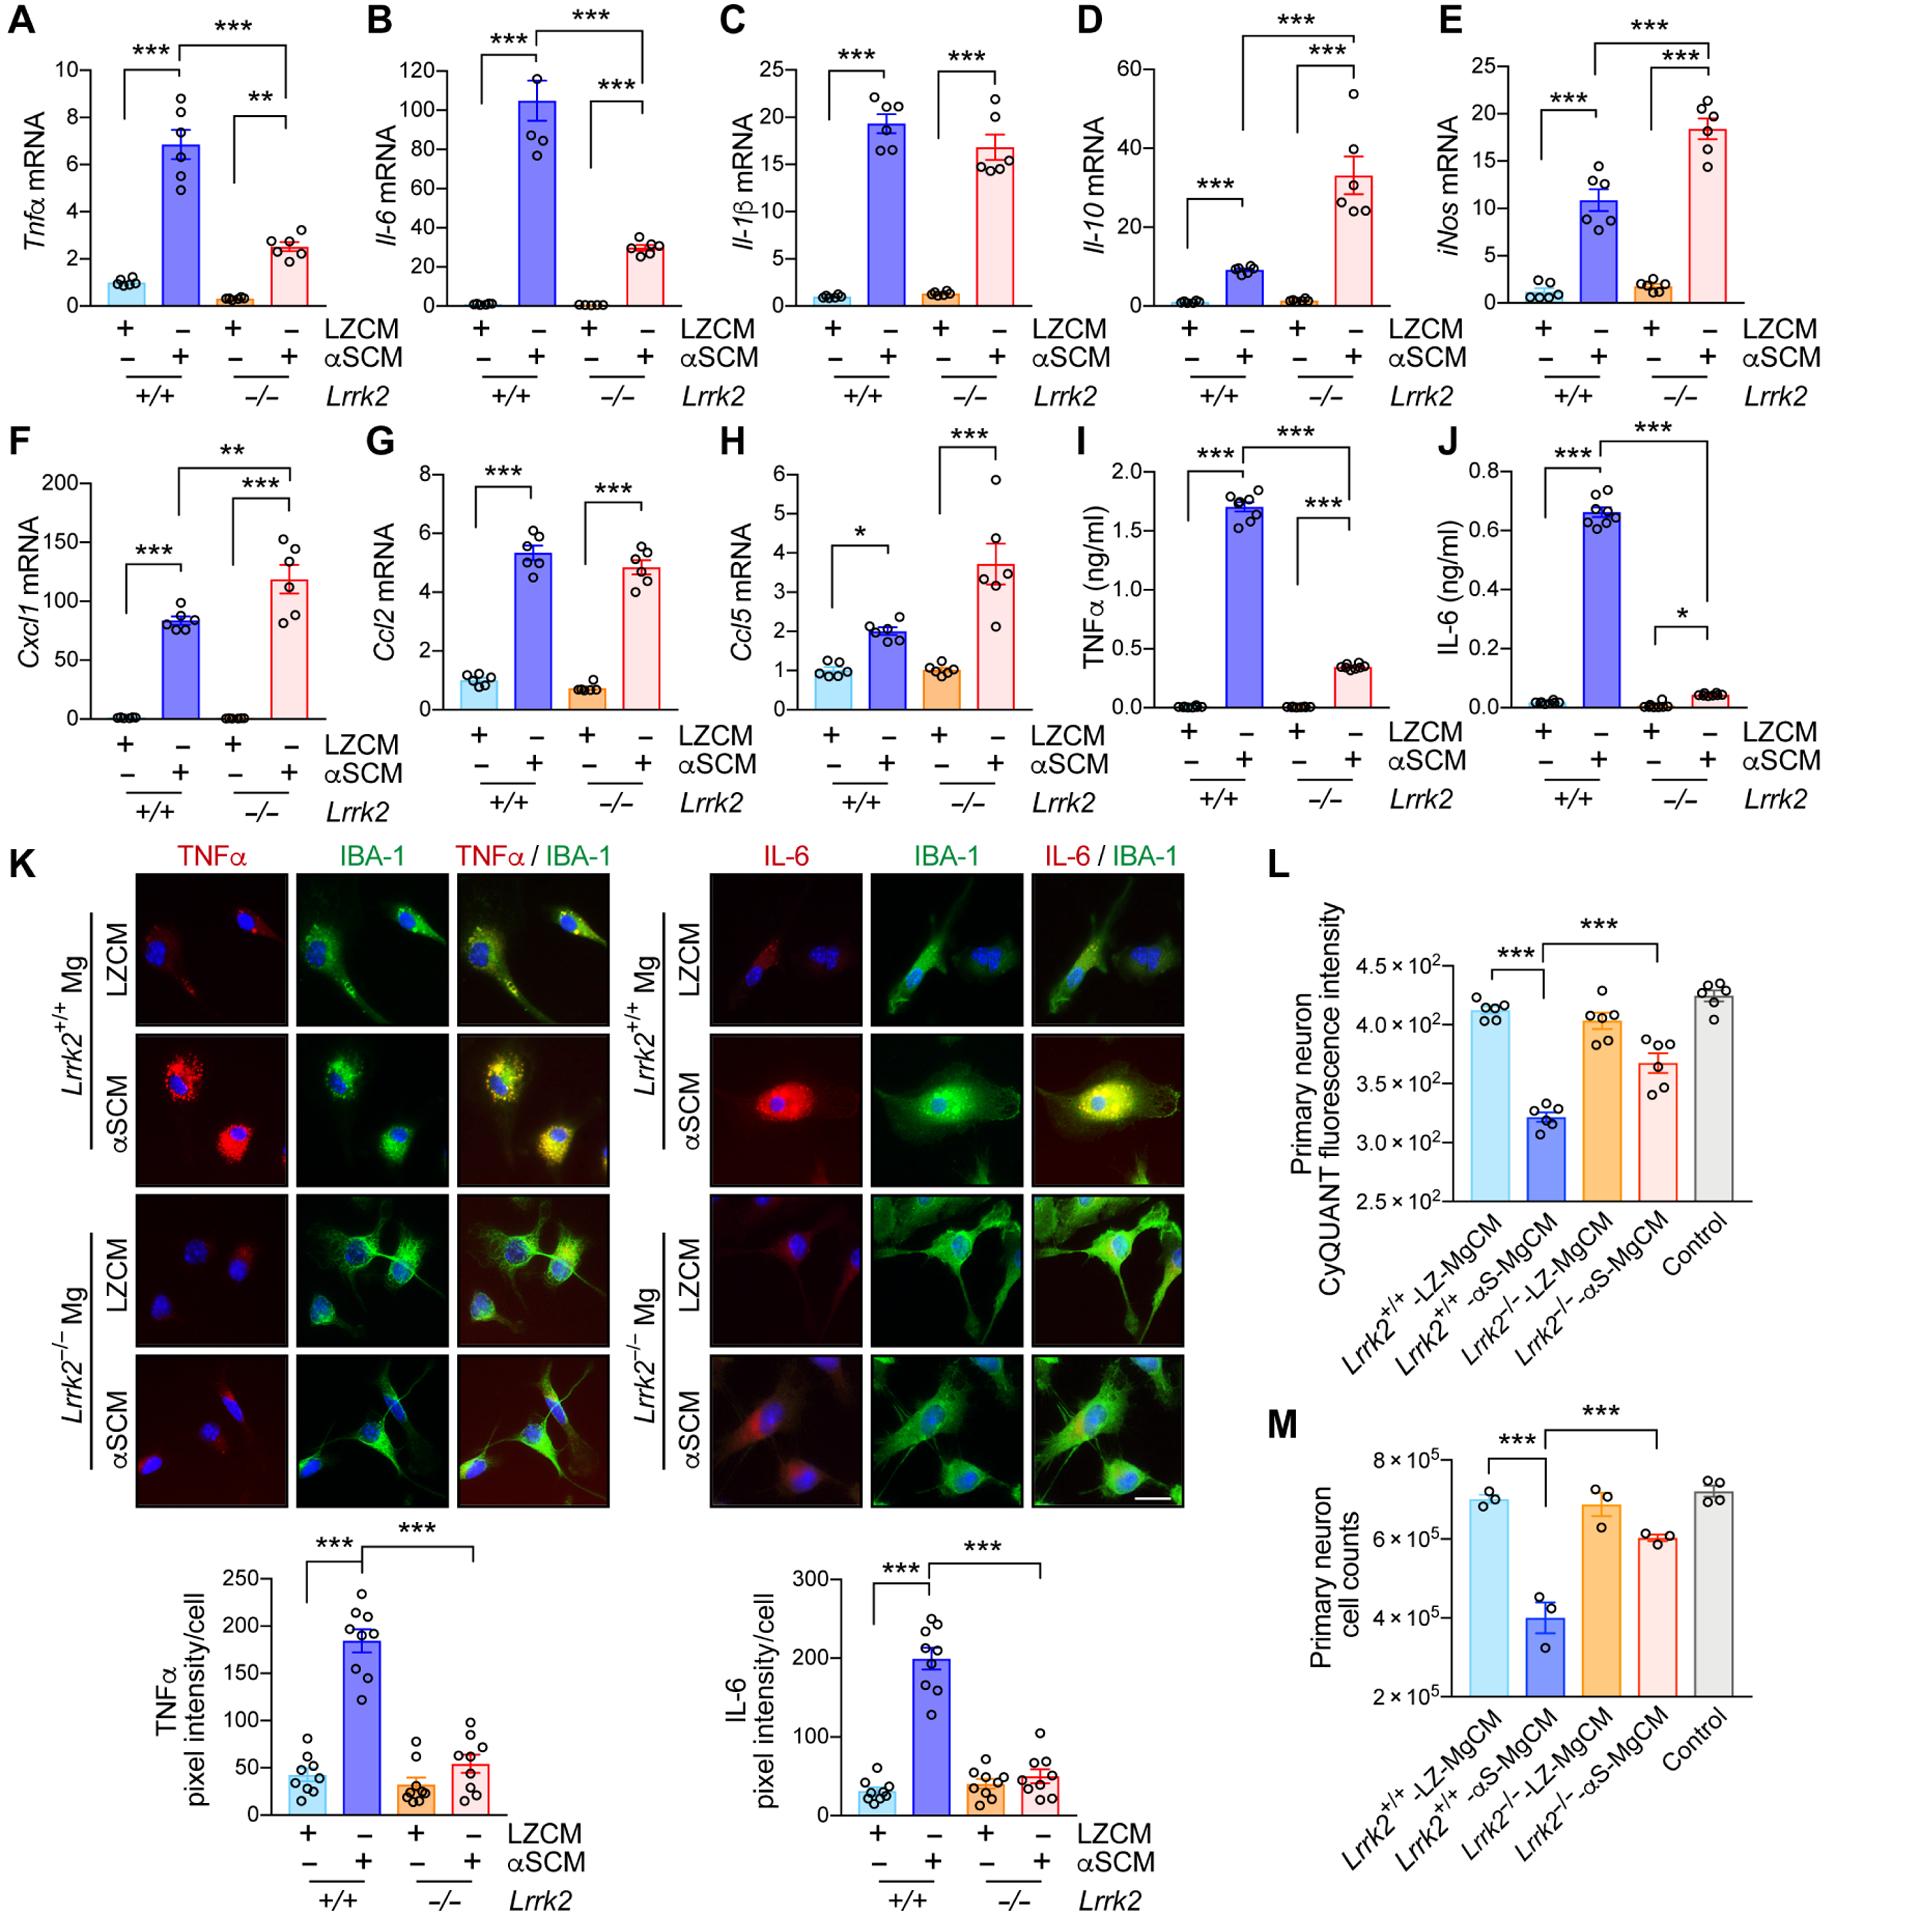
(A to K) Primary wild type and Lrrk2−/− microglia were treated with either control CM (LZCM) or αSCM for 6 hours. Microglial expression of Tnfα (A), Il-6 (B), Il-1β (C), Il-10 (D), iNos (E), Cxcl1 (F), Ccl2 (G), and Ccl5 (H) were determined by quantitative PCR. Data are means ± SEM. *P < 0.05, **P < 0.01, and ***P < 0.001 (One-way ANOVA with Tukey’s multiple comparison post-hoc test). n = 4–6 per group. (I and J) Microglial secretion of TNFα (I) and IL-6 (J) were determined by ELISA. Data are means ± SEM. *P < 0.05 and ***P < 0.001 (One-way ANOVA with Tukey’s multiple comparison post-hoc test). n = 8 per group. (K) Representative images from double immunostaining of TNFα and IL-6 with microglial marker IBA-1. Immunofluorescence intensity of TNFα and IL-6 was analyzed in a randomly chosen area. Data are means ± SEM. ***P < 0.001 (One-way ANOVA with Tukey’s multiple comparison post-hoc test). n = 9 per group. Scale bar, 20 μm. (L and M) Determination of microglia-mediated neurotoxicity. Primary mouse neurons were treated with control media, wild type-LZ-MgCM, wild type-αS-MgCM, Lrrk2−/−-LZ-MgCM, or Lrrk2−/−-αS-MgCM for 18 hours. (L) The number of live neurons were counted using an automated cell counter. Data are means ± SEM. ***P < 0.001 (One-way ANOVA with Tukey’s multiple comparison post-hoc test). n = 6 per group. (M) Neuronal cell viability was determined by the CyQuant cell proliferation assay. Data are means ± SEM. ***P < 0.001 (One-way ANOVA with Tukey’s multiple comparison post-hoc test). n = 3–4 per group.
We then examined the effects of Lrrk2 gene depletion on α-synuclein-mediated microglial neurotoxicity (Fig. 2, L and M). We have previously shown that α-synuclein exposure induces microglial neurotoxicity through a series of activation steps culminating in the release of neurotoxic cytokines such as TNFα (10). To determine whether LRRK2 plays a role in this process, we obtained microglial conditioned medium (MgCM) from cultures of mouse wild type or Lrrk2−/− microglia exposed to either LZCM or αSCM (fig. S5A) (10). Primary mouse cortical neurons were treated with DMEM (control), LZCM-treated wildtype MgCM (Lrrk2+/+-LZ-MgCM), αSCM-treated wild type MgCM (Lrrk2+/+-αS-MgCM), LZCM-treated Lrrk2−/− MgCM (Lrrk2−/−-LZ-MgCM), or αSCM-treated Lrrk2−/− MgCM (Lrrk2−/−-αS-MgCM) for 18 hours (Fig. 2, L and M, and fig. S5A). Neuronal toxicity was determined in an automated and blinded manner using intact neuronal cell body and neuronal DNA content via CyQuant (Fig. 2, L and M, and fig. S5A). Treatment with Lrrk2+/+-αS-MgCM significantly (P < 0.001) decreased both DNA content and the number of viable primary neurons, while neuronal cytotoxicity was not observed in control and Lrrk2+/+-LZ-MgCM-treated cells (Fig. 2, L and M). Neuronal loss was not observed in either Lrrk2−/−-αS-MgCM or Lrrk2−/−-LZ-MgCM treatment group (Fig. 2, L and M). To determine whether MgCM neurotoxicity might be related to cytokine expression, we measured the concentrations of TNFα and IL-6 in MgCM (fig. S5, B and C). TNFα and IL-6 concentrations were lower than those in Fig. 2 I and J since microglia were exposed to αSCM for only 1 hour to generate MgCM, but the relative pattern of higher concentrations after αSCM treatment and lower concentrations in Lrrk2−/− microglia was consistent (fig. S5, B and C). To test the hypothesis that TNFα and IL-6 in MgCM could be sufficient to mediate neurotoxicity, we treated primary mouse neurons with recombinant TNFα and/or IL-6 at concentrations similar to the amounts found in Lrrk2+/+-αS-MgCM (TNFα: 0.3 ng/ml and IL-6: 0.1 ng/ml) for 18 hours (fig. S5, D and E). Whereas treatment with a single cytokine induced neurotoxicity, treatment of both TNFα and IL-6 produced a synergistic effect to reproduce the neurotoxicity observed in Fig. 2, L and M (fig. S5, D and E). Therefore, these results collectively suggest that LRRK2 modulates the production of neurotoxicants such as TNFα and IL-6 in α-synuclein-exposed mouse microglia.
NFATc2 mediates LRRK2 signaling in microglia exposed to neuron-released α-synuclein
To gain a mechanistic understanding of the role of LRRK2 in microglial activation by extracellular α-synuclein, we analyzed transcriptome data (GSE26532) obtained from primary rat microglia exposed to either LZCM or αSCM for 6 or 24 hours (Fig. 3A) (7). Among the 213 genes upregulated after exposure to αSCM, we selected 43 that were involved in Toll-like receptor signaling and other immune signaling pathways (see details in Supplementary Materials) and reconstructed a signaling network describing their interactions utilizing functional gene enrichment analysis and information on protein-protein interactions (Fig. 3A). According to this analysis, extracellular α-synuclein activates microglial TLR2 to enhance the activity of several downstream kinases and GTPases, such as interleukin 1 receptor associated kinase 4 (IRAK4) and Ras-related C3 botulinum toxin substrate 2 (RAC2), ultimately activating NFκB and cytokine/chemokine gene expression. Our proposed network introduces a potential NFκB-independent signaling pathway that acts through LRRK2 and NFATc2 to selectively modulate cytokine and chemokine expression (Fig. 3A). Although regulation of TNFα and IL-6 by NFκB has been well described, these cytokines also contain multiple NFAT response elements in their respective promoters, suggesting that regulation by NFATc2 is also plausible (30, 31). In addition, gene set enrichment analysis (GSEA) revealed an enrichment of the PDI NFAT TF PATHWAY gene set in the transcriptome data from both 6- and 24-hour time points (Fig. 3B) (32).
Fig. 3. LRRK2-dependent induction of NFATc2 in microglia by neuron-released α-synuclein.
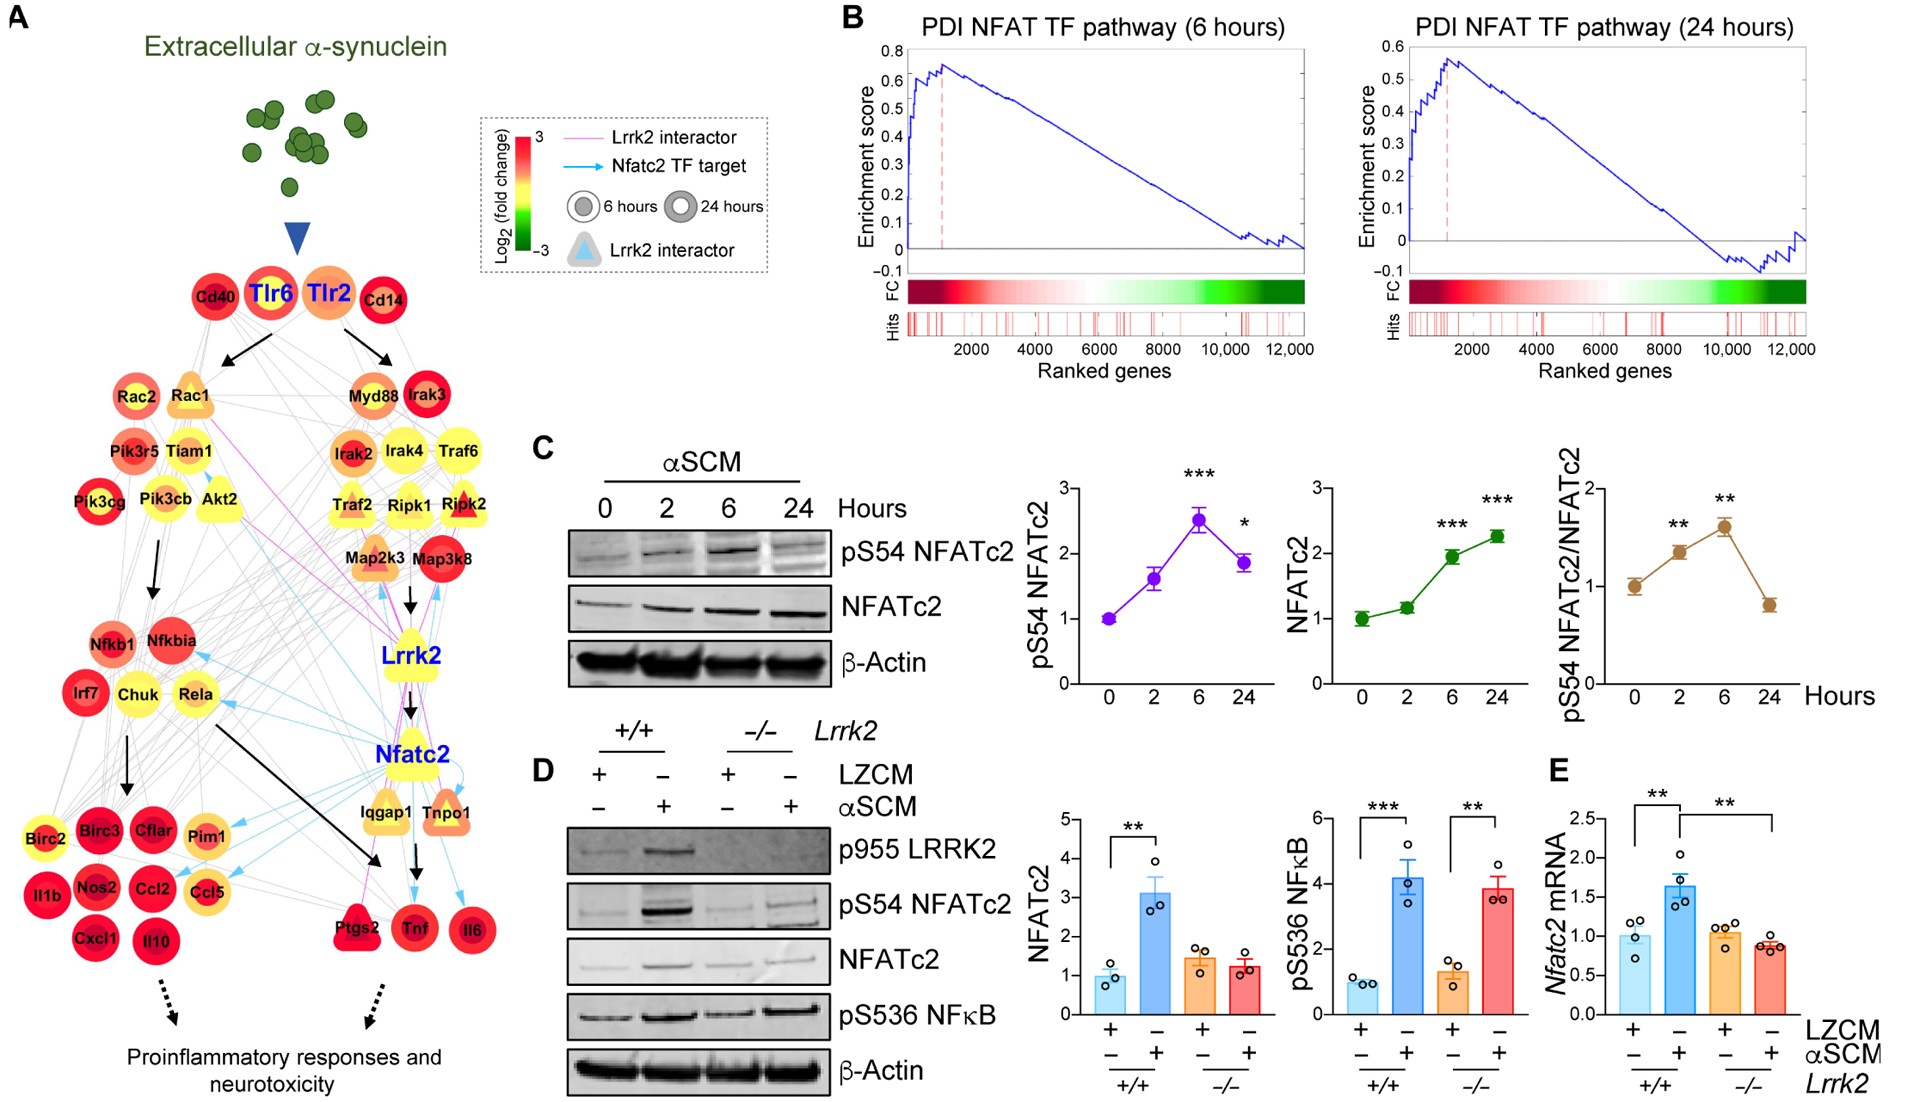
(A) A hypothetical signaling network was constructed utilizing transcriptome data from αSCM-exposed microglia. The node color gradient illustrates the log2-fold change between microglia treated and untreated with αSCM (inner circle, 6 hours; outer circle, 24 hours). LRRK2 interactors are presented as triangles. Pink solid edges represent protein-protein interactions with LRRK2. Gray solid and blue arrowed edges represent protein-protein and protein-DNA interactions, respectively. (B) Gene set enrichment analysis (GSEA) enrichment plots for DPI NFAT TFPATHWAY in αSCM-exposed microglia. (C) Wild type primary mouse microglia were treated with αSCM for 0, 2, 6, and 24 hours, and whole cell lysates were analyzed by western blot analysis. Phospho-S54 NFATc2, total NFATc2, and phospho-S54 NFATc2/total NFATc2 band intensities were determined by densitometric quantification and normalized to β-Actin. Data are means ± SEM. *P < 0.05 and ***P < 0.001 (One-way ANOVA with Tukey’s multiple comparison post-hoc test). n = 3 per group. (D and E) Primary mouse wild type and Lrrk2−/− microglia were treated with either LZCM or αSCM for 6 hours. (D) Whole microglia lysates were analyzed by western blot analysis. The band intensities of total NFATc2 and phospho-S563 NFκB were determined by densitometric quantification and normalized to β-Actin. Notably, NFκB phosphorylation was not affected by Lrrk2 depletion. (E) Microglial Nfatc2 expression was determined by quantitative PCR. Data are means ± SEM. **P < 0.01 (One-way ANOVA with Tukey’s multiple comparison post-hoc test). n = 4 per group.
Given that our transcriptome-based network analysis revealed a potential interaction between LRRK2 and NFATc2 during microglia activation by extracellular α-synuclein, we began by examining Nfatc2 expression and regulation in mouse wild type microglia (Fig. 3C). Primary microglia were treated with either LZCM or αSCM for various timepoints up to 24 hours and whole cell lysates were analyzed by western blot analysis (Fig. 3C). In wild type microglia, total Nfatc2 expression acutely increased with exposure time to αSCM (Fig. 3C). NFATc2 phosphorylation at S54 was also increased at early time points following αSCM exposure, indicating enhanced transcriptional activity (Fig. 3C). The increase in NFATc2 expression consequential to exposure to extracellular α-synuclein was eliminated in Lrrk2−/− microglia (Fig. 3D). Whereas NFκB phosphorylation was also increased in αSCM-treated wild type microglia, it was not affected by Lrrk2 gene depletion, suggesting that LRRK2 affects NFATc2 specifically (Fig. 3D). αSCM exposure slightly increased Nfatc2 mRNA expression in wild type but not Lrrk2−/− microglia (Fig. 3E), suggesting that some of the observed effects can be attributed to transcriptional regulation. Additionally, pretreatment with T2.5 to block TLR2 activity was sufficient to inhibit NFATc2 induction by extracellular α-synuclein in wild type microglia (fig. S6A), whereas an inhibitor of calcineurin, Cyclosporin A, had no effect (fig. S7).
LRRK2 expression has been reported to be variable, depending on developmental stage and age at harvest (33). Therefore, we investigated Lrrk2 expression and response to αSCM in aged mouse microglia (fig. S8, A and B). Aged microglia freshly isolated from 2-year old mice showed decreased Lrrk2 gene expression compared to microglia grown in postnatal mixed cultures (fig. S8A). However, similar to postnatal microglia, exposure to αSCM induced NFATc2 in aged wild type but not in aged Lrrk2−/− microglia (fig. S8B). In contrast, αSCM treatment increased the phosphorylation of NFκB and p38 MAPK in both aged wild type and Lrrk2−/− microglia (fig. S8B). As such, these results support the existence of a LRRK2 and NFATc2 signaling pathway activated by extracellular α-synuclein and independent of NFκB in acutely isolated microglia from aged mice.
LRRK2 modulates nuclear translocation of NFATc2
NFATc2 has been shown to translocate to the nucleus and modulate the transcription of multiple immune-related genes (34–36). Although it has been reported that Lrrk2 down-regulates NFATc2 (37), a more recent study demonstrated activation of NFATc2 by LRRK2 overexpression in HEK 293T cells (38). To determine which of these outcomes occur in microglia, we used automated image analysis and nuclear/cytoplasmic fractionation to determine whether LRRK2 modulates the nuclear translocation of NFATc2 (Fig. 4, A to C, and fig. S6B). The nucleus and cytoplasm of single microglial cells were automatically compartmentalized and the NFATc2 fluorescence intensity measured in each compartment by Cellomics VTI Arrayscan (Fig. 4A). We observed a time-dependent increase in the nuclear translocation of NFATc2 following αSCM exposure, which was significantly (P < 0.05) inhibited by either treatment with LRRK2 kinase inhibitor HG-10-102-01 (100 nM) (Fig. 4B) or genetic depletion of Lrrk2 (Fig. 4C). In addition, functional inhibition of TLR2 by T2.5 significantly (P < 0.01) decreased nuclear translocation of NFATc2 in αSCM-exposed wild type mouse microglia (fig. S6B).
Fig. 4. LRRK2 modulates nuclear translocation of NFATc2 in microglia.
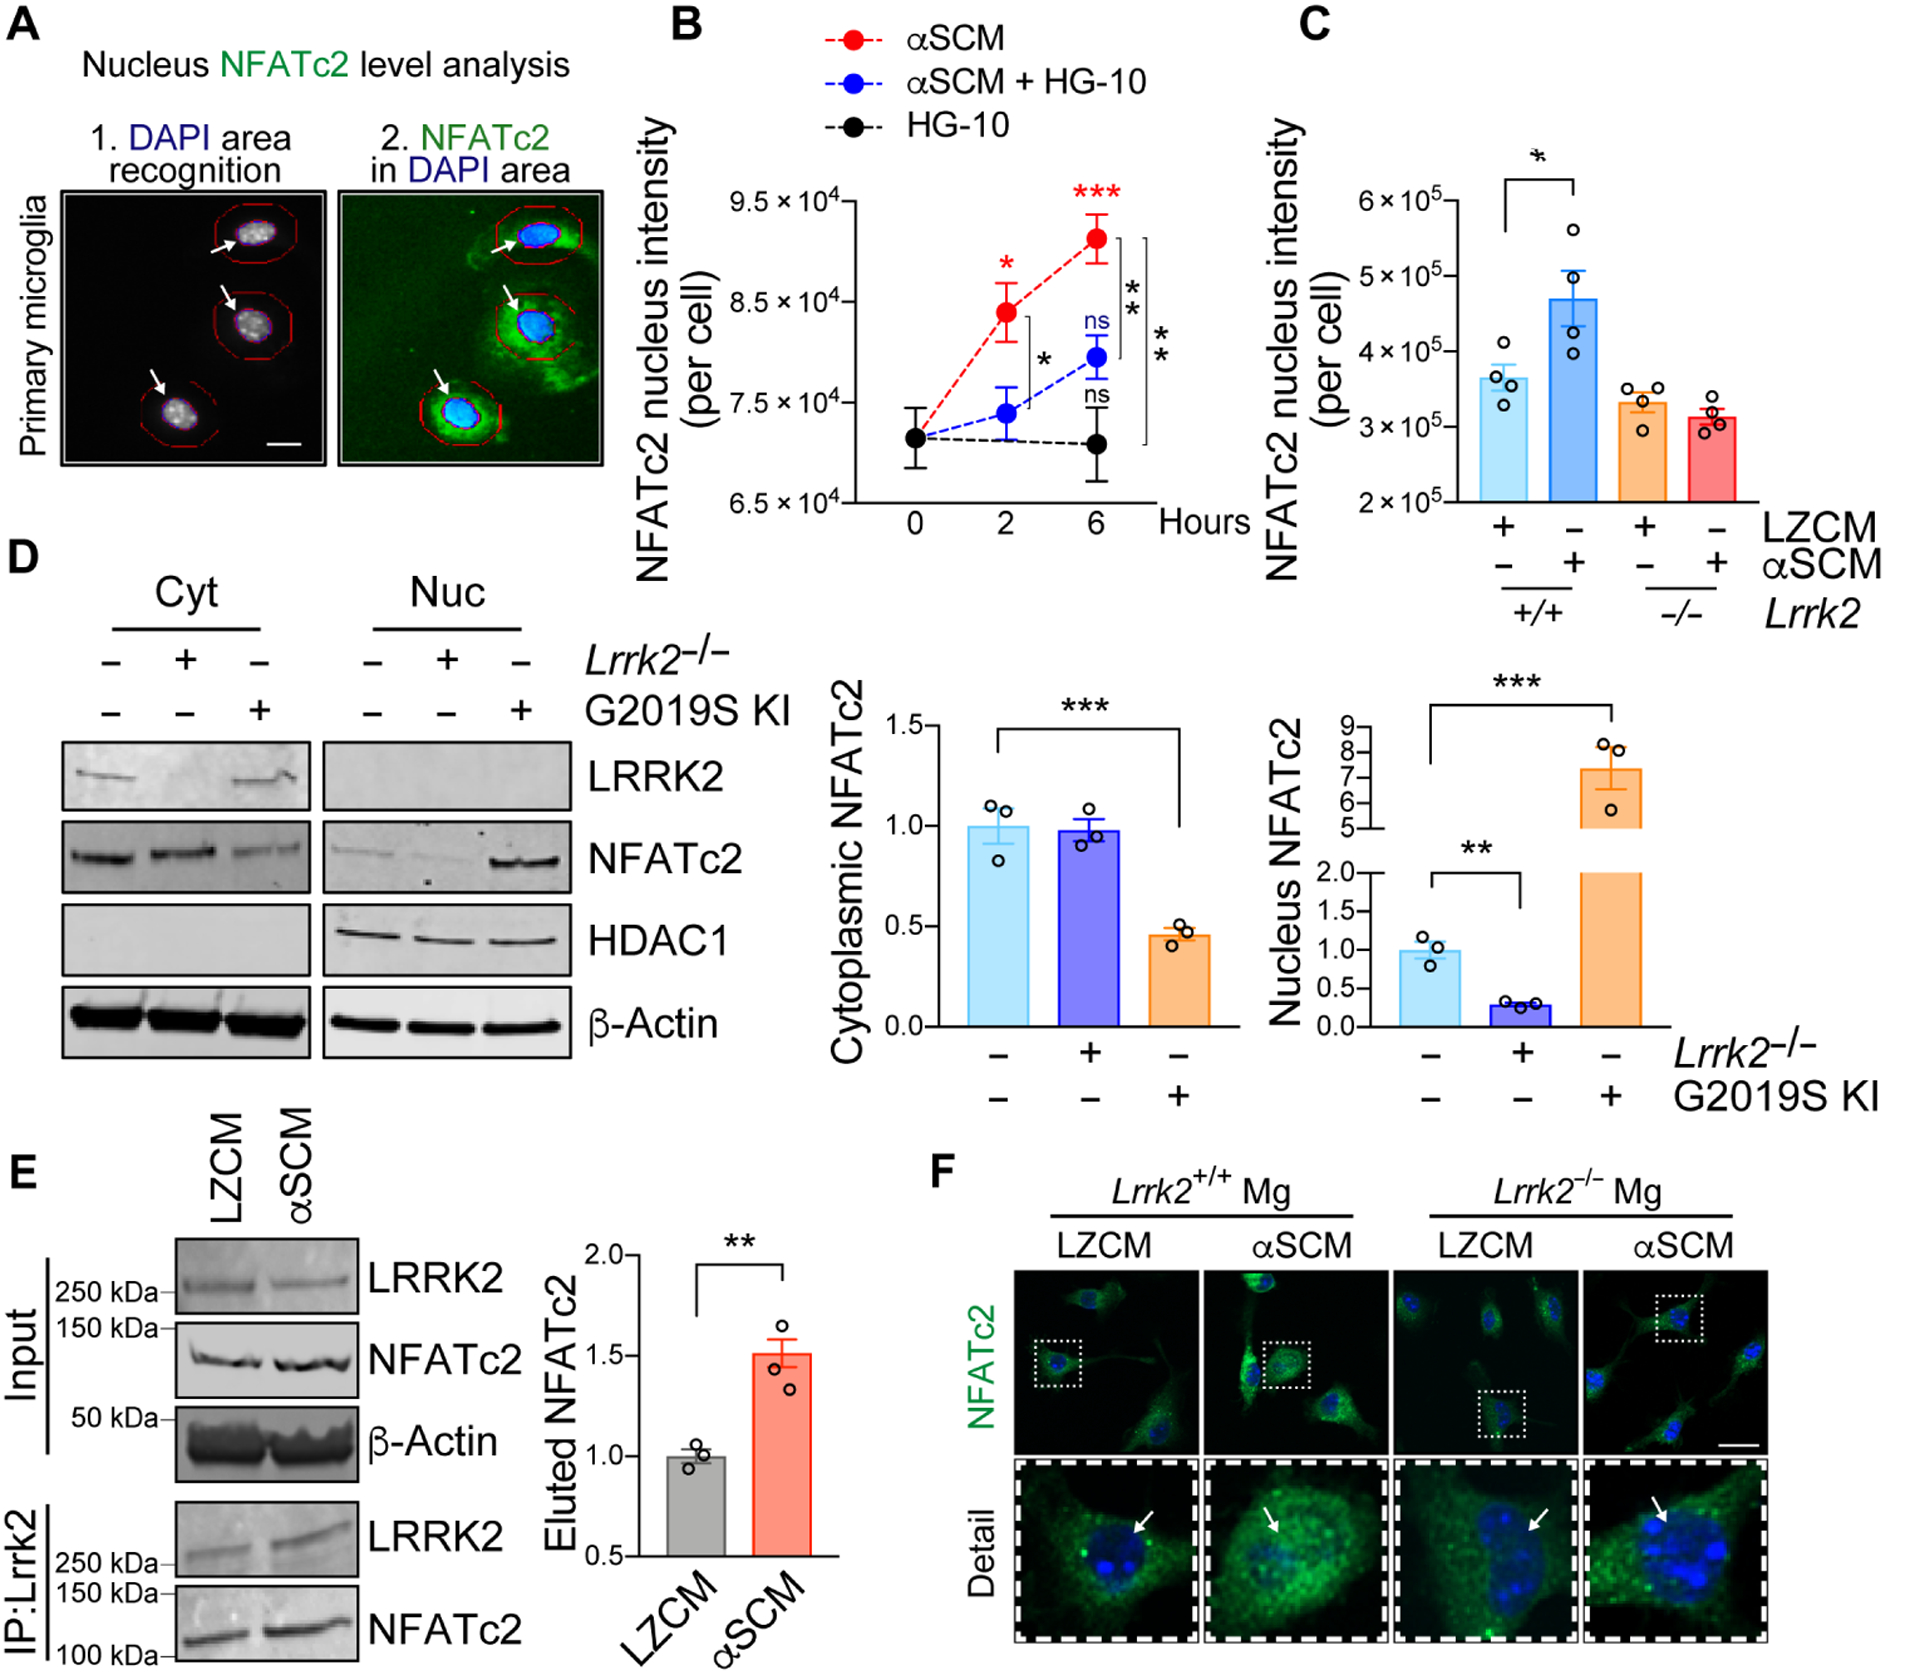
(A to C) Primary mouse wild type or Lrrk2−/− microglia were treated with αSCM in the presence or absence of LRRK2 kinase inhibitor HG-10-102-01 (100 nM). Cytoplasmic and nuclear fractions of NFATc2 were determined by an automated Cellomics assay. (A) Schematic illustration of compartmentalization analysis in single cells by Cellomics VTI Arrayscan. Scale bar, 10 μm. (B) Wild type mouse microglia were treated with αSCM, LRRK2 inhibitor, or both for 0, 2, and 6 hours. Data are means ± SEM. *P < 0.05, **P < 0.01, and ***P < 0.001 (One-way ANOVA with Tukey’s multiple comparison post-hoc test). n = 5 per group. (C) Mouse wild type or Lrrk2−/− microglia were treated with either LZCM or αSCM for 6 hours. Data are means ± SEM. *P < 0.05 (One-way ANOVA and Tukey’s multiple comparison post-hoc test). n = 4 per group. (D) Soluble proteins in the nuclear and cytoplasmic fractions of primary microglia from wild type, Lrrk2−/−, and G2019S KI mice were analyzed by western blot analysis. Cytoplasmic and nuclear fractions of NFATc2 were determined by densitometric quantification and normalized to β-Actin. Data are means ± SEM. **P < 0.01 and ***P < 0.001 (One-way ANOVA with Tukey’s multiple comparison post-hoc test). n = 3 per group. (E) Co-immunoprecipitation of LRRK2 and NFATc2. Primary microglia were treated with αSCM for 6 hours prior to immunoprecipitation assay. LRRK2 was pulled down from cell lysates and analyzed by western blot analysis. **P < 0.01 (One-way ANOVA with Tukey’s multiple comparison post-hoc test). n = 3 per group. (F) Representative images from immunostaining of NFATc2 in wild type and Lrrk2−/− microglia. Microglia were treated with either LZCM or αSCM for 6 hours prior to immunostaining analysis. Scale bar, 20 μm.
Since the induction of microglial NFATc2 nuclear translocation was inhibited by Lrrk2 gene depletion and LRRK2 kinase inhibition, we hypothesized that NFATc2 nuclear translocation might be modulated by LRRK2 kinase activity. To further test this hypothesis, we compared the Lrrk2−/− with a Lrrk2 G2019S knock-in (G2019S KI) that has enhanced kinase activity (39). The cytoplasmic and nuclear fractions of primary wild type, Lrrk2−/−, and G2019S KI microglia were analyzed by western blot analysis (Fig. 4D). Cytoplasmic NFATc2 was significantly (P < 0.001) lower in G2019S KI than in wild type or in Lrrk2−/− microglia, while nuclear NFATc2 was correspondingly higher (Fig. 4D). Moreover, NFATc2 expression was markedly decreased in the nuclear fraction of Lrrk2−/− microglia compared to their wild type counterparts (Fig. 4D).
We next used co-immunoprecipitation to determine whether LRRK2 and NFATc2 physically interact with each other in response to extracellular α-synuclein. LRRK2 was immunoprecipitated from primary mouse microglia treated with LZCM or αSCM for 6 hours (Fig. 4E). The amount of endogenous NFATc2 co-immunoprecipitated with LRRK2 was significantly (P < 0.01) higher in αSCM-exposed microglia compared to LZCM-treated microglia (Fig. 4E). Additional confocal microscopic analysis of Fig. 4C also showed increased NFATc2 immunoreactivity in the nucleus of wild type by αSCM treatment but not Lrrk2−/− microglia (Fig. 4F). These experiments collectively suggest that LRRK2 directly interacts with NFATc2 in the cytosol of microglia to then, indirectly, modulate NFATc2 nuclear translocation.
NFATc2 is a kinase substrate for LRRK2
Given that the nuclear translocation of NFATc2 may be LRRK2-dependent, we next examined whether LRRK2 directly phosphorylates NFATc2. Recombinant human NFATc2 and wild type, D1994A (Kinase dead), or G2019S (a pathogenic, activating mutation) LRRK2 were used for an in vitro LRRK2 kinase assay (Fig. 5A). Phosphorylation of NFATc2 was rapidly induced by LRRK2 and the amount of phosphorylation was increased with the G2019S mutant (Fig. 5A). In contrast, NFATc2 was not phosphorylated by the LRRK2 kinase dead mutant D1994A (Fig. 5A).
Fig. 5. NFATc2 is a LRRK2 kinase substrate.
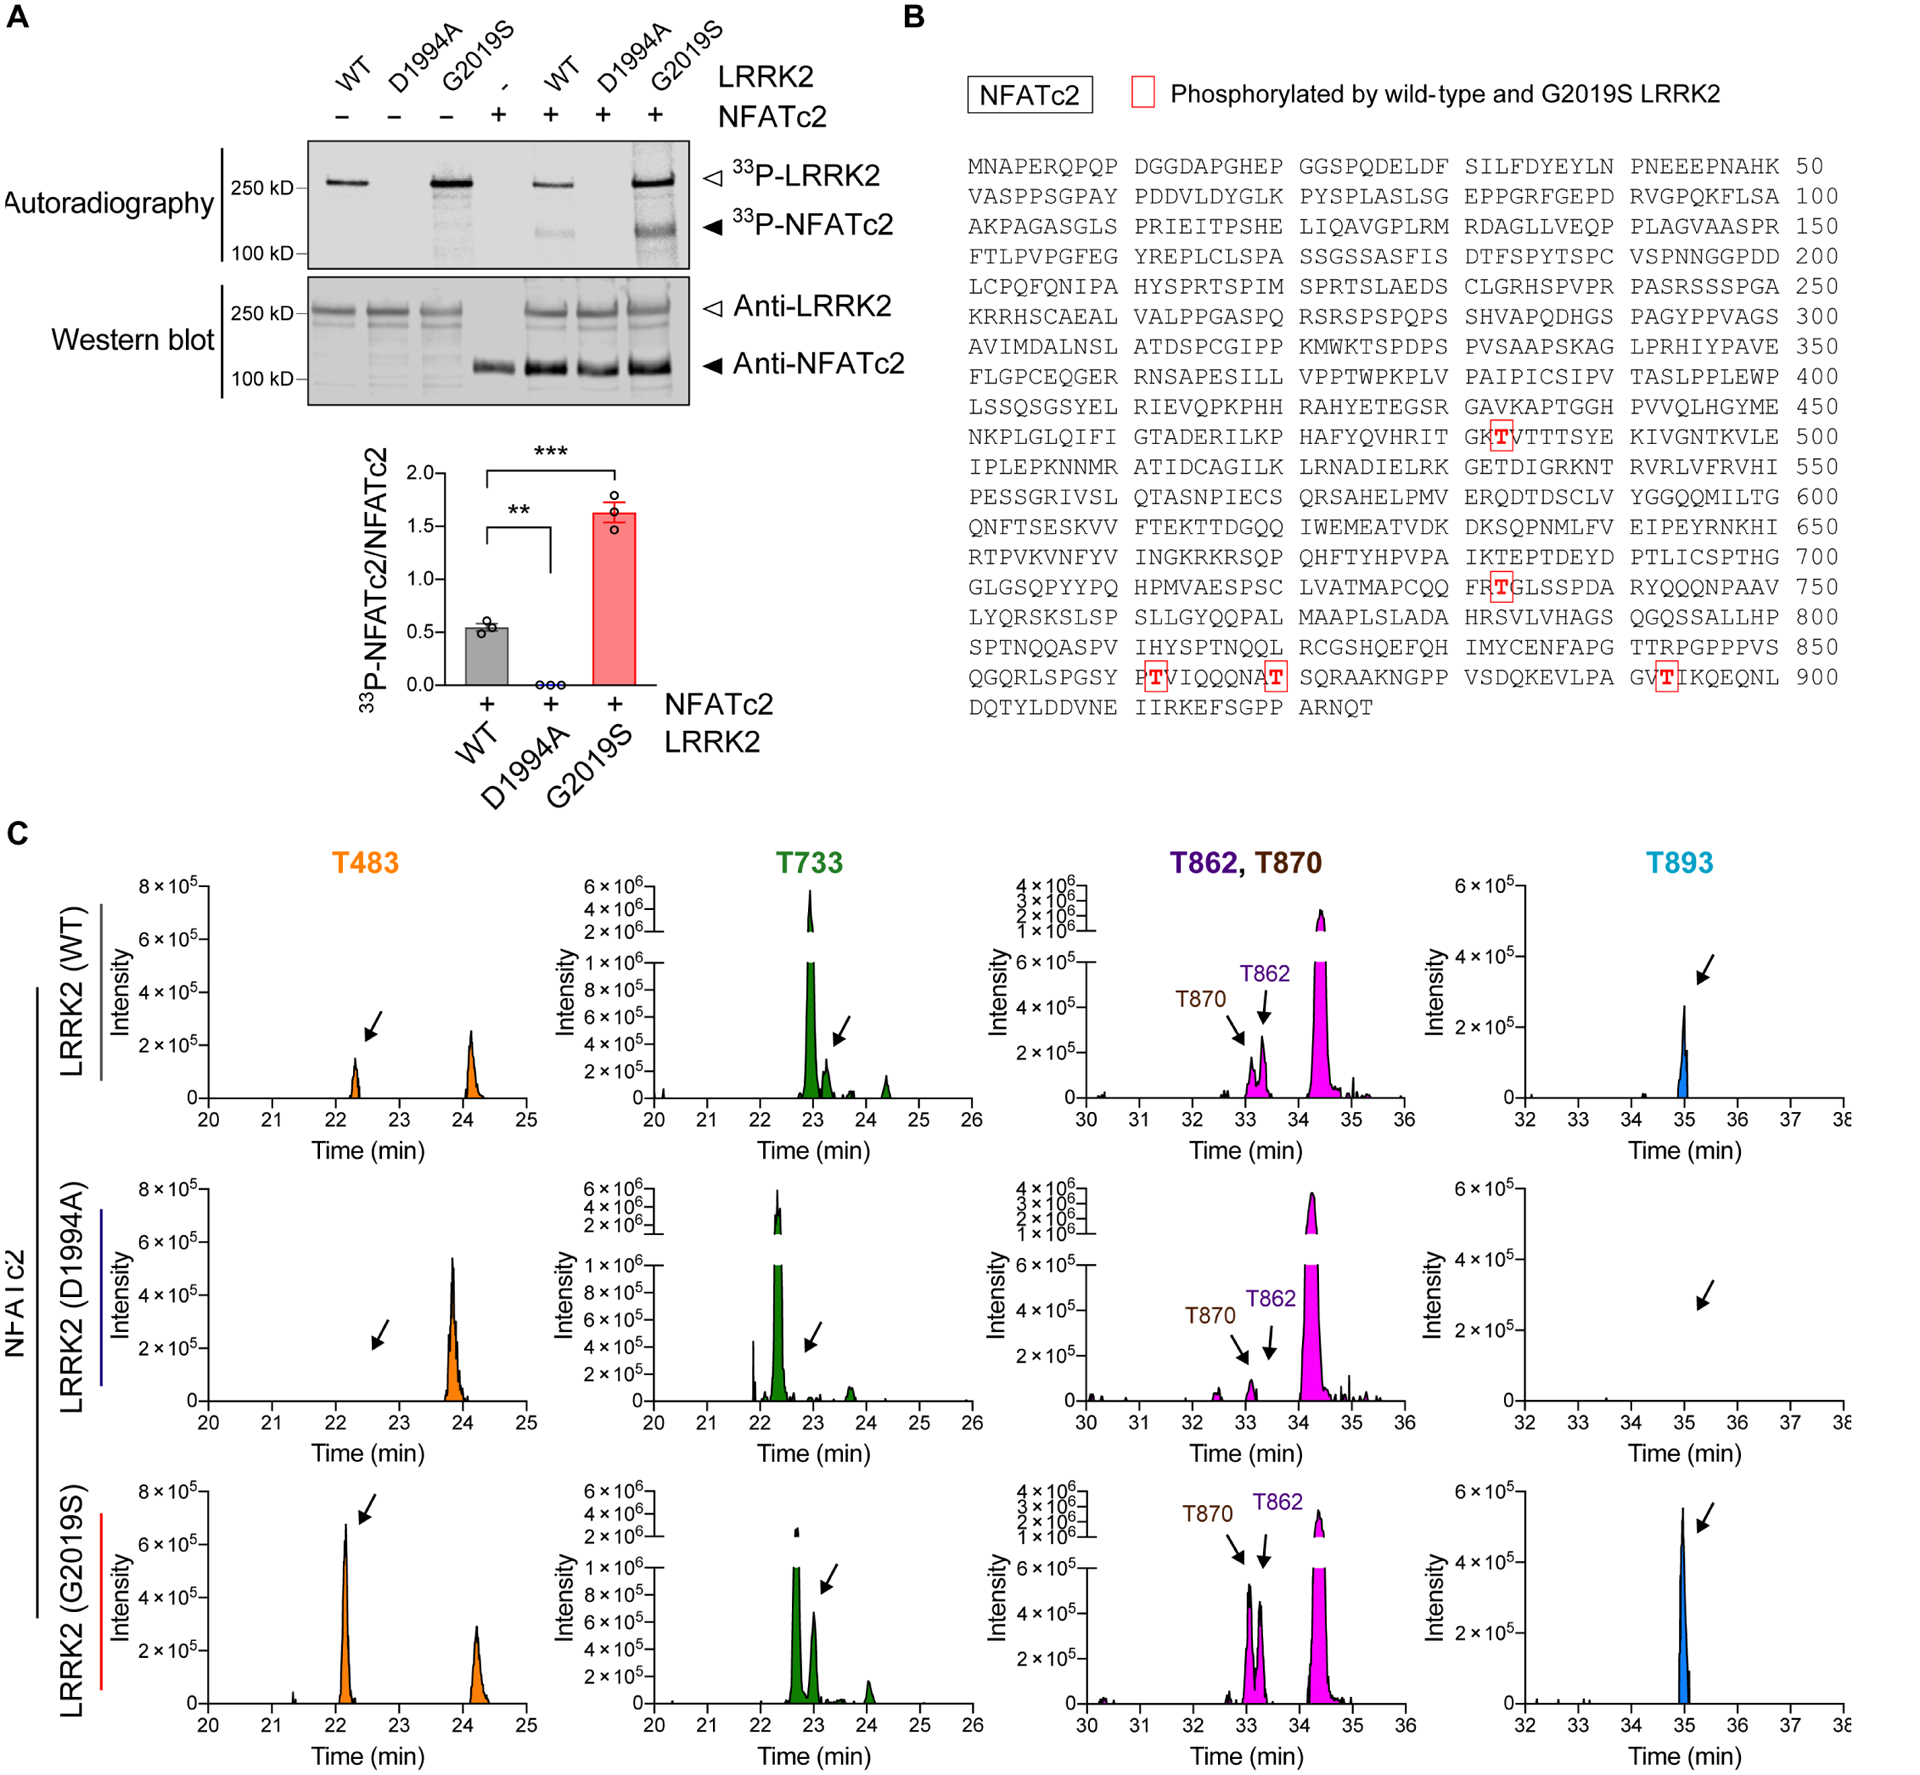
(A) In vitro LRRK2 kinase assay. Recombinant LRRK2 WT, LRRK2 D1994A, and LRRK2 G2019S were incubated in the presence or absence of NFATc2 for 30 minutes. Top: autoradiography of LRRK2 and NFATc2. Bottom: western blot analysis. The same blot was probed with anti-LRRK2 and anti-NFATc2. 33P-NFATc2 band intensity was determined by densitometric quantification and normalized to total NFATc2 on the western blot. Data are means ± SEM. *P < 0.05 and ***P < 0.001 (One-way ANOVA with Tukey’s multiple comparison post-hoc test). n = 3 per group. (B and C) Recombinant NFATc2 incubated with LRRK2 WT, LRRK2 D1994A, or LRRK2 G2019S was analyzed by LC-MS/MS. (B) Amino acid sequence of NFATc2 (NP_775114.1) and positions of 5 residues where the phosphorylation stoichiometry was increased when incubated with LRRK2 G2019S and decreased when incubated with LRRK2 D1994A relative to LRRK2 WT. (C) XIC data of phosphopeptides corresponding to the 5 phosphorylated threonine residues shown in Fig. 5b.
To identify LRRK2-specific phosphorylation sites on NFATc2, we next incubated NFATc2 with wildtype, D1994A, or G2019S LRRK2, and analyzed the NFATc2 with liquid chromatography tandem mass spectrometry (LC-MS/MS) (Fig. 5, B and C, and fig. S9). Extracted-ion chromatogram (XIC) of non-phosphorylated peptides matched to NFATc2 were used to quantify NFATc2 protein concentration. Among the 10 phosphorylated residues that were detected, five corresponding phosphopeptides had XIC values higher when NFATc2 was incubated with G2019S-LRRK2 than when incubated with wildtype LRRK2. The same sites were comparatively less abundant in NFATc2 incubated with LRRK2 D1994A (Fig. 5, B and C). Analysis of publicly available crystal structures of NFATc2 revealed that T483 is located in the REL-homology region (aa 408–677), T483 and T733 are located close to the DNA binding surface (PDB: 1P7H and 1OWR) (40), and the remaining three threonine (T862, T870, and T893) are present in the flexible C-terminal region (aa 678–925) associated with NFATc2 translocation (Fig. 6A) (41). A 3D structure model depicting how LRRK2 could phosphorylate each NFATc2 threonine of interest is shown in Fig. 6, B to F (42).
Fig. 6. 3D structural analysis of NFATc2 and LRRK2 interaction.
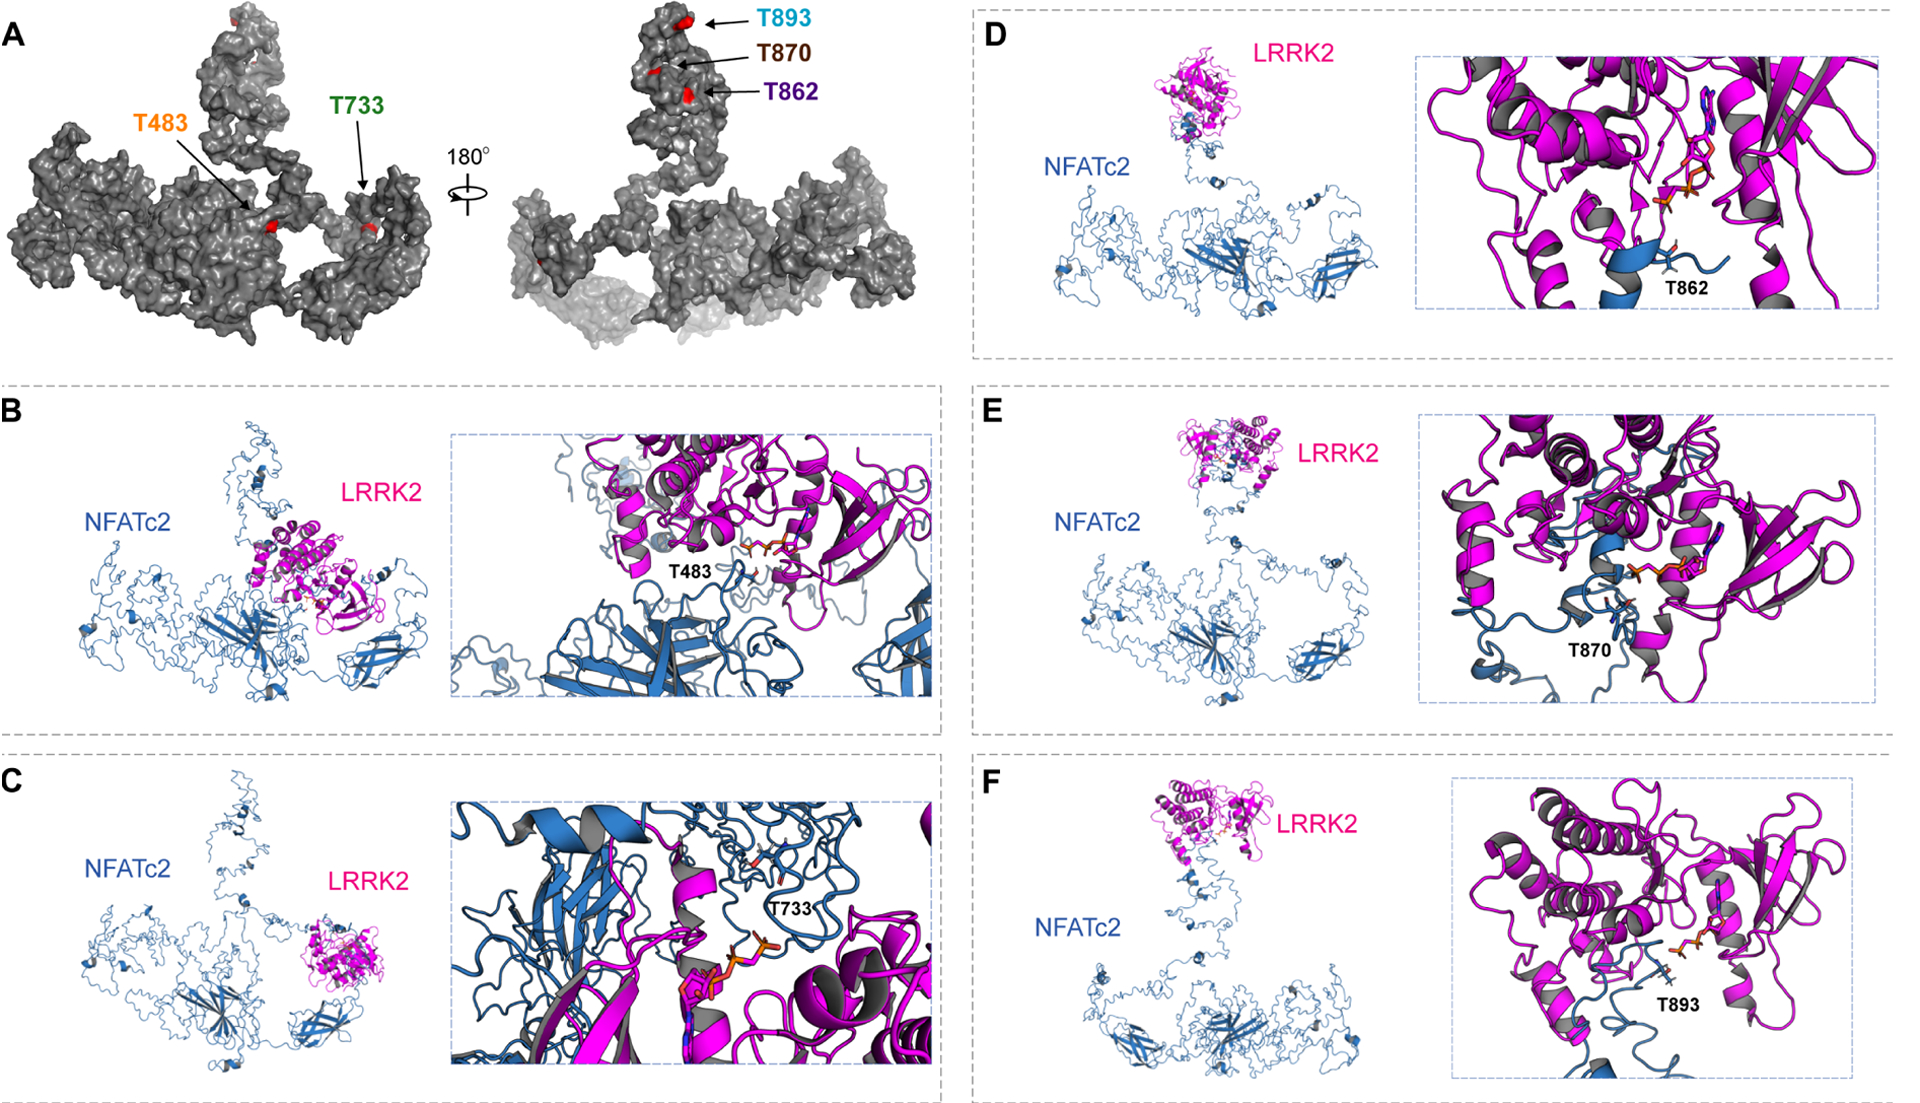
(A) A full-length structural model was generated from the crystal structure of NFATc2 from Homo sapiens (PDB: 1P7H). The five identified threonines (T) are labeled in red. (B to F) Potential kinase-substrate hetero-complex formation of LRRK2 and NFATc2. The full-length NFATc2 structure (Blue) was modeled alongside the kinase domain of the LRRK2-related protein ROCO4 from Dictyostelium discoideum (PDB: 4F0F) (Pink). The phosphate group of the kinase is labeled in orange and the target hydroxyl group on the threonine in NFATc2 is labeled in red. 3D conformations were modeled for the interactions between LRRK2 and T483 (B), T733 (C), T862 (D), T870 (E), and T893 (F).
Abnormal increase of nuclear NFATc2 in the brains of synucleinopathy patients
Next, we sought to characterize the implications of NFATc2 signaling in human synucleinopathies such as PD/DLB. Paraformaldehyde-fixed vibratome sections of postmortem neocortex and striatum were obtained from patients with PD/DLB and controls without a diagnosis of neurodegenerative disease in lifetime, confirmed by lack of neuropathology post-mortem (table S1). We observed pronounced microgliosis and astrogliosis in PD/DLB brains (Fig. 7A). NFATc2 immunoreactivity was higher in both neuronal and non-neuronal cells of patients with PD/DLB compared to neurologically unaffected controls (Fig. 7B). Biochemical analysis of whole brain lysates also revealed that both protein and gene expression of NFATc2 were significantly (P < 0.05) higher in PD/DLB brains than in controls without neurological disease (Fig. 7C). The expression of NFATc2 was higher in PD/DLB brains than in controls (Fig. 7D). Double immunolabeling confirmed the presence of NFATc2 in the cells that expressed neuronal (NeuN), astroglial (GFAP), or microglial (IBA-1) markers (Fig. 7E). Whereas control cases displayed abundant NFATc2 immunoreactivity in the cell cytoplasm, in patients with PD/DLB, NFATc2 was concentrated in the nucleus (Fig. 7, B and E). Taken together, these observations support the notion that NFATc2 may be activated in the brains of patients with PD/DLB.
Fig. 7. NFATc2 deposition in synucleinopathies.
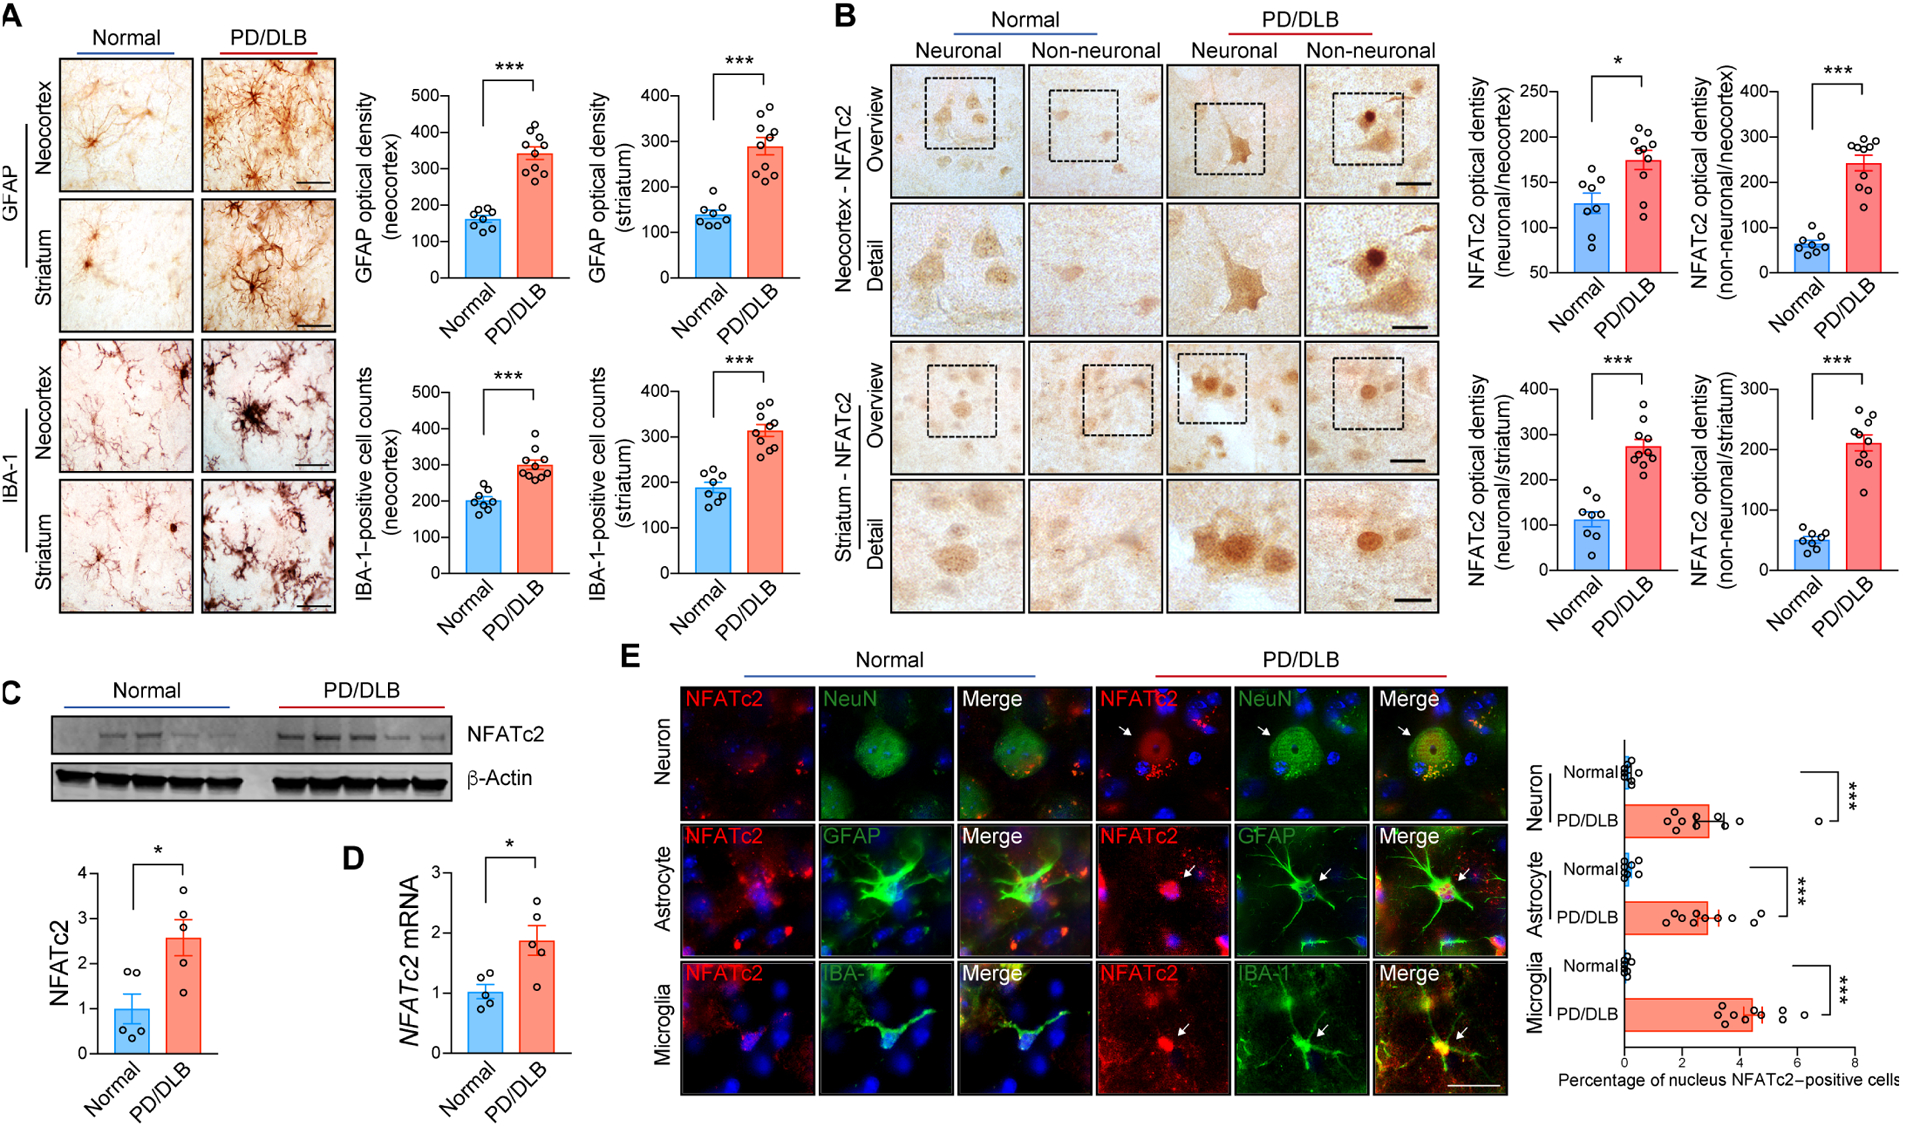
(A) Representative immunohistochemical analysis of astrogliosis and microgliosis in the neocortex and striatum of non-demented control and patients with PD/DLB. GFAP and IBA-1 immunoreactivity were analyzed by optical density analysis. Data are means ± SEM. ***P < 0.001 (unpaired two-tailed Student’s t test). n = 8 for control group and n = 10 for PD/DLB group. Scale bar, 10 μm. (B) Representative immunohistochemistry analysis of NFATc2 in the neocortex and striatum of non-demented control and patients with PD/DLB. NFATc2 immunoreactivity was analyzed by optical density analysis. Data are means ± SEM. *P < 0.05 and ***P < 0.001 (unpaired two-tailed Student’s t test). n = 8 for control group and n = 10 for PD/DLB group. Scale bars, 20 μm (low magnification) and 10 μm (high magnification). (C) Western blot analysis of human brain lysates, probed with NFATc2 and β-Actin. NFATc2 band intensity was determined by densitometric quantification and normalized to β-Actin. Data are means ± SEM. *P < 0.05 (unpaired two-tailed Students t test). n = 5 per group. (D) Human NFATc2 expression was determined by quantitative PCR. Data are means ± SEM. *P < 0.05 (unpaired two-tailed Students t test). n = 5 per group. (E) Representative images of double immunostaining for NFATc2 with neuron (NeuN), astrocyte (GFAT), or microglia (IBA-1) markers in human postmortem neocortex. Nuclear NFATc2 fluorescence immunoreactivity in each cell were analyzed. Data are means ± SEM. ***P < 0.001 (unpaired two-tailed Student’s t test). n = 8 for control group and n = 10 for PD/DLB group. Scale bar, 10 μm.
LRRK2 kinase inhibition ameliorates neuropathology in synucleinopathy model
Given that LRRK2 and NFATc2 interactions appeared to play a role in neuroinflammation and neurodegeneration, we hypothesized that selective inhibition of LRRK2 kinase would reduce the overall burden of these pathologies in a synucleinopathy mouse model. To examine this hypothesis, we administered brain-permeable LRRK2 kinase inhibitor, HG-10-102-01, in a synucleinopathy mouse model overexpressing human wild-type α-synuclein under the murine Thy1 promoter (α-syn transgenic) (Fig. 8 and fig. S10 and S11) (43). This model is known to mimic aspects of the neuroinflammatory and neurodegenerative aspects of synucleinopathy, including behavioral deficits and extensive astrogliosis and microgliosis (44, 45). Age-matched non-transgenic and α-syn transgenic mice were injected with either vehicle or LRRK2 kinase inhibitor (10 mg/kg) for 4 weeks (fig. S10). Compared to non-transgenic mice, vehicle-administered α-syn transgenic mice displayed substantial astro- and microgliosis in the neocortex, hippocampus, and striatum (Fig. 8A). This glial activation was significantly (P < 0.05) diminished by LRRK2 inhibitor injection (Fig. 8A).
Fig. 8. Administration of LRRK2 kinase inhibitor ameliorates neuropathology and motor behavioral deficits in a mouse model of synucleinopathy.
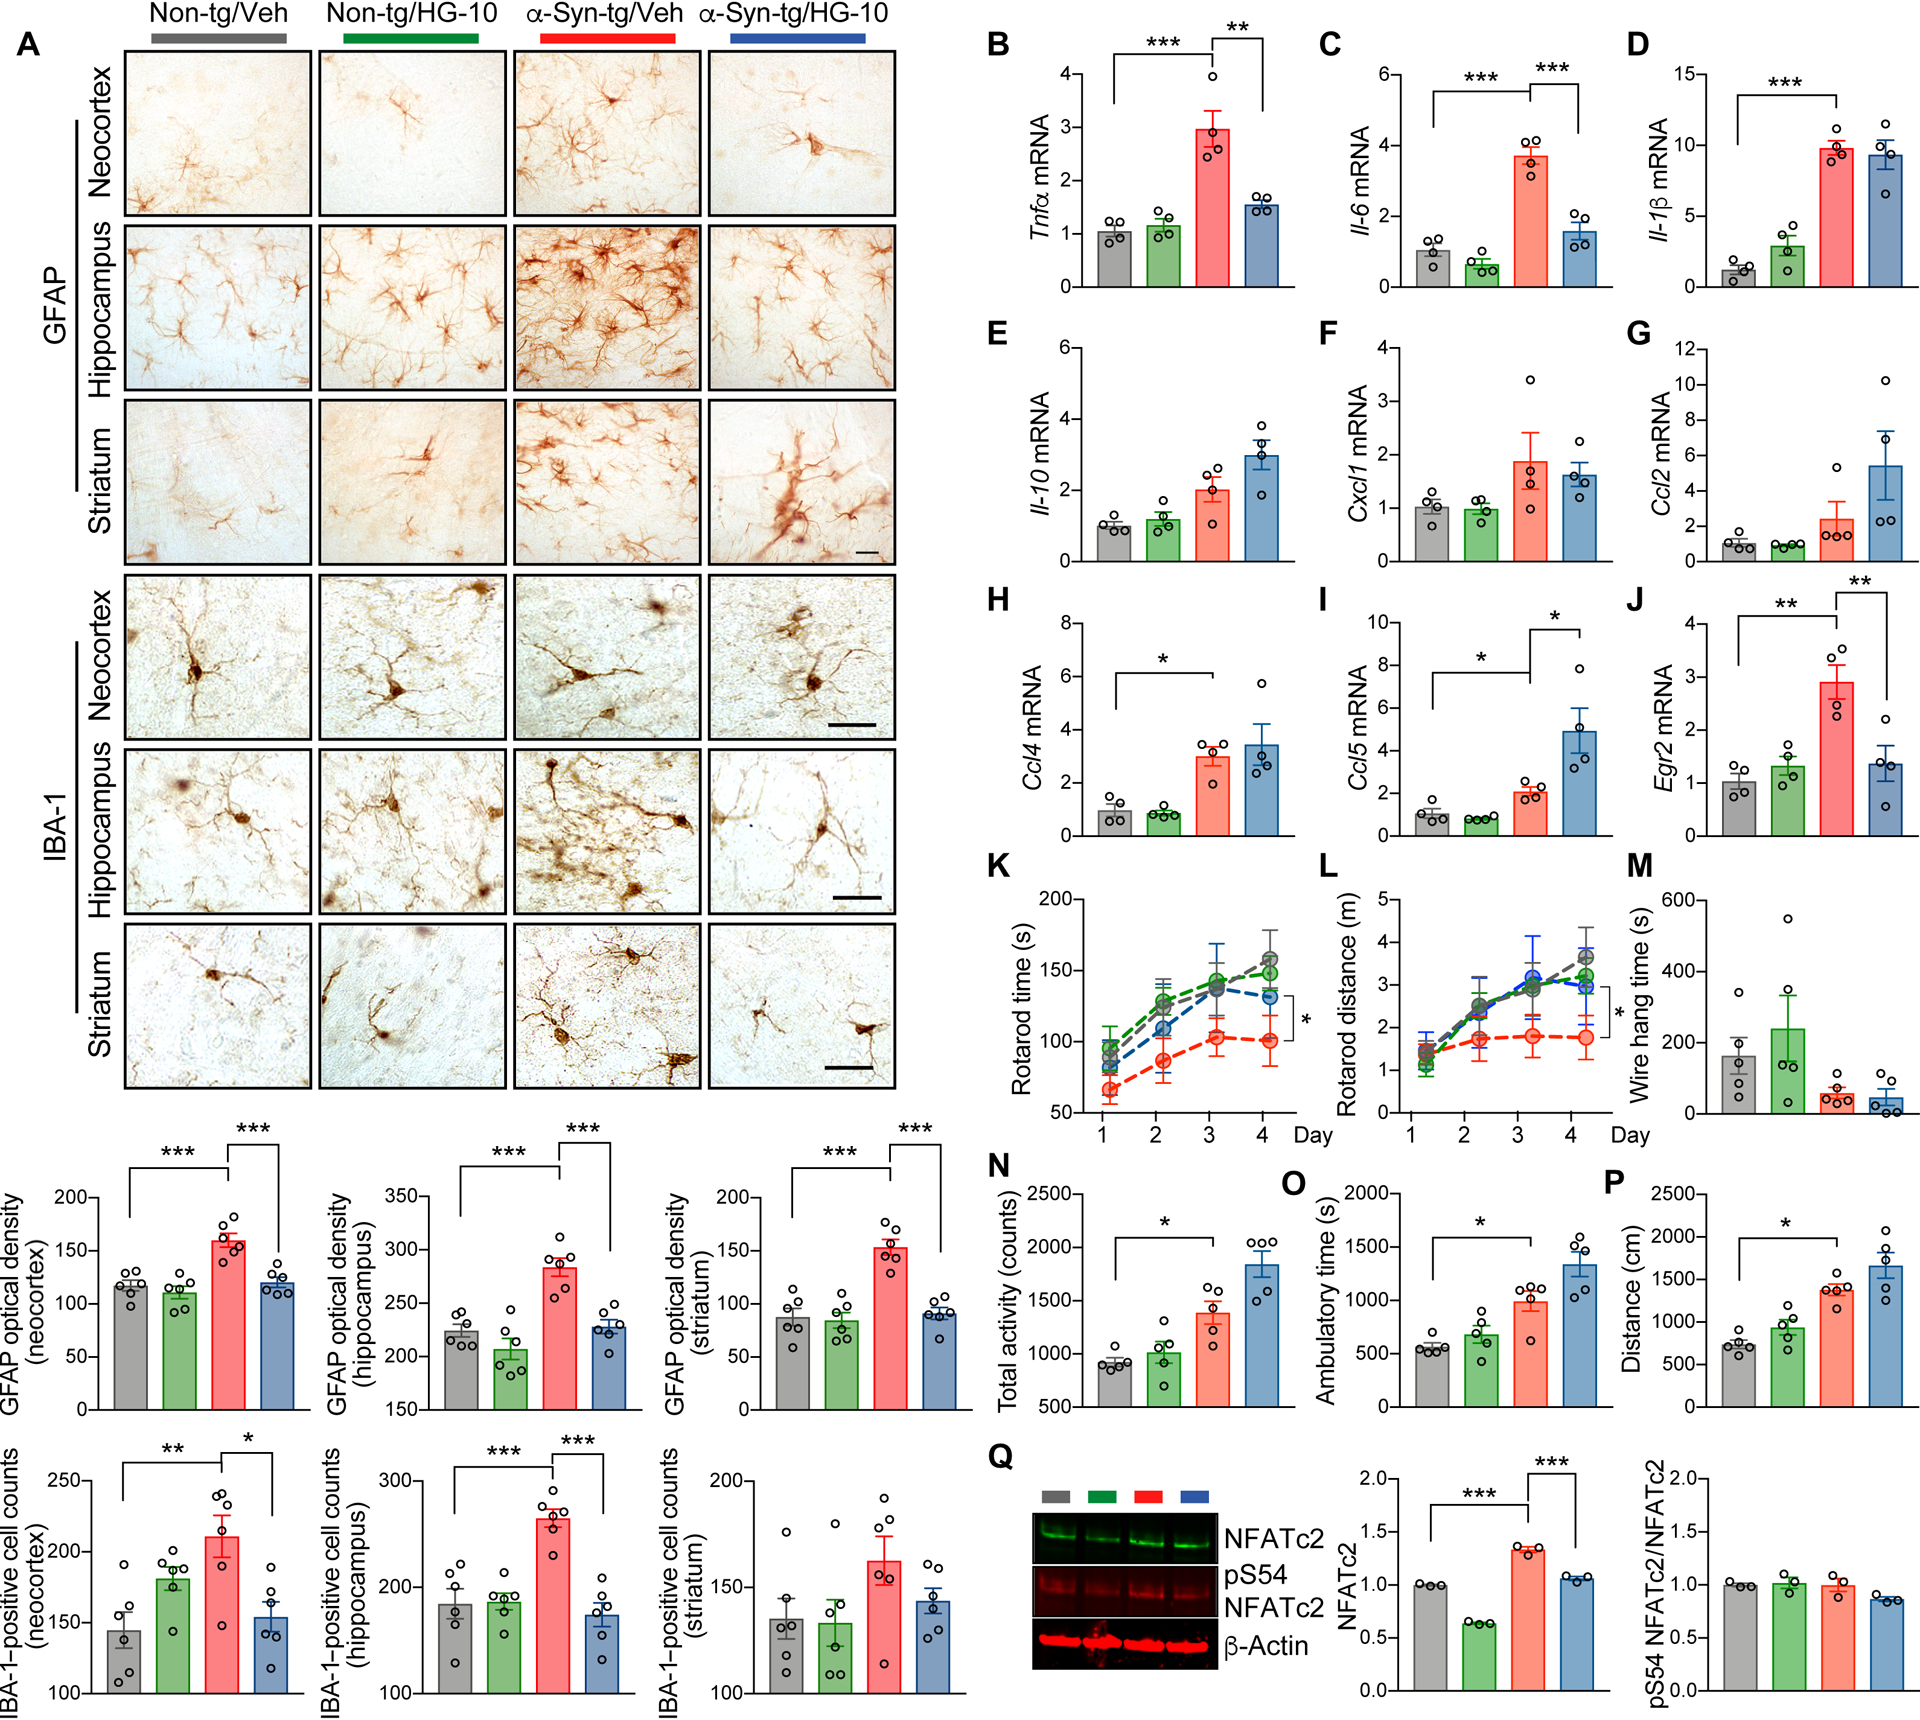
Non-transgenic and α-syn-transgenic mice were injected with vehicle or LRRK2 kinase inhibitor HG-10-102-01 (10 mg/kg) five times weekly for 4 weeks. (A) Representative images from immunohistochemistry analysis for astrogliosis (GFAP) and microgliosis (IBA-1) in the neocortex, striatum, and hippocampus of injected mice. Data are means ± SEM. *P < 0.05, **P < 0.01, and ***P < 0.001 (One-way ANOVA with Tukey’s multiple comparison post-hoc test). n = 6 per group. Scale bar, 25 μm. (B to J) Quantitative gene expression analysis from brains of injected mice. Expression of Tnfα (B), Il-6 (C), Il-1β (D), Il-10 (E), Cxcl1 (F), Ccl2 (G), Ccl4 (H), Ccl5 (I), and Egr2 (J) was determined by quantitative PCR. Data are means ± SEM. *P < 0.05, **P < 0.01 and ***P < 0.001 (One-way ANOVA and Tukey’s multiple comparison post-hoc test) n = 4 per group. (K to P) Behavioral analysis of injected mice. (K and L) Motor learning and function were determined by rotarod. The rotarod time (K) and distance (L) were analyzed. *P < 0.05 (One-way ANOVA with Tukey’s multiple comparison post-hoc test). n = 5 per group. (M) Neuromuscular impairment was determined by wire hang test. Data are means ± SEM. n = 5 per group. (N to P) Total activity (N), ambulatory time (O), and total distance (P) were analyzed by open field test. Data are means ± SEM. *P < 0.05 (One-way ANOVA with Tukey’s multiple comparison post-hoc test). n = 5 per group. (Q) Western blot analysis of whole mice brain lysates. The blot was probed with phospho-S54 NFATc2, total NFATc2, and β-Actin. NFATc2 band intensity was determined by densitometric quantification and normalized to β-Actin. ***P < 0.001 (One-way ANOVA and Tukey’s multiple comparison post-hoc test). n = 5 per group.
We next assessed changes to pro-inflammatory cytokine gene expression in non-transgenic and α-syn transgenic mice in response to injections of vehicle or LRRK2 inhibitor (Fig. 8, B to J). α-syn transgenic brains showed increased expression of Tnfα, Il-6, and Il-1β, and administration of the LRRK2 kinase inhibitor reduced the expression of Tnfα and Il-6 but not Il-1β (Fig. 8, B to D). The expression of Il-10, Cxcl1, Ccl2, and Ccl4 were not modulated in α-syn transgenic and were not affected by LRRK2 inhibitor administration (Fig. 8, E to I). However, the expression of Ccl5 was increased in LRRK2 inhibitor treated α-syn transgenic (Fig. 8I). In addition, we observed an increase of early growth response 2 (Egr2) expression, a well-established NFATc2 target gene, in α-syn-tg mice, which was also significantly (P < 0.01) attenuated by injection with LRRK2 kinase inhibitor (Fig. 8J). Double-immunostaining analysis also revealed an increase of nuclear NFATc2 in the neurons, astrocytes, and microglia of α-syn transgenic mice that was normalized by LRRK2 kinase inhibition (fig. S11, A to C). Collectively, these results suggest that LRRK2 influences gene expression of a subset of NFATc2 target genes in vivo without affected non-NFATc2 target genes in the same animals.
We next examined whether administering LRRK2 kinase inhibitor to α-syn transgenic mice could ameliorate behavioral deficits seen in these animals (Fig. 8, K to P). Behavior was assessed using rotarod (Fig. 8, K and L), wire hang (Fig. 8M), and open field tests (Fig. 8, N to P). Administration of LRRK2 kinase inhibitor at 9 months of age completely restored motor behavioral and motor learning deficits in α-syn transgenic mice (Fig. 8, K and L), whereas motor neuromuscular impairment was not rescued (Fig. 8M). Impaired exploratory and anxiety-like behavior in α-syn transgenic were not suppressed but instead further enhanced by LRRK2 kinase inhibitor administration (Fig. 8, N to P). Confirming results from human synucleinopathy brains, α-syn transgenic mice showed a marked induction of Nfatc2 and this could be rescued by LRRK2 kinase inhibition (Fig. 8Q). Collectively, these results indicate that modulation of LRRK2 kinase activity can ameliorate neuroinflammation, neuronal loss, and behavioral deficits in a mouse model of synucleinopathy.
DISCUSSION
In the current study, we report that NFATc2 is a kinase substrate for LRRK2 in mouse microglia. The interaction between LRRK2 and NFATc2 may be critical for extracellular α-synuclein-mediated microglial neuroinflammation, which in turn is essential for neurotoxicity in synucleinopathies. Exposure to neuron-released α-synuclein promoted microglial LRRK2 kinase activation, inducing nuclear translocation of NFATc2 to increase TNFα and IL-6 expression. We identified several potential threonine residues on NFATc2 (T483, T733, T862, T870, and T893) for LRRK2 phosphorylation and subsequent nuclear translocation. We have also shown that NFATc2 has increased expression and nuclear translocation in neuronal and non-neuronal cells of brains from patients with synucleinopathy and a mouse model. Moreover, administration of LRRK2 kinase inhibitor ameliorated neuroinflammation, toxicity, and motor behavior deficits in this mouse model of synucleinopathy, suggesting that targeting LRRK2 and NFATc2 interactions might be of therapeutic interest for synucleinopathies (fig. S12).
The mouse model utilized in current study is known to reproduce most features of synucleinopathies, including neuropathology and deficits in motor and non-motor function (46). As such, these mice have been extensively used to study behavioral deficits. For example, dopaminergic therapy has been shown to improve motor but not non-motor dysfunction in these mice (46). In the current study, we also demonstrated a notable improvement of motor function by LRRK2 kinase inhibition. However, LRRK2 inhibition not only failed to improve non-motor symptoms, but also worsened them. Although we do not yet understand the molecular mechanism of non-motor behavioral deficits in synucleinopathy models, a recent study associated LRRK2 with non-motor animal behavior (47). Therefore, we can speculate that the non-motor deficits of this synucleinopathy model is closely tied to LRRK2 activity and needs to be explored carefully in further studies.
In addition to worsening non-motor symptoms in mice, genetic and pharmacological LRRK2 kinase inhibition delayed uptake and degradation of extracellular α-synuclein in primary microglia. As with other anti-inflammatory drugs, LRKK2 inhibitors may have both positive and negative effects given the complex role of inflammation and microglial activation in neurodegeneration. Extracellular α-synuclein aggregates may interact with microglia in at least two different ways: on one hand, they may stimulate TLR2 to activate the LRRK2-NFATc2 pathway and produce a pro-inflammatory phenotype, as shown in the present study; on the other, they can also interact with other receptors to initiate LRRK2-dependent aggregate phagocytosis (48) and clearance via lysosomal pathways (49, 50). Thus, blocking NFATc2 phosphorylation by LRRK2 inhibition may not only prevent toxic inflammation but also impede α-synuclein clearance. That being said, much of our data suggests that the advantages of LRRK2 inhibition may outweigh the disadvantages. Moreover, this balance of paradoxical effects may depend on the stage of disease. For example, in cases where there is substantial α-synuclein accumulation—as is the case for most symptomatic patients with PD/DLB—microglial activation may be more harmful than beneficial by exacerbating a toxic microenvironment. Not only has chronic neuroinflammation been shown to increase α-synuclein deposition in various synucleinopathy animal models (51–56), but when these animals were treated with drugs to reduce neuroinflammation, α-synuclein neuropathology also decreased (57, 58). Therefore, we support selective inhibition of the microglial LRRK2-NFATc2 neuroinflammation cascade to reduce α-synuclein-mediated neurotoxicity. Indeed, a previous study found that LRRK2 inhibition reduced α-synuclein pathology in synucleinopathy mice (28). Nevertheless, we certainly cannot ignore the concern that reducing microglial clearance activity might allow α-synuclein to accumulate in the extracellular space. A mixed strategy that targets both extracellular α-synuclein and the microglial LRRK2-NFATc2 cascade may be necessary, such as a combination of a LRRK2 pharmacological inhibitor and an anti-α-synuclein immunotherapy. We plan to explore this possibility in future studies.
NFAT is known to play a critical role in T cell differentiation and response (30, 59). In the canonical NFAT pathway, Ca2+/Calcineurin mediates nuclear translocation of NFAT through the dephosphorylation of multiple serine residues in the N-terminus region, including the nuclear localization signal (34, 59, 60). Recent studies have also suggested the involvement of a high molecular weight signaling complex containing scaffolding proteins, non-coding RNAs, and kinases such as LRRK2 during the interaction of NFAT and calcineurin (35, 37, 61, 62). However, it remains controversial whether LRRK2 modulates NFAT. LRRK2 was first suggested as a negative regulator of NFAT based on its interactions with noncoding RNA repressor of NFAT to inhibit nuclear translocation (37, 63). A more recent study, on the other hand, demonstrated an induction of NFAT activity in HEK293T cells expressing LRRK2 or LRRK2 G2019S (38). Moreover, bone marrow-derived dendritic cells isolated from mice overexpressing Lrrk2 and treated with zymosan expressed more Il-2, an NFAT target gene, compared to that of non-transgenic mice (38). These seemingly conflicting results may be due to a LRRK2/NFAT signaling cascade that can be further modified either by cell type or by stimulus applied. Therefore, our studies were aimed at clarifying whether LRRK2 directly modulates the nucleus translocation of NFATc2 to accelerate target gene expression in microglia in response to extracellular α-synuclein and, in this context, LRRK2 kinase activity appears to enhance NFATc2 nuclear accumulation. However, given the importance of NFAT in other cells such as T cells, future studies should carefully explore how NFAT and LRRK2 impact overall activity in other cell types that express both molecules.
Although microglia activation is associated with pro-inflammatory cytokine production, activation may also lead to the release of neurotrophic molecules such as brain-derived neurotrophic factor (64). We have previously demonstrated that although TLR2 neutralization decreases the expression of pro-inflammatory cytokines it may also impact neurotrophin production in this mouse model of synucleinopathy (7). Here, we have found that the microglial LRRK2-NFATc2 signaling cascade selectively modulates the production of specific neurotoxic pro-inflammatory cytokines, TNFα and IL-6. Therefore, we propose that modulation of the LRRK2-NFATc2 interaction might selectively reduce the neurotoxic microglial response without affecting neurotrophic factor release in synucleinopathies, although this hypothesis requires further empirical assessment.
In agreement with our findings, a recent study reported that epidermal cells obtained from PD patients with the LRRK2-G2019S mutation showed a blunted response to LPS treatment compared to control cells (65). We confirm those observations here and further show that the distribution of NFATc2 is altered in G2019S knock-in mouse microglia. Specifically, we observed a decrease in cytoplasmic NFATc2 in the G2019S knock-in mutants compared to wildtype, resulting in the lack of a key mediator for the LRRK2 signaling cascade. Together, these results support previous findings that cells with the LRRK2-G2019S mutation have an altered microglial activation response against LPS.
NFAT has been considered to be an immune-related protein and expressed in T cells and macrophages (66). However, recent studies have shown that neurons also express NFAT and that different neuronal cell types express different NFAT isoforms (67–70). Here, we confirm the neuronal expression of NFATc2 in the human neocortex and striatum. Interestingly, PD/DLB brains showed greater overall expression and nuclear translocation of NFATc2. As such, we propose that neuronal NFATc2 may provide an additional avenue of regulation, in additional to microglia, in the PD/DLB brain.
In the current study, we proposed microglial LRRK2 and NFATc2 as a potential therapeutic target for synucleinopathy. For further translational application, however, a few challenges remain. Both LRRK2 and NFATc2 are known to be expressed and play important roles in peripheral immune cells such as T cells. Therefore, the effects of LRRK2 and NFATc2 inhibition must be carefully analyzed in the innate and adaptive immune systems prior to apply the findings to synucleinopathies treatment. Second, NFATc2 has many phosphorylation residues and its activity has been known to be associated with phosphorylation and dephosphorylation of multiple residues. However, only few antibodies are available to address the phosphorylation of NFATc2. Therefore, antibodies specific to NFATc2 phosphorylated at the proposed target residue must be developed to demonstrate the association of NFATc2 phosphorylation with disease. Third, LRRK2 signaling modulation worsened non-motor symptoms in a synucleinopathy mouse model although motor deficits were markedly improved. Combinational therapy may be necessary to address patient non-motor symptoms. Despite these limitations, our results suggest that the LRRK2-NFATc2 signaling cascade may be a new therapeutic target for synucleinopathies (fig. S12).
MATERIALS AND METHODS
Study design
The aim of this study was to identify the role of LRRK2 in neuroinflammation and characterize LRRK2 and its downstream signaling cascade as promising therapeutic targets for synucleinopathies. Primary mouse microglia were utilized for in vitro experiments and the n for individual experiments is indicated in the figure legends. Sample size reflects the number of independent biological replicates. For pre-clinical investigation, we administered LRRK2 kinase inhibitor to non-transgenic and α-syn transgenic mice. Sample size was determined by availability and previous experience with α-syn transgenic mouse and no outliers were excluded from the study. Injections and dissections were conducted in a non-blinded fashion. Blinding was performed during data collection and analysis. Representative images were obtained from the subjects in randomly chosen area.
Human specimens, neuropathological evaluation, and criteria of diagnosis
Human specimens (8 age-matched control and 10 PD/DLB cases) were obtained from the Alzheimer Disease Research Center (ADRC) at the University of California, San Diego (UCSD) (table S1). The diagnosis was based on the initial clinical presentation with dementia followed by parkinsonism and the presence of cortical and subcortical α-synuclein/Ubiquitin-positive Lewy bodies (71).
Statistical analysis
Data acquisition and quantification was performed by experimenters blinded to genotype with the exception of the in vitro molecular analyses. The number of independent experiments in in vitro assays or the number of human and mouse subjects in in vivo experiments are represented by N. All data were presented as group mean ± SEM. Statistical analyses were performed using Instat 3 (GraphPad,). Statistical analyses were conducted using unpaired t test for two groups, or one-way ANOVA followed by Tukey’s multiple comparison test for more than two groups. No animal or sample was excluded from the analysis.
Supplementary Material
Acknowledgments:
We are grateful to H. Cai (National Institute on Aging) and H. Melrose (Mayo clinic) for providing Lrrk2 knock out (B6.129X1(FVB)-Lrrk2tm1.1Cai/J) and Lrrk2 G2019S knock-in (B6.Cg-Lrrk2tm1.1Hlme/J) mice, respectively.
Funding:
This work was supported in part by the Intramural Research Program of the National Institutes of Health, National Institute on Aging, National Research Foundation of Korea (NRF) grants funded by the Korean government (MSIT, NRF-2018R1A2A1A05078261 to S.-J.L. and NRF-2018R1A5A2025964 to S.-J.L.), and by a grant of the Korea Health Technology R&D Project through the Korea Health Industry Development Institute (KHIDI) funded by the Ministry of Health & Welfare, Republic of Korea (HI19C0256 to S.-J.L.)
Footnotes
Competing interests: S.-J.L. is a founder and CEO of Neuramedy Co., Ltd.
Data and materials availability: All the material is present in the main text or in the supplementary material.
SUPPLEMENTARY MATERIALS
Materials and Methods
Fig. S1. LZCM and α-synuclein fibril do not induce LRRK2 phosphorylation in microglia.
Fig. S2. TLR2 dependent LRRK2 phosphorylation by neuron-released α-synuclein in microglia.
Fig. S3. LRRK2 modulates microglial uptake of extracellular α-synuclein.
Fig. S4. Quantitative analysis of microglia cytokine gene expression in primary microglia exposed to LRRK2 kinase inhibitor.
Fig. S5. Generation and analysis of microglia conditioned medium.
Fig. S6. TLR2-dependent induction and nuclear translocation of NFATc2 in α-synuclein exposed microglia.
Fig. S7. Calcineurin-independent induction of NFATc2 in α-synuclein-exposed microglia.
Fig. S8. NFATc2 induction in α-synuclein exposed isolated aged-microglia.
Fig. S9. An example of MS/MS data obtained for phosphopeptides detected in NFATc2.
Fig. S10. Schematic illustration of LRRK2 kinase inhibitor administration.
Fig. S11. LRRK2 kinase inhibitor administration reduces nuclear localization of NFATc2 in the brain of a synucleinopathy mouse model.
Fig. S12. Model for microglia-mediated neurotoxicity in synucleinopathies.
Table S1. Human specimens, neuropathological evaluation and criteria for diagnosis.
Table S2. List of primers for quantitative PCR.
REFERENCES AND NOTES
- 1.Fellner L, Jellinger KA, Wenning GK, Stefanova N, Glial dysfunction in the pathogenesis of alpha-synucleinopathies: emerging concepts. Acta Neuropathol 121, 675–693 (2011). [DOI] [PMC free article] [PubMed] [Google Scholar]
- 2.Lee HJ, Bae EJ, Lee SJ, Extracellular alpha--synuclein-a novel and crucial factor in Lewy body diseases. Nat Rev Neurol 10, 92–98 (2014). [DOI] [PubMed] [Google Scholar]
- 3.Kim C, Lee SJ, Controlling the mass action of alpha-synuclein in Parkinson’s disease. J Neurochem 107, 303–316 (2008). [DOI] [PubMed] [Google Scholar]
- 4.Lim S, Kim HJ, Kim DK, Lee SJ, Non-cell-autonomous actions of alpha-synuclein: Implications in glial synucleinopathies. Prog Neurobiol 169, 158–171 (2018). [DOI] [PubMed] [Google Scholar]
- 5.Desplats P, Lee HJ, Bae EJ, Patrick C, Rockenstein E, Crews L, Spencer B, Masliah E, Lee SJ, Inclusion formation and neuronal cell death through neuron-to-neuron transmission of alpha-synuclein. Proc Natl Acad Sci U S A 106, 13010–13015 (2009). [DOI] [PMC free article] [PubMed] [Google Scholar]
- 6.Lee HJ, Suk JE, Patrick C, Bae EJ, Cho JH, Rho S, Hwang D, Masliah E, Lee SJ, Direct transfer of alpha-synuclein from neuron to astroglia causes inflammatory responses in synucleinopathies. J Biol Chem 285, 9262–9272 (2010). [DOI] [PMC free article] [PubMed] [Google Scholar]
- 7.Kim C, Ho DH, Suk JE, You S, Michael S, Kang J, Joong Lee S, Masliah E, Hwang D, Lee HJ, Lee SJ, Neuron-released oligomeric alpha-synuclein is an endogenous agonist of TLR2 for paracrine activation of microglia. Nat Commun 4, 1562 (2013). [DOI] [PMC free article] [PubMed] [Google Scholar]
- 8.Halliday GM, Stevens CH, Glia: initiators and progressors of pathology in Parkinson’s disease. Mov Disord 26, 6–17 (2011). [DOI] [PubMed] [Google Scholar]
- 9.Kwon S, Iba M, Masliah E, Kim C, Targeting Microglial and Neuronal Toll-like Receptor 2 in Synucleinopathies. Exp Neurobiol 28, 547–553 (2019). [DOI] [PMC free article] [PubMed] [Google Scholar]
- 10.Kim C, Lee HJ, Masliah E, Lee SJ, Non-cell-autonomous Neurotoxicity of alpha-synuclein Through Microglial Toll-like Receptor 2. Exp Neurobiol 25, 113–119 (2016). [DOI] [PMC free article] [PubMed] [Google Scholar]
- 11.Kim C, Spencer B, Rockenstein E, Yamakado H, Mante M, Adame A, Fields JA, Masliah D, Iba M, Lee HJ, Rissman RA, Lee SJ, Masliah E, Immunotherapy targeting toll-like receptor 2 alleviates neurodegeneration in models of synucleinopathy by modulating alpha-synuclein transmission and neuroinflammation. Mol Neurodegener 13, 43 (2018). [DOI] [PMC free article] [PubMed] [Google Scholar]
- 12.Cookson MR, LRRK2 Pathways Leading to Neurodegeneration. Curr Neurol Neurosci Rep 15, 42 (2015). [DOI] [PMC free article] [PubMed] [Google Scholar]
- 13.Cresto N, Gardier C, Gubinelli F, Gaillard MC, Liot G, West AB, Brouillet E, The unlikely partnership between LRRK2 and alpha-synuclein in Parkinson’s disease. Eur J Neurosci 49, 339–363 (2019). [DOI] [PMC free article] [PubMed] [Google Scholar]
- 14.Russo I, Bubacco L, Greggio E, LRRK2 and neuroinflammation: partners in crime in Parkinson’s disease? J Neuroinflammation 11, 52 (2014). [DOI] [PMC free article] [PubMed] [Google Scholar]
- 15.Moehle MS, Webber PJ, Tse T, Sukar N, Standaert DG, DeSilva TM, Cowell RM, West AB, LRRK2 inhibition attenuates microglial inflammatory responses. J Neurosci 32, 1602–1611 (2012). [DOI] [PMC free article] [PubMed] [Google Scholar]
- 16.Gillardon F, Schmid R, Draheim H, Parkinson’s disease-linked leucine-rich repeat kinase 2(R1441G) mutation increases proinflammatory cytokine release from activated primary microglial cells and resultant neurotoxicity. Neuroscience 208, 41–48 (2012). [DOI] [PubMed] [Google Scholar]
- 17.Kim B, Yang MS, Choi D, Kim JH, Kim HS, Seol W, Choi S, Jou I, Kim EY, Joe EH, Impaired inflammatory responses in murine Lrrk2-knockdown brain microglia. PLoS One 7, e34693 (2012). [DOI] [PMC free article] [PubMed] [Google Scholar]
- 18.Kim C, Cho ED, Kim HK, You S, Lee HJ, Hwang D, Lee SJ, beta1-integrin-dependent migration of microglia in response to neuron-released alpha-synuclein. Exp Mol Med 46, e91 (2014). [DOI] [PMC free article] [PubMed] [Google Scholar]
- 19.Doggett EA, Zhao J, Mork CN, Hu D, Nichols RJ, Phosphorylation of LRRK2 serines 955 and 973 is disrupted by Parkinson’s disease mutations and LRRK2 pharmacological inhibition. J Neurochem 120, 37–45 (2012). [DOI] [PubMed] [Google Scholar]
- 20.Dzamko N, Deak M, Hentati F, Reith AD, Prescott AR, Alessi DR, Nichols RJ, Inhibition of LRRK2 kinase activity leads to dephosphorylation of Ser(910)/Ser(935), disruption of 14-3-3 binding and altered cytoplasmic localization. Biochem J 430, 405–413 (2010). [DOI] [PMC free article] [PubMed] [Google Scholar]
- 21.Vancraenenbroeck R, De Raeymaecker J, Lobbestael E, Gao F, De Maeyer M, Voet A, Baekelandt V, Taymans JM, In silico, in vitro and cellular analysis with a kinome-wide inhibitor panel correlates cellular LRRK2 dephosphorylation to inhibitor activity on LRRK2. Front Mol Neurosci 7, 51 (2014). [DOI] [PMC free article] [PubMed] [Google Scholar]
- 22.Choi HG, Zhang J, Deng X, Hatcher JM, Patricelli MP, Zhao Z, Alessi DR, Gray NS, Brain Penetrant LRRK2 Inhibitor. ACS Med Chem Lett 3, 658–662 (2012). [DOI] [PMC free article] [PubMed] [Google Scholar]
- 23.Steger M, Tonelli F, Ito G, Davies P, Trost M, Vetter M, Wachter S, Lorentzen E, Duddy G, Wilson S, Baptista MA, Fiske BK, Fell MJ, Morrow JA, Reith AD, Alessi DR, Mann M, Phosphoproteomics reveals that Parkinson’s disease kinase LRRK2 regulates a subset of Rab GTPases. Elife 5, (2016). [DOI] [PMC free article] [PubMed] [Google Scholar]
- 24.Ito G, Katsemonova K, Tonelli F, Lis P, Baptista MA, Shpiro N, Duddy G, Wilson S, Ho PW, Ho SL, Reith AD, Alessi DR, Phos-tag analysis of Rab10 phosphorylation by LRRK2: a powerful assay for assessing kinase function and inhibitors. Biochem J 473, 2671–2685 (2016). [DOI] [PMC free article] [PubMed] [Google Scholar]
- 25.Lis P, Burel S, Steger M, Mann M, Brown F, Diez F, Tonelli F, Holton JL, Ho PW, Ho SL, Chou MY, Polinski NK, Martinez TN, Davies P, Alessi DR, Development of phospho-specific Rab protein antibodies to monitor in vivo activity of the LRRK2 Parkinson’s disease kinase. Biochem J 475, 1–22 (2018). [DOI] [PMC free article] [PubMed] [Google Scholar]
- 26.Fan Y, Howden AJM, Sarhan AR, Lis P, Ito G, Martinez TN, Brockmann K, Gasser T, Alessi DR, Sammler EM, Interrogating Parkinson’s disease LRRK2 kinase pathway activity by assessing Rab10 phosphorylation in human neutrophils. Biochem J 475, 23–44 (2018). [DOI] [PMC free article] [PubMed] [Google Scholar]
- 27.Lee HJ, Suk JE, Bae EJ, Lee SJ, Clearance and deposition of extracellular alpha-synuclein aggregates in microglia. Biochem Biophys Res Commun 372, 423–428 (2008). [DOI] [PubMed] [Google Scholar]
- 28.Bae EJ, Kim DK, Kim C, Mante M, Adame A, Rockenstein E, Ulusoy A, Klinkenberg M, Jeong GR, Bae JR, Lee C, Lee HJ, Lee BD, Di Monte DA, Masliah E, Lee SJ, LRRK2 kinase regulates alpha-synuclein propagation via RAB35 phosphorylation. Nat Commun 9, 3465 (2018). [DOI] [PMC free article] [PubMed] [Google Scholar]
- 29.Bieri G, Brahic M, Bousset L, Couthouis J, Kramer NJ, Ma R, Nakayama L, Monbureau M, Defensor E, Schule B, Shamloo M, Melki R, Gitler AD, LRRK2 modifies alpha-syn pathology and spread in mouse models and human neurons. Acta Neuropathol 137, 961–980 (2019). [DOI] [PMC free article] [PubMed] [Google Scholar]
- 30.Hermann-Kleiter N, Baier G, NFAT pulls the strings during CD4+ T helper cell effector functions. Blood 115, 2989–2997 (2010). [DOI] [PubMed] [Google Scholar]
- 31.Fric J, Zelante T, Wong AY, Mertes A, Yu HB, Ricciardi-Castagnoli P, NFAT control of innate immunity. Blood 120, 1380–1389 (2012). [DOI] [PubMed] [Google Scholar]
- 32.Subramanian A, Tamayo P, Mootha VK, Mukherjee S, Ebert BL, Gillette MA, Paulovich A, Pomeroy SL, Golub TR, Lander ES, Mesirov JP, Gene set enrichment analysis: a knowledge-based approach for interpreting genome-wide expression profiles. Proc Natl Acad Sci U S A 102, 15545–15550 (2005). [DOI] [PMC free article] [PubMed] [Google Scholar]
- 33.Giesert F, Hofmann A, Burger A, Zerle J, Kloos K, Hafen U, Ernst L, Zhang J, Vogt-Weisenhorn DM, Wurst W, Expression analysis of Lrrk1, Lrrk2 and Lrrk2 splice variants in mice. PLoS One 8, e63778 (2013). [DOI] [PMC free article] [PubMed] [Google Scholar]
- 34.Crabtree GR, Olson EN, NFAT signaling: choreographing the social lives of cells. Cell 109 Suppl, S67–79 (2002). [DOI] [PubMed] [Google Scholar]
- 35.Muller MR, Rao A, NFAT, immunity and cancer: a transcription factor comes of age. Nat Rev Immunol 10, 645–656 (2010). [DOI] [PubMed] [Google Scholar]
- 36.Feske S, Giltnane J, Dolmetsch R, Staudt LM, Rao A, Gene regulation mediated by calcium signals in T lymphocytes. Nat Immunol 2, 316–324 (2001). [DOI] [PubMed] [Google Scholar]
- 37.Liu Z, Lee J, Krummey S, Lu W, Cai H, Lenardo MJ, The kinase LRRK2 is a regulator of the transcription factor NFAT that modulates the severity of inflammatory bowel disease. Nat Immunol 12, 1063–1070 (2011). [DOI] [PMC free article] [PubMed] [Google Scholar]
- 38.Takagawa T, Kitani A, Fuss I, Levine B, Brant SR, Peter I, Tajima M, Nakamura S, Strober W, An increase in LRRK2 suppresses autophagy and enhances Dectin-1-induced immunity in a mouse model of colitis. Sci Transl Med 10, (2018). [DOI] [PMC free article] [PubMed] [Google Scholar]
- 39.Yue M, Hinkle KM, Davies P, Trushina E, Fiesel FC, Christenson TA, Schroeder AS, Zhang L, Bowles E, Behrouz B, Lincoln SJ, Beevers JE, Milnerwood AJ, Kurti A, McLean PJ, Fryer JD, Springer W, Dickson DW, Farrer MJ, Melrose HL, Progressive dopaminergic alterations and mitochondrial abnormalities in LRRK2 G2019S knock-in mice. Neurobiol Dis 78, 172–195 (2015). [DOI] [PMC free article] [PubMed] [Google Scholar]
- 40.Giffin MJ, Stroud JC, Bates DL, von Koenig KD, Hardin J, Chen L, Structure of NFAT1 bound as a dimer to the HIV-1 LTR kappa B element. Nat Struct Biol 10, 800–806 (2003). [DOI] [PubMed] [Google Scholar]
- 41.Stroud JC, Chen L, Structure of NFAT bound to DNA as a monomer. J Mol Biol 334, 1009–1022 (2003). [DOI] [PubMed] [Google Scholar]
- 42.Zhang Y, I-TASSER server for protein 3D structure prediction. BMC Bioinformatics 9, 40 (2008). [DOI] [PMC free article] [PubMed] [Google Scholar]
- 43.Atashrazm F, Dzamko N, LRRK2 inhibitors and their potential in the treatment of Parkinson’s disease: current perspectives. Clin Pharmacol 8, 177–189 (2016). [DOI] [PMC free article] [PubMed] [Google Scholar]
- 44.Braak H, Sastre M, Del Tredici K, Development of alpha-synuclein immunoreactive astrocytes in the forebrain parallels stages of intraneuronal pathology in sporadic Parkinson’s disease. Acta Neuropathol 114, 231–241 (2007). [DOI] [PubMed] [Google Scholar]
- 45.Kim C, Rockenstein E, Spencer B, Kim HK, Adame A, Trejo M, Stafa K, Lee HJ, Lee SJ, Masliah E, Antagonizing Neuronal Toll-like Receptor 2 Prevents Synucleinopathy by Activating Autophagy. Cell Rep 13, 771–782 (2015). [DOI] [PMC free article] [PubMed] [Google Scholar]
- 46.Chesselet MF, Richter F, Zhu C, Magen I, Watson MB, Subramaniam SR, A progressive mouse model of Parkinson’s disease: the Thy1-aSyn (“Line 61”) mice. Neurotherapeutics 9, 297–314 (2012). [DOI] [PMC free article] [PubMed] [Google Scholar]
- 47.Volta M, Melrose H, LRRK2 mouse models: dissecting the behavior, striatal neurochemistry and neurophysiology of PD pathogenesis. Biochem Soc Trans 45, 113–122 (2017). [DOI] [PubMed] [Google Scholar]
- 48.Marker DF, Puccini JM, Mockus TE, Barbieri J, Lu SM, Gelbard HA, LRRK2 kinase inhibition prevents pathological microglial phagocytosis in response to HIV-1 Tat protein. J Neuroinflammation 9, 261 (2012). [DOI] [PMC free article] [PubMed] [Google Scholar]
- 49.Lee HJ, Khoshaghideh F, Patel S, Lee SJ, Clearance of alpha-synuclein oligomeric intermediates via the lysosomal degradation pathway. J Neurosci 24, 1888–1896 (2004). [DOI] [PMC free article] [PubMed] [Google Scholar]
- 50.Bae EJ, Lee HJ, Rockenstein E, Ho DH, Park EB, Yang NY, Desplats P, Masliah E, Lee SJ, Antibody-aided clearance of extracellular alpha-synuclein prevents cell-to-cell aggregate transmission. J Neurosci 32, 13454–13469 (2012). [DOI] [PMC free article] [PubMed] [Google Scholar]
- 51.Frank-Cannon TC, Alto LT, McAlpine FE, Tansey MG, Does neuroinflammation fan the flame in neurodegenerative diseases? Mol Neurodegener 4, 47 (2009). [DOI] [PMC free article] [PubMed] [Google Scholar]
- 52.Choi DY, Liu M, Hunter RL, Cass WA, Pandya JD, Sullivan PG, Shin EJ, Kim HC, Gash DM, Bing G, Striatal neuroinflammation promotes Parkinsonism in rats. PLoS One 4, e5482 (2009). [DOI] [PMC free article] [PubMed] [Google Scholar]
- 53.Gao HM, Zhang F, Zhou H, Kam W, Wilson B, Hong JS, Neuroinflammation and alpha-synuclein dysfunction potentiate each other, driving chronic progression of neurodegeneration in a mouse model of Parkinson’s disease. Environ Health Perspect 119, 807–814 (2011). [DOI] [PMC free article] [PubMed] [Google Scholar]
- 54.Ifuku M, Katafuchi T, Mawatari S, Noda M, Miake K, Sugiyama M, Fujino T, Anti-inflammatory/anti-amyloidogenic effects of plasmalogens in lipopolysaccharide-induced neuroinflammation in adult mice. J Neuroinflammation 9, 197 (2012). [DOI] [PMC free article] [PubMed] [Google Scholar]
- 55.Kahn MS, Kranjac D, Alonzo CA, Haase JH, Cedillos RO, McLinden KA, Boehm GW, Chumley MJ, Prolonged elevation in hippocampal Abeta and cognitive deficits following repeated endotoxin exposure in the mouse. Behav Brain Res 229, 176–184 (2012). [DOI] [PubMed] [Google Scholar]
- 56.Liu Y, Qin L, Wilson B, Wu X, Qian L, Granholm AC, Crews FT, Hong JS, Endotoxin induces a delayed loss of TH-IR neurons in substantia nigra and motor behavioral deficits. Neurotoxicology 29, 864–870 (2008). [DOI] [PMC free article] [PubMed] [Google Scholar]
- 57.Kim C, Ojo-Amaize E, Spencer B, Rockenstein E, Mante M, Desplats P, Wrasidlo W, Adame A, Nchekwube E, Oyemade O, Okogun J, Chan M, Cottam H, Masliah E, Hypoestoxide reduces neuroinflammation and alpha-synuclein accumulation in a mouse model of Parkinson’s disease. J Neuroinflammation 12, 236 (2015). [DOI] [PMC free article] [PubMed] [Google Scholar]
- 58.Valera E, Masliah E, Immunotherapy for neurodegenerative diseases: focus on alpha-synucleinopathies. Pharmacol Ther 138, 311–322 (2013). [DOI] [PMC free article] [PubMed] [Google Scholar]
- 59.Feske S, Calcium signalling in lymphocyte activation and disease. Nat Rev Immunol 7, 690–702 (2007). [DOI] [PubMed] [Google Scholar]
- 60.Hogan PG, Chen L, Nardone J, Rao A, Transcriptional regulation by calcium, calcineurin, and NFAT. Genes Dev 17, 2205–2232 (2003). [DOI] [PubMed] [Google Scholar]
- 61.Huang GN, Huso DL, Bouyain S, Tu J, McCorkell KA, May MJ, Zhu Y, Lutz M, Collins S, Dehoff M, Kang S, Whartenby K, Powell J, Leahy D, Worley PF, NFAT binding and regulation of T cell activation by the cytoplasmic scaffolding Homer proteins. Science 319, 476–481 (2008). [DOI] [PMC free article] [PubMed] [Google Scholar]
- 62.Willingham AT, Orth AP, Batalov S, Peters EC, Wen BG, Aza-Blanc P, Hogenesch JB, Schultz PG, A strategy for probing the function of noncoding RNAs finds a repressor of NFAT. Science 309, 1570–1573 (2005). [DOI] [PubMed] [Google Scholar]
- 63.Ahmed I, Tamouza R, Delord M, Krishnamoorthy R, Tzourio C, Mulot C, Nacfer M, Lambert JC, Beaune P, Laurent-Puig P, Loriot MA, Charron D, Elbaz A, Association between Parkinson’s disease and the HLA-DRB1 locus. Mov Disord 27, 1104–1110 (2012). [DOI] [PubMed] [Google Scholar]
- 64.Trang T, Beggs S, Salter MW, Brain-derived neurotrophic factor from microglia: a molecular substrate for neuropathic pain. Neuron Glia Biol 7, 99–108 (2011). [DOI] [PMC free article] [PubMed] [Google Scholar]
- 65.Lopez de Maturana R, Aguila JC, Sousa A, Vazquez N, Del Rio P, Aiastui A, Gorostidi A, Lopez de Munain A, Sanchez-Pernaute R, Leucine-rich repeat kinase 2 modulates cyclooxygenase 2 and the inflammatory response in idiopathic and genetic Parkinson’s disease. Neurobiol Aging 35, 1116–1124 (2014). [DOI] [PubMed] [Google Scholar]
- 66.Vaeth M, Feske S, NFAT control of immune function: New Frontiers for an Abiding Trooper. F1000Res 7, 260 (2018). [DOI] [PMC free article] [PubMed] [Google Scholar]
- 67.Luo J, Sun L, Lin X, Liu G, Yu J, Parisiadou L, Xie C, Ding J, Cai H, A calcineurin- and NFAT-dependent pathway is involved in alpha-synuclein-induced degeneration of midbrain dopaminergic neurons. Hum Mol Genet 23, 6567–6574 (2014). [DOI] [PMC free article] [PubMed] [Google Scholar]
- 68.Nguyen T, Di Giovanni S, NFAT signaling in neural development and axon growth. Int J Dev Neurosci 26, 141–145 (2008). [DOI] [PMC free article] [PubMed] [Google Scholar]
- 69.Graef IA, Wang F, Charron F, Chen L, Neilson J, Tessier-Lavigne M, Crabtree GR, Neurotrophins and netrins require calcineurin/NFAT signaling to stimulate outgrowth of embryonic axons. Cell 113, 657–670 (2003). [DOI] [PubMed] [Google Scholar]
- 70.Vihma H, Luhakooder M, Pruunsild P, Timmusk T, Regulation of different human NFAT isoforms by neuronal activity. J Neurochem 137, 394–408 (2016). [DOI] [PubMed] [Google Scholar]
- 71.McKeith IG, Galasko D, Kosaka K, Perry EK, Dickson DW, Hansen LA, Salmon DP, Lowe J, Mirra SS, Byrne EJ, Lennox G, Quinn NP, Edwardson JA, Ince PG, Bergeron C, Burns A, Miller BL, Lovestone S, Collerton D, Jansen EN, Ballard C, de Vos RA, Wilcock GK, Jellinger KA, Perry RH, Consensus guidelines for the clinical and pathologic diagnosis of dementia with Lewy bodies (DLB): report of the consortium on DLB international workshop. Neurology 47, 1113–1124 (1996). [DOI] [PubMed] [Google Scholar]
- 72.Atashrazm F, Dzamko N, LRRK2 inhibitors and their potential in the treatment of Parkinson’s disease: current perspectives. Clin Pharmacol 8, 177–189 (2016). [DOI] [PMC free article] [PubMed] [Google Scholar]
- 73.Chesselet MF, Richter F, Zhu C, Magen I, Watson MB, Subramaniam SR, A progressive mouse model of Parkinson’s disease: the Thy1-aSyn (“Line 61”) mice. Neurotherapeutics 9, 297–314 (2012). [DOI] [PMC free article] [PubMed] [Google Scholar]
- 74.Parisiadou L, Xie C, Cho HJ, Lin X, Gu XL, Long CX, Lobbestael E, Baekelandt V, Taymans JM, Sun L, Cai H, Phosphorylation of ezrin/radixin/moesin proteins by LRRK2 promotes the rearrangement of actin cytoskeleton in neuronal morphogenesis. J Neurosci 29, 13971–13980 (2009). [DOI] [PMC free article] [PubMed] [Google Scholar]
- 75.Yue M, Hinkle KM, Davies P, Trushina E, Fiesel FC, Christenson TA, Schroeder AS, Zhang L, Bowles E, Behrouz B, Lincoln SJ, Beevers JE, Milnerwood AJ, Kurti A, McLean PJ, Fryer JD, Springer W, Dickson DW, Farrer MJ, Melrose HL, Progressive dopaminergic alterations and mitochondrial abnormalities in LRRK2 G2019S knock-in mice. Neurobiol Dis 78, 172–195 (2015). [DOI] [PMC free article] [PubMed] [Google Scholar]
- 76.Lee HJ, Suk JE, Patrick C, Bae EJ, Cho JH, Rho S, Hwang D, Masliah E, Lee SJ, Direct transfer of alpha-synuclein from neuron to astroglia causes inflammatory responses in synucleinopathies. J Biol Chem 285, 9262–9272 (2010). [DOI] [PMC free article] [PubMed] [Google Scholar]
- 77.Kim C, Cho ED, Kim HK, You S, Lee HJ, Hwang D, Lee SJ, beta1-integrin-dependent migration of microglia in response to neuron-released alpha-synuclein. Exp Mol Med 46, e91 (2014). [DOI] [PMC free article] [PubMed] [Google Scholar]
- 78.Kim C, Ho DH, Suk JE, You S, Michael S, Kang J, Joong Lee S, Masliah E, Hwang D, Lee HJ, Lee SJ, Neuron-released oligomeric alpha-synuclein is an endogenous agonist of TLR2 for paracrine activation of microglia. Nat Commun 4, 1562 (2013). [DOI] [PMC free article] [PubMed] [Google Scholar]
- 79.Kim C, Lee HJ, Masliah E, Lee SJ, Non-cell-autonomous Neurotoxicity of alpha-synuclein Through Microglial Toll-like Receptor 2. Exp Neurobiol 25, 113–119 (2016). [DOI] [PMC free article] [PubMed] [Google Scholar]
- 80.Floden AM, Combs CK, Microglia repetitively isolated from in vitro mixed glial cultures retain their initial phenotype. J Neurosci Methods 164, 218–224 (2007). [DOI] [PMC free article] [PubMed] [Google Scholar]
- 81.Huang da W, Sherman BT, Lempicki RA, Systematic and integrative analysis of large gene lists using DAVID bioinformatics resources. Nat Protoc 4, 44–57 (2009). [DOI] [PubMed] [Google Scholar]
- 82.Stark C, Breitkreutz BJ, Reguly T, Boucher L, Breitkreutz A, Tyers M, BioGRID: a general repository for interaction datasets. Nucleic Acids Res 34, D535–539 (2006). [DOI] [PMC free article] [PubMed] [Google Scholar]
- 83.Salwinski L, Miller CS, Smith AJ, Pettit FK, Bowie JU, Eisenberg D, The Database of Interacting Proteins: 2004 update. Nucleic Acids Res 32, D449–451 (2004). [DOI] [PMC free article] [PubMed] [Google Scholar]
- 84.Patil A, Nakai K, Nakamura H, HitPredict: a database of quality assessed protein-protein interactions in nine species. Nucleic Acids Res 39, D744–749 (2011). [DOI] [PMC free article] [PubMed] [Google Scholar]
- 85.Orchard S, Ammari M, Aranda B, Breuza L, Briganti L, Broackes-Carter F, Campbell NH, Chavali G, Chen C, del-Toro N, Duesbury M, Dumousseau M, Galeota E, Hinz U, Iannuccelli M, Jagannathan S, Jimenez R, Khadake J, Lagreid A, Licata L, Lovering RC, Meldal B, Melidoni AN, Milagros M, Peluso D, Perfetto L, Porras P, Raghunath A, Ricard-Blum S, Roechert B, Stutz A, Tognolli M, van Roey K, Cesareni G, Hermjakob H, The MIntAct project--IntAct as a common curation platform for 11 molecular interaction databases. Nucleic Acids Res 42, D358–363 (2014). [DOI] [PMC free article] [PubMed] [Google Scholar]
- 86.Licata L, Briganti L, Peluso D, Perfetto L, Iannuccelli M, Galeota E, Sacco F, Palma A, Nardozza AP, Santonico E, Castagnoli L, Cesareni G, MINT, the molecular interaction database: 2012 update. Nucleic Acids Res 40, D857–861 (2012). [DOI] [PMC free article] [PubMed] [Google Scholar]
- 87.Szklarczyk D, Franceschini A, Wyder S, Forslund K, Heller D, Huerta-Cepas J, Simonovic M, Roth A, Santos A, Tsafou KP, Kuhn M, Bork P, Jensen LJ, von Mering C, STRING v10: protein-protein interaction networks, integrated over the tree of life. Nucleic Acids Res 43, D447–452 (2015). [DOI] [PMC free article] [PubMed] [Google Scholar]
- 88.Zhao F, Xuan Z, Liu L, Zhang MQ, TRED: a Transcriptional Regulatory Element Database and a platform for in silico gene regulation studies. Nucleic Acids Res 33, D103–107 (2005). [DOI] [PMC free article] [PubMed] [Google Scholar]
- 89.Severin J, Waterhouse AM, Kawaji H, Lassmann T, van Nimwegen E, Balwierz PJ, de Hoon MJ, Hume DA, Carninci P, Hayashizaki Y, Suzuki H, Daub CO, Forrest AR, FANTOM4 EdgeExpressDB: an integrated database of promoters, genes, microRNAs, expression dynamics and regulatory interactions. Genome Biol 10, R39 (2009). [DOI] [PMC free article] [PubMed] [Google Scholar]
- 90.Subramanian A, Tamayo P, Mootha VK, Mukherjee S, Ebert BL, Gillette MA, Paulovich A, Pomeroy SL, Golub TR, Lander ES, Mesirov JP, Gene set enrichment analysis: a knowledge-based approach for interpreting genome-wide expression profiles. Proc Natl Acad Sci U S A 102, 15545–15550 (2005). [DOI] [PMC free article] [PubMed] [Google Scholar]
- 91.Linhart C, Halperin Y, Shamir R, Transcription factor and microRNA motif discovery: the Amadeus platform and a compendium of metazoan target sets. Genome Res 18, 1180–1189 (2008). [DOI] [PMC free article] [PubMed] [Google Scholar]
- 92.Ryu T, Jung J, Lee S, Nam HJ, Hong SW, Yoo JW, Lee DK, Lee D, bZIPDB: a database of regulatory information for human bZIP transcription factors. BMC Genomics 8, 136 (2007). [DOI] [PMC free article] [PubMed] [Google Scholar]
- 93.Griffith OL, Montgomery SB, Bernier B, Chu B, Kasaian K, Aerts S, Mahony S, Sleumer MC, Bilenky M, Haeussler M, Griffith M, Gallo SM, Giardine B, Hooghe B, Van Loo P, Blanco E, Ticoll A, Lithwick S, Portales-Casamar E, Donaldson IJ, Robertson G, Wadelius C, De Bleser P, Vlieghe D, Halfon MS, Wasserman W, Hardison R, Bergman CM, Jones SJ, Open Regulatory Annotation C, ORegAnno: an open-access community-driven resource for regulatory annotation. Nucleic Acids Res 36, D107–113 (2008). [DOI] [PMC free article] [PubMed] [Google Scholar]
- 94.Shannon P, Markiel A, Ozier O, Baliga NS, Wang JT, Ramage D, Amin N, Schwikowski B, Ideker T, Cytoscape: a software environment for integrated models of biomolecular interaction networks. Genome Res 13, 2498–2504 (2003). [DOI] [PMC free article] [PubMed] [Google Scholar]
- 95.Ogata H, Goto S, Sato K, Fujibuchi W, Bono H, Kanehisa M, KEGG: Kyoto Encyclopedia of Genes and Genomes. Nucleic Acids Res 27, 29–34 (1999). [DOI] [PMC free article] [PubMed] [Google Scholar]
- 96.Zhang Y, I-TASSER server for protein 3D structure prediction. BMC Bioinformatics 9, 40 (2008). [DOI] [PMC free article] [PubMed] [Google Scholar]
- 97.Roy A, Kucukural A, Zhang Y, I-TASSER: a unified platform for automated protein structure and function prediction. Nat Protoc 5, 725–738 (2010). [DOI] [PMC free article] [PubMed] [Google Scholar]
- 98.Yang J, Yan R, Roy A, Xu D, Poisson J, Zhang Y, The I-TASSER Suite: protein structure and function prediction. Nat Methods 12, 7–8 (2015). [DOI] [PMC free article] [PubMed] [Google Scholar]
- 99.Giffin MJ, Stroud JC, Bates DL, von Koenig KD, Hardin J, Chen L, Structure of NFAT1 bound as a dimer to the HIV-1 LTR kappa B element. Nat Struct Biol 10, 800–806 (2003). [DOI] [PubMed] [Google Scholar]
- 100.Stroud JC, Chen L, Structure of NFAT bound to DNA as a monomer. J Mol Biol 334, 1009–1022 (2003). [DOI] [PubMed] [Google Scholar]
- 101.Gilsbach BK, Ho FY, Vetter IR, van Haastert PJ, Wittinghofer A, Kortholt A, Roco kinase structures give insights into the mechanism of Parkinson disease-related leucine-rich-repeat kinase 2 mutations. Proc Natl Acad Sci U S A 109, 10322–10327 (2012). [DOI] [PMC free article] [PubMed] [Google Scholar]
Associated Data
This section collects any data citations, data availability statements, or supplementary materials included in this article.