

Abstract
Background:
Higher problem severity contraindicates moderation drinking in treatment samples, but has not been well investigated in natural recovery samples with more prevalent moderation outcomes, nor have single studies assessed multiple severity indicators. Therefore, we integrated five prospective studies of recent natural recovery attempts to identify multi-indicator profiles that distinguished moderation from abstinence or unstable resolution involving relapse. The study evaluated whether moderation was distinguished by a generalized lower severity profile, or whether more complex profiles better differentiated outcomes.
Methods:
Community-dwelling problem drinkers in the Southeastern U.S. (N = 616, 67% male, 65% white, mean age = 46.5 years) enrolled soon after stopping alcohol misuse without treatment were followed prospectively for a year. Outcome predictors assessed at enrollment included pre-resolution drinking practices, alcohol-related problems, alcohol dependence, and a behavioral economic measure of the reward value of drinking based on pre-resolution spending on alcohol vs. saving for the future.
Results:
Latent profile analysis of severity indicators supported a four-profile solution: (1) global low risk on all indicators, (2) global high risk on all indicators, (3) high risk limited to drinking practices only, and (4) high risk limited to alcohol dependence and alcohol-related problems only. Outcomes differed by profile membership (p < .01). Multinomial logistic regression analyses showed that the global low risk and heavy drinking risk only profiles were associated with stable moderation during the one-year follow-up. The high dependence-alcohol problems risk profile was associated with both abstinence and relapse during the follow-up (ps < .05).
Conclusions:
Consistent with prior research, moderation was associated with lower alcohol dependence, problems, and reward value. Participants who simply drank heavily and did not have elevated risk on other indicators also had a higher probability of moderation. Results support using multi-dimensional severity indicators that encompass functional variables in addition to drinking practices to predict outcomes.
Keywords: Natural Recovery, Drinking Problem Severity, Moderation, Behavioral Economics, Latent Profile Analysis
Fifty years of research has firmly established that alcohol use disorders (AUD) range from mild to severe, recoveries occur with and without alcohol-focused interventions, and abstinence and low-risk (moderation) drinking are both favorable outcomes, with the latter being more common among “natural” than treatment-assisted recovery (Fan et al., 2019; Institute of Medicine, 1990; Miller and Munoz, 2013; Sobell et al., 1996). In response, abstinence-oriented treatments for alcohol dependent drinkers have been supplemented with less intensive brief interventions and population-based public health interventions for the majority with less severe problems who do not seek or require specialty treatment and for whom moderation often is an appealing and more attainable goal (Kazemi et al., 2017; Miller and Rollnick, 2012; Sobell and Sobell, 2005; Tucker and Simpson, 2011; United Nations Office on Drugs and Crime, 2017).
Accommodating this heterogeneity in problem severity and recovery options requires sound empirical bases to predict which persons with AUD should pursue abstinence or are likely to maintain moderation. Although somewhat mixed, alcohol treatment outcome studies found moderation to be associated with lower problem severity assessed in different ways in different studies, including lower alcohol dependence, fewer alcohol-related life-health problems, and shorter problem duration or younger age, which tend to be confounded (Heather et al., 2009; Miller and Munoz, 2013; Rosenberg, 2004). Associations with quantity-frequency measures of drinking practices before a recovery attempt and with demographic variables other than age were less consistent (e.g., Witkiewitz et al., 2017).
These relationships have not been well investigated among persons with AUD who attempted natural recovery, even though moderation is a relatively more common outcome in untreated samples, in part because treatment-seeking is associated with higher problem severity (Fan et al., 2019; Tucker et al., 2004a), and most treatment programs emphasize abstinence. Therefore, in five prospective studies of natural recovery attempts guided by behavioral economics (Tucker et al., 2002, 2006, 2008, 2012, 2016), we investigated moderation predictors and replicated the support found in treatment studies for lower alcohol dependence and alcohol-related problems. We also developed and assessed a novel temporally sensitive behavioral economic measure of the reward value of drinking in relation to non-drinking commodities, the “Alcohol-Savings Discretionary Expenditure” (ASDE) index. Behavioral economics views substance misuse as a “reinforcement pathology” or pattern of intertemporal choice that involves persistent preference for short-term rewards that lead to longer term costs and a devaluation of larger, delayed rewards that support adaptive functioning (Bickel et al., 2014; Vuchinich and Tucker, 1998). Accordingly, the ASDE index assessed relative monetary allocation to purchasing alcohol vs. saving for the future prior to a natural recovery attempt. Even when drinking heavily, problem drinkers with more balanced ASDE indices – indicative of greater proportional savings and thus greater sensitivity to longer-term contingencies – were more successful in maintaining moderation than those with less balanced indices (Tucker et al., 2009, 2016).
Despite these advances in predicting moderation, multiple problem severity indicators have not been systematically investigated together to identify drinker profiles that may differentiate recovery outcomes, with emphasis on moderation. Such multi-indicator profiles may aid outcome prediction and ascertain the relative utility of different measures in supporting prognostic judgments and setting drinking goals. Recent treatment studies by Witkiewtiz and colleagues (Wilson et al., 2016; Witkiewitz, Wilson et al., 2019) found latent profile analysis (LPA) useful for modeling heterogeneity in AUD severity and outcomes based on multiple indicators of alcohol problems, life-health functioning, and drinking practices. Their LPA results questioned the field’s normative reliance on drinking practices to establish problem severity and treatment success or failure (Falk et al., 2019), and some outcome profiles indicated improved functioning and reduced alcohol-related problems without substantial reductions in consumption.
The present study evaluated whether multiple problem severity indicators formed distinctive latent profiles that predicted moderation versus other outcomes among community-dwelling problem drinkers (N = 616) attempting natural recovery. We integrated our five natural recovery studies to obtain sufficiently large groups of drinkers who achieved stable moderation and other outcomes to address the research questions. LPA was used to identify profiles with distinct patterns based on pre-resolution drinking practices, alcohol dependence, alcohol-related problems, and the reward value of drinking. Latent profile membership was used to predict drinking outcomes a year after initial cessation of alcohol misuse. The study evaluated whether moderation was distinguished by a generalized lower severity profile, wherein each indicator added linearly to relapse risk, or whether more complex profiles better differentiated outcomes. Such information would advance empirical bases for setting drinking goals beyond the conventional wisdom that higher problem severity, generally defined, is a contraindication for moderation.
MATERIALS AND METHODS
Sample Selection and Characteristics
Media advertisements in cities in Alabama, Florida, Georgia, Mississippi, and Tennessee sought research volunteers who had recently overcome a drinking problem on their own for five prospective studies of recovery attempts conducted from 1993 to 2015 (Tucker et al., 2002, 2006, 2008, 2012, 2016). One of these five studies (Tucker et al., 2006) also recruited a subsample who had received treatment or AA; resolution stability did not differ as a function of help-seeking status. Respondents were screened using the Michigan Alcoholism Screening Test (MAST; Selzer, 1971), Alcohol Dependence Scale (ADS; Skinner and Horn, 1984), and Drinking Problems Scale (DPS; Cahalan, 1970). Study procedures were consistent with STROBE guidelines for observational studies (von Elm et al., 2007), and each received university Institutional Review Board approval and a U.S. federal Certificate of Confidentiality.
Eligibility criteria in all studies included: (a) legal drinking age (≥ 21 years); (b) problem drinking history ≥ 2 years based on participant screening reports of the year when drinking first became a problem (e.g., marriage, family, job, legal, or health problems) (M = 16.6 years, SD = 11.1), followed by detailed assessment at enrollment of alcohol-related problems, alcohol dependence levels, and pre-resolution drinking practices; (c) no current other drug misuse (except nicotine), assessed during screening by asking if participants had “used non-prescribed or prescribed drugs except for reasons related to health problems or health maintenance as directed by a physician” and, if yes, the drug(s), dates of use, usual amount and pattern of use, and current use status (yes/no); and (d) recent cessation of high-risk drinking while residing in the community (M = 14.5 weeks resolved, SD = 8.91). Depending on the study, participants had abstained or drank in a non-problem manner for a minimum of 3 weeks and a maximum of 6 months, defined as (a) abstinence or low-risk drinking (< 4 standard drinks/day for men, < 3 drinks/day for women; National Institute on Alcohol and Alcoholism [NIAAA], 2005), (b) no alcohol-related negative consequences (DPS), and (c) no dependence symptoms (ADS). Given our focus on predicting natural recovery success, we required an outcome distribution at follow-up with many stable abstinent or moderation recoveries; thus, participants were deliberately recruited who had had some initial success in abstaining or drinking moderately because, if enrolled soon after resolution onset, relapse rates would have been too high for our research purposes. The first day participants stopped alcohol misuse was their resolution date, either resolved abstinent (RA) or resolved non-abstinent (RNA) (Sobell et al., 1996). Most participants were intervention naïve (69.0%); 17.6% had attended Alcoholics Anonymous (AA) only, and 13.5% had attended alcohol treatment plus AA at some point before their recent quit attempt. All studies had at least a 1-year follow-up assessment, the basis for establishing drinking outcomes. Although not required, almost everyone (99.4%) fulfilled alcohol dependence criteria (American Psychiatric Association, 1994, 2000).
Table 1 presents characteristics of the integrated “Alcohol Recovery in Community” (ARC) sample comprising all five studies as a function of 1-year outcomes (N = 616). Like most natural recovery samples (Klingemann and Sobell, 2007), participants were on average middle-aged, middle-income, and educated beyond high school. Gender composition approximated the U.S. problem drinker population (67% male), and race/ethnicity composition approximated the southeast U.S. region where the research occurred (65% White; 32% African American; < 1.2% each Hispanic, Asian/Pacific Islander, Native American, or other race/ethnicity).
Table 1.
Sample Characteristics as a Function of Drinking Status at 1-year after Initial Resolution
| Drinking Status at 1-year after Initial Resolution |
|||||
|---|---|---|---|---|---|
| Variable | Resolved Abstinent (n = 273) | Unstable Resolution (n = 140) | Resolved non-abstinent (n = 80) | Missing Outcome (n = 123) | Test statistic |
| Demographic characteristics | |||||
| Male, n (%) | 181 (66.79) | 93 (66.91) | 57 (71.25) | 82 (67.21) | χ2(3) = 0.60 |
| Female, n (%) | 90 (33.21) | 46 (33.09) | 23 (28.75) | 40 (32.79) | |
| White, n (%) | 178 (65.93) | 86 (62.32) | 57 (71.25) | 75 (61.48) | χ2(3) = 2.57 |
| Other race/ethnicity, n (%) | 92 (34.07) | 52 (37.68) | 23 (28.75) | 47 (38.52) | |
| Married, n (%) | 107 (40.07)a | 47 (34.56)ab | 41 (51.25)ac | 39 (32.23)ab | χ2(3) = 8.64* |
| Not Married, n (%) | 160 (59.93) | 89 (65.44) | 39 (48.75) | 82 (67.77) | |
| Employed full/part time, n (%) | 121 (45.32) | 63 (46.32) | 42 (52.50) | 59 (49.58) | χ2(3) = 1.59 |
| Unemployed, n (%) | 146 (54.68) | 73 (53.68) | 38 (47.50) | 60 (50.52) | |
| Age (years) | 46.49 (10.75)a | 47.19 (11.87)a | 51.18 (14.09)b | 42.70 (11.75)c | F(3,608) = 12.23*** |
| Education (years) | 13.82 (2.75)a | 14.37 (2.96)a | 14.76 (2.31)ab | 13.63 (2.20)ac | F(3,596) = 4.21** |
| Drinking problem history | |||||
| Help-seeking history (AA or treatment), n (%) | 49 (40.83)a | 22 (40.74)b | 4 (13.79)c | 15 (42.86)b | χ2(3) = 8.16** |
| Drinking problem duration (years) | 17.09 (10.88) | 17.64 (11.45) | 16.11 (12.21) | 14.85 (10.52) | F(3,589) = 1.57 |
| Alcohol Dependence Scale (47) | 21.64 (9.58)a | 18.52 (8.62)b | 16.49 (8.50)b | 19.69 (9.74)ab | F(3,597) = 7.75*** |
| Drinking Problems Scale (40) | 18.25 (8.90)a | 16.44 (8.66)ab | 13.79 (8.30)b | 18.73 (8.72)a | F(3,606) = 6.91*** |
| Pre-resolution year drinking practices (TLFB) | |||||
| Number of heavy drinking days (0-365) | 246.67 (124.63)a | 197.76 (120.27)b | 210.94 (144.99)ab | 242.04 (125.44)a | F(3,607) =5.79*** |
| Mean quantity per drinking day (ml ethanol) | 229.34 (196.93)a | 172.49 (120.71)bc | 137.36 (90.37)b | 226.60 (145.70)ac | F(3,608) = 9.42*** |
| Pre-resolution year monetary allocation | |||||
| Total income ($) | 53,559 (70,612) | 62,657 (87,736) | 66,535 (66,810) | 55,389 (80,714) | F(3,597) = 0.85 |
| Total expenditures ($) | 52,628 (56,683) | 55,970 (61,677) | 68,326 (52,228) | 53,306 (59,890) | F(3,596) = 1.57 |
| Discretionary expenditures (DE $) | 15,953 (15,229) | 16,468 (14,959) | 17,023 (12,447) | 15,833 (15,279) | F(3,596) = 0.14 |
| Expenditures on alcohol ($) | 3,758 (3,812) | 3,055 (2,763) | 2,690 (3,026) | 3,730 (4,585) | F(3,606) = 2.22 |
| Money saved ($) | 1,664 (5,466) | 1,225 (4,400) | 1,784 (4,670) | 1,463 (3,900) | F(3,597) = 0.26 |
| Alcohol/Savings DE index | 0.24 (0.28)a | 0.21 (0.29)a | 0.14 (0.31)ab | 0.26 (0.28)ac | F(3,596) = 3.13* |
Table shows means (standard deviations) for continuous variables and frequencies (percentages) for categorical variables (N = 584). Percentages reflect non-missing cases in each categorical variable. Possible score ranges for scaled questionnaires are given in parentheses after the variable name. Higher Drinking Problems Scale scores indicate greater alcohol-related problems; higher Alcohol Dependence Scale scores indicate greater alcohol dependence levels. TLFB = time-line follow-back interview. Heavy drinking days: > 4 drinks for women and > 5 drinks for men. ASDE values could range from 1.0 to −1.0 [1.0 = all discretionary expenditures (DE) for alcoholic beverages; −1.0 = all DE were for saving money; 0 = equal proportions of DE for alcohol and savings). Monetary variables were inflation-adjusted based on national data on personal consumption expenditures provided by the U.S. Bureau of Economic Analysis (https://apps.bea.gov/iTable/iTable.cfm?ReqID=19&step=2#reqid=19&step=2&isuri=1&1921=underlying). Means and frequencies with different superscripts were significantly different in pairwise comparisons.
p < .05,
p < .01,
p < .001
Procedures
In-person 1.5- to 3.0-hour assessments were conducted at enrollment and 12 months later, and participants were compensated from $30 to $75 for each assessment, with the amounts increasing over the 22-year data collection period spanned by the five studies. Sobriety was verified by breathalyzer (Studies 1-3: Alco-Sensor III, Intoximeters, Inc., St. Louis, MO; Studies 4-5: Lifeloc FC20, Wheat Ridge, CO). With participants’ consent, at least one collateral (e.g., spouse) was interviewed by phone for 69.7% of participants to verify eligibility and/or post-resolution drinking reports. Internal reliability checks were conducted when collaterals were unavailable; i.e., participant screening reports collected by phone or questionnaire were compared with more detailed initial interview reports regarding study eligibility criteria, and multiple follow-up reports of drinking status that pertained to the same time periods were compared for consistency. Cases with unreliable reports were excluded (< 1%). An expanded Timeline Followback (TLFB) interview (Sobell and Sobell, 1992; Vuchinich et al., 1988) conducted at both data collection points assessed drinking practices, income, and expenditures covering the preceding year, which generated detailed behavioral records covering the two years surrounding sobriety onset. Select studies also included Interactive Voice Response data collection (Tucker et al., 2008, 2012, 2016) and had longer (Tucker et al., 2002, 2006) or more frequent (e.g., quarterly) follow-ups (2008, 2012, 2016). Measures are described next and in earlier publications.
Pre-resolution Drinking Problem Severity Measures
Drinking practices.
Participants reported daily drinking as ounces of beer, wine, and liquor intake using standard TLFB procedures (Sobell and Sobell, 1992). Reports were converted to ml of 190-proof ethanol for analysis. Number of pre-resolution heavy drinking days during the pre-resolution year that exceeded NIAAA (2015) binge drinking thresholds (4+/5+ drinks for women/men) were used for analysis. The TLFB interview yields reliable and accurate drinking reports (Tucker et al., 2002, 2007; Witkiewitz et al., 2015).
Alcohol-related problems and alcohol dependence.
An expanded 40-item Drinking Practices Scale (DPS; Vuchinich and Tucker, 1996) assessed problems in eight life-health areas often disrupted by heavy drinking (social, family, and intimate relations; financial status; vocational functioning; legal; residence; physical health). Scores ranged from 0 to 5 for each area and from 0 to 40 total, with higher scores indicating greater problems. The DPS has good predictive validity for treatment (Vuchinich and Tucker, 1996) and natural recovery (Tucker et al., 2006) outcomes. The 25-item Alcohol Dependence Scale (ADS; Skinner and Horn, 1984) assessed alcohol dependence indicators (e.g., tolerance, withdrawal symptoms); scores ranged from 0 to 47, reflecting mild to severe dependence. The ADS has high internal consistency and concurrent, convergent, and discriminant validity (Doyle and Donovan, 2009). ARC sample Cronbach’s alpha coefficients for the DPS and ADS were 0.93 and 0.89, respectively, indicating excellent scale reliability.
ASDE index.
The relative amount of resource (money in this case) allocated to obtain a given commodity compared to allocations to other available commodities reflects its reward value (Rachlin et al., 1981). Using an expanded TLFB format (Vuchinich et al., 1988), participants reported their spending in dollars on alcohol and other commodities for each day a purchase occurred during the preceding year. TLFB spending reports have been verified through comparisons with financial records (Tucker et al., 2002, 2006; Vuchinich and Tucker, 1996). Reports in each spending category were summed for the pre-resolution year to obtain totals for analysis. Spending on essential, ongoing, and largely fixed costs of living (e.g., housing, food, medical care, transportation, insurance) were classified as obligatory expenditures. Less essential commodities typically purchased intermittently (entertainment, recreation, alcohol, tobacco, other consumable goods, gifts, money saved voluntarily) were classified as discretionary expenditures (DE). Because DE are where shifts in strength of preference for alcohol over time should be more readily apparent, the ASDE index was calculated as the proportion of DE spent on drinking minus the proportion of DE put into savings. Values could range from −1.0 to + 1.0; higher scores indicate proportionally more spending on alcohol and less on savings.
Drinking Status at 1 Year
Participants with 1-year follow-up data were conservatively classified into mutually exclusive outcome status groups based on their drinking practices and problems during the entire preceding year: (1) Resolved Abstinent (RA—continuous abstinence, n = 273), (2) Resolved Non-abstinent (RNA—lower risk drinking only, no relapses or alcohol-related problems; n = 80), and (3) Unstable Resolution (UR—1 or more relapses defined as daily drinking in excess of NIAAA heavy drinking thresholds [4+/5+ drinks for women/men], n = 140). The 1-year drinking status of 123 initially enrolled participants was unknown because they either withdrew early (n = 20), died (5), or did not keep follow-up appointments (98). Participants lost to follow-up (20% of the enrolled sample of 616) generally had similar characteristics to the UR and RA groups on problem severity indicators and help-seeking history. The RNA and UR groups showed good separation in post-resolution drinking within or above low-risk drinking guidelines (NIAAA, 2005), respectively. Men and women in the RNA group consumed on average about 2.25 (39.84 ml) and 1.98 (35.15 ml) standard drinks per drinking day, respectively, whereas men and women in the UR group consumed on average about 6.66 (118.15 ml) and 5.91 (104.87 ml) drinks per drinking day, respectively.
Data Analyses
Sample checks were performed prior to analysis. First, we examined demographic and drinking history characteristics to identify sources of heterogeneity across studies and control for their potential influence as nuisance factors in the integrated dataset (Curran and Hussong, 2009). Measurement harmonization was unnecessary because the same research team conducted all studies using identical measures, selection criteria, and follow-up procedures in the same geographic region.
Data analyses were performed in two steps. First, LPA was conducted using the 3-step approach in Mplus version 8 (Muthén and Muthén, 1998-2017) to identify profiles showing distinctive patterns based on the four severity indicators (heavy drinking days, DPS, ADS, ASDE) and to examine if these profiles predicted 1-year drinking outcomes. In identifying latent profile classes, we included all the participants who provided data on profile indicators regardless of whether they had a missing value on their post-resolution drinking status in order to capture the pre-resolution patterns of severity indicators in the entire sample attempting natural recovery. Steps 1 and 2 of the 3-step approach were conducted using the automatic approach by specifying the AUXILIARY statement with R3STEP. Step 3 included 1-year drinking status as the distal outcome, and we confirmed that class membership did not change from previous steps. Variables that differed significantly across studies (age, gender, race [white/non-white], and help-seeking status [any/none]), were used as covariates in the LPA. Due to varying measurement units and ranges, problem indicators were standardized to make the standard deviation for each variable the scale unit. All LPA models used MLR in Mplus, a robust maximum likelihood estimator, for parameter estimates and a sandwich estimator for standard errors to handle potential impact of clustering of participants within studies. When needed, missing data adjustment was also handled in MLR estimator. The number of profiles was determined based on model fit statistics, classification precision (entropy), and interpretability (see Table 2).
Table 2.
Model fit statistics for latent profile analysis (LPA)
| LPA Solutions | Fit Statistics | ||||
|---|---|---|---|---|---|
| AIC | Sample Adjusted BIC | Entropy | VLMR LRT | BLRT | |
| 2 profiles | 6562.063 | 6578.293 | .732 | p < .001 | p < .001 |
| 3 profiles | 6391.450 | 6413.922 | .804 | p < .001 | p < .001 |
| 4 profiles | 6238.075 | 6266.789 | .820 | p < .01 | p < .001 |
| 5 profiles | 6159.996 | 6194.952 | .837 | p < .01 | p < .001 |
| 6 profiles | 6095.662 | 6136.860 | .868 | p = .5646 | p = .5666 |
Note. AIC: Akaike Information Criteria. Sample Adjusted BIC (Bayesian Information Criteria); Lower values indicate better model fit. Entropy: Indication of good separation of classes; .8+ is considered good. VLMR LRT: Vuong-Lo-Mendell-Rubin Likelihood Ratio Test; H0: k-1 vs. k classes, significant results indicate that k class-solution fit the data better than k-1 class solution. BLRT: Bootstrapped Likelihood Ratio Test; H0: k-1 vs. k classes, significant results indicate that k class-solution fit the data better than k-1 class solution.
Latent profile membership was then used to predict 1-year drinking outcomes for the subset of participants with follow-up data (RA, RNA, or UR) in multinomial logistic regressions. The RNA group was the referent in comparisons with the RA or UR group. In this step, participants with a missing value on drinking status were excluded to eliminate potential prediction inaccuracy, as they had insufficient data on drinking patterns to assign their outcome status. Finally, the most likely latent profile membership saved from the LPA was used to examine indicator differences across profiles using one-way ANOVAs.
RESULTS
Latent Profile Analysis
Models with 2, 3, 4, 5, and 6 profiles were estimated, and the 4-profile solution was chosen. Table 2 presents the model fit statistics for each profile. Based on these statistics, as well as interpretability and class size, we selected the 4-class (profile) solution. The 4-profile solution showed lower AIC (6238.08) and sample-size adjusted BIC (6266.79) than the 3-profile solution, and the significant likelihood ratio tests (p < .05) suggested a better fit for the 4-profile model. Entropy for the 4-profile model was 0.82, indicating good classification precision (Curran and Hussong, 2009). Fit statistics were slightly better for the 5-profile solution, but values were not drastically different from the 4-profile solution, and the fifth profile in the 5-profile solution was similar to Profile 4 in the 4-profile solution and included only 8.8% of the sample, resulting in two similar classes with reduced sizes. The 6-profile solution did not differ from the 5-profile solution.
Figure 1 depicts the four estimated latent profiles using the means of standardized severity indicators. The final proportions, based on the most likely latent profile membership, were 28.1, 23.7, 34.1, and 14.1% for Profiles 1-4, respectively. Profiles 1 and 2 showed global lower or higher risk, respectively, across all severity indicators. Profiles 3 and 4 were mixed risk profiles; i.e., Profile 3 showed low dependence and alcohol problems with frequent heavy drinking, whereas Profile 4 showed high dependence and alcohol problems with infrequent heavy drinking. Both mixed risk profiles also showed lower risk close to zero on the standardized ASDE values (i.e., the mean level of the entire sample) used in the LPA. Thus, Profiles 1-4 were labeled as Global Low Risk, Global High Risk, Drinking Risk Only, and ADS-DPS Risk profiles.
Figure 1.
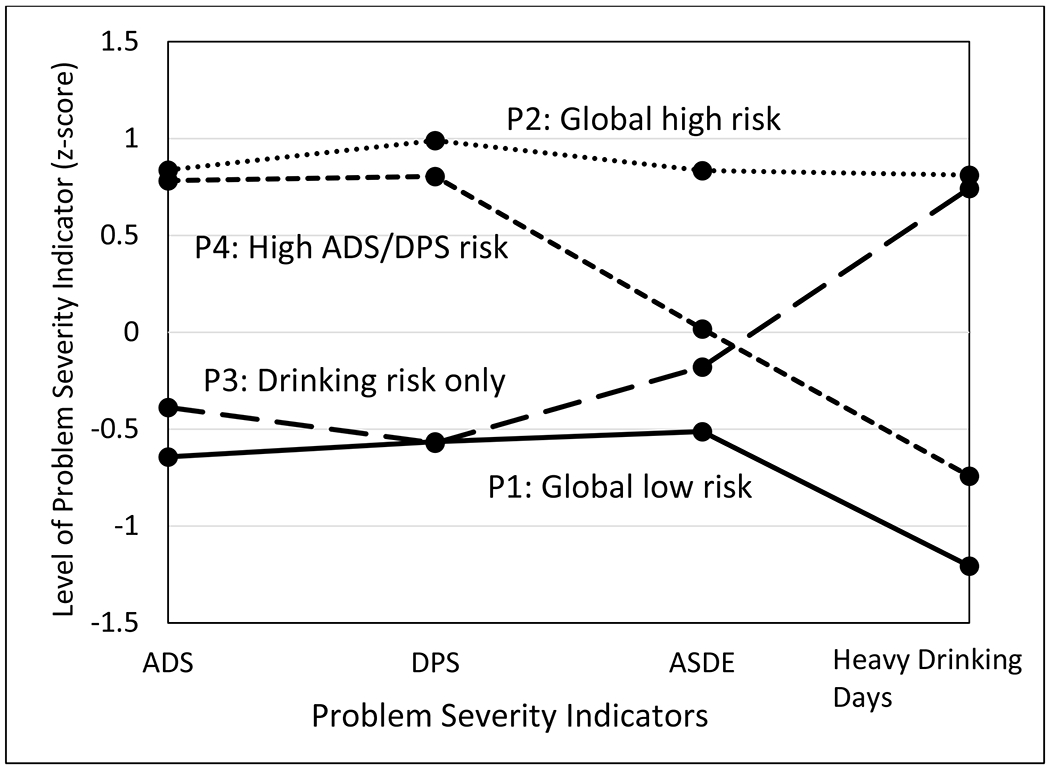
Standardized Mean Scores on Pre-resolution Alcohol Problem Severity Indicators by Latent Profiles. ADS = Alcohol Dependence Scale, with higher scores indicating greater level of alcohol dependence; DPS= Drinking Problems Scale, with higher scores indicting more severe problems across 8 life domains (i.e., intimate relations, family relations, social relations, vocational functioning, financial status, physical health, living arrangements, and legal status); ASDE = Alcohol-Savings Discretionary Expenditure, with higher scores representing proportionally more spending on alcohol and less on savings; Heavy drinking days = Gender-adjusted heavy drinking days during pre-resolution year (> 4 drinks/day for women; > 5 drinks/day for men).
Severity indicator comparisons across latent profiles supported the distinctiveness of the four profiles. Indicator means were all significantly different (ps < .001) except for five pairwise contrasts: Profiles 2 (Global High Risk) and 4 (ADS-DPS Risk) had similar high ADS and DPS means, Profiles 1 (Global Low Risk) and 3 (Drinking Risk Only) had similar low DPS means, Profiles 3 and 4 had similar ASDE means close to zero, and Profiles 2 and 3 had similar high heavy drinking day means. Note that the ASDE pairwise contrasts indicated that Profile 3 (Drinking Risk Only) was significantly lower than Profile 2 (Global High Risk), and Profile 4 (ADS-DPS Risk) was significantly higher than Profile 1 (Global Low Risk). Furthermore, because indicator levels lower than zero (i.e., the sample mean) reflect relatively lower risk, on three of four indicators (ADS, DPS, ASDE), two profiles (2 and 4: Global High and ADS-DPS Risks) were relatively higher risk (37.8% of final proportions combined) and two profiles (1 and 3: Global Low and Drinking Risk Only) were relatively lower risk (62.2% combined) compared to one another.
Relations between Latent Profiles and 1-year Drinking Status Outcomes
A χ2 test suggested the three outcome groups differed by profile membership (χ2 (6) = 15.99, p < .05). Multinomial logistic regressions examined this overall association by predicting drinking outcomes using RNA as the referent. Table 3 presents the odds ratios (OR) and 95% confidence intervals (CI) of the RA and UR drinking outcome group belonging to each comparison profile compared to the RNA reference profile. Lower risk profiles were more likely to include participants with moderation outcomes (RNA) compared to abstinent (RA) or unstable resolution (UR). Specifically, compared to RNA participants, RA participants were more likely to belong to the Global High Risk profile (P2) than the Global Low Risk profile (P1) and were less likely to belong to the Drinking Risk Only profile (P3) than the Global High Risk profile (P2). Compared to RNA participants, RA participants were more likely to belong to the ADS-DPS Risk profile (P4) than the Global Low Risk profile (P1), and UR participants also were more likely to belong to the ADS-DPS Risk profile (P4) than the Drinking Risk Only profile (P3).
Table 3.
Odds ratios to belong to comparison profile vs. reference profile across drinking status groups
| Comparison Profile | Drinking Status Contrast | Reference Profile Odds Ratio (95% CI) | ||
|---|---|---|---|---|
| P1: Global Low Risks | P2: Global High Risks | P3: Drinking Risk Only | ||
| P2: Global High Risks | RA vs. RNA | 3.14 (1.33, 7.39)* | ||
| UR vs. RNA | 1.52 (.61, 3.82) | |||
| P3: Drinking Risk Only | RA vs. RNA | 1.11 (.58, 2.13) | .35 (.15, .83)* | |
| UR vs. RNA | .72 (.36, 1.44) | .47 (.18, 1.25) | ||
| P4: ADS-DPS Risks | RA vs. RNA | 4.45 (1.03, 19.34)* | 1.42 (.29, 6.89) | 4.01 (.93, 17.31) |
| UR vs. RNA | 3.32 (.71, 15.63) | 2.18 (.41, 11.57) | 4.62 (1.003, 21.26)* | |
Note: P = Profile. P1 and P3 are relatively lower risk profiles and P2 and P4 are relatively higher risk profiles in latent profile analysis (see Figure 1). RA = resolved abstinent; RNA = resolved non-abstinent; UR = unstable resolutions. RNA used as the referent. OR = odds ratio, CI = 95% confidence intervals.
p < .05.
If OR > 1.0, the RA or UR group was more likely to belong to the comparison profile than to the reference profile, compared to the RNA group; if OR < 1.0, the RNA group was more likely to belong to the comparison profile than the reference profile, compared to RA or UR.
DISCUSSION
Two latent profiles were distinctively associated with moderation outcomes compared to other outcome groups. Consistent with earlier research, moderation was associated with membership in the Global Low Risk profile (P1). But participants who simply drank heavily and did not have elevated risk on the other indicators assessed also had a higher probability of successful moderation. Indeed, the Drinking Risk Only profile (P3) captured more RNA participants than any other outcome status group, followed by the Global Low Risk profile (P1). These results suggest that lower drinking practices in isolation should not be used to predict moderation and, conversely, high drinking practices in isolation should not be used to predict poor outcomes or inability to moderate. Successful moderation during the post-resolution year was better ascertained based on lower alcohol dependence, fewer functional problems related to drinking, and favorable financial allocation patterns per the ASDE index.
Differences in relation to moderation outcomes were most apparent in profile comparisons with participants who were abstinent at follow-up. Compared to participants who maintained moderation, abstinent participants were more likely to belong to the Global High Risk (P2) than Global Low Risk (P1) profile and were less likely to belong to the Drinking Risk Only (P3) than Global High Risk profile. The two mixed risk profiles (P3 and P4) further distinguished resolved non-abstinent participants from those who abstained or had unstable resolutions involving relapse. Compared to participants who maintained moderation, those who remained abstinent were more likely to belong to the high ADS-DPS Risk than Global Low Risk profile, and those who relapsed were more likely to belong to the high ADS-DPS Risk than Drinking Risk Only profile. Participants lost to follow-up had similar higher risk levels on problem severity indicators, which is in line with clinical research suggesting that treatment drop-outs fare relatively poorly (e.g., Haug and Schaub, 2016). The present attrition rate was not markedly different from treatment outcome studies with similar follow-up periods.
Thus, participants who abstained or relapsed had similar higher risk levels based on alcohol dependence and alcohol-related problems compared to those who maintained stable moderation. Greater problem severity is an established clinical basis for an abstinent drinking goal, and the present untreated participants with higher problem severity either naturally self-selected and succeeded with abstinence, or they relapsed. Abstinence status in the context of AUD natural recovery thus may be a potential indicator of longer-term relapse risk, and successful abstinent recovery may be preceded by earlier failed attempts at low risk drinking. We explored this possibility using reports of participants’ longest duration of abstinence or low risk drinking prior to their current quit attempt, which we assessed in the two most recent ARC studies comprising about half of the total sample. Prior to their current quit attempt, participants as a whole had maintained low risk drinking (M = 814.83 days) longer than abstinence (M = 411.28 days), and this pattern favoring low risk drinking was much more pronounced for the current RA than UR or RNA outcome groups, which did not differ (Ms = 1244.85, 571.20, and 628.36 days, respectively; ps < .05). Duration of longest prior abstinence did not differentiate current outcomes. Very preliminarily, this raises the possibility that a sustained but ultimately failed low risk drinking attempt may precede abstinence at a subsequent quit attempt.
Taken together, these profile-outcome associations showed that participants with high global risks or risks limited to dependence and alcohol problems without relatively heavy drinking can achieve stable abstinence. However, high ADS-DPS risk also was associated with unstable resolution involving relapse. The shared similarities between abstinent and relapsed participants distinct from resolved non-abstinent participants is consistent with early theorizing (Marlatt, 1985) about the self-regulation processes involved in different drinking outcomes. Abstinence and relapse were considered opposite ends of the same dynamic behavioral regulation process, reflecting over- and under-control of the daily act of drinking, respectively, whereas moderation was considered a qualitatively different process involving lifestyle balance and repetitive choices to drink well within the boundaries of extreme restraint or loss-of-control drinking.
Several study qualifications merit future research: First, the relatively small number of studies (5) limited the applicability of more sophisticated techniques for data integration, such as multilevel modeling to model study level covariates separately (e.g., data collection year). Nevertheless, pre-analysis checks on study differences and statistical control for them in the LPA considerably reduced concerns about study heterogeneity. Second, LPA is an exploratory, data-driven approach that does not specify hypotheses about the number of profiles, and profile membership was determined probabilistically and is subject to misclassification. Even so, the four profiles appeared representative of the study sample, profile plots of all solutions showed four profiles with slight variations, and fit statistics supported visual inspection. Third, a single quantity-frequency measure of drinking practices was examined (heavy drinking days). Future research should investigate whether different temporal patterns of pre-resolution drinking frequency, quantity, and variability aid outcome prediction. Fourth, all participants had initiated a serious quit attempt, the majority were classified in lower risk Profiles 1 and 3, and, among those who relapsed, many later resumed abstinence or moderation. Whether results generalize to samples with more heterogeneous problem severity and motives for change (e.g., those in AUD treatment for different voluntary and non-voluntary reasons) remains to be determined. Fifth, the expanded TLFB assessment of drinking practices and monetary expenditures likely has limited utility in clinical settings in its present form. Brief measures of monetary allocation to alcohol or drugs have been developed and found to predict treatment outcomes (Murphy et al., 2015; Worley et al., 2015). Collectively, these findings support adding assessment of real spending on substances to established assessment procedures to predict outcomes of recovery attempts. Finally, the subset of participants who drank after initial resolution were conservatively classified in line with views about recovery and relapse when this research program was started. The unstable resolution group is therefore likely heterogeneous in ways that merit investigation in light of newer findings showing that some heavy drinkers previously considered treatment failures are improved and functioning well (e.g., Witkiewitz et al., 2019).
With these qualifications, the study contributed new knowledge about problem severity indicators that formed latent risk profiles and predicted moderation outcomes of natural recovery attempts. Successful moderation was associated with lower pre-resolution problem severity on all indicators as well as with pre-resolution risk limited to elevated heavy drinking only. Heterogeneity was observed in pre-resolution drinking practices, and drinking practices showed inconsistencies with other risk indicators and had limited utility in predicting outcomes. Functional indicators of alcohol problems, dependence, and reward value showed more consistent associations with different drinking outcomes, which is in line with treatment research indicating that functioning and wellbeing are important for establishing problem severity and designating outcomes as successful or unsuccessful (e.g., Pearson et al., 2016; Wilson et al., 2016; Witkiewitz et al., 2019). Together, this work suggests that investigation of multiple severity indicators, in addition to drinking practices, will improve prediction of moderation and other outcomes across the drinking problem severity spectrum.
Figure 2.
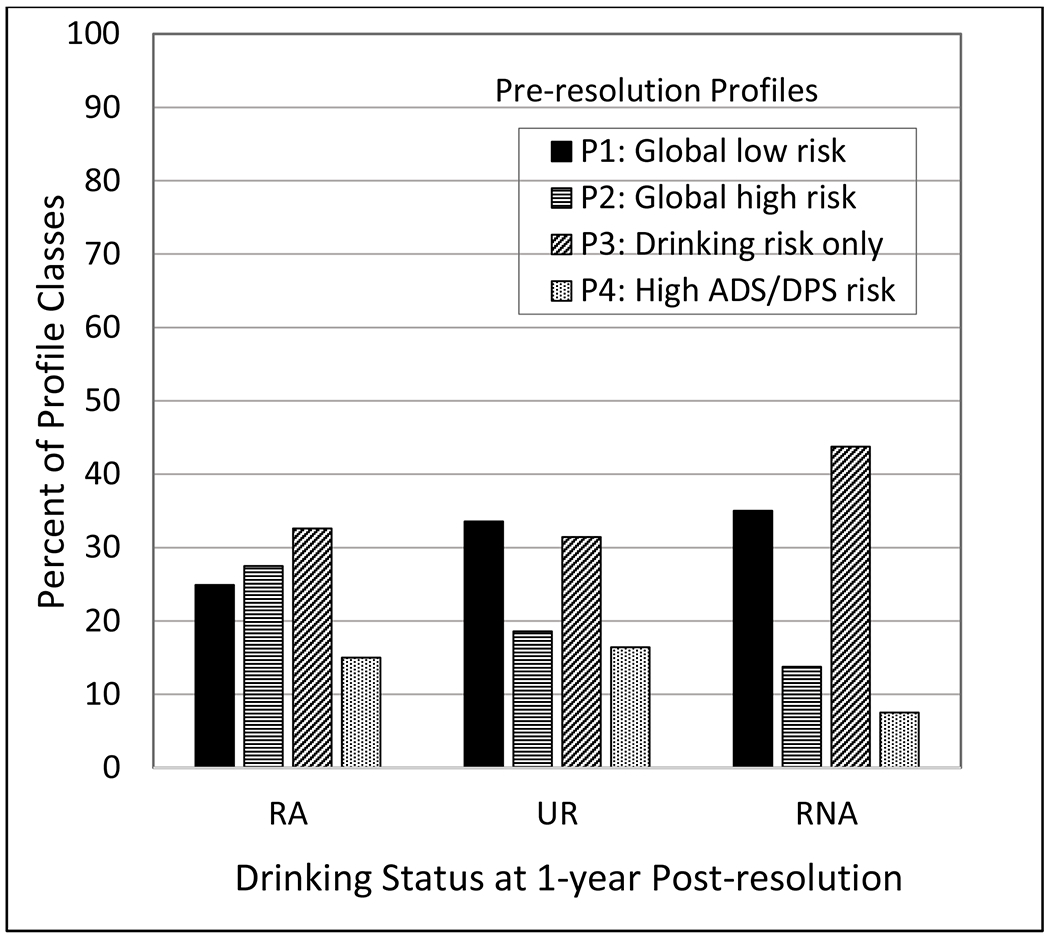
Composition of Pre-resolution Year Problem Severity Profiles across Drinking Status Outcomes at 1-year Post-resolution. RA = Resolved Abstinent; UR = Unstable Resolution; RNA = Resolved Non-Abstinent; Missing at 1-year follow-up.
ACKNOWLEDGMENTS:
This work was supported in part by NIH/NIAAA grants R01 AA08972, R01 AA017880, and R01 AA023657. The authors declare no conflicts of interest. All authors are affiliated with the Department of Health Education and Behavior and the Center for Behavioral Economic Health Research, University of Florida, Gainesville, FL. The authors thank Eun-Young Mun for her expert consultation on integrating the data sets used in this research, Akshay A. Sawant for performing inflation adjustments of monetary variables, and Katie Witkiewitz for her comments on an earlier manuscript version. Portions of the research were presented at the 2018 meeting of the American Psychological Association Collaborative Perspectives on Addiction conference, Tampa, FL.
REFERENCES
- American Psychiatric Association (1994) Diagnostic and Statistical Manual of Mental Disorders. 4th ed. American Psychiatric Association, Washington, DC. [Google Scholar]
- American Psychiatric Association (2004) Diagnostic and Statistical Manual of Mental Disorders. 4th ed, text rev. American Psychiatric Association, Washington, DC. [Google Scholar]
- Bickel WK, Johnson MW, Koffarnus MN, MacKillop J, Murphy JG (2014) The behavioral economics of substance use disorders: reinforcement pathologies and their repair. Annu Rev Clin Psychol 10:641–677. [DOI] [PMC free article] [PubMed] [Google Scholar]
- Cahalan D (1970) Problem Drinkers: A National Survey. Jossey-Bass, San Francisco. [Google Scholar]
- Curran PJ, Hussong AM (2009) Integrative data analysis: the simultaneous analysis of multiple data sets. Psychological Methods 14:81–100. [DOI] [PMC free article] [PubMed] [Google Scholar]
- Doyle SR, Donovan DM (2009). A validation study of the alcohol dependence scale. J Stud Alcohol Drugs 70:689–699. [DOI] [PMC free article] [PubMed] [Google Scholar]
- Falk D, Wang XQ, Liu L, Fertig J, Mattson M, Ryan M, Johnson B, Stout R, Litten RZ (2010) Percentage of subjects with no heavy drinking days: evaluation as an efficacy endpoint for alcohol clinical trials. Alcohol Clin Exp Res 34:2022–2034. [DOI] [PubMed] [Google Scholar]
- Fan AZ, Chou P, Zhang H, Jung J, Grant BF (2019) Prevalence and correlates of past year recovery from DSM-5 Alcohol Use Disorder: Results from the National Epidemiologic Survey on Alcohol and Related Conditions - III. Alcohol Clin Exp Res 43:2406–2420. [DOI] [PubMed] [Google Scholar]
- Haug S, Schaub MP (2016) Treatment outcome, treatment retention, and their predictors among clients of five outpatient alcohol treatment centres in Switzerland. BMC Public Health, 16:581. [DOI] [PMC free article] [PubMed] [Google Scholar]
- Heather N, Adamson SJ, Raistsrick D, Slegg GP on behalf of the UKATT Research Team (2010) Initial preference for drinking goal in the treatment of alcohol problems: I. baseline differences between abstinence and non-abstinence groups. Alcohol 45:128–135. [DOI] [PubMed] [Google Scholar]
- Institute of Medicine (1990) Broadening the Base of Treatment for Alcohol Problems. The National Academies Press, Washington, DC. [PubMed] [Google Scholar]
- Kazemi DM, Borsari B, Levine MJ, Li S, Lamberson KA, Matta LA (2017) A systematic review of the mHealth interventions to prevent alcohol and substance abuse. J Health Commun 22:413–432. [DOI] [PMC free article] [PubMed] [Google Scholar]
- Klingemann H, Sobell LC (eds) (2007) Promoting Self-Change from Addictive Behaviors: Practical Implications for Policy, Prevention, and Treatment. Springer, New York. [Google Scholar]
- Marlatt GA (1985) Lifestyle modification, in Relapse prevention: Maintenance strategies in the treatment of addictive behaviors (Marlatt GA, Gordon JR eds), pp. 280–348. Guilford, New York. [Google Scholar]
- Miller WR, Munoz RF (2013) Controlling Your Drinking: Tools to Make Moderation Work for You. 3rd ed. Guilford, New York. [Google Scholar]
- Miller WR, Rollnick S (2012) Motivational Interviewing: Helping people Change. 3rd ed. Guilford, New York. [Google Scholar]
- Moos RH, Finney JW, Cronkite KC (1990) Alcoholism Treatment: Context, Process, and Outcome. Oxford University Press, New York. [Google Scholar]
- Murphy JG, Dennhardt AA, Martens MP, Yurasek AM, Skidmore JR, MaKillop J, McDevitt-Murphy ME (2015) Behavioral economic predictors of brief alcohol intervention outcomes. J Consult Clin Psychol 83:1033–1043. [DOI] [PMC free article] [PubMed] [Google Scholar]
- Muthén LK, Muthén BO (1998-2017) MPlus Users Guide. 8th ed. Muthén and Muthén, Los Angeles. [Google Scholar]
- National Institute on Alcohol Abuse and Alcoholism (2005) Helping Patients Who Drink Too Much: A Clinician’s Guide. NIAAA, Rockville, MD. [Google Scholar]
- National Institute on Alcohol Abuse and Alcoholism (2015) Alcohol Facts and Statistics [online]. Available at: https://www.niaaa.nih.gov/alcohol-facts-and-statistics [Accessed 18 Sept 2019].
- Nylund KL, Asparouhov T, Muthén BO (2007) Deciding on the number of classes in latent class analysis and growth mixture modeling: a Monte Carlo simulation study. Struc Equ Modeling 14:535–569. [Google Scholar]
- Project MATCH Research Group (1997) Matching alcoholism treatments to client heterogeneity: Project MATCH posttreatment drinking outcomes. J Stud Alcohol 58:7–29. [PubMed] [Google Scholar]
- Rachlin H, Battalio R, Kagel J, Green L (1981) Maximization theory in behavioral psychology. Behav Brain Sci 4:371–374. [Google Scholar]
- Rosenberg H (2004) International research -- target groups, In Kontrolliertes trinken als behandlungsziel—bestande-saufnahme des aktuellen wissens [Controlled drinking: a review] (Klingemann R, Room H, Rosenberg S, Schatzmann L, Sobell L, Sobell M eds), pp 69–79. University of Applied Sciences, School of Social Work, Bern, Switzerland. [Google Scholar]
- Selzer ML (1971) The Michigan Alcoholism Screening Test: the quest for a new diagnostic instrument. Am J Psychiatry 127:1653–1658. [DOI] [PubMed] [Google Scholar]
- Skinner HA, Horn JL (1984) Alcohol Dependence Scale (ADS) User’s Guide. Addiction Research Foundation, Toronto, Ontario. [Google Scholar]
- Sobell LA, Cunningham JA, Sobell MB (1996) Recovery from alcohol problems with and without treatment: prevalence in two population surveys. Am J Public Health 86:966–972. [DOI] [PMC free article] [PubMed] [Google Scholar]
- Sobell LC, Sobell MB (1992) Timeline Followback: a technique for assessing self-reported alcohol consumption, in Measuring Alcohol (Litten R, Allen J eds), 41–72. [Google Scholar]
- to predict opioid use during prescription opioid dependence treatment. Drug Alcohol Depend 148:62–68. [DOI] [PMC free article] [PubMed] [Google Scholar]
- Sobell MB, Sobell L. (2005). Guided self-change model of treatment for substance use disorders. J Cogn Psycother 19:199–210. [Google Scholar]
- Tucker JA, Cheong J, Chandler SD, Lambert BH, Pietrzak B, Kwok H, Davies SL (2016) Prospective analysis of behavioral economic predictors of stable moderation drinking among problem drinkers attempting natural recovery. Alcohol Clin Exp Res 40:2676–2684. [DOI] [PMC free article] [PubMed] [Google Scholar]
- Tucker JA, Foushee HR, Black BC (2008) Behavioral economic analysis of natural resolution of drinking problems using IVR self-monitoring. Exp Clin Psychopharmacol 16:332–340. [DOI] [PMC free article] [PubMed] [Google Scholar]
- Tucker JA, Foushee HR, Black BC, Roth DL (2007) Agreement between prospective IVR self-monitoring and structured retrospective reports of drinking and contextual variables during natural resolution attempts. J Stud Alcohol Drugs 68:538–542. [DOI] [PubMed] [Google Scholar]
- Tucker JA, Roth DL, Huang J, Crawford MS, Simpson CA (2012) Effects of IVR self-monitoring on natural resolution of drinking problems: utilization and behavioral economic factors. J Stud Alcohol Drugs 73:686–698. [DOI] [PMC free article] [PubMed] [Google Scholar]
- Tucker JA, Roth DL, Vignolo M, Westfall AO (2009) A behavioral economic reward index predicts drinking resolutions: moderation re-visited and compared with other outcomes. J Consult Clin Psychol 77:219–28. [DOI] [PMC free article] [PubMed] [Google Scholar]
- Tucker JA, Simpson CA (2011) The recovery spectrum: from self-change to seeking treatment. Alcohol Res Health 33:371–379. [PMC free article] [PubMed] [Google Scholar]
- Tucker JA, Vuchinich RE, Black BC, Rippens PD (2006) Significance of a behavioral economic index of reward value in predicting problem drinking resolutions. J Consult Clin Psychol 74:317–326. [DOI] [PubMed] [Google Scholar]
- Tucker JA, Vuchinich RE, Rippens PD (2002) Predicting natural resolution of alcohol-related problems: a prospective behavioral economic analysis. Exp Clin Psychopharmacol 10: 248–257. [DOI] [PubMed] [Google Scholar]
- Tucker JA, Vuchinich RE, Rippens PD (2004) Different variables are associated with help-seeking patterns and long-term outcomes among problem drinkers. Addict Behav 29, 433–9. (a) [DOI] [PubMed] [Google Scholar]
- Tucker JA, Vuchinich RE, Rippens PD (2004) A factor analytic study of influences on patterns of help-seeking among treated and untreated alcohol dependent persons. J Subst Abuse Treat, 26, 237–242. (b) [DOI] [PubMed] [Google Scholar]
- United Nations Office on Drugs and Crime (2017) International Standards for the Treatment of Drug Use Disorders [online]. Available at: http://www.who.int/substance_abuse/activities/msb_treatment_standards.pdf [Accessed 18 Sept 2019].
- von Elm E, Altman DG, Egger M, Pocock SJ, Gøtzsche PC, Vandenbroucke JP (2007) STROBE Initiative. The Strengthening the Reporting of Observational Studies in Epidemiology (STROBE) statement: guidelines for reporting observational studies. Epidemiology 18:800–804. [DOI] [PubMed] [Google Scholar]
- Vuchinich RE, Tucker JA (1996) Life events, alcoholic relapse, and behavioral theories of choice: a prospective analysis. Exp Clin Psychopharmacol 4:9–28. [Google Scholar]
- Vuchinich RE, Tucker JA (1998) Choice, behavioral economics, and addictive behavior patterns, in Treating Addictive Behaviors: Processes of Change. 2nd ed (Miller WR, Heather N eds), pp 93–104, Plenum, New York. [Google Scholar]
- Vuchinich RE, Tucker JA, Harllee L (1988) Behavioral assessment, in Assessment of Addictive Behaviors (Donovan DM, Marlatt GA eds), pp. 51–93. Guilford, New York. [Google Scholar]
- Wilson AD, Bravo AJ, Pearson MR, Witkiewitz K (2016) Finding success in failure: using latent profile analysis to examine heterogeneity in psychosocial functioning among heavy drinkers following treatment. Addiction 111:2145–2154. [DOI] [PMC free article] [PubMed] [Google Scholar]
- Witkiewitz K, Finney JW, Harris AHS, Kivlahan DR, Kranzler HR (2015) Guidelines for the reporting of treatment trials for alcohol use disorders. Alcohol Clin Exp Res 39:1571–1581. [DOI] [PMC free article] [PubMed] [Google Scholar]
- Witkiewitz K, Roos CR, Pearson MR, Hallgren KA, Maisto SA, Kirouac M, Forcehimes AA, Wilson AD, Robinson CS, McCallion E, Tonigan JS, Heather N (2017) How much is too much? Patterns of drinking during alcohol treatment and associations with post-treatment outcomes across three alcohol clinical trials. J Stud Alcohol Drugs 78:59–69. [DOI] [PMC free article] [PubMed] [Google Scholar]
- Witkiewitz K, Wilson AD, Pearson MR, Montes KS, Kirouac M, Roos CR, Hallgren KA, Maisto SA (2019) Profiles of recovery from alcohol use disorder at three years following treatment: can the definition of recovery be extended to include high functioning heavy drinker? Addiction 114:69–80. [DOI] [PMC free article] [PubMed] [Google Scholar]
- Worley MJ, Shoptaw SJ, Bickel WK, Ling W (2015) Using behavioral economics to predict opioid use during prescription opioid dependence treatment. Drug Alcohol Depend 148:62–68. [DOI] [PMC free article] [PubMed] [Google Scholar]