

Abstract
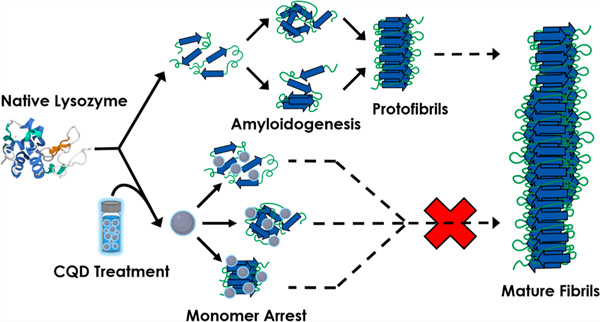
Prion-like amyloids self-template and form toxic oligomers, protofibrils, and fibrils from their soluble monomers; a phenomenon that has been implicated in the onset and progress of neurodegenerative disorders such as Alzheimer’s (AD), Parkinson’s (PD), Huntington’s, and systemic lysozyme amyloidosis. Carbon quantum dots (CQDs), sourced from Na–citrate as a carbon precursor were synthesized and characterized before being tested for their ability to intervene in amyloidogenic (fibril-forming) trajectories. Hen-egg white lysozyme (HEWL) served as a model amyloidogenic protein. A pulse-chase lysozyme fibril-forming assay developed to examine the impact of CQDs on the HEWL amyloid-fibril-forming trajectory used ThT fluorescence as a reporter of mature fibril presence. The results revealed that the Na–citrate-derived CQDs were able to intervene at multiple points along the fibril-forming trajectory by preventing the conversion of both monomeric and oligomeric HEWL intermediates into mature fibrils. In addition, and importantly, the carbon nano material (CNM) was able to dissolve oligomeric HEWL into monomeric HEWL and provoke the disaggregation of mature HEWL fibrils. These results suggest that Na–citrate CQD’s intervene in amyloidogenesis by multiple mechanisms. The gathered data, coupled with cell-line results demonstrating the relatively low cytotoxicity of Na–citrate CQDs, suggest that this emerging CNM has the potential to intervene both prophylactically and therapeutically in protein misfolding diseases. The aforementioned findings are likely to enable Na–citrate CQDs to eventually transition to both cell-line and preclinical models of protein-misfolding-related disorders. Importantly, the study outcomes positions Na–citrate CQDs as an important class of chemical, nanotechnological, and biobased interventional tools in neuroscience.
Keywords: carbon quantum dots, hen-egg white lysozyme, protein misfolding, amyloid fibrils, carbon nano materials, prophylactics, therapeutics
Graphical Abstract
INTRODUCTION
Prion-like proteins including amyloid beta (Aβ), tau, lysozyme, islet amyloid precursor protein (IAPP), α-synuclein, and polyQ mutant Huntingtin protein (mHTT) aggregate from their soluble, monomeric forms to generate increasingly complex structures that eventually result in the formation of insoluble fibrils.1–4 The trajectory from the soluble monomer-to-insoluble fibril includes the formation of oligomeric and protofibrillar precursors relatively early on in the protein misfolding landscape.5–7 The oligomers, which occur as dimers, tetramers, hexamers, and dodecamers are toxic in nature and propagate by a self-templating mechanism to form, the somewhat less toxic, protofibrils. The protofibrils then further elongate to form fibrils. Fibrils have been demonstrated to be nontoxic or less toxic relative to oligomers and proto-fibrils even though there are contrasting studies that assert fibril toxicity.
An examination of a typical fibril-forming pathway reveals several targets for arresting the propagation of toxic amyloidogenic-products (Scheme 1).5,6 For example, the monomeric species (M) of amyloid proteins is usually not toxic.8–10 Hence, the monomer itself can be targeted by small molecules with the objective of halting its conversion into oligomers (O). Passivation of the oligomers and proto-fibrils (Pf) is another approach. Alternatively, dissociation of toxic oligomers and proto-fibrils into monomers or, their rapid conversion to form “non-toxic” fibrils* are other desired interventional mechanisms.11–13 *The toxicity of fibrils is still a matter of debate. Therefore, moieties that fully dissolve fibrils into monomeric entities would be desirable. Standard analytical methods designed to detect mature fibrils and intermediates along the amyloidogenic trajectory are key to the studies of amyloidogenesis. They include the thioflavin T (ThT) fluorescence assay (to detect mature fibrils) and the dynamic light scattering (DLS) technique to measure particle size, among others (Scheme 1).7,14–17
Scheme 1.
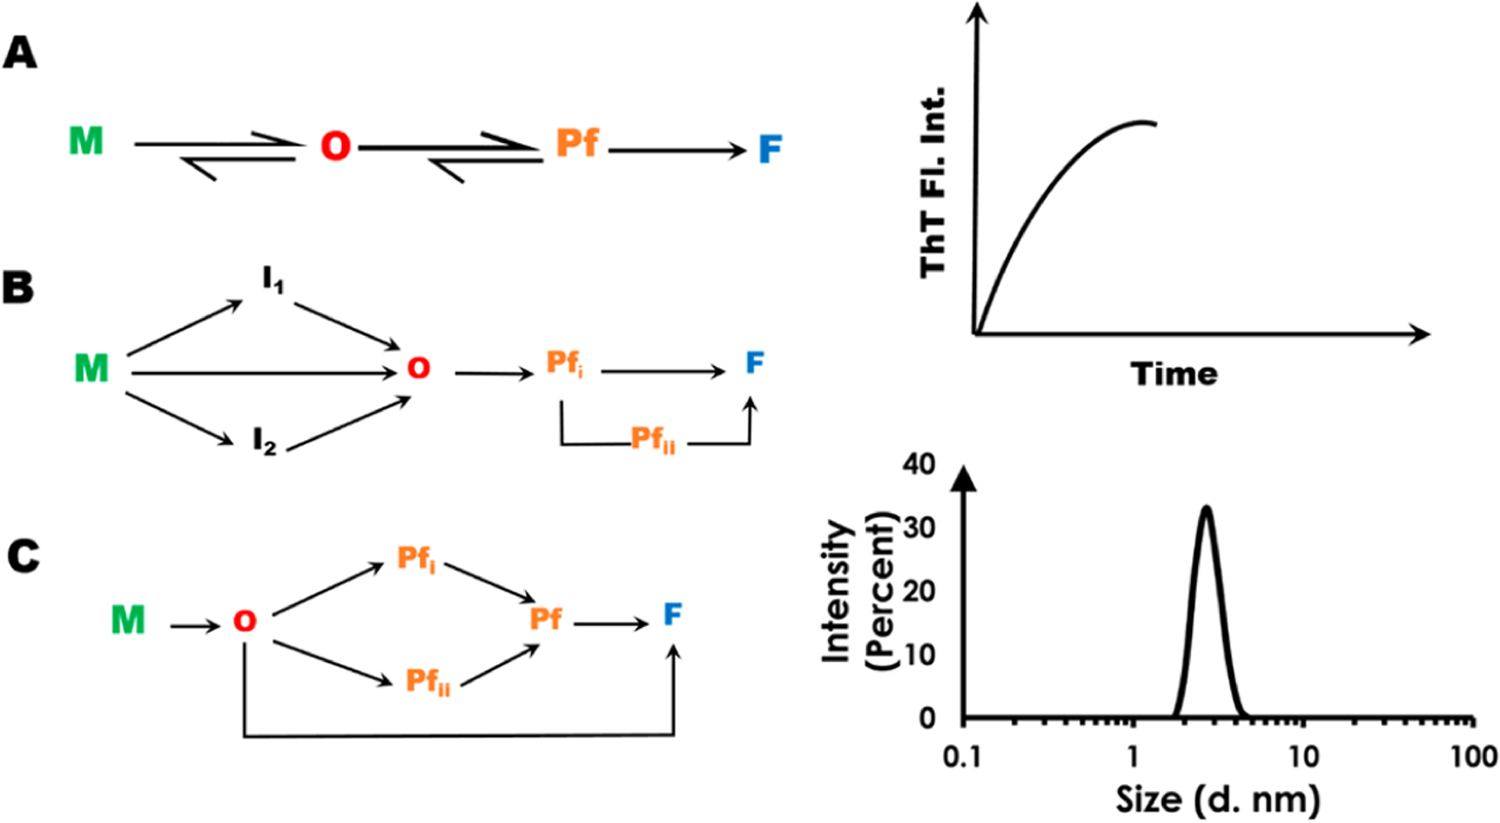
Putative Pathways (A, B, C) for the Conversion of Soluble Amyloidogenic Protein Monomers to Toxic Oligomers and Fibrilsa
aM, monomer; O, oligomer; Pf, protofibril; F, mature fibril. Progress along the fibril-forming trajectory is assayed via techniques such as ThT fluorescence (top-right) and DLS (bottom-right).
In the past few years, the formation of amyloidogenic trajectories have been explored in silico, and experimentally, to obtain an atomic-level understanding of the fibril-forming process.18 This is crucial for first testing mechanisms to intervene in amyloidogenesis in vitro, prior to testing them in vivo. Efforts to prevent amyloidogenesis have also transitioned from employing natural products such as curcumin and resveratrol to the use of carbon-based nanomaterials and nanocomposites.18
Carbon nano materials (CNMs) including graphene quantum dots (GQDs), carbon nano tubes (CNTs), carbon nano onions (CNOs), and carbon dots (CDs) have been exploited for their wide-spread applications as sensors, in catalysis, tissue engineering and cancer therapy.19–24 A relatively recent article revealed the ability of graphene quantum dots (GQDs) to inhibit the fibrillization of the Parkinson’s Disease (PD)-associated amyloid α-synuclein.25 The GQDs were able to directly interact with mature fibrils and trigger their disaggregation. However, unlike that study which used functionalized GQD’s, other researchers reported the ability of pristine GQD’s to intervene in human Islet Amyloid Precursor Protein (IAPP)-associated amyloidosis and toxicity to zebrafish.26 In the zebrafish study, GQD’s were able to rescue the organism from IAPP-misfolding-associated impaired hatching, malformation, mortality and from elevated levels of reactive oxygen species.
Of late, a class of CNMs viz., carbon quantum dots (CQDs), which unlike GQDs can be prepared from a variety of carbon-containing precursors, have emerged as attractive candidates for intervention in a host of biomedical applications including biomedical imaging, diagnosis, bioanalytical assays optronics, catalysis, and as sensors (Scheme 2).27–30 Since they are routinely sourced from waste materials and biomass such as fruit peel, wood pulp, ground coffee, grass, algae, and even fish via hydrothermal synthesis among other procedures, CQDs are categorized as “green” and “sustainable” (Scheme 2).22 Their size (2–10 nm), coupled with their photoluminescence, make them uniquely suitable to penetrate cells, tissue and even the blood-brain-barrier while simultaneously lending themselves to the imaging of their in vitro/in vivo distribution.31,32 In a recent study, CQDs derived from brown coal were found to be able to inhibit IAPP and Aβ amyloidogenesis suggesting a potentially therapeutic role in Type-2 Diabetes (T2D) and AD.33
Scheme 2.
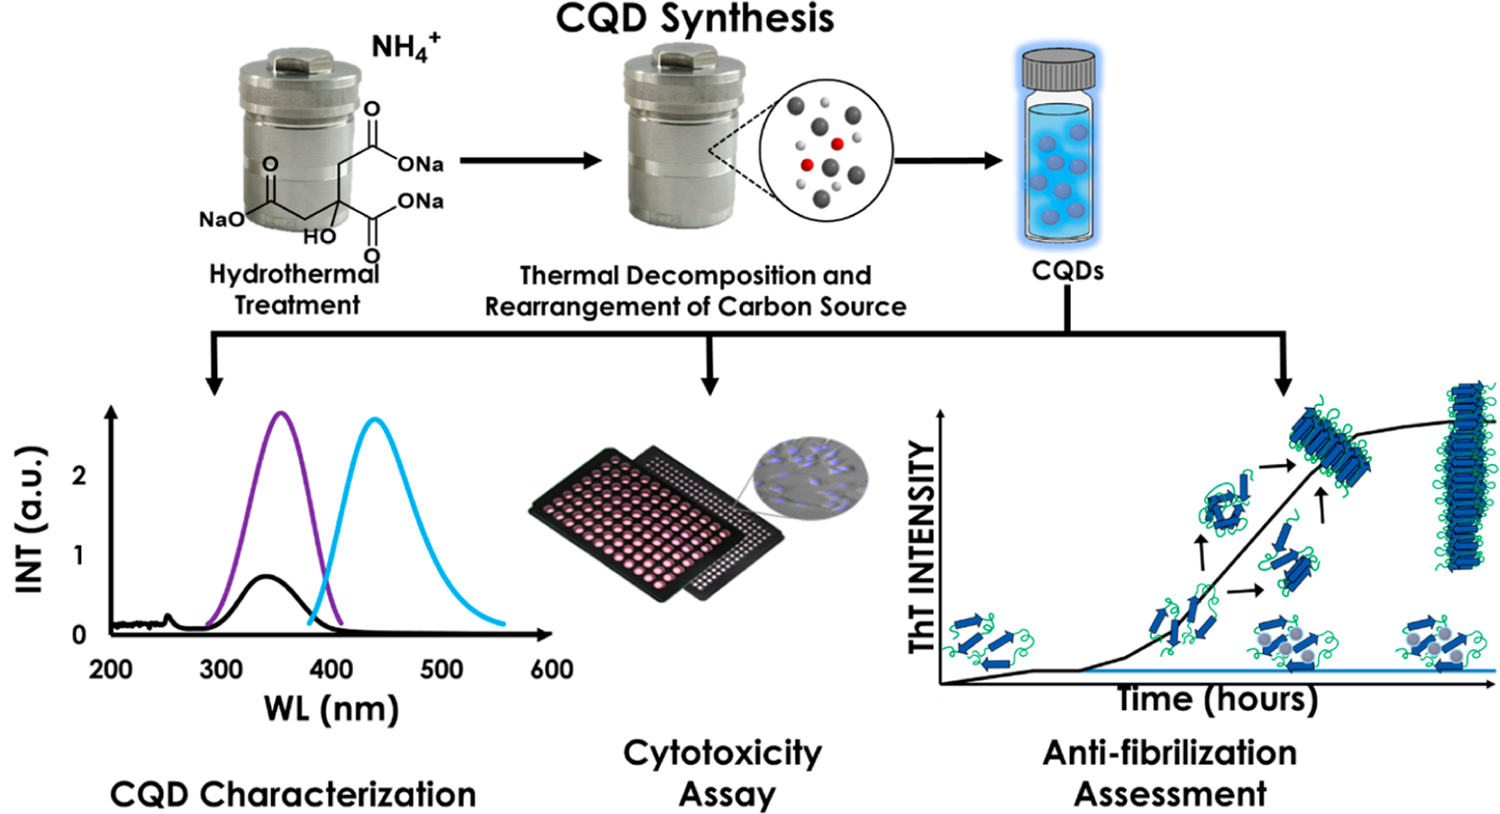
Hydrothermal Synthesis of CQDs from Organic Precursors. CQDs are Then Assayed for Efficacy in Sensing, Biomedicine, Cancer Intervention, Etc., and for Toxicity
We have examined the ability of Na–citrate-derived CQDs to intervene in the process of amyloid fibril formation using Hen-Egg White Lysozyme (HEWL) as a model amyloidogenic (fibril-forming) protein.34,35 The folding/unfolding pathways of HEWL have been well-studied.36,37 Furthermore, conditions that result in the formation of HEWL fibrils have been established as a means to study the onset of lysozyme amyloidosis; a disorder characterized by the precipitation of lysozyme protein within the body, leading to multiorgan dysfunction.38 The presence of fibrils can be easily detected using a ThT fluorescence assay.39,40 As a result, lysozyme fibrillation has served as a standard for studying the amyloidogenesis of other proteins such as Aβ, tau, α-synuclein, and mHTT.
To test whether Na–citrate CQDs can intervene in amyloidogenesis, we developed a pulse-chase amyloid-fibril-forming assay using HEWL as the prototype. The amyloidogenic landscape was periodically challenged by Na–citrate CQDs. Our results reveal that the said CQD not only prevented HEWL amyloidogenesis but also dissociated fully formed (mature) fibrils. These results, coupled with the relatively low-cytotoxicity of Na–citrate CQDs against a neuroblastoma cell line and, their ability to penetrate the blood-brain barrier, herald a new class of CNMs that can potentially intervene in neurodegenerative disorders.22
RESULTS
Na–Citrate CQD Characterization.
CQDs were synthesized using Na–citrate as a precursor. The CQDs obtained were relatively homogeneous in size as observed by DLS measurements (Figure 1ia). The Na–citrate-derived CQD’s had an average size of 2.7 nm and were dispersed between 2 and 4.2 nm. This range is in good agreement with previously reported values for CQDs.22,41,42 The polydispersity index of 0.33 suggests that the distribution, while not ideal, is close to the acceptable value assigned for polymeric nanomaterials.22 Visualization of the distribution of intensities as a function of size reveals that the largest fraction of CQDs have a size of ∼2.5 nm (Figure 1ib). The intensities, and therefore the fractional populations, falloff rapidly on either side with the lower and upper limits found at 2.0 and 4.2 nm.
Figure 1.
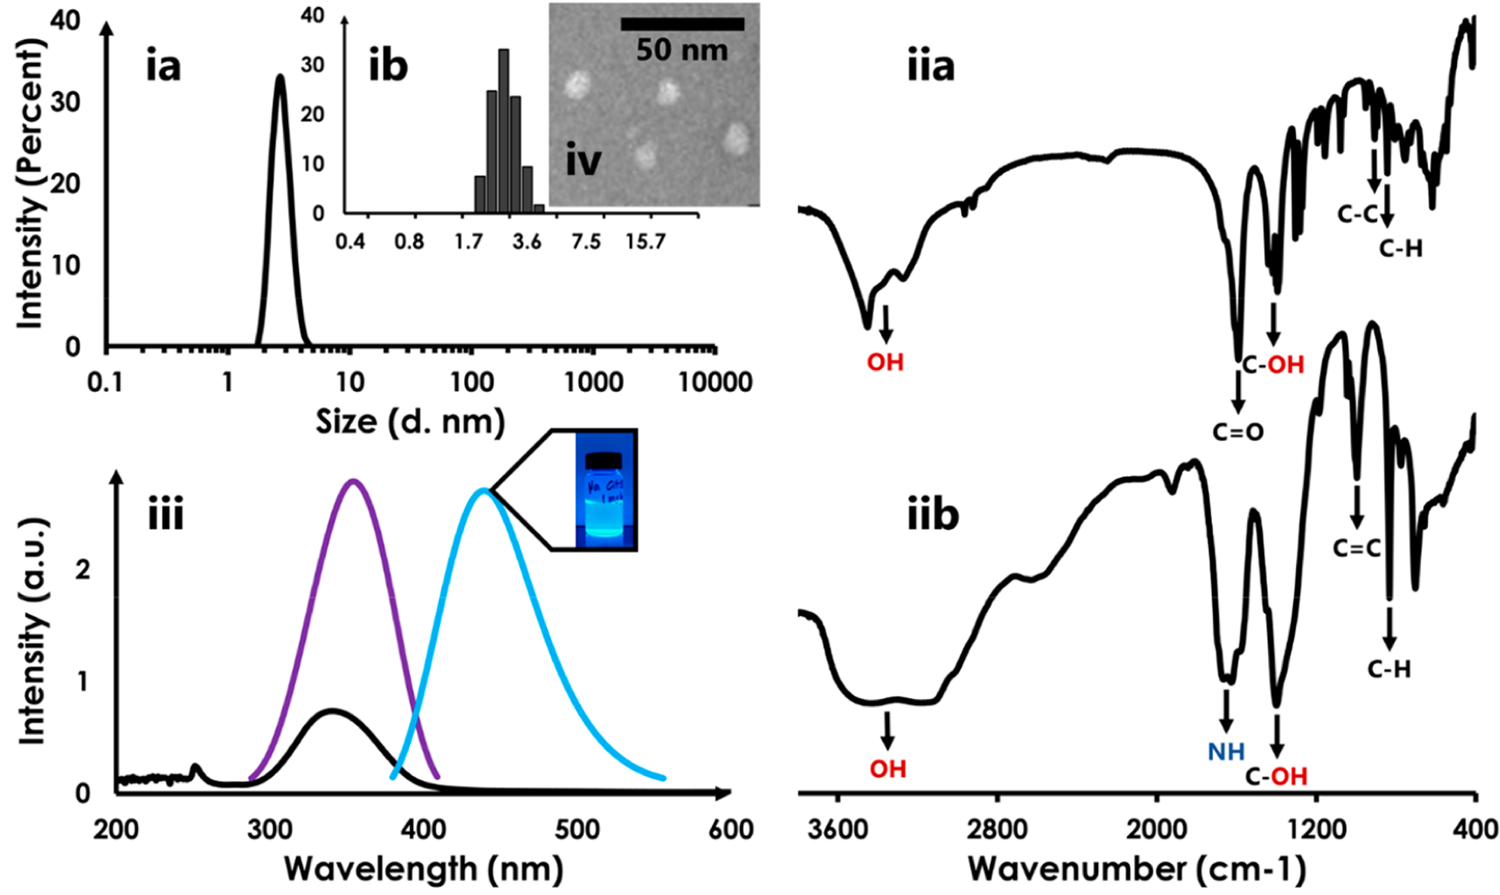
(ia) DLS profile of Na–citrate CQDs. A distribution of particle sizes around 2.7 nm is observed. (ib) Inset shows that the distribution of sizes rapidly falls off on either side of the particles with the largest fractional population (2.5 nm); (iia and iib) IR spectrum of Na–citrate and Na–citrate CQDs, respectively; (iii) The absorption spectrum of Na–citrate CQDs displays an absorption maximum of 340 nm (black curve). The fluorescence excitation spectrum (blue; excitation maximum @ 354 nm) and emission spectrum (cyan; emission maximum @ 440 nm) are also shown. The CQD’s appear to have an aqua hue to the eye (irradiation by a UV-light source); (iv) TEM image of Na–citrate CQDs.
An examination of the IR spectrum of the CQD carbon source was in good agreement with that reported in the literature22 (Figure 1iia). Prominences corresponding to the carbonyl carbon of Na–citrate, the hydroxyl group, carbon–carbon bonds, and the alkyl moieties are identified. The conversion of Na–citrate to Na–citrate-derived CQDs resulted in a largely altered spectral profile (Figure 1iib). There was a significant loss in the sharpness of the peaks and this is potentially due to overlapping modes arising from the complex chemistry of the CQD. Nevertheless, the appearance of sp2 hybridized carbons was observed (∼2000 cm−1) as was the appearance of the amine (1600 cm−1) which are hallmarks of CQDs.33
The UV–vis spectrum of Na–citrate CQDs displays a maximum at 340 nm indicating the presence of π–π* transitions within the framework (Figure 1iii).43 A slight red shift in the maximum of the fluorescence excitation spectrum is observed relative to the absorbance spectrum. This could indicate the presence of moieties that are UV-silent around 340 nm but are fluorescent; thus causing a redshift in the Excitation spectrum relative to the emission spectrum. The fluorescence emission maximum is found at 440 nm and the Na–citrate CQDs (inset) appear aquamarine color under UV light. TEM analysis revealed that the CQDs have a dimension <6 nm which is in agreement with DLS data (Figure 1iv).
Impact of Na–Citrate CQDs on a Model Amyloid-Forming Trajectory.
Scheme 3 describes a pulse-chase amyloid fibril-forming assay. Fibril formation is initiated in “n” identical solutions of monomeric lysozyme (A–D).44 HEWL fibril formation (presence) is established by periodically withdrawing aliquots from the solutions and assaying it for ThT fluorescence.39,40,44 Other than the n = A (control) solution, fibril formation is challenged by the addition of Na–citrate CQD’s (B,C,D) as follows: The CQD challenge is introduced (pulsed) with increasing delay along the fibril forming trajectory (chase) to constitute an amyloid fibril-forming “pulse-chase” CQD challenge. The samples B–D therefore represent the differing points in time at which the Na–citrate CQDs are introduced. B: t = 0; C: t = 1 h; D: t = 2 h. These time-points were chosen based on a plateau formed in the concentration of HEWL fibrils (in the n = 0 control where no CQDs were added) at/after 4 h post initiation of fibril-forming conditions.
Scheme 3.
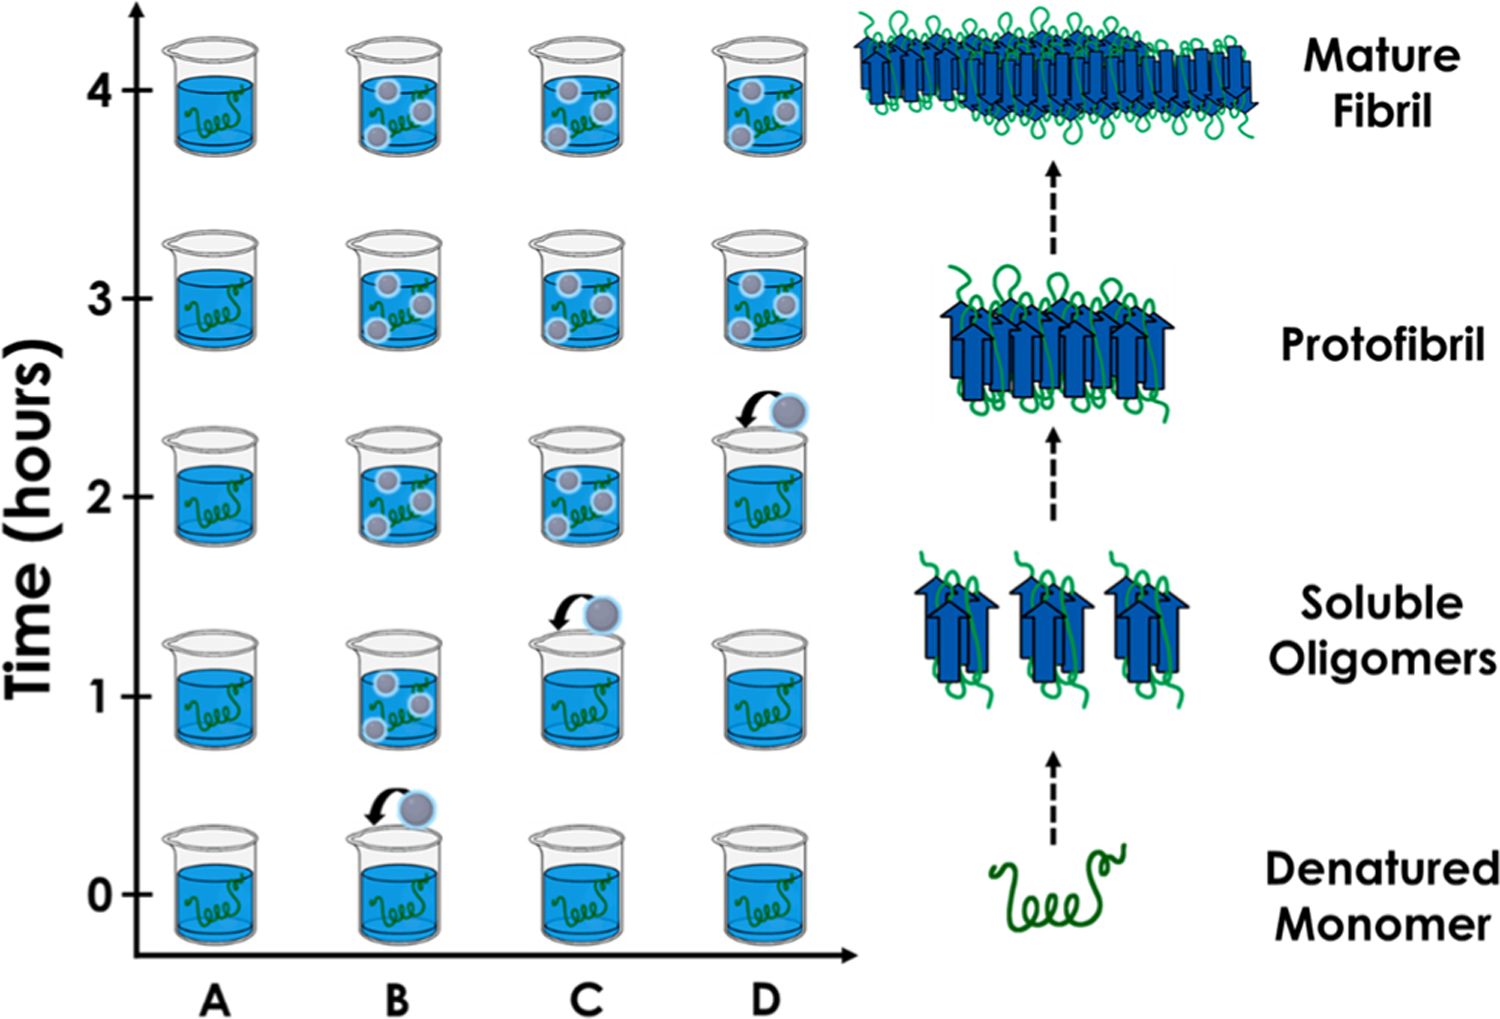
A Pulse-Chase Amyloid Fibril-Forming Assay Wherein the Constituents of the Fibril-Forming Trajectory Can Be Challenged by a Small-Molecule (CQD) at Any Point in Time along the Fibril Maturation Axis (y)a
aAlso depicted, parallel to the ordinate, is the transformation of a typical monomeric amyloid (ribbon) into mature fibrils via oligomeric and protofibrillar intermediates (sheets).
Figure 2 reveals results from the HEWL fibril-forming landscape using a variety of techniques. 2Ai displays AFM images corresponding to the formation of oligomeric aggregates (t = 1 h after initiation of fibril-formation) and the mature fibril (2Aii) (t = 4 h after initiation of fibril formation).
Figure 2.
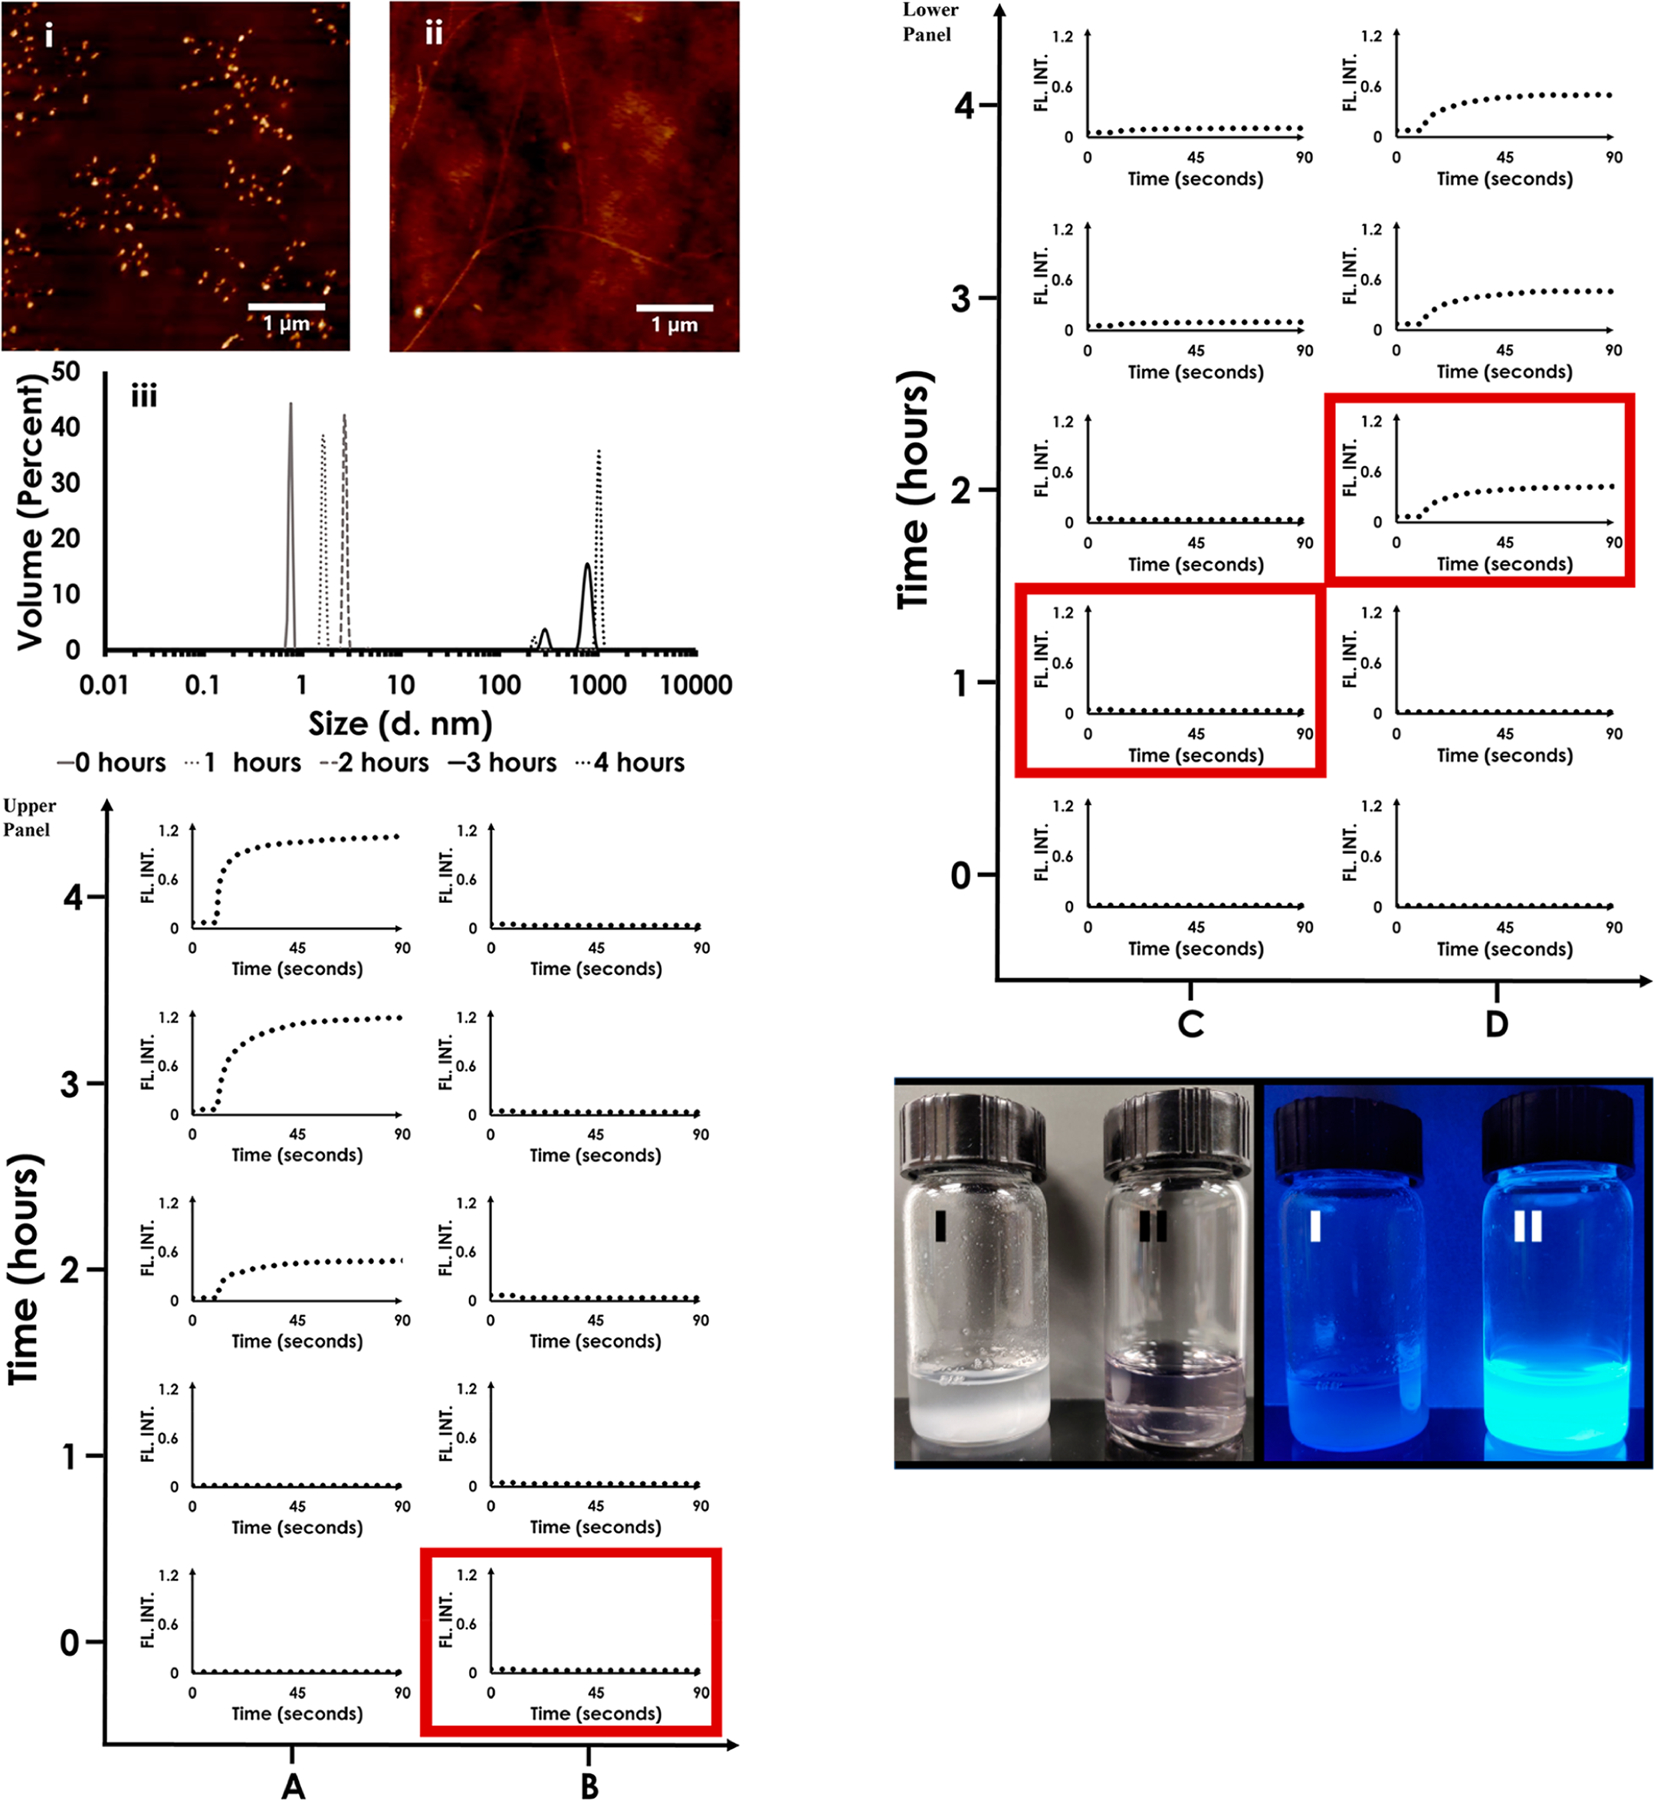
Part A: (i) AFM image of HEWL 1 h post initiation of fibril-formation showing the presence of oligomeric intermediates and likely free monomers. (ii) As in (i) but 4 h post initiation of fibril-formation wherein mature fibrils are clearly resolved. (iii) DLS composite snapshot of HEWL fibril-forming trajectory showing the presence of species differing in hydrodynamic radii which can be attributed to monomers, intermediate-sized aggregates (including oligomers) and mature fibrils. Part B: Upper and lower panels show results from the pulse-chase amyloid-fibril-forming- assay-challenged Na–citrate CQDs. Column A: control; Column B: CQD added at time = 0 h; Column C: CQD added at time = 1 h after initiation of fibril formation; Column D: CQD added at time = 2 h after initiation of fibril formation. Mature fibrils, if present, are detected by ThT fluorescence in every data set. The red box denotes the instant when the CQD was added to the HEWL fibril-forming solution. Part C: Na–CQD impact on HEWL fibril formation. (I) HEWL fibrils visible after 4 h of HEWL incubation in fibril-forming conditions (II) Na–citrate CQDs were added to HEWL monomers prior to its incubation in fibril-forming conditions. Left: Photographed under visible light. Right: Photographed under UV–vis illumination.
Figure 2Aiii is a composite DLS snapshot of the HEWL fibril-forming trajectory showing the presence of monomers, other intermediates such as oligomers, and fibrils. It is notable that two types of fibrils were detected at both 3 and 4 h post initiation of fibril-formation. There appeared to be a limited increase in the larger particle size from 3 to 4 h and a slight decrease in the smaller particle size in the same time-period. Furthermore, it is noted that upon repeating the HEWL-fibril forming control, mature fibrils did demonstrate slight size differences (@ the 4 h point) which reflects the complexity of the formed fibrils and the amyloidogenic process.
We then characterized the impact of Na–citrate CQDs on HEWL amyloidogenesis using ThT fluorescence (upper and lower panels in Figure 2B). The first column (column A in the upper panel) is the control (A; no CQD added). While no ThT fluorescence is initially observed (Figure 2B A: at t = 0 or at t =1 h), HEWL fibril formation is detected from t = 2 h* onward. *Note that fibril-formation was not assayed between 1 and 2 h and thus we do not know whether fibrils formed prior to 2 h.
As previously indicated, fibril-formation eventually plateaus at t = 4 h as evidenced from no further increase in fluorescence intensity over that achieved within 4 h (ThT intensity at t =6h and onward remained unchanged from t = 4 h; data not shown).44 In n = B (2B upper panel column B), Na–citrate CQDs were introduced at t = 0. ThT results from 2B B: t = 1,2,3,4 h revealed that no fibril-formation was observed even 4 h later. Effectively, the ThT fluorescence profiles at t = 0, 1, 2, 3,4 h mirrored the control experiment.
When Na–citrate CQDs were introduced 1 h (Figure 2B lower panel column C) after initiation of HEWL fibrillization (Figure 2B, (C)), the ThT fluorescence essentially mirrored the control experiment until t = 4 h, although a slight inflection in ThT fluorescence was found (2B C: t = 3 h and at t = 4 h). The addition of CQDs at D: t = 2 h had the most interesting effect on HEWL fibril-formation. Note that, akin to the control experiment, fibrils have already populated the system 2 h after initiation of fibrillation.
The addition of CQDs at Figure 2B lower panel column D: t = 3 h results in a marginal increase in the fibril content. The ThT curve at D: t = 3 h is almost similar to that at D: t = 4 h with only a slight recovery in fluorescence was observed.
Finally, Figure 2C shows the impact of Na–citrate CQD introduction on the amyloid-fibril forming tendency of HEWL. Four hrs after initiation of fibril-formation, HEWL fibrils are clearly visible to the unaided eye (I; left). Incubation of Na–citrate CQD’s to the HEWL-containing solution prior to the initiation of fibril-formation resulted in the solution remaining clear even 4 h later (II; left). The results when viewed under UV-light are shown on the right.
Kinetics analyses of ThT binding to HEWL fibrils provides additional insight into the impact of CQDs on fibril formation to be revealed (Figure 3).
Figure 3.
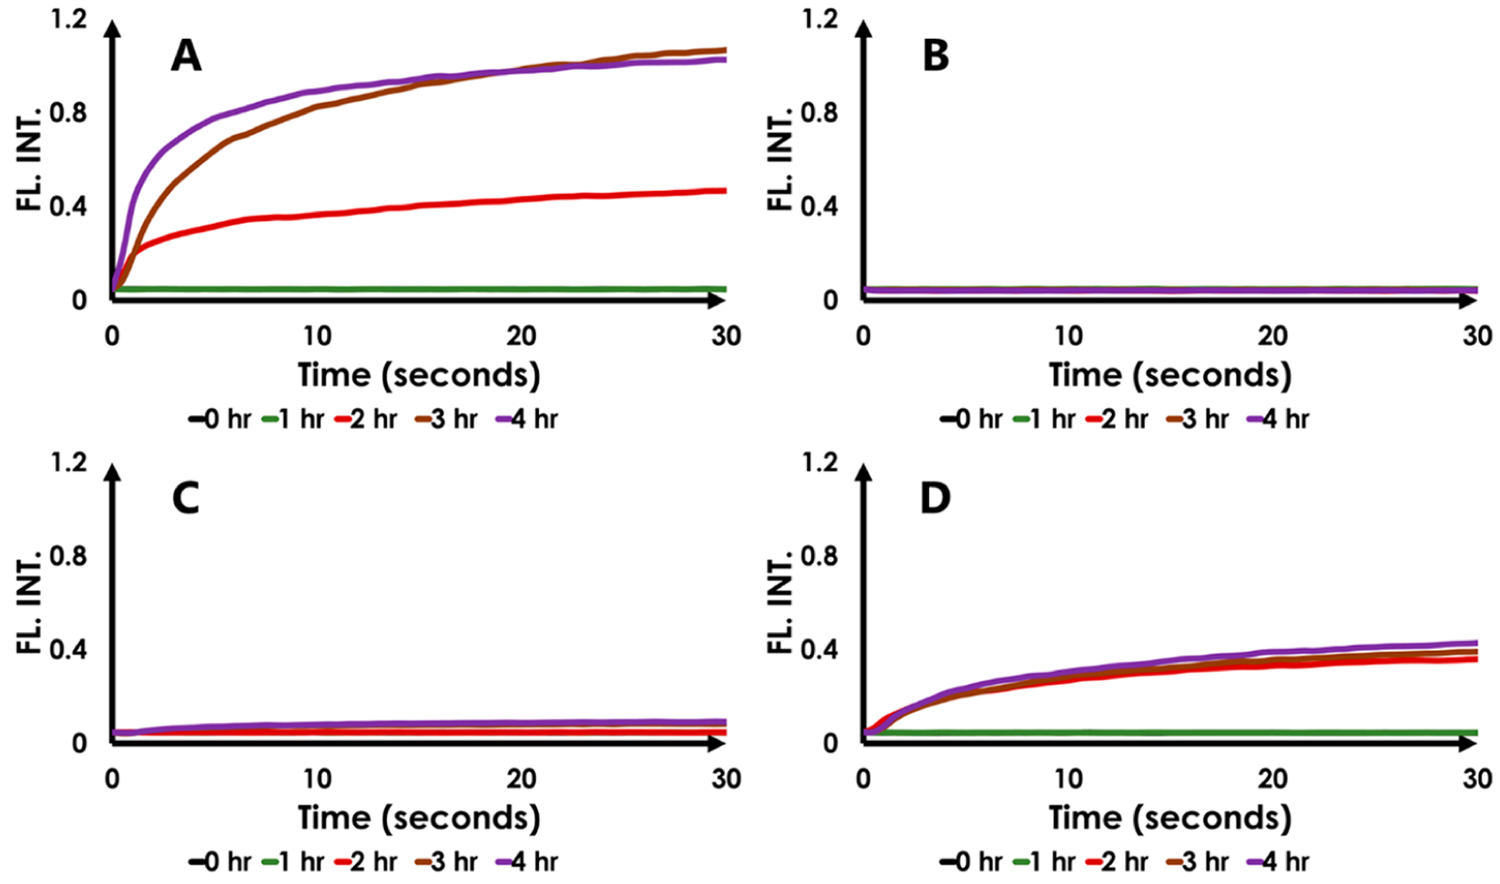
Kinetics of HEWL fibrillation. A: no CQD; B: CQD added at t = 0; C: CQD added at t = 1 h; D: CQD added at t = 2 h. In the control, HEWL fibril formation plateaus in 4 h and is inhibited in the presence of Na–citrate CQDs.
Figure 3, Panel A depicts ThT fluorescence kinetics curves in the HEWL fibril-forming assay as a function of time, post fibril initiation. There is an increase in both the ThT fluorescence intensity and the slope, as a function of sampling time, postinitiation of fibril formation (t = 0–4 h). This is expected because it takes 4 h for “saturation” of mature HEWL fibril formation in our experimental setup (Figure 2A; 41). Nevertheless, the data represented in Figure 3A can also be visualized by tracking the curves in Figure 2B, column A from bottom to top where mature fibrils present at 4 h after fibril-initiation permit maximum ThT fluorescence recovery. Panel B) shows the absence of ThT fluorescence as a function of time if CQDs are introduced at B: t = 0 (corelate with Figure 2B, column B, bottom to top). By contrast, panel C) reveals a slight increase in ThT fluorescence at t = 3 h and T = 4 h when the CQD was introduced at C: t = 1 h (corelate with Figure 2B, column C, bottom to top). The increase is miniscule (and was not easily visible in Figure 2; column 3) but the nature of the curvature and the marginal increase from t =3 to t = 4 h suggests that it is not an artifact. Panel D) reveals the impact that CQD’s have when introduced at D: t = 2 h into the initiation of HEWL fibrillization (corelate with Figure 2B, column D, bottom to top). While fibrils have already started forming by then, the comparison of the excursions along the ordinates of panels A (control) and D reveal that the CQD’s have essentially arrested HEWL fibrillization (see Conclusions for a discussion of the mechanism of action).
Impact of Na–Citrate CQDs on Preformed (Mature) HEWL Fibrils and Oligomeric Intermediates.
We also established the impact of Na–citrate CQDs on fully formed (mature) HEWL fibrils. Figure 4i shows the detection of the fibril motif by ThT fluorescence (curve A). As expected, the introduction of ThT into a solution of preformed HEWL fibrils resulted in a rapid increase in fluorescence intensity as the molecule bound to the mature fibrils; essentially reflecting the “on-rate” of ThT binding to fibrils.39,40,44 However, the introduction of CQDs to the solution results in a relatively rapid loss of ThT fluorescence intensity (4i, curve B). The loss of fluorescence suggests that the Na–citrate CQDs are capable of dissolving mature HEWL fibrils. Control experiments indicated that the CQD’s themselves did not fluorescence at the wavelength and concentrations used in the actual experiment (4i, curve C). Any interactions between Na–citrate CQDs only had a negligible impact on the fluorescence signal of ThT (4i, curve D).
Figure 4.
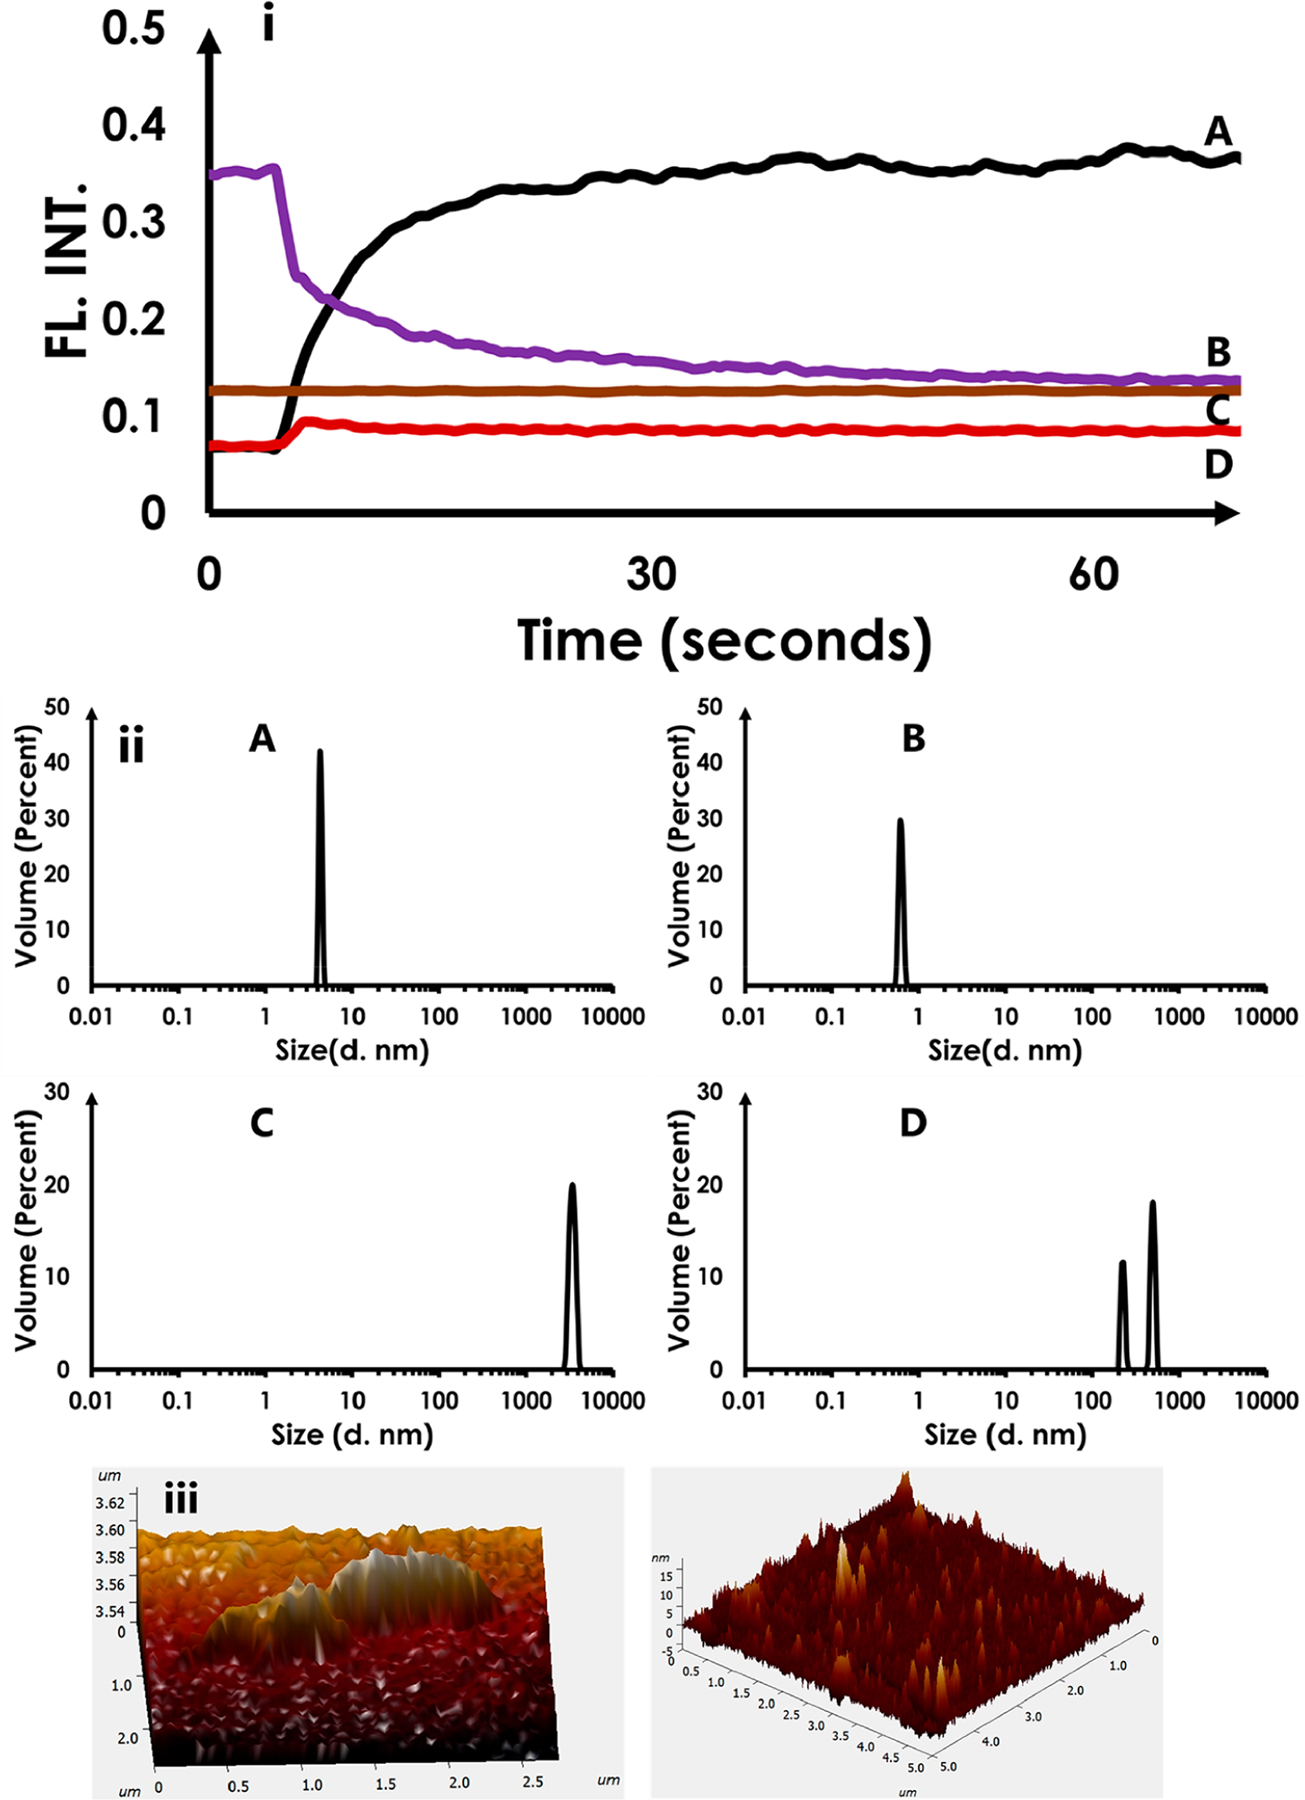
Impact of Na–citrate CQDs on HEWL aggregates and fibrils. (i) ThT fluorescence results (A) control showing the addition of ThT to preformed HEWL fibrils; (B) Na–citrate CQDs added to the solution in (A); (C) Na–citrate CQD fluorescence in buffer; (D) ThT added to (C) (ii) DLS data (A) showing HEWL oligomers; (B) solution (A) treated with Na–citrate CQDs showing the conversion of HEWL oligomers to monomers; (C) mature HEWL fibrils; (D) solution (A) treated with Na–citrate CQDs showing the conversion of mature HEWL fibrils to smaller aggregates. (iii) AFM image of a HEWL fibril (left) and upon its treatment with Na–citrate CQDs (right)
However, it is necessary to test whether the loss in ThT fluorescence upon CQD addition to mature fibrils is due to competitive binding of CQD and ThT on HEWL, resulting in the displacement of ThT from the fibrils by the CQD, or due to actual CQD-induced-disaggregation of the fibrils. Therefore, we examined the impact of CQD’s (2 mg/mL) on HEWL using both DLS and AFM. The DLS (Figure 4 (ii) data were obtained under two sets of conditions. The data in 4ii A were gathered 1 h after initiation of fibrillation, which reveals the presence of oligomeric HEWL. To this solution, 2 mg/mL of Na–citrate CQDs were added, resulting in the conversion of HEWL oligomers to monomers (4ii B). The data in 4ii C reveal the presence of mature HEWL fibrils. To this, the addition of Na–citrate CQDs (2 mg/mL) resulted in the formation of smaller fibrils/intermediates that were heterogeneous (4ii D).
The AFM images show the presence of a HEWL fibril (Figure 4 iii Left) and the likely presence of smaller conformations (monomer and oligomers) upon addition of CQDs (Figure 4 iii Right).
Together, these results, in conjunction with the ThT data, provide evidence supporting the fact that Na–citrate CQDs are able to disaggregate oligomers and mature HEWL fibrils.
Cytotoxicity of Na–Citrate CQDs.
Cytotoxicity of Na–citrate CQDs was examined using a neuroblastoma cell line.45–49 Specifically, the mechanism of cell death (if any), as a function of Na–citrate CQDs was investigated using standard assays that help delineate apoptotic and necrotic cell-death pathways as a function of cellular insult; in this case the said CQD.45–49 The results shown in Figure 5 reveal no change in baseline levels of early and late apoptosis upon addition of Na–CQDs up to a concentration of 5 mg/mL. At 25 mg/mL, the cells were observed to enter both early and late apoptosis. A small fraction of the cells was also found to be necrotic. A positive control using H2O2 @100 μM as the insult is also shown. These results reinforce the fact that Na–citrate CQDs can safely be used at a concentration of 2.5 mg/mL (if not up to 5 mg mL). Levels between 5 and 12.5 mg/mL (the concentration that induced cytotoxicity) were not sampled.
Figure 5.
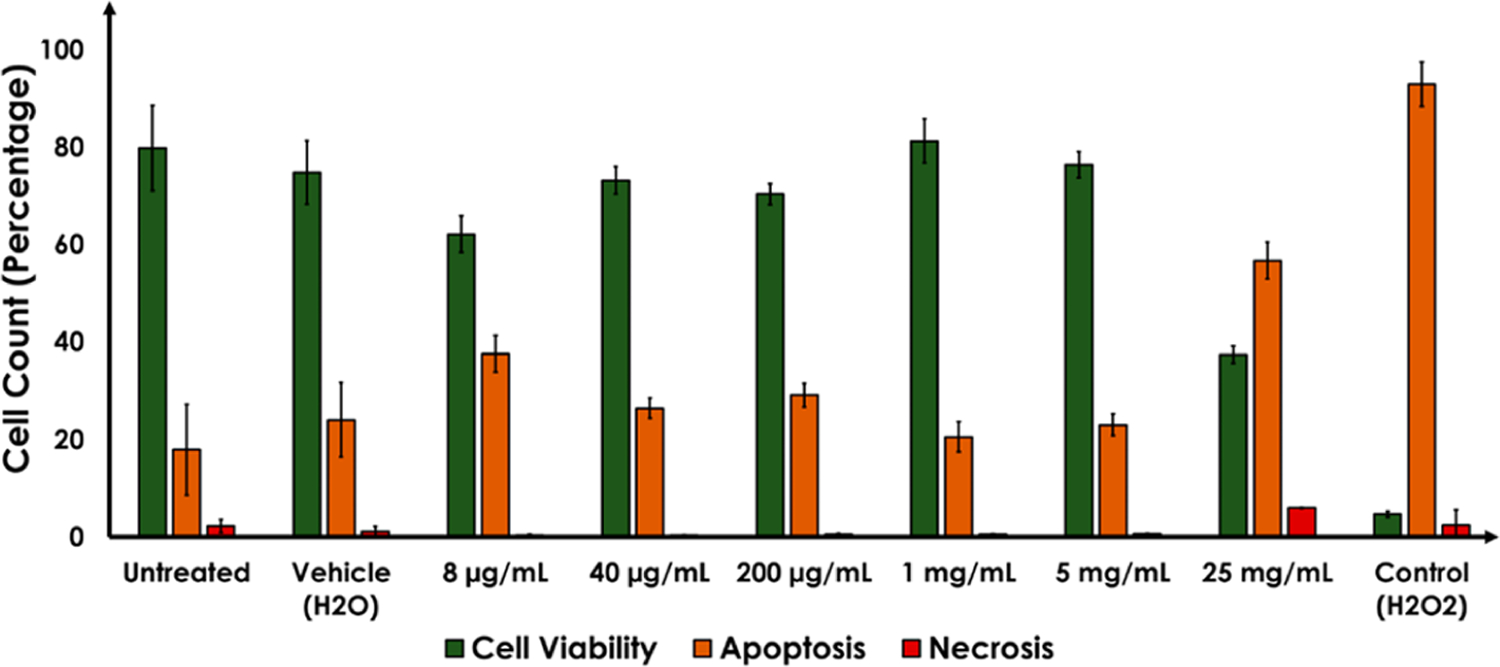
Impact of Na–citrate CQDs (8 μg-25 mg/mL) on the SHSY-5Y cell line. The green bars depict cell viability whereas the yellow and red bars reflect apoptosis and necrosis, respectively. Negative controls included untreated and vehicle treated cells. The positive control was cells treated with 100 μM H2O2.
CONCLUSION
Amyloidogenic trajectories are those that result in the formation of amyloid fibrils from prion-like proteins.1–10 We investigated the ability of a relatively novel class of CNMs, viz. CQDs, to interfere in the processes leading to the seeding of fibrils. To test this, we developed a pulse-chase amyloid-forming assay that can be challenged at any point in time by perturbants. The model amyloidogenic protein, HEWL, was selected as a fibril-forming prototype. We administered the challenging agent, viz. Na–citrate-derived CQDs, with increasing delay along the fibril-forming axis. The CQD-challenge assay output always remained the ThT-detected mature fibril content (if any). By contrast, the nature of the amyloidogenic intermediate, whether monomer, oligomer, or mature fibril, was independently determined from AFM and/or DLS analyses; both of which provide high-resolution insight into the fibril-forming trajectory as opposed to the “fibril-or-no-fibril” ThT fluorescence output. By coupling DLS/AFM with the ThT assay, we were able to corelate the nature of the amyloidogenic intermediate with the impact that the CQD has on that intermediate and thereby, map its role on the fibril-forming trajectory. As an outcome, we were able to fingerprint the interventional ability of Na–citrate CQDs on various amyloidogenic conformations along the pathway to mature fibrils. Our results reveal that Na–citrate CQDs prevent the formation of amyloid-like fibrils by interfering with monomers and oligomeric HEWL intermediates (Figures 2B (in conjunction with Figures 3) and 2C). However, if fibrils had formed prior to CQD addition, the dosage of the CQD used in the pulse-chase assay was found insufficient to dissolve the fibril (Figure 2A, D). Nevertheless, the applied dose succeeded in preventing additional fibrils from being formed.
Separately, we examined the impact of higher concentrations of Na–citrate CQDs on mature fibrils using a ThT assay (Figure 4i A–D). The addition of the Na–citrate CQD to ThT-bound HEWL fibrils resulted in a slow diminution of ThT fluorescence suggesting that mature-fibril content was decreasing in concentration; in turn suggesting disaggregation (4i A). Independent data obtained using DLS measurements confirm this conclusion (Figure 4ii A/B and C/D). Oligomeric HEWL was fully restored to its monomeric form upon the addition of 2 mg/mL Na–citrate CQDs (4 ii A/B). However, larger fibrils were only partially disaggregated by the same concentration of applied CQD (4ii C/D). AFM data were able support the conclusion regarding the ability of CQDs to act on mature HEWL fibrils (4iii L/R).
Altogether, the data suggest that Na–citrate CQDs can intervene prophylactically (Figures 2B C and 3) to prevent fibril-formation and also dissolve HEWL oligomers and (partially) disaggregate preformed mature fibrils (Figure 4); suggesting therapeutic intervention.
The mechanism by which Na–citrate-derived CQDs intervene in amyloidogenesis is of interest. It likely results from a combination of multiple mechanisms wherein the CQD not only prevents available monomers and oligomers from converting into fibrils in addition to disaggregating fibrils.50 The small size, high surface area, and negatively charged surface and high surface curvature of these spherical nanoparticles (compared to flat surfaced nanoparticles such as rod-shaped NPs) allow for better fibril-binding affinity due to noncovalent interactions (such as electrostatic interactions and H-bonding); resulting in the disaggregation or destruction of the fibrils. An increase in zeta potential likely improves fibril-dissolution and prevention due to electrostatic repulsion.
The CQDs might also envelop the fibrils and block self-seeding, oligomerization and eventual fibril formation. They could potentially sequester not only monomers but also oligomers and protofibrils as evident from ThT data and previous literature.51 Other studies have also pointed toward the importance of C-terminus in controlling the self-assembly and elongation.52 This is attributed to the fact that the C-terminus has a lower degree of freedom and accessibility for the elongation process. The CQDs might be binding to these ends on the fibrils and protofibrils and inhibit the formation of larger fibrils. The sp2-hybridized carbon atoms of Na–citrate CQDs can also likely engage in both hydrophobic interactions and π–π stacking interactions resulting in inhibition of fibrillization. These interactions have been previously reported to potentially have strong effect on the creation of the SWNT–HEWL complex.52
We also tested the cytotoxicity of Na–citrate CQDs on a model cell line. Up to a concentration of 5 mg/mL the CQD’s were found to have the same effect on the SHSY-5Y neuroblastoma cell line, as did the untreated control and the vehicle control. Apoptosis was visible at 25 mg/mL, although the fraction of apoptotic cells at that CQD concentration was only 60% of apoptosis induced by 100 μM H2O2 (+ve control). The choice of this cell line was based upon its service as the standard for in vitro modeling of protein-misfolding-related disorders in neuroscience; including AD and PD.53–55 The results therefore suggest that Na–citrate CQD’s can be translated into in vitro models of amyloidogenesis prior to preclinical testing.
In sum and substance, given their facile and green synthesis, low-cost of production, their ability to mitigate the generation of toxic amyloid species and, their low cytotoxicity, Na–citrate CQD’s appear uniquely positioned to advance to in vitro and in vivo testing in neurodegenerative disorders.
EXPERIMENTAL PROCEDURE
Materials.
Sodium citrate dihydrate, ammonium bicarbonate, thioflavin T, guanidine hydrochloride, potassium phosphate dibasic and monobasic were purchased from Fisher Scientific. Egg white lysozyme was obtained from MilliporeSigma. All reagents used were of analytical grade and no further purification was needed before its use. The water used in all experiments listed here was purified using a Milli Q water purification system.
METHODS
Carbon Quantum Dots Synthesis.
Carbon quantum dots were synthesized through a one-step hydrothermal method.41,56–58 A 70 mM Sodium Citrate dihydrate, 1.90 M Ammonium Bicarbonate solution was placed inside a sealed Teflon equipped with a stainless-steel hydrothermal bomb. Hydrothermal treatment was performed in an Isotemp general-purpose oven (Fisher brand) for 4 h at 180 °C as described.41 After the heating process was completed, the hydrothermal bomb was cooled to room temperature. Upon cooling, the carbon quantum dots were dialyzed for purification. Dialysis was carried using a 1 kDa molecular weight cutoff dialysis tube for at least 24 h covered from light. The purified product was lyophilized for long-term storage.
Characterization of Na–Citrate CQDs.
Light absorbance measurements were performed using in a Genesys 10s UV–vis Spectrophotometer (Thermo Scientific). Fluorescence data were gathered on a DM45 Olis spectrofluorimeter equipped with a water bath set to 24 °C. DLS was performed using a Malvern Zetasizer Nano ZS90. For DLS analysis, a refractive index of 2.42 and 1.450 was used for carbon quantum dot and protein size measurements, respectively. IR data were collected using a Thermo Scientific Nicolet iS5 spectrometer using pelletized samples in a KBr matrix.
For transmission electron microscopy analysis, samples were suspended in deionized water and sonicated for 5–10 min before adsorption to carbon-coated Cu grids (Electron Microscopy Sciences, Hatboro, PA) followed by negative staining with 2.5% uranyl acetate. Excess stain was adsorbed with Whatman #1 filter paper and grids were air-dried and viewed in a model H-7650 transmission electron microscope operated at 80 kV (Hitachi High-Technologies, Dallas, TX). Digital images were collected with an AMT XR 60 CCD camera system (Advanced Microscopy Techniques, Woburn, MA).
Pulse Chase Lysozyme Fibril Formation.
HEWL fibril formation was induced using previously described procedures.59 A 3 M Guanidine Hydrochloride solution in 20 mM phosphate buffer (pH 6.3) was used to prepare Lysozyme samples at a concentration of 2 mg/mL. Five different HEWL samples were prepared and incubated simultaneously for analysis, labeled as sample A, B, C, and D. Samples B, C, and D received a carbon quantum dot treatment (2 mg/mL) at different time points during the fibrilization process, whereas sample A was kept untreated as a control. Protein samples were then incubated in a MultiTherm temperature controlled vortexer at 50 °C under strong agitation (500 rpm). Lysozyme samples were aliquoted for analysis after 0, 1, 2, 3, and 4 h of incubation. Thioflavin T fluorescence (20 μM) was used to determine the fibril content of each sample in a DM45 Olis spectrofluorometer using 450 and 480 nm as excitation and emission wavelengths, respectively.
The reaction progress was also measured using DLS or by AFM to obtain diagnostic and quantitative information on the monomer-to-oligomer-to-fibril conversion of HEWL.
AFM Analysis.
For the topographical imaging using a scanning probe microscope (SPM), milli-Q H2O diluted CQD or HEWL solution was drop casted on a silicon substrate. The sample was dried. The topography of the CQD and/or HEWL sample was recorded with SPM (NTEGRA, NT-MDT) using a Si cantilever in intermittent contact mode.
Cell Viability Assay.
Human neuroblastoma cells (SH-SY5Y; ATCC, Manassas, VA) were grown in a preprepared cell-culture medium (DMEM/F-12, 398225 SIGMA) and supplemented with 10% fetal bovine serum. Cells were maintained by incubation at 37 °C with 5% carbon dioxide in a T75 flask as described elsewhere.46,47 All experiments were performed by seeding the cells into a 24-well plate and incubated until confluency was achieved. Once confluent, the cells were then treated with the synthesized CQD (8 μg/mL to 25 mg/mL). Alongside CQD treatment, an untreated, vehicle (H2O), and Control (H2O2) groups were incubated for 24 h before flow cytometric analysis.
To determine whether the apoptotic pathway was triggered by the treatment of the CQD, the confluent 24-well plate were harvested, washed with cold PBS, and centrifuged. Then, the cell pellets of each well were gently resuspended by using 100 μL of binding buffer added with Annexin V-FITC and PI reagents following the manufacturer’s instructions (Beckman Coulter). Subsequently, cells were incubated for 20 min in the dark, followed by the addition of ice-cold binding buffer to the suspension. This mixture was then gently homogenized and analyzed immediately via flow cytometry (Gallios, Beckman Coulter) using the F1 and FL2 detectors. Approximately 10 000 events (cells) were collected and analyzed using Kaluza software (Beckman Coulter). The percentage of apoptotic cells was defined as the sum of both early and late stages of apoptosis, Annexin V-FITC positive, whereas the PI-positive events were defined to be necrotic cells.46,47
ACKNOWLEDGMENTS
M.N. acknowledges support from NIH 1SC3 GM111200 01A1. We also acknowledge R25GM069621–18 and the RISE Program for supporting E.D.G.; NIDA-R25DA033613 and the SMART-MIND program for supporting A.M.L.-V.; and, support to J.A. from the National Institute of General Medical Sciences of the National Institutes of Health under award number UL1GM118970. The authors thank Olivia Delgado-Fernandez and Drs Skye Fortier and Surya Chava for help with the IR and AFM, respectively and, Dr. Peter Cooke (NMSU) for assistance with the TEM studies. The authors thank Gabriela Henriquez for suggestions and mentorship during the realization of this research project. They also thank Alejandra Maria Gomez Chavez and Elkin Penaloza, for their help acquiring, discussing, and interpreting the FT-IR spectrum presented here. M.N. thanks Gyan Narayan for help with the references. We acknowledge Drs. Reagan Turley and Jose Hernandez for their assistance with the instrumentation used for the spectroscopy measurements that were performed. We are grateful to Dr. Armando Varela and the staff members of the Cellular Characterization and Biorepository Core Facility of the Border Biomedical Research Center at The University of Texas at El Paso (UTEP). This facility was supported by Grant #’s 2G12MD007592, 5G12MD007592, and 5U54MD007592 from the National Institute on Minority Health and Health Disparities (NIMHD), a component of the National Institutes of Health (NIH).
Footnotes
Complete contact information is available at: https://pubs.acs.org/10.1021/acsanm.0c02792
The authors declare no competing financial interest.
Contributor Information
Erick Damian Guerrero, Department of Chemistry and Biochemistry, The University of Texas at El Paso (UTEP), El Paso, Texas 79968, United States.
Angela Marlene Lopez-Velazquez, Department of Biological Sciences, Bioscience Research Building, Border Biomedical Research Center, the Cellular Characterization and Biorepository Core Facility, The University of Texas at El Paso (UTEP), El Paso, Texas 79968, United States.
Jyoti Ahlawat, Department of Chemistry and Biochemistry, The University of Texas at El Paso (UTEP), El Paso, Texas 79968, United States.
Mahesh Narayan, Department of Chemistry and Biochemistry, The University of Texas at El Paso (UTEP), El Paso, Texas 79968, United States.
REFERENCES
- (1).Jucker M; Walker LC Pathogenic Protein Seeding in Alzheimer Disease and Other Neurodegenerative Disorders. Ann. Neurol 2011, 70, 532–540. [DOI] [PMC free article] [PubMed] [Google Scholar]
- (2).Chan SWS; Yau J; Ing C; Liu K; Farber P; Won A; Bhandari V; Kara-Yacoubian N; Seraphim T; Chakrabarti N; Kay L; Yip C; Pomes R; Sharpe S; Houry W Mechanism of Amyloidogenesis of a Bacterial AAA+ Chaperone. Structure 2016, 24, 1095–1109. [DOI] [PubMed] [Google Scholar]
- (3).Singh P; Bhat R Binding of Noradrenaline to Native and Intermediate States During the Fibrillation of α-Synuclein Leads to the Formation of Stable and Structured Cytotoxic Species. ACS Chem. Neurosci 2019, 10, 2741–2755. [DOI] [PubMed] [Google Scholar]
- (4).Chiti F; Dobson CM Protein Misfolding, Amyloid Formation, and Human Disease: A Summary of Progress Over the Last Decade. Annu. Rev. Biochem 2017, 86, 27–68. [DOI] [PubMed] [Google Scholar]
- (5).Sreeprasad S; Narayan M Nanoscopic Portrait of an Amyloidogenic Pathway Visualized Through Tip-Enhanced Raman Spectroscopy. ACS Chem. Neurosci 2019, 10, 3343–3345. [DOI] [PubMed] [Google Scholar]
- (6).Sreenivasan S; Narayan M Learnings from Protein Folding Projected onto Amyloid Misfolding. ACS Chem. Neurosci 2019, 10, 3911–3913. [DOI] [PubMed] [Google Scholar]
- (7).Lipiec E; Perez-Guaita D; Kaderli J; Wood BR; Zenobi R Direct Nanospectroscopic Verification of the Amyloid Aggregation Pathway. Angew. Chem 2018, 130, 8655–8660. [DOI] [PubMed] [Google Scholar]
- (8).Ahmed M; Davis J; Aucoin D; Sato T; Ahuja S; Aimoto S; Elliott J; Nostrand W; Smith S Structural Conversion of Neurotoxic Amyloid-Beta(1–42) Oligomers to Fibrils. Nat. Struct. Mol. Biol 2010, 17, 561–567. [DOI] [PMC free article] [PubMed] [Google Scholar]
- (9).Sengupta U; Nilson AN; Kayed R The Role of Amyloid-β Oligomers in Toxicity, Propagation, and Immunotherapy. Ebiomedicine 2016, 6, 42–49. [DOI] [PMC free article] [PubMed] [Google Scholar]
- (10).Campioni S; Mannini B; Zampagni M; Pensalfini A; Parrini C; Evangelisti E; Relini A; Stefani M; Dobson C; Cecchi C; Chiti F A Causative Link Between the Structure of Aberrant Protein Oligomers and Their Toxicity. Nat. Chem. Biol 2010, 6, 140–147. [DOI] [PubMed] [Google Scholar]
- (11).Freir DB; Nicoll AJ; Klyubin I; Panico S; Mc Donald JM; Risse E; Asante E; Farrow M; Sessions R; Saibil H; Clarke A; Rowan M; Walsh D; Collinge J Interaction between Prion Protein and Toxic Amyloid β Assemblies can be Therapeutically Targeted at Multiple Sites. Nat. Commun 2011, 2, 336. [DOI] [PMC free article] [PubMed] [Google Scholar]
- (12).Goure WF; Krafft GA; Jerecic J; Hefti F Targeting the Proper Amyloid-Beta Neuronal Toxins: A Path Forward for Alzheimer’s Disease Immunotherapeutics. Alzheimer’s Res. Ther 2014, 6, 42. [DOI] [PMC free article] [PubMed] [Google Scholar]
- (13).Schroeter S; Khan K; Barbour R; Doan M; Chen M; Guido T; Gill D; Basi G; Schenk D; Seubert P; Games D Immunotherapy Reduces Vascular Amyloid-Beta in PDAPP Mice. J. Neurosci 2008, 28, 6787–6793. [DOI] [PMC free article] [PubMed] [Google Scholar]
- (14).Paravastu AK; Qahwash I; Leapman RD; Meredith SC; Tycko R Seeded Growth of Beta-Amyloid Fibrils from Alzheimer’s Brain-Derived Fibrils Produces A Distinct Fibril Structure. Proc. Natl. Acad. Sci. U. S. A 2009, 106, 7443–7448. [DOI] [PMC free article] [PubMed] [Google Scholar]
- (15).Tyck R Solid-State NMR Studies of Amyloid Fibril Structure. Annu. Rev. Phys. Chem 2011, 62, 279–299. [DOI] [PMC free article] [PubMed] [Google Scholar]
- (16).Streets AM; Sourigues Y; Kopito RR; Melki R; Quake SR Simultaneous Measurement of Amyloid Fibril Formation by Dynamic Light Scattering and Fluorescence Reveals Complex Aggregation Kinetics. PLoS One 2013, 8, E54541. [DOI] [PMC free article] [PubMed] [Google Scholar]
- (17).Vadukul DM; Al-Hilaly YK; Serpell LC Methods for Structural Analysis of Amyloid Fibrils in Misfolding Diseases. Methods Mol. Biol 2019, 1873, 109–122. [DOI] [PubMed] [Google Scholar]
- (18).Ke PC; Pilkington EH; Sun Y; Javed I; Kakinen A; Peng G; Ding F; Davis T Mitigation of Amyloidosis with Nanomaterials. Adv. Mater 2020, 32, 1901690. [DOI] [PMC free article] [PubMed] [Google Scholar]
- (19).Devi S; Gupta RK; Paul AK; Kumar V; Sachdev A; Gopinath P; Tyagi S Ethylenediamine Mediated Luminescence Enhancement of Pollutant Derivatized Carbon Quantum Dots for Intracellular Trinitrotoluene Detection: Soot to Shine. RSC Adv 2018, 8, 32684–32694. [DOI] [PMC free article] [PubMed] [Google Scholar]
- (20).Mahmoudi M; Akhavan O; Ghavami M; Rezaee F; Ghiasi SM A. Graphene Oxide Strongly Inhibits Amyloid Beta Fibrillation. Nanoscale 2012, 4, 7322–7325. [DOI] [PubMed] [Google Scholar]
- (21).Castro E; Cerón MR; Garcia AH; Kim Q; Etcheverry-Berríos A; Morel MJ; Diaz-Torres R; Qian W; Martinez Z; Mendez L; Perez F; Santoyo C; Gimeno-Munoz R; Esper R; Gutierrez D; Varela-Ramirez A; Aguilera R; Llano M; Soler M; Aliaga-Alcalde N; Echegoyen L Correction: A New Family of Fullerene Derivatives: Fullerene–Curcumin Conjugates for Biological and Photovoltaic Applications. RSC Adv 2019, 9, 2379–2379. [DOI] [PMC free article] [PubMed] [Google Scholar]
- (22).Molaei MJ Carbon Quantum Dots and Their Biomedical and Therapeutic Applications: A Review. RSC Adv 2019, 9, 6460–6481. [DOI] [PMC free article] [PubMed] [Google Scholar]
- (23).Sachdev A; Gopinath P Green Synthesis of Multifunctional Carbon Dots from Coriander Leaves and Their Potential Application as Antioxidants. Sensors and Bioimaging Agents Analyst 2015, 140, 4260–4269. [DOI] [PubMed] [Google Scholar]
- (24).Yang S-T; Cao L; Luo PG; Lu F; Wang X; Wang H; Meziani M; Liu Y; Qi G; Sun Y-P Carbon Dots for Optical Imaging in Vivo. J. Am. Chem. Soc 2009, 131, 11308–11309. [DOI] [PMC free article] [PubMed] [Google Scholar]
- (25).Kim D; Yoo JM; Hwang H; Lee J; Lee SH; Yun SP; Park MJ; Lee M; Choi S; Kwon SH; Lee S; Kwon S; Kim S; Park YJ; Kinoshita M; Lee Y; Shin S; Paik S; Lee SJ; Lee S; Hong BH; Ko HS Graphene Quantum Dots Prevent α-Synucleinopathy in Parkinson’s Disease. Nat. Nanotechnol 2018, 13, 812–818. [DOI] [PMC free article] [PubMed] [Google Scholar]
- (26).Wang M; Sun Y; Cao X; Peng G; Javed I; Kakinen A; Davis T; Lin S; Liu J; Ding F; Ke PC Graphene Quantum Dots against Human IAPP Aggregation and Toxicity in Vivo. Nanoscale 2018, 10, 19995–20006. [DOI] [PMC free article] [PubMed] [Google Scholar]
- (27).Yao K; Lv X; Zheng G; Chen Z; Jiang Y; Zhu X; Wang Z; Cai Z Effects of Carbon Quantum Dots on Aquatic Environments: Comparison of Toxicity to Organisms at Different Trophic Levels. Environ. Sci. Technol 2018, 52, 14445–14451. [DOI] [PubMed] [Google Scholar]
- (28).Xu Q; Cai W; Li W; Sreeprasad TS; He Z; Ong W-J; Li N Two-Dimensional Quantum Dots: Fundamentals, Photoluminescence Mechanism and Their Energy and Environmental Applications. Mater. Today Energy 2018, 10, 222–240. [Google Scholar]
- (29).Lu Y; Wang J; Yuan H; Xiao D Separation of Carbon Quantum Dots on a C18 Column by Binary Gradient Elution Via HPLC. Anal. Methods 2014, 6, 8124–8128. [Google Scholar]
- (30).Li X; Rui M; Song J; Shen Z; Zeng H Carbon and Graphene Quantum Dots for Optoelectronic and Energy Devices: A Review. Adv. Funct. Mater 2015, 25, 4929–4947. [Google Scholar]
- (31).Liu J-H; Cao L; Lecroy GE; Wang P; Meziani MJ; Dong Y; Liu Y; Luo P; Sun Y-P Carbon “Quantum” Dots for Fluorescence Labeling of Cells. ACS Appl. Mater. Interfaces 2015, 7, 19439–19445. [DOI] [PubMed] [Google Scholar]
- (32).Dehghani A; Ardekani SM; Hassan M; Gomes VG Collagen Derived Carbon Quantum Dots for Cell Imaging in 3D Scaffolds Via Two-Photon Spectroscopy. Carbon 2018, 131, 238–245. [Google Scholar]
- (33).Koppel K; Tang H; Javed I; Parsa M; Mortimer M; Davis T; Lin S; Chaffee A; Ding F; Ke PC Elevated Amyloidosis of Human IAPP and Amyloid Beta by Lipopolysaccharide and Their Mitigation by Carbon Quantum Dots. Nanoscale 2020, 12, 12317–12328. [DOI] [PMC free article] [PubMed] [Google Scholar]
- (34).Cao A; Hu D; Lai L Formation of Amyloid Fibrils from Fully Reduced Hen Egg White Lysozyme. Protein Sci 2004, 13, 319–324. [DOI] [PMC free article] [PubMed] [Google Scholar]
- (35).Arnaudov LN; De Vries R Thermally Induced Fibrillar Aggregation of Hen Egg White Lysozyme. Biophys. J 2005, 88, 515–526. [DOI] [PMC free article] [PubMed] [Google Scholar]
- (36).Shioi S; Imoto T; Ueda T Analysis of the Early Stage of the Folding Process of Reduced Lysozyme Using All Lysozyme Variants Containing A Pair of Cysteines. Biochemistry 2004, 43, 5488–5493. [DOI] [PubMed] [Google Scholar]
- (37).Muttathukattil AN; Singh PC; Reddy G Role of Disulfide Bonds and Topological Frustration in the Kinetic Partitioning of Lysozyme Folding Pathways. J. Phys. Chem. B 2019, 123, 3232–3241. [DOI] [PubMed] [Google Scholar]
- (38).Booth DR; Sunde M; Bellotti V; Robinson CV; Hutchinson WL; Fraser PE; Hawkins P; Dobson C; Radford S; Blake C; Pepys M Instability, Unfolding and Aggregation of Human Lysozyme Variants Underlying Amyloid Fibrillogenesis. Nature 1997, 385, 787–793. [DOI] [PubMed] [Google Scholar]
- (39).Xue C; Lin TY; Chang D; Guo Z Thioflavin T as an Amyloid Dye: Fibril Quantification, Optimal Concentration and Effect on Aggregation. R. Soc. Open Sci 2017, 4, 160696. [DOI] [PMC free article] [PubMed] [Google Scholar]
- (40).Arya S; Kumari A; Dalal V; Bhattacharya M; Mukhopadhyay S Appearance of Annular Ring-Like Intermediates During Amyloid Fibril Formation from Human Serum Albumin. Phys. Chem. Chem. Phys 2015, 17, 22862–22871. [DOI] [PubMed] [Google Scholar]
- (41).Guo Y; Wang Z; Shao H; Jiang X Hydrothermal Synthesis of Highly Fluorescent Carbon Nanoparticles from Sodium Citrate and Their Use for the Detection of Mercury Ions. Carbon 2013, 52, 583–589. [Google Scholar]
- (42).Yang H; Long Y; Li H; Pan S; Liu H; Yang J; Hu X Carbon Dots Synthesized by Hydrothermal Process Via Sodium Citrate and NH4HCO3 for Sensitive Detection of Temperature and Sunset Yellow. J. Colloid Interface Sci 2018, 516, 192–201. [DOI] [PubMed] [Google Scholar]
- (43).Permatasari FA; Aimon AH; Iskandar F; Ogi T; Okuyama K Role of C-N Configurations in the Photoluminescence of Graphene Quantum Dots Synthesized by A Hydrothermal Route. Sci. Rep 2016, 6, 21042. [DOI] [PMC free article] [PubMed] [Google Scholar]
- (44).Vernaglia BA; Huang J; Clark ED Guanidine Hydrochloride Can Induce Amyloid Fibril Formation from Hen Egg-White Lysozyme. Biomacromolecules 2004, 5, 1362–1370. [DOI] [PubMed] [Google Scholar]
- (45).Kabiraj P; Marin JE; Varela-Ramirez A; Narayan M an 11-Mer Amyloid Beta Peptide Fragment Provokes Chemical Mutations and Parkinsonian Biomarker Aggregation in Dopaminergic Cells: A Novel Road Map for “Transfected” Parkinson’s. ACS Chem. Neurosci 2016, 7, 1519–1530. [DOI] [PubMed] [Google Scholar]
- (46).Kabiraj P; Marin JE; Varela-Ramirez A; Zubia E; Narayan M Ellagic Acid Mitigates SNO-PDI Induced Aggregation of Parkinsonian Biomarkers. ACS Chem. Neurosci 2014, 5, 1209–1220. [DOI] [PubMed] [Google Scholar]
- (47).Henríquez G; Mendez L; Varela-Ramirez A; Guerrero E; Narayan M Neuroprotective Effect of Brazilin on Amyloid β (25–35)-Induced Pathology in a Human Neuroblastoma Model. ACS Omega 2020, 5, 13785–13792. [DOI] [PMC free article] [PubMed] [Google Scholar]
- (48).Iravani S; Varma RS Green Synthesis, Biomedical and Biotechnological Applications of Carbon and Graphene Quantum Dots. A Review Environ. Chem. Lett 2020, 18, 1–25. [DOI] [PMC free article] [PubMed] [Google Scholar]
- (49).Yang S-T; Wang X; Wang H; Lu F; Luo PG; Cao L; Meziani M; Liu J-H; Liu Y; Chen M; Huang M; Sun Y-P Carbon Dots as Nontoxic and High-Performance Fluorescence Imaging Agents. J. Phys. Chem. C 2009, 113, 18110–18114. [DOI] [PMC free article] [PubMed] [Google Scholar]
- (50).Linse S Monomer-Dependent Secondary Nucleation in Amyloid Formation. Biophys. Rev 2017, 9, 329–338. [DOI] [PMC free article] [PubMed] [Google Scholar]
- (51).Ghaeidamini M; Bernson D; Sasanian N; Kumar R; Esbjorner EK Graphene Oxide Sheets and Quantum Dots Inhibit α-Synuclein Amyloid Formation by Different Mechanisms. Nanoscale 2020, 12, 19450–19460. [DOI] [PubMed] [Google Scholar]
- (52).Holubova M; Konefal R; Moravkova Z; Zhigunov A; Svoboda A; Svoboda A; Pop-Georgievski O; Hromadkova J; Groborz O; Stepanek P; Hruby M Carbon Nanospecies Affecting Amyloid Formation. RSC Adv 2017, 85, 53887–53898. [Google Scholar]
- (53).Agholme L; Lindström T; Kågedal K; Marcusson J; Hallbeck M an in Vitro Model for Neuroscience: Differentiation of SH-SY5Y Cells into Cells with Morphological and Biochemical Characteristics of Mature Neurons. J. Alzheimer’s Dis 2010, 20, 1069–1082. [DOI] [PubMed] [Google Scholar]
- (54).Xicoy H; Wieringa B; Martens GJM The SH-SY5Y Cell Line in Parkinson’s Disease Research: A Systematic Review. Mol. Neurodegener 2017, 12, 10. [DOI] [PMC free article] [PubMed] [Google Scholar]
- (55).Jämsä A; Hasslund K; Cowburn RF; Bäckström A; Vasänge M The Retinoic Acid and Brain-Derived Neurotrophic Factor Differentiated SH-SY5Y Cell Line as a Model for Alzheimer’s Disease-Like Tau Phosphorylation. Biochem. Biophys. Res. Commun 2004, 319, 993–1000. [DOI] [PubMed] [Google Scholar]
- (56).Meierhofer F; Dissinger F; Weigert F; Jungclaus J; Müller-Caspary K; Waldvogel SR; Resch-Genger U; Voss T Citric Acid Based Carbon Dots with Amine Type Stabilizers: Ph-Specific Luminescence and Quantum Yield Characteristics. J. Phys. Chem. C 2020, 124, 8894–8904. [Google Scholar]
- (57).Xu Q; Pu P; Zhao J; Dong C; Gao C; Chen Y; Chen J; Liu Y; Zhou H Preparation of Highly Photoluminescent Sulfur-Doped Carbon Dots for Fe(iii) Detection. J. Mater. Chem. A 2015, 3, 542–546. [Google Scholar]
- (58).Hoan BT; Tam PD; Pham V-H Green Synthesis of Highly Luminescent Carbon Quantum Dots from Lemon Juice. J. Nanotechnol 2019, 2019, 1–9. [Google Scholar]
- (59).Vernaglia BA; Huang J; Clark ED Guanidine Hydrochloride Can Induce Amyloid Fibril Formation from Hen Egg-White Lysozyme. Biomacromolecules 2004, 5, 1362–1370. [DOI] [PubMed] [Google Scholar]