

Summary
How early events in effector T cell (TEFF) subsets tune memory T cell (TMEM) responses remains incompletely understood. Here, we systematically investigated metabolic factors in fate determination of TEFF and TMEM cells using in vivo pooled CRISPR screening, focusing on negative regulators of TMEM responses. We found that amino acid transporters Slc7a1 and Slc38a2 dampened the magnitude of TMEM differentiation, in part through modulating mTORC1 signaling. By integrating genetic and systems approaches, we identified cellular and metabolic heterogeneity among TEFF cells, with terminal effector differentiation associated with establishment of metabolic quiescence and exit from the cell cycle. Importantly, Pofut1 (protein-O-fucosyltransferase-1) linked GDP-fucose availability to downstream Notch-Rbpj signaling, and perturbation of this nutrient signaling axis blocked terminal effector differentiation but drove context-dependent TEFF proliferation and TMEM development. Our study establishes that nutrient uptake and signaling are key determinants of T cell fate and shape the quantity and quality of TMEM responses.
Keywords: T cell memory, metabolic heterogeneity, in vivo pooled CRISPR screening, terminal effector cell, immunometabolism, Notch, GDP-fucose, nutrient signaling, cell cycle exit
Graphical Abstract

Metabolic changes associated with amino acid transport and nutrient signaling regulate the fate of effector T cell populations and the generation of memory T cell responses.
Introduction
CD8+ T cells are critical for adaptive immune responses to pathogens and tumors. CD8+ T cell immunity is dependent upon the differentiation into effector (TEFF) and memory (TMEM) cells, with both effector function and longevity important for success of T cell-mediated immunotherapies (Crompton et al., 2014). TEFF cells are divided into two distinct subsets: short-lived effector or terminal effector cells (TE; KLRG1+CD127− or KLRG1hiCD127lo) and memory precursor cells (MP; KLRG1−CD127+ or KLRG1loCD127hi) (Joshi et al., 2007; Omilusik and Goldrath, 2019). TE cells undergo terminal differentiation followed by cell death after the resolution of infection, while the MP subset preserves the survival fitness to become long-lived TMEM cells (Joshi et al., 2007; Kaech et al., 2003). Moreover, certain KLRG1+ cells persist following the resolution of infection, lose KLRG1 expression and become TMEM cells (Herndler-Brandstetter et al., 2018), highlighting the complex regulation of TEFF heterogeneity and TMEM generation.
TMEM cells are also subdivided into different populations based on surface markers, tissue localization and function. Circulating TMEM cells include central memory (TCM) and effector memory (TEM) cells (Jameson and Masopust, 2018; Omilusik and Goldrath, 2019). TCM cells preferentially localize to secondary lymphoid organs and have superior proliferative capacity to trigger better recall response (Wherry et al., 2003a), whereas TEM cells provide rapid protective immunity (Omilusik and Goldrath, 2019). Tissue-resident memory (TRM) (Jameson and Masopust, 2018; Omilusik and Goldrath, 2019) and peripheral memory (TPM) subsets (Gerlach et al., 2016) are also described. The heterogeneity of TMEM cells and the relationship to early events in effector responses remain incompletely understood, especially about the inhibitory pathways involved that may serve as functional targets to boost protective immunity in diverse disease contexts.
Cellular metabolism controls T cell activation and differentiation (Chapman et al., 2020; Geltink et al., 2018). While ex vivo analysis of genetic mutants or in vitro culture systems provide important insight into T cell metabolic reprogramming, there are considerable differences for central carbon metabolism during T cell activation in vivo and in vitro (Ma et al., 2019). There is an urgent need to apply integrative and unbiased approaches to establish the functionally-relevant metabolic pathways for T cell immunity in vivo. In particular, whether metabolic intervention in vivo can enhance the quantity and quality of TMEM responses is largely unknown.
Here, we used in vivo pooled CRISPR-Cas9 screening to uncover the metabolic regulators of MP and TE fate decisions in the acute lymphocytic choriomeningitis Armstrong strain (LCMV) infection model, leading to the identification of several nutrient signaling pathways that inhibit the quantity or quality of TMEM responses. Specifically, amino acid transporters, including Slc7a1 and Slc38a2, controlled the magnitude of TMEM generation and persistence by stimulating mTORC1 signaling. We also uncovered a terminally differentiated TEFF subset (called TE′, KLRG1hiCXCR3loCD127lo), as well as cells in an intermediate, less differentiated state (called TINT, CXCR3hiCD127lo, to distinguish from TE′ and MP cells). The differentiation of TE′ from TINT cells was associated with reduced proliferative and metabolic activities, and depended upon a nutrient signaling axis composed of GDP-fucose biosynthesis, Pofut1 (protein O-fucosyltransferase 1; encoded by Pofut1) and Notch–Rbpj signaling. Pofut1 deficiency invigorated TEFF cells to exhibit sustained proliferation and metabolic activation, resulting in an expansion of the TEFF pool and generation of potent TMEM cells for enhanced in vivo killing capacity and antitumor immunity. Collectively, we establish nutrient signaling processes as important drivers for CD8+ T cell fate decisions in vivo, and reveal mechanisms and targets for enhancing the quantity and quality of TMEM responses and protective immunity against pathogens and tumors.
Results
In vivo CRISPR screening of metabolic regulators for CD8+ T cell fate decisions
To systemically uncover metabolic factors orchestrating MP and TE fate choices (Joshi et al., 2007), we designed an in vivo CRISPR-Cas9 screening system by transducing a pooled guide RNA (gRNA) library of 3,017 metabolism-associated genes (Wei et al., 2019) into CD8+ T cells expressing Cas9 and P14-transgenic TCRs specific for LCMV gp3333–41 epitope (Pircher et al., 1989), followed by LCMV infection (Figure 1A). A total of 284 and 6 genes were upregulated and downregulated in MP versus TE cells, respectively [|log2 fold change or FC| (MP/TE) > 0.58 (equivalent to FC of 1.5); adjusted P < 0.05] (Figure 1B and Table S1). Among these, loss of Pten or Foxo1 reduced the MP/TE ratio, consistent with their roles in promoting TMEM generation (Hand et al., 2010; Hedrick et al., 2012). Targeting Zc3h12a (also called Regnase-1) also decreased MP over TE generation, mainly due to the increased TE/input ratio, consistent with its negative role in TEFF responses (Matsushita et al., 2009; Uehata et al., 2013; Wei et al., 2019). Conversely, deficiency of known negative regulators for TMEM formation, including Tet2 (Carty et al., 2018; Fraietta et al., 2018), Acaca (Endo et al., 2019) and PI3K family members Pik3cg, Pik3cd and Pik3r5 (Hedrick et al., 2012; Saravia et al., 2020), increased the MP/TE ratio. Thus, our in vivo CRISPR screening captures metabolic regulators of CD8+ T cell fate decisions.
Figure 1. Amino acid transporters restrict memory precursor differentiation.

(A) Diagram of the screening system. MP, memory precursor cells; TE, terminal effector cells. (B) Scatter plot of gene enrichment representing log2 FC (MP/input) versus log2 FC (TE/input). The significantly enriched (light red) and depleted (light blue) genes between MP and TE cells are highlighted. sgNTC (generated by averaging 1,000 non-targeting control gRNAs) is indicated in green. Selective known negative and positive genes are highlighted. FC, fold change. (C) Scatterplot of ratio of MP versus TE cells from the initial screening (x-axis) and validation experiments (y-axis) at day 7.5 post-infection (p.i.). The linear regression and R-squared (R2) analyses are shown. (D–H) Flow cytometry (left) and quantification (right) of the proportions of splenic MP and TE (D), CXCR3hiCD27hi (E), CD62L+ (F), or active caspase-3+ cells (G) and the expression of Bcl2 in sgNTC- and the indicated sgRNA-transduced P14 cells from dual-color transfer system. (I) Quantification of TEFF cell survival after in vitro culture with IL-2 for overnight. Data are from one (B), or compiled from at least two (C–I) independent experiments, with ≥ 8 (D–F and H) or 3 (G) biological replicates per group. *P < 0.05, **P < 0.01, and ***P < 0.001; two-tailed unpaired Student’s t-test (I) or two-tailed paired Student’s t-test (D–H). Data are presented as mean ± s.e.m.
To validate our experimental system, we used an in vivo dual-color transfer system, where P14 cells transduced with either non-targeting control (NTC) single-guide RNA (sgNTC; GFP+) or gene-specific sgRNA (Ametrine+) were mixed at a 1:1 ratio, followed by transfer to the same host and LCMV infection. The different fluorescent proteins did not affect expression profiles of KLRG1 and CD127 or cell accumulation (Figures S1A and S1B). Also, targeting metabolic genes not enriched in our screening (e.g. Hk1, Glut3 and Glut6; Table S1) did not alter MP/TE ratios (data not shown). Of note, we achieved high efficiency of genome editing (73–96%) for all target genes tested (Figure S1C). We chose Acaca and Pten as representative known negative and positive regulators of MP formation, respectively, for further validation. Targeting Acaca increased the MP/TE ratio (Figures S1D and S1E) and proportions of TMEM-associated CXCR3hiCD27hi and CD62L+ cells (Kaech and Cui, 2012; Omilusik and Goldrath, 2019) at day 7.5 post-infection (p.i.) (Figure S1E), whereas deletion of Pten had the opposite effects (Figures S1F–S1H). Altogether, we have established a robust experimental system to investigate physiological regulators of TE and MP generation in vivo.
Loss of amino acid transporters promotes MP formation
Negative regulators for TMEM generation and function remain incompletely understood. We therefore applied a stringent cut-off criteria [adjusted P (MP/TE) < 0.05; log2 FC (MP/TE) > 0.58; and log2 FC (MP/input) > 0.58] to enrich for potential negative regulators of MP formation, which resulted in a total of 30 candidate genes (Table S2). We observed an increased MP/TE ratio upon targeting each of the 7 most-enriched novel regulators (Slc7a1, Pofut1, Slc38a2, Pde12, Fdft1, Elovl1 and Dhrs7b) (Figure S1I), indicative of enhanced MP formation. Also, our initial screening and validation experiments showed strong correlation (R2 = 0.73; Figure 1C), further verifying the faithful discovery of candidate genes for T cell fate choices.
Among the top-enriched negative regulators of MP formation were Slc7a1 (a cationic amino acid transporter) and Slc38a2 (a neutral amino acid transporter), whose roles in TMEM formation and function remain unknown. Slc7a1- or Slc38a2-null cells showed high gene editing efficiency (Figure S1C), with reduced target gene expression at the protein (Figure S1J) or mRNA (Figure S1K) levels. Slc7a1- or Slc38a2-null cells had an increased MP/TE ratio (Figure 1D), associated with increased proportions of CXCR3hiCD27hi (Figure 1E) and CD62L+ cells (Figure 1F). Further, co-deletion of Slc7a1 and Slc38a2 drastically promoted the MP/TE ratio as compared to the individual deletion (Figure S1L). Consistent with the pro-memory features, Slc7a1-null cells had a reduced frequency of active caspase-3+ cells (Figure 1G) but increased expression of antiapoptotic protein Bcl2 (Figure 1H), as well as less cell death upon ex vivo culture with IL-2 (Figure 1I). Further, Slc7a1-null OT-1 cells [specific for ovalbumin (Hogquist et al., 1994)] showed increases in the MP/TE ratio and proportions of CXCR3hiCD27hi and CD62L+ cells upon infection with Listeria monocytogenes expressing OVA (Lm-OVA) (Figure S1M). These data collectively reveal the strong effects of amino acid transporters at restricting MP differentiation.
Amino acid transporters tune TMEM responses by promoting mTORC1 activity
To determine the role of Slc7a1 and Slc38a2 in TMEM formation and function, we monitored the temporal dynamics of cellularity in the peripheral blood. Despite the modest reduction of TEFF numbers at day ~ 7.5 p.i., loss of Slc7a1 or Slc38a2 significantly improved cell persistence during the contraction (days 8–30 p.i.) and memory phases (> day 30 p.i.) (Figure 2A). Importantly, deletion of Slc7a1 increased the frequency and cellularity of TMEM cells in multiple organs examined (Figure 2B). Slc7a1 deficiency also increased TCM (CD62L+) and, to a lesser extent, TEM (CD62L−) subsets (Figure S2A), in line with increased CD62L expression at the effector stage (Figure 1F). We further validated the improved cell accumulation (Figure S2B) and TMEM persistence (Figure S2C) using OT-1 cells and the Lm-OVA system. Thus, Slc7a1 deletion confers a quantitative advantage for TMEM formation, and this was also maintained upon re-challenge at days 30–50 after primary infection with LCMV clone 13, a virulent strain of LCMV whose clearance depends upon functional TMEM cells (Rutishauser et al., 2009; Wherry et al., 2003b) (Figures 2C and 2D). To further test the functional effects, we performed an in vivo killing assay (Kim et al., 2014) (Figure 2C). Host mice containing Slc7a1- or Slc38a2-null P14 cells more readily cleared antigen-pulsed splenocytes than those with control cells (Figure 2E), indicating the increased cytotoxic function of TMEM cells upon deletion of these amino acid transporters.
Figure 2. Amino acid transporters tune TMEM responses by promoting mTORC1 activation.

(A) Longitudinal analysis of P14 cell numbers in the blood (single-color transfer system). Red or green asterisks indicate statistical significance between sgNTC- and sgSlc7a1- or sgNTC- and sgSlc38a2-transduced cells, respectively. PBMCs, peripheral blood mononuclear cells. (B) Flow cytometry (left) and quantification of the number (right) of P14 cells from single-color transfer system. Fold changes between the groups in different organs are shown above the bar graphs. pLN, peripheral lymph nodes; BM, bone marrow. Total, the sum of donor-derived cells in pLN, spleen, BM, liver and lung. (C) Diagrams of the recall and in vivo killing assays. (D) Flow cytometry (left) and quantification of the frequency (middle) and number (right) of donor-derived P14 cells after the secondary challenge. (E) Flow cytometry (left) and quantification (right) of the frequency of gp33-pulsed splenocytes (CTVlo) post in vivo killing assay. CTV, CellTrace Violet. (F and G) Flow cytometry (F; left) and quantification (F; right and G) of mean fluorescence intensity (MFI) of S6 phosphorylation (pS6). (H) Flow cytometry (left) and quantification of the ratio of MP versus TE cells (right). (I and J) Longitudinal analysis of relative fold change (normalized to ‘spike’ cells) of P14 cells in the blood (I). Quantification of the relative fold change (normalized to ‘spike’ cel ls) in indicated sgRNA-transduced P14 cells (J). Data are representative of two (A), or compiled from at least two (B and D–J) independent experiments, with ≥ 4 (A, B, H, and I), 7 (D), 9 (E), or ≥ 8 (F, G, and J) biological replicates per group. *P < 0.05, **P < 0.01, and ***P < 0.001; NS, not significant; two-tailed unpaired Student’s t-test (A, B, D, E, and H–J) or two-tailed paired Student’s t-test (F and G). Data are presented as mean ± s.e.m.
To explore whether Slc7a1-null TMEM cells mount better secondary responses on a per cell basis, we isolated P14 cells from mice at days 30–50 after primary infection and transferred equal numbers of sgNTC- or sgSlc7a1-transduced cells into naïve hosts, followed by LCMV infection (Figure 2C). At day 6 after secondary infection, there were comparable numbers of Slc7a1-null secondary effector P14 cells (Figure S2D). Similar results were obtained using Slc7a1-null OT-1 cells and the Lm-OVA infection system (Figure S2E). Thus, Slc7a1 deficiency enhances memory responses by selectively augmenting the quantity of TMEM cells, albeit not function on a per cell basis.
We next investigated the mechanism by which Slc7a1 and Slc38a2 restrict TMEM formation. The amino acid response (AAR) is induced upon amino acid deprivation to promote de novo amino acid synthesis and uptake (Kilberg et al., 2012), and, accordingly, loss of Slc7a1 or Slc38a2 increased expression of AAR pathway genes, including Asns (Asparagine synthetase) and Trib3 (Tribbles homolog 3) (Figures S2F and S2G). Additionally, Ass1 (Argininosuccinate synthase 1), which mediates de novo arginine synthesis (Haines et al., 2011), was selectively upregulated in Slc7a1- but not Slc38a2-null cells (Figure S2H), in line with the role of Slc7a1 as an arginine transporter (Verrey et al., 2004). Moreover, we generated T cell-specific deletion of Slc38a2 mice (Figure S2I) and found that glutamine uptake and abundance (Figures S2J and S2K) were reduced in TCR-stimulated Slc38a2-deficient cells, supporting the role of Slc38a2 as a glutamine transporter.
Amino acids promote mTORC1 signaling (Huang et al., 2020), whose activity was dynamically regulated in LCMV-specific T cells peaking at day 3 p.i., as measured by phosphorylation of S6 (pS6) (Figure S2L). Accordingly, surface expression of Slc7a1 was upregulated during the initial cell divisions (Figure S2M). Upon deletion of Slc7a1 or Slc38a2, mTORC1 activity was greatly reduced at day 3 p.i. (Figures 2F and 2G). Co-deletion of Slc7a1 with Nprl3, a component of GATOR1 complex that suppresses nutrient-mediated mTORC1 signaling (Saxton and Sabatini, 2017), partially blocked the increased MP/TE ratio at day 7.5 p.i. (Figure 2H), as well as the increased formation and cellularity of Slc7a1-null TMEM cells (Figures 2I and 2J), indicating the functional effects of altered mTORC1 signaling at shaping TMEM generation. Together, these results indicate that the magnitude of TMEM generation and long-term persistence can be reprogrammed by targeting amino acid transporters, in part via modulating mTORC1 activity.
Pofut1 deficiency simultaneously promotes TEFF and TMEM responses
The success of immunotherapy relies on both effective TEFF responses and T cell persistence (Crompton et al., 2014). We next aimed to identify molecules whose deletion endows T cells with both effector function and longevity. One such candidate molecule was Pofut1, a glycosyltransferase that adds fucose to its target proteins (Schneider et al., 2017). sgPofut1-transduced cells had efficient gene editing (Figure S1C) and reduced protein levels of Pofut1 (Figure S3A). Pofut1-null cells had increased MP/TE ratio, associated with normal MP and reduced TE frequencies at day 7.5 p.i. (Figures 1C and 3A). However, deletion of Pofut1 enhanced the cellularity of TEFF cells and GzmB expression levels in all organs examined (Figures 3B and 3C). The number of IFN-γ+TNF-α+ cells was also increased in the absence of Pofut1 (Figure 3D), albeit with slightly reduced frequency (Figure S3B). Thus, Pofut1 deletion reduced TE frequency, but improved accumulation of TEFF cells with cytotoxic features. We next examined the role of Pofut1 in TMEM formation. By days 35–50 p.i., Pofut1-null cells were more abundant than control cells in multiple organs (Figure 3E). The increased TMEM accumulation was not simply secondary to the numeric differences at the effector stage, as the relative proportion of Pofut1-deficient cells compared to control (‘spike’) P14 cells modestly increased over time (compare total cellularity in Figures 3B and 3E). Also, Pofut1-deficient P14 cells had better survival after ex vivo culture with IL-2 (Figure 3F). Therefore, Pofut1 deficiency enhances TEFF responses and TMEM accumulation.
Figure 3. Pofut1 deficiency simultaneously promotes TEFF and TMEM responses.
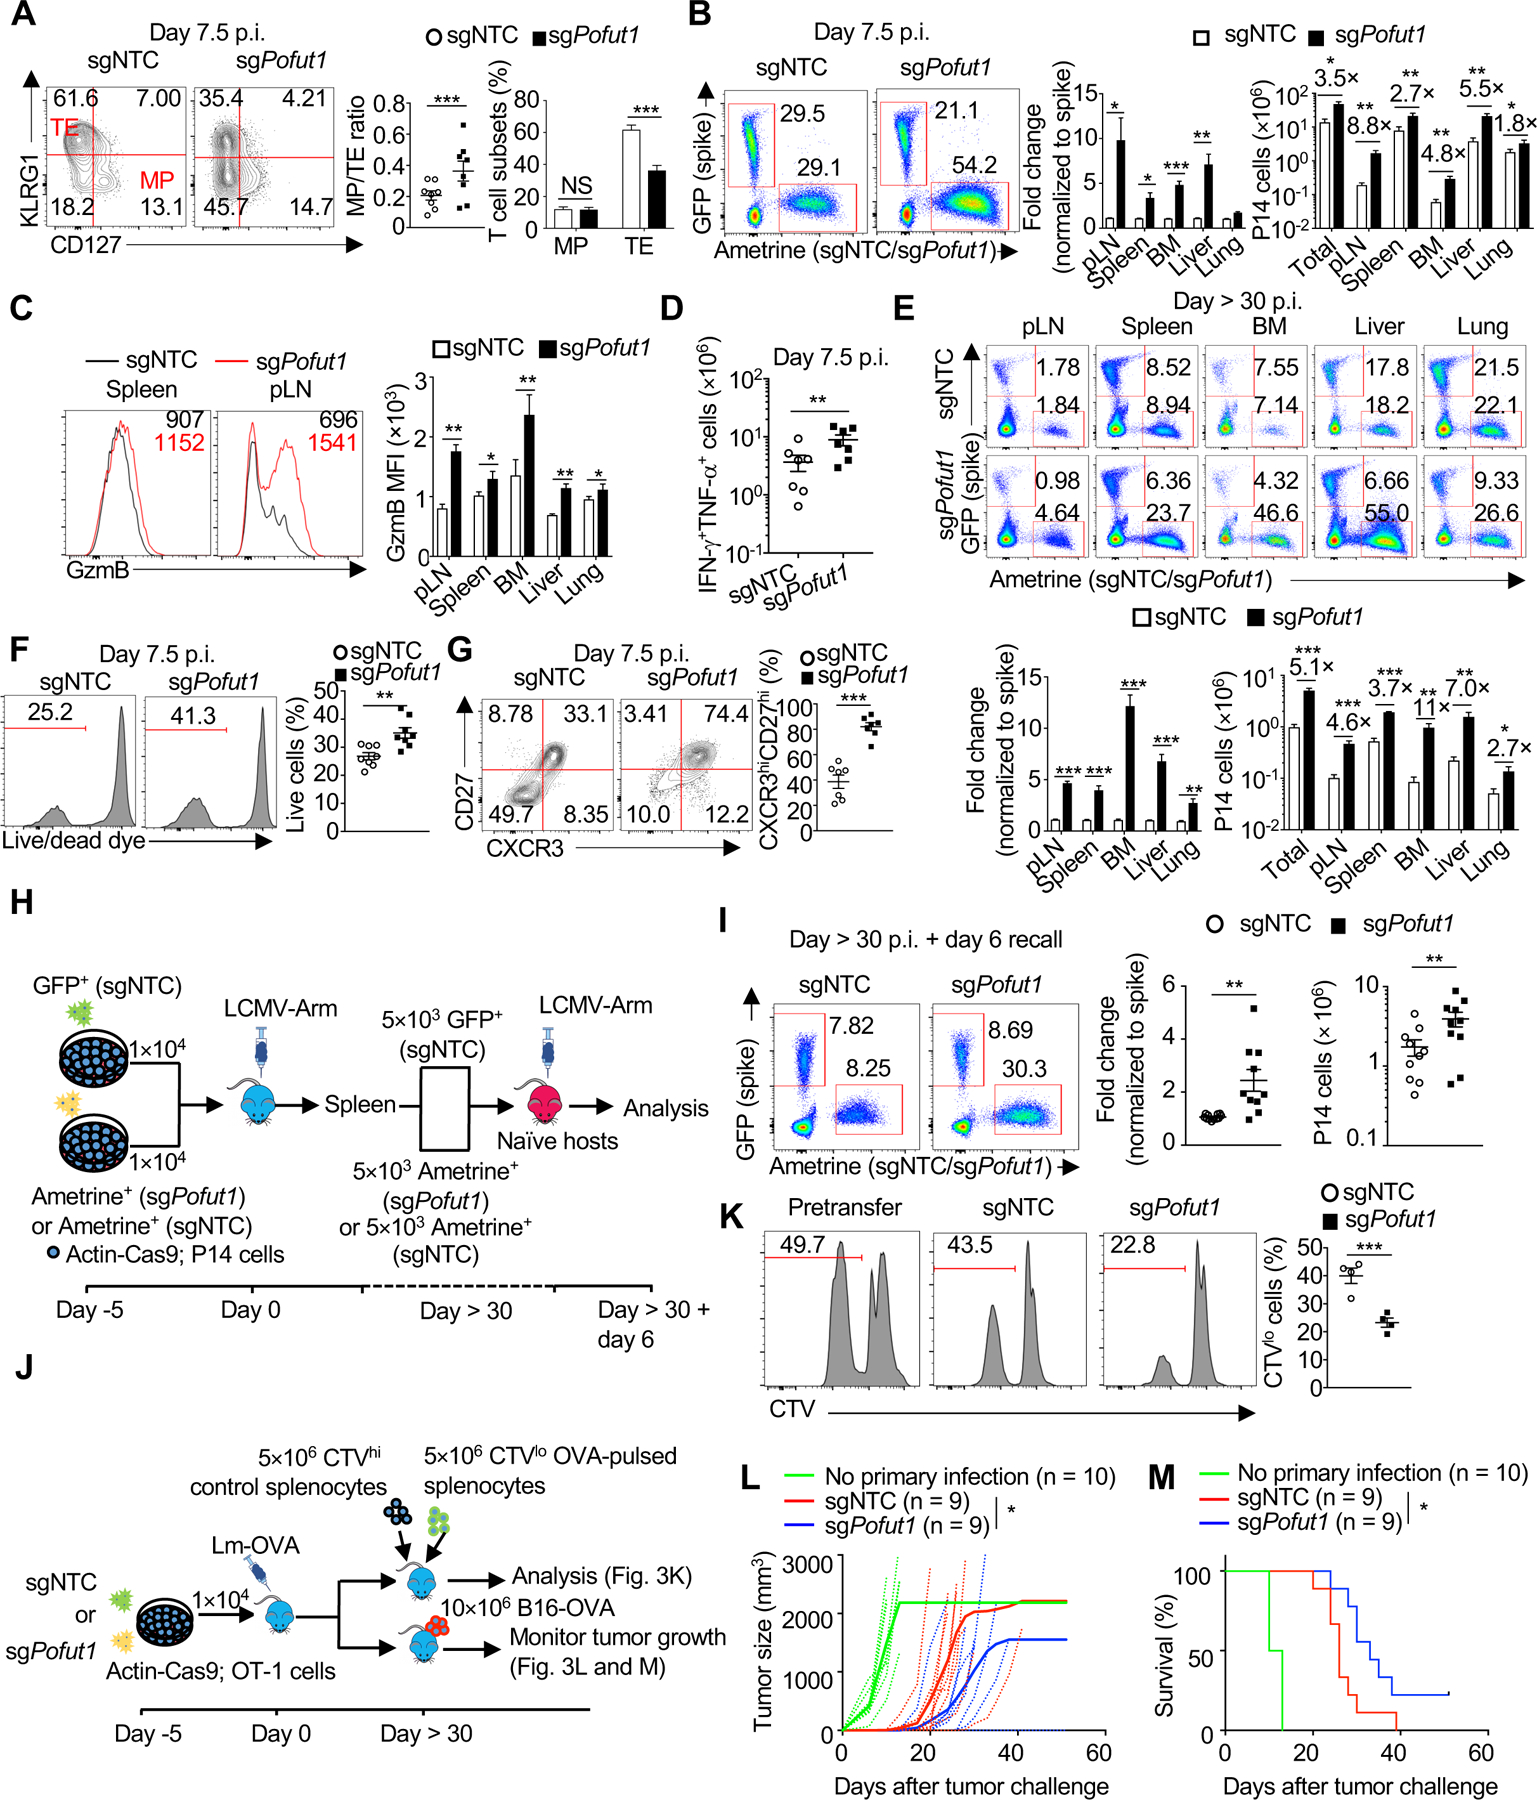
(A) Flow cytometry (left) and quantification of the MP/TE ratio (middle) and proportions (right) of MP and TE cells. (B) Flow cytometry (from spleen; left) and quantification of the relative fold change (normalized to ‘spike’ cells; middle) and nu mber (right) of indicated P14 cells. pLN, peripheral lymph nodes; BM, bone marrow. (C) Flow cytometry (left) and quantification (right) of mean fluorescence intensity (MFI) of GzmB. (D) Quantification of IFN-γ+TNF-α+ CD8+ T cell number after gp33 peptide stimulation. (E) Flow cytometry (upper) and quantification of the relative fold change (normalized to ‘spike’ cells; lower left) and number (lower right) of P14 cells at day > 30 p.i. Total, the sum of donor-derived cells in pLN, spleen, BM, liver and lung. (F) Flow cytometry (left) and quantification (right) of the frequency of live TEFF cells after overnight culture with IL-2. (G) Flow cytometry (left) and quantification of CXCR3hiCD27hi cell frequency (right). (H) Diagram of the recall assay used in (I). (I) Flow cytometry (left) and quantification of the relative fold change (normalized to ‘spike’ cel ls; middle) and number (right) of the indicated P14 cells in the spleen after LCMV re-challenge. (J) Diagram of the in vivo killing and tumor re-challenge assays used in (K–M). (K) Flow cytometry (left) and quantification (right) of the frequency of OVA-pulsed splenocytes (CTVlo) after in vivo killing assay. CTV, CellTrace Violet. (L and M) Tumor size (L) and percent survival of tumor-bearing mice (M). Data are from one (L and M), representative of two (K), or compiled from at least two (A–G and I) independent experiments, with 8 (A and F), 7 (B, C, and G), 6 (D), 5 (E), ≥ 10 (I), 4 (K), or ≥ 9 (L and M) biological replicates per group. *P < 0.05, **P < 0.01, and ***P < 0.001; two-tailed paired Student’s t-test (A–G), two-tailed unpaired Student’s t-test (I and K), two-way analysis of variance (ANOVA) (L), or log-rank (Mantel–Cox) test (M). Data are presented as mean ± s.e.m.
See also Figure S3.
We then examined expression of TEFF and TMEM signature molecules. Pofut1 deletion increased the frequency of CXCR3hiCD27hi cells at the effector (Figure 3G) and memory (Figure S3C) stages following LCMV infection. At the memory stage, Pofut1-deficient P14 TMEM cells also had a modestly higher frequency of KLRG1– CD127+ cells at the expense of KLRG1+CD127– cells (Figure S3D). Further, loss of Pofut1 improved recall capacity post-secondary infection (Figures 3H and 3I). Thus, despite extensive expansion at the effector stage, Pofut1 deficiency enhances acquisition of TMEM-associated properties.
In the Lm-OVA infection model, we also observed the increased MP/TE ratio and CXCR3hiCD27hi cell frequency at the effector stage (Figure S3E), as well as enhanced TMEM formation due to Pofut1 deficiency (Figure S3F). In the in vivo killing assay (Figure 3J), host mice containing Pofut1-null OT-1 cells more readily cleared antigen-pulsed splenocytes (Figure 3K). Moreover, upon rechallenge with OVA-bearing B16 melanoma at one month after Lm-OVA infection (Figure 3J), mice containing sgPofut1-transduced OT-1 cells displayed superior tumor control, as well as improved overall survival, compared to those given sgNTC-transduced cells (Figures 3L and 3M). Thus, loss of Pofut1 simultaneously promotes TEFF responses and TMEM functions in multiple systems, associated with increased protective immunity.
Conditional deletion of Pofut1 promotes both TEFF and TMEM responses
Next, we generated mice with T cell-specific deletion of Pofut1 by crossing mice bearing floxed Pofut1 alleles (Shi and Stanley, 2003) with those expressing Cre recombinase under the Cd4 promotor (Cd4CrePofut1fl/fl). The cellularity of conventional CD4+ T cells from these mice was undisrupted, while there was a moderate increase in the frequency of regulatory T (Treg) cells (Figures S3G and S3H). In contrast, Cd4CrePofut1fl/fl mice had reduced frequency and number of CD8+ T cells (Figures S3G and S3H). Upon challenge with LCMV, there was an increased MP/TE ratio and frequency of CXCR3hiCD27hi cells in the endogenous antigen-specific gp33+ CD8+ T cells from Cd4CrePofut1fl/fl mice (Figures S3I and S3J). To explore cell-intrinsic effects, we generated mixed bone marrow (BM) chimeras by reconstituting Rag1−/− mice with BM cells from CD45.1+ ‘spike’ and CD45.2+ wild-type (WT) or Cd4CrePofut1fl/fl mice. After LCMV infection, we observed an increased MP/TE ratio and CXCR3hiCD27hi cell frequency in CD45.2+ Pofut1-deficient CD8+ T cells (Figure S3K). Moreover, the frequencies of CD45.2+gp33+ cells (Figure S3L), CD45.2+IFN-γ+ and CD45.2+TNF-α+ cells (Figure S3M) were all elevated in the absence of Pofut1. Thus, conditional deletion of Pofut1 enhances TEFF responses in a cell-intrinsic manner.
We next examined TMEM accumulation and recall capacity. Antigen-specific CD8+ T cells from Cd4CrePofut1fl/fl mice were more abundant at days 40–50 p.i. than WT counterparts (Figure S3N). Upon secondary transfer and re-challenge, Pofut1-deficient gp33+ TMEM cells gave rise to more secondary effector cells (Figure S3O). Thus, genetic loss of Pofut1 promotes both TEFF and TMEM responses, supporting the conclusions from sgRNA-mediated targeting of Pofut1.
Pofut1 deletion promotes early effector programing and context-dependent proliferation
To determine the molecular basis, we performed transcriptome analysis of sgNTC- and sgPofut1-transduced P14 cells at day 7.5 p.i. Differential expression analysis revealed that TE-associated genes (Klrg1, S1pr5, Cx3cr1, Gzma and Zeb2) were depleted in Pofut1-null cells (Figure 4A). Accordingly, gene set enrichment analysis (GSEA) showed that TE signature was among the most downregulated CD8+ T cell-related gene sets in Pofut1-null cells (Figure S4A and Table S3), whereas MP signature was modestly enriched (Figure S4A and Table S3). Moreover, genes upregulated in day 6 versus day 10 TEFF cells (Pearce et al., 2009), which we called “early-effector-like” signatures, were among the top 10 CD8+ T cell-related gene sets enriched in Pofut1-null cells (Figure S4B and Table S3), suggesting a gene expression program associated with early effector function. Consistent with this notion, cell cycle-related pathways were enriched in the absence of Pofut1 (Figure 4B), and accordingly, Pofut1-null cells had higher BrdU incorporation at day 6.5–7.5 p.i. (Figure 4C), indicating a suppressive effect of Pofut1 on TEFF proliferation.
Figure 4. Terminal differentiation of TEFF cells is dependent upon Pofut1 and associated with cell cycle exit.

(A) Differentially expressed genes in sgPofut1- compared to sgNTC-transduced P14 cells at day 7.5 post-infection (p.i.). Upregulated (orange) or downregulated (blue) transcripts [false discovery rate (FDR) < 0.05] are highlighted. Selective MP- and TE-associated genes are labelled. (B) Enrichment plots of cell cycle-related signatures. NES, normalized enrichment score. (C) Flow cytometry (left) and quantification (right) of BrdU incorporation. (D) UMAP plot of published scRNA-seq dataset of P14 cells at day 8 p.i. (Chen et al., 2019). Each dot corresponds to an individual cell. The number and frequency of cells in each of the color-coded clusters (clusters 1–3) are indi cated. (E) Violin plots of Klrg1, Cxcr3 or Il7r expression in clusters 1–3 from (D). (F) Gating str ategy (left) and quantification (right) of the proportions of TE′ (KLRG1hiCXCR3loCD127lo), MP (KLRG1loCXCR3hiCD127hi) and TINT (CXCR3hiCD127lo) cells among WT P14 cells. (G) PCA plot of TE′, MP and TINT cells [gating strategy in (F)] at day 7.5 p.i., with the percentage of variance shown. (H) Quantification of the relative frequency of BrdU+ cells in MP and TINT cells compared to TE′ cells. (I) Diagram of the in vivo differentiation assay (left), flow cytometry of KLRG1 versus CXCR3 expression (middle), and quantification of TINT, TE′ and CXCR3hiCD127hi cells (right). Only representative plots of KLRG1 versus CXCR3 are shown (TE′ population is largely defined by KLRG1hiCXCR3lo cells, which constitute ~ 95% of TE′ cells). (J) Quantification of TE′, MP and TINT cells in the indicated P14 cells. (K) UMAP plot of Pofut1-dependent signature [downregulated genes as identified in (A)] in published scRNA-seq dataset from (D) (Chen et al., 2019). (L) UMAP plot of scRNA-seq data from sgNTC- (in black, left) and sgPofut1- (in red, right) transduced P14 cells (from dual-color transfer system) at day 7 p.i. Gray shadow indicates location of all cells; the number of analyzed cells in each group is indicated. (M) UMAP plot of the expression of Klrg1 (left), Cxcr3 (middle) and Il7r (right) in scRNA-seq data described in (L). (N) Flow cytometry of KLRG1 versus CXCR3 expression (left) and quantification (right) of TE′ cells in the in vivo differentiation assay similar as (I), except for the use of both wild-type and Pofut1-null TINT groups as the pretransfer cells. Data are from one (A, B, D, E, G, and K–M), representative of two (C, H, and N), or compiled from at least two (I, J, and N) independent experiments, with ≥ 4 (A, C, G, H, and I), 17 (F), 11 (J), or 3 (L and N) biological replicates per group. *P < 0.05, **P < 0.01, and ***P < 0.001; NS, not significant; two-tailed paired Student’s t-test (C), two-tailed unpaired Student’s t-test (I, J, and N), or one-way analysis of variance (ANOVA) (F and H). Data are presented as mean ± s.e.m.
See also Figures S4–S6 and Tables S3–S6.
We next analyzed the role of Pofut1 in other contexts of T cell proliferation. We found that T cells from Cd4CrePofut1fl/fl mice had largely normal Ki-67 expression, except for a modest reduction of Ki-67+ population in Treg cells (Figure S4C). Naïve CD8+ T cells isolated from these mice also showed undisturbed proliferation after TCR stimulation (Figure S4D). Next, we examined the proliferation by CellTrace Violet (CTV) dilution of sgNTC- or sgPofut1-transduced P14 cells and observed a similar extent of proliferation at day 2.5 p.i. (Figure S4E), a time point when CXCR3 expression was already upregulated to denote functional effects of Pofut1 deletion (Figure S4F). Analysis of cellularity at later time points indicated that the number of Pofut1-null cells remained unchanged at day 5 p.i. (Figure S4G), but these cells showed a significantly higher extent of BrdU incorporation at day 4.5–5 (Figure S4H). By day 7.5 p.i., Pofut1-null cells had higher cellularity than control cells (Figure S4G). Therefore, instead of acting as a general cell cycle inhibitor, Pofut1 restricts cell proliferation in a temporal and context-dependent manner.
Terminal differentiation of TEFF cells is dependent upon Pofut1 and associated with cell cycle exit
Compared to MP cells, TE cells were enriched with cell cycle-related signatures and had increased BrdU incorporation day 6.5–7.5 p.i. (Figures S4I and S4J), in line with the notion that TE cells exit the cell cycle later than MP cells during tail-end of the effector stage (Sarkar et al., 2008). Indeed, reduction of TE population is frequently associated with impaired TEFF expansion (Restifo and Gattinoni, 2013). Thus, the findings that Pofut1-null TEFF cells had reduced TE-associated features but increased proliferation were intriguing, as they suggest that TEFF cells can exhibit lower TE-associated programming but higher proliferation in certain contexts. To this end, we analyzed a public scRNA-seq dataset of P14 cells from LCMV-infected mice at day 8 p.i. (Chen et al., 2019), and unsupervised clustering partitioned the cells into three clusters in UMAP (Uniform Manifold Approximation and Projection) plot (McInnes et al., 2018) (Figure 4D). Preranked GSEA (Korotkevich et al., 2019) indicated that cluster 1, which accounted for ~15% of the entire population (Figure 4D), was enriched for TE signatures and those with low abundance in naïve T cells (“naïve-cell low”) (Figure S5A and Table S4), suggesting that this cluster contains more terminally differentiated cells (called TE′). Cluster 2 was enriched for MP and naïve- and TMEM-associated signatures (denoted as the MP population), whereas cluster 3, which constituted ~75% of total cells (Figure 4D), was enriched for “early-effector-like” signatures (Figure S5A), likely existing in an intermediate stage (called TINT). Next, differential expression analysis for surface proteins across each cluster (Figure S5B) revealed that the combined use of Klrg1, Cxcr3 and Il7r (encodes CD127) was able to largely define these three clusters, with TE′ cells marked by Klrg1hiCxcr3loIl7rlo, MP by Klrg1loCxcr3hiIl7rhi and TINT by Klrg1int/loCxcr3hiIl7rlo (Figure 4E). Also, flow cytometry analysis identified these cells at approximately similar frequencies as inferred by scRNA-seq (Figure 4F), namely TE′ (KLRG1hiCXCR3loCD127lo), MP (KLRG1loCXCR3hiCD127hi, same as KLRG1−CD127+ cells described above, all of which expressed CXCR3) and TINT (CXCR3hiCD127lo) cells. Similarly, we identified these cells in LCMV- and Lm-OVA-infected mice that respectively received adoptive transfer of in vitro-preactivated P14 cells (Figure S5C) and OT-1 cells (Figure S5D), indicating the presence of these distinct TEFF subsets in various contexts.
Transcriptome profiling of TE′, MP and TINT cells at day 7.5 p.i. revealed distinct patterns in principal component analysis (PCA) plot (Figure 4G). Population-specific gene signatures were then generated that identified 402, 111 and 84 genes uniquely expressed by TE′, MP and TINT cells, respectively (Table S5). Functional enrichment analysis identified the expected enrichments of TE and MP-associated signatures in TE′ and MP cells, respectively (Figure S5E), while TINT cells were enriched for “early-effector-like” T EFF signatures (Figure S5E), confirming these cells in a transitional state. Moreover, GSEA showed enrichment of cell cycle-related Hallmark signatures in TINT cells (Figure S5F), which was validated by their elevated BrdU incorporation at day 6.5–7.5 p.i. (Figure 4H). To explore the developmental trajectory of these cells, we applied RNA velocity analysis (La Manno et al., 2018) and identified a directional flow from TINT towards TE′ cells (Figure S5G). Then, we sorted TINT and TE′ cells at day 7.5 p.i. and transferred them to infection-matched recipients (Figure 4I). At day 4 after transfer (which is day 11.5 p.i.), a substantial proportion of TINT cells converted to TE′ or CXCR3hiCD127hi cells that contain MP cells, whereas TE′ cells retained their cell state (Figure 4I), validating the directionality from TINT to TE′ cells.
We next determined the effects of Pofut1 deletion on these populations. Strikingly, the TE′ population was nearly absent in Pofut1-null P14 cells, whereas TINT cells were accumulated (Figure 4J), suggesting a possible role for Pofut1 in driving TINT to TE′ transition. Using several unbiased analyses to test this hypothesis, we first found that the Pofut1-dependent signature [downregulated genes in Pofut1-null cells described in Figure 4A (Table S6)] was mainly expressed by the TE′ population (Figure 4K). Second, Pofut1-null cells upregulated TINT- and MP-specific genes but downregulated TE′-specific genes (Figure S6A). Third, GSEA verified that Pofut1-null cells selectively downregulated TE′ signature, but upregulated TINT and MP signatures (Figure S6B). Fourth, in scRNA-seq of sgNTC- and sgPofut1-transduced P14 cells at day 7 p.i., UMAP visualization showed that Pofut1-null cells were markedly underrepresented in specific regions (lower left regions; Figure 4L) marked by high expression of Klrg1 and low expression of Cxcr3 and Il7r (Figure 4M), but co-existed with sgNTC-transduced P14 cells in the remaining regions (Figure 4L), indicative of a selective blockade of TE′ differentiation in the absence of Pofut1. Also, the TE′ signature was enriched in regions where sgNTC-transduced P14 cells were more abundant than sgPofut1-transduced cells (Figure S6C). These unbiased bioinformatic analyses collectively point to a role of Pofut1 in promoting TE′ generation. We validated this notion in an adoptive transfer experiment, where Pofut1-deficient TINT cells showed a complete blockade in differentiation into TE′ cells (Figure 4N). Thus, Pofut1 drives the differentiation of cells from a highly proliferative, TEFF-poised state (TINT) into a less proliferative, terminal TEFF population (TE′). Deletion of Pofut1 blocked TE′ formation and instead promoted TEFF cells to acquire properties of both TINT and MP cells, which enables TEFF cells to undergo extensive proliferation in a less differentiated state during the tail-end of antigen clearance.
Pofut1 coordinates the chromatin state and metabolic regulation
To determine the underlying mechanisms, we sorted sgNTC- or sgPofut1-transduced P14 cells from the dual-color transfer system at day 5 p.i., when Pofut1-deficient P14 cells started to exhibit a proliferative advantage (Figure S4H), and performed ATAC-seq and transcriptome analyses. Pofut1-sufficient and -deficient P14 cells had a largely distinct chromatin landscape in ATAC-seq (Figure S6D). Transcription factor motif enrichment (Figure 5A) and footprinting (Figure 5B) analyses (Karmaus et al., 2019) predicted the increased occupancy of AP-1 family factors (Jun, JunB, Fosl1, Fos and BATF) in Pofut1-null P14 cells (Figure 5A). In contrast, Pofut1-null cells showed lower binding of Sp1/KLF family factors (Figures 5A and S6E), consistent with these factors being negative rheostats for T cell proliferation (Yamada et al., 2009).
Figure 5. Pofut1 coordinates the chromatin state and metabolic regulation.

(A) Motif enrichment analysis of ATAC-seq data in sgPofut1- versus sgNTC-transduced cells at day 5 post-infection (p.i.). Top upregulated and downregulated motifs are indicated. (B) Footprinting analysis of selective AP1 family transcription factors in ATAC-seq data from (A). (C) Top-enriched Hallmark gene sets in sgPofut1- compared to sgNTC-transduced P14 cells. (D) Flow cytometry (upper) and quantification (lower) of relative mean fluorescence intensity (MFI) of mTORC1-associated markers [S6 phosphorylation (pS6), cell size (FSC-A), CD71 or CD98] in the indicated P14 cells. (E) Flow cytometry (upper) and quantification (lower) of relative MFI of Mitotracker, TMRM and CellROX in the indicated P14 cells. (F and G) Seahorse metabolic flux analysis of oxygen consumption rate (OCR) (F, left) and quantification of basal OCR (F, right) and extracellular acidification rate (ECAR; G) in the indicated P14 cells. Oligo, oligomycin; FCCP, carbonyl cyanide-p-trifluoromethoxyphenylhydrazon; Rot, rotenone. (H and I) Flow cytometry (upper) and quantification (lower) of relative MFI of mTORC1-associated markers (H) and metabolic parameters (I). (J and K) Seahorse metabolic flux analysis of OCR (J, left) and quantification of basal OCR (J, right) and ECAR (K) in splenic TE′ and TINT cells. Data are from one (A–C), or compiled from at least two (D–K) independent experiments, with ≥ 4 (A–D, J, and K), ≥ 6 (E), ≥ 3 (F and G), 8 (H), or 10 (I) biological replicates per group. *P < 0.05, and ***P < 0.001; two-tailed paired Student’s t-test (D, E, H, and I) or two-tailed unpaired Student’s t-test (F, G, J, and K). Data are presented as mean ± s.e.m.
See also Figure S6.
In transcriptome analysis, GSEA revealed that Pofut1-null cells were enriched with metabolic pathways, including fatty acid metabolism, glycolysis, Myc and mTORC1 signaling (Huang et al., 2020) (Figure 5C). Indeed, loss of Pofut1 increased phosphorylation of S6 (Figure 5D), associated with augmented cell size and CD71 and CD98 expression, which are mTORC1-dependent signature events (Yang et al., 2013) (Figure 5D). We also observed increased staining for Mitotracker (indicative of mitochondrial mass), TMRM (mitochondrial membrane potential) and CellROX [intracellular reactive oxygen species (ROS)] in Pofut1-null P14 cells at day 5 p.i. (Figure 5E), indicative of enhanced mitochondrial fitness. Moreover, Potfut1-null cells had increased oxygen consumption rate [OCR, indicator of mitochondrial oxidative phosphorylation (OXPHOS)] and extracellular acidification rate (ECAR, indicator of aerobic glycolysis) at day 5 p.i. (Figures 5F and 5G). Thus, Pofut1 restrains mTORC1 signaling and metabolic programming at the effector phase of CD8+ T cell responses.
We next examined whether TINT to TE′ maturation is associated with altered mTORC1 and metabolic activities in WT cells. Compared to TINT cells, TE′ cells had reduced mTORC1-related parameters (cell size and CD71 and CD98 expression) (Figure 5H), and lower mitochondrial profiles (Figure 5I). Moreover, TE′ cells had decreased OCR and ECAR (Figures 5J and 5K), further revealing metabolic heterogeneity of TEFF cells. Therefore, TINT to TE′ maturation is accompanied by proliferative and metabolic inactivation.
GDP-fucose biosynthesis and Notch-Rbpj signaling are required for TINT to TE′ transition
To determine whether Pofut1 relies on its fucosyltransferase activity in T cell fate decisions, we generated a Pofut1 mutant (R245A) deficient in fucosyltransferase activity (Okajima et al., 2005). We found it unable to restore the TE′ differentiation defects caused by loss of Pofut1 (Figures S7A and 6A). As Pofut1 transfers the fucose group from GDP-fucose to target proteins (Schneider et al., 2017), we then designed gRNAs targeting Gmds (GDP-mannose 4,6-dehydratase) and Fcsk (fucose kinase) (Figure S7B), which are key enzymes required for de novo synthesis and salvage pathways for GDP-fucose biosynthesis, respectively (Schneider et al., 2017). While deletion of Gmds or Fcsk partially or minimally affected TE′ differentiation, respectively, co-deletion of both genes largely recapitulated the phenotypes caused by Pofut1 deletion, including abolished TE′ differentiation (Figure 6B), as well as increased T cell accumulation (Figure 6C), MP/TE ratio (Figure S7C) and mitochondrial features (Figure S7D). Deletion of Gmds or Fcsk resulted in a drastic reduction of intracellular GDP-fucose level (Figure S7E), indicating a role of GDP-fucose availability for TINT to TE′ transition.
Figure 6. Pofut1 links GDP-fucose biosynthesis and Notch signaling to promote TINT to TE′ transition.

(A and B) Representative plots of KLRG1 versus CXCR3 (left) and the quantification of TE′ cell frequency (right) in the indicated P14 cells. Pofut1 (R245A) mutant, fucosyltransferase inactive form of Pofut1. (C) Quantification of the relative fold change (normalized to ‘spike’ cells) of P14 cells transduc ed with the indicated sgRNAs. (D) Enrichment plot of Hallmark Notch signaling in sgPofut1- compared to sgNTC-transduced cells in the transcriptome profiling described in Figure 4A. (E) Volcano plot of differentially expressed transcripts in sgPofut1- compared to sgNTC-transduced P14 cells. (F and G) Real-time PCR analysis of Dtx1 expression (F) and immunoblot analysis of NICD expression (G) in the indicated P14 cells. (H-K) Quantification of the relative fold change (normalized to ‘spike’ cells) (H and J), flow cytometry of KLRG1 versus CXCR3 expression (I and K; left panels), and quantification of the frequencies of TINT, MP and TE′ cells (I and K; right panels) of P14 cells transduced with the indicated sgRNAs. Data are from one (D and E), or compiled from at least two (A–C, F, G, and H–K) independent experiments, with 6 (A and B), 9 (C), ≥ 4 (D–F and H– K), or 3 (G) biological replicates per group. **P < 0.01, and ***P < 0.001; NS, not significant; two-tailed unpaired Student’s t-test (A–C, F, H, and J) or two-tailed paired Student’s t-test (I and K). Data are presented as mean ± s.e.m.
See also Figure S7.
We next explored the downstream mechanism by which Pofut1 controls TINT to TE′ transition. Unbiased GSEA of the transcriptome of sgPofut1- and sgNTC-transduced cells revealed that Notch signaling was the only significantly (FDR < 0.05) downregulated Hallmark pathway in Pofut1-null cells (Figure 6D). Also, Dtx1, a Notch signaling target gene (Hsiao et al., 2009), was the most downregulated gene in Pofut1-null cells (Figures 6E and 6F). Further, Pofut1 deficiency reduced the protein level of Notch intracellular domain (NICD) (Figure 6G), the active form of Notch for transcriptional activation (Guruharsha et al., 2012). We next tested the regulation of Notch activity among different TEFF subpopulations. GSEA of the transcriptome of TE′, MP and TINT cells revealed that TE′ cells had higher levels of Notch signature than MP or TINT cells (Figure S7F). Importantly, perturbation of Notch signaling by co-deletion of Notch1 and Notch2 (Figures 6H and 6I) or targeting Rbpj (Figures 6J and 6K), the major transcriptional effector of Notch signaling (Guruharsha et al., 2012), recapitulated the phenotypes of Pofut1 deficiency, including the increased TEFF accumulation (Figures 6H and 6J) and reduced TE′ differentiation (Figures 6I and 6K). Moreover, consistent with the roles of GDP-fucose availability in mediating Pofut1 function, co-deletion of Gmds and Fcsk strongly decreased Dtx1 expression (Figure S7G). Therefore, Pofut1 links GDP-fucose synthesis to Notch-Rbpj signaling in TINT to TE′ differentiation.
Hyperactivation of Notch signaling promotes the TE′ program
Given the requirement of Notch signaling in TE′ differentiation, we explored whether its hyperactivation is sufficient to drive TE′ differentiation. In scRNA-seq analysis of cells with ectopic expression of empty vector control or NICD, UMAP visualization revealed distinct subpopulations, with NICD-overexpressing cells predominately accumulating in cluster 1 (Figures 7A and 7B), corresponding to Klrg1hiCxcr3loIl7rlo TE′ cells (Figure 7C). This notion was verified by flow cytometry analysis showing that NICD expression promoted TE′ differentiation (Figure 7D). Transcriptome analysis showed that NICD-overexpressing cells had higher TE′ signature (Figure 7E), but reduced “early-effector-like” (Figure 7F), proliferation and mTORC1-associated signatures (Figure 7G). Flow cytometry analysis validated that overexpression of NICD reduced cell proliferation (indicated by expression of Ki-67) and metabolic parameters, including Mitotracker, TMRM and CellROX (Figure 7H). Thus, hyperactivation of Notch signaling is sufficient to drive TE′ differentiation.
Figure 7. Overexpression of NICD promotes TE′ program.

(A–H) P14 cells were transduced with empty (‘spike’, Ametrine+) or NICD-expression vector (pMIGII-NICD, GFP+). (A) UMAP plot of scRNA-seq data showing the distribution of individual cells. (B) Left, unsupervised clustering analysis identified 7 clusters. Right, quantification of the relative proportions of cells in each cluster. (C) UMAP plot of Klrg1 (left), Cxcr3 (middle) or Il7r (right) expression in scRNA-seq data. Cluster 1 region containing TE′ cells is indicated. (D) Flow cytometry of KLRG1 versus CXCR3 expression (left) and quantification of the frequencies of TINT, MP and TE′ cells (right). (E–G) Transcriptome analysis of the indicated splenic P14 cells from the dual-color transfer system at day 7.5 p.i. (E and F) Enrichment plots of the indicated signatures. (G) GSEA of top 10 downregulated Hallmark signatures. (H) Quantification of relative mean fluorescence intensity (MFI) of Ki-67, Mitotracker, TMRM and CellROX. (I–K) P14 cells from Cd4CrePofut1wt or Cd4CrePofut1fl/fl mice were transduced with pMIGII or pMIGII-NICD and mixed with non-transduced Cd4CrePofut1wt P14 cells (‘spike’) at a 1:1 ratio and transferred to naïve mice that were subsequently infected with LCMV and analyzed at day 7.5 p.i. (I) Flow cytometry of KLRG1 versus CXCR3 expression (left) and quantification of TE′ cell frequency (right). (J) Quantification of the relative fold change (normalized to ‘spike’ cells). (K) Heatmap of differentially expressed genes among Cd4CrePofut1wt and Cd4CrePofut1fl/fl P14 cells with or without NICD-overexpression. Data are from one (A–C , E–G, and K), or compiled from at least two (D and H–J) independent experiments, with 4 (D– G) or 5 (I and J) biological replicates per group. **P < 0.01, and ***P < 0.001; NS, not significant; two-tailed unpaired Student’s t-test (I and J) or two-tailed paired Student’s t-test (D and H). Data are presented as mean ± s.e.m.
See also Figure S7.
Moreover, overexpression of NICD in Pofut1-null cells largely rectified the TE′ differentiation defect (Figure 7I), as well as the increased TEFF accumulation (Figure 7J). In transcriptome analysis, the altered transcriptome profiles (Figure S7H) and gene expression patterns (Figure 7K) between Pofut1-null and WT cells were substantially mitigated by NICD overexpression. These data collectively indicate that Pofut1 depends on Notch activity to direct T cell fate.
Discussion
Understanding antigen-specific CD8+ T cell fate decisions, and how to improve the quantity and quality of CD8+ T cells, are fundamental questions in T cell biology (Araki et al., 2009; Hamilton and Jameson, 2012). Here we, together with Chen et al. (companion manuscript) (Chen et al., 2020), demonstrated in vivo pooled CRISPR-based screenings as powerful tools to discover functionally-relevant regulators of CD8+ T cell fate decisions. Further, integration of systems approaches and experimental validations enabled the discovery of mechanisms that orchestrate the quantity and quality of TMEM responses. Our findings point to nutrient signaling including amino acid transporters and GDP-fucose-Pofut1-Notch axis as key processes for controlling the quantity and quality of TMEM responses, which may ultimately pave the way for innovative immunotherapies against infectious diseases and tumors.
Our study provided an integrative view of cellular metabolism in TE and MP fate choices. Specifically, we identified amino acid transporters, Slc7a1and Slc38a2, as crucial determinants of TMEM formation and accumulation, in part, by modulating mTORC1 signaling. Although asymmetric segregation of amino acid transporters during the first cell division is associated with memory- and effector-like CD8+ T cell fate decisions (Pollizzi et al., 2016; Verbist et al., 2016), studies testing the effects of genetic perturbation of amino acid transporters on TMEM responses are lacking. Our data showed that loss of certain amino acid transporters improved TMEM persistence and in vivo killing capacity, suggesting possible roles for nutrient uptake and sensing as crucial determinants of T cell fate decisions. Our study therefore implicates amino acid restriction as a possible means to promote TMEM responses, such as during vaccinations.
How metabolic pathways contribute to the dynamics and heterogeneity of T cell subsets is largely unclear. We had an unexpected discovery that the majority of TEFF cells at day 7–8 p.i., a stage when LCMV infection has been resolved, was in an intermediate state (which we called TINT). Transcriptomic analysis and experimental validations revealed that TE′, MP and TINT cells were in distinct functional state and that TINT cells can be the precursors of the more stable population of TE′ cells, thereby highlighting the plasticity and heterogeneity of the TEFF pool. Our identification of the transitional TINT cells is in line with the observations that certain KLRG1+ effector cells are able to lose KLRG1 expression (called exKLRG1 precursors) and contribute to all memory T cell lineages (Herndler-Brandstetter et al., 2018), and that early effector cells (TEE cells, KLRG1loCD127lo) possess the potential for development into both TE and MP cells (Lefrançois and Obar, 2010), although how exKLRG1 precursors and T EE cells retain their developmental plasticity remains unclear. Our model of TEFF heterogeneity, composed of MP, TE′ and TINT cells, may provide new insight into fate choices of the aforementioned TEFF cells, namely TINT cells, exKLRG1 precursors and TEE cells, which may share similar developmental trajectories. We propose that TEFF cells that receive GDP-fucose-Pofut1-Notch–Rbpj signaling can convert to the more terminal TE ′ cells, whereas the remaining cells without such a signal may retain their plasticity. In addition to understanding the developmental plasticity of TEFF subsets, the context-dependent role of Notch signaling is also an important question. While Pofut1 is implicated in regulating Notch receptors in non-immune cells (Okajima et al., 2005; Shi and Stanley, 2003), the finding that Notch signaling promotes terminal differentiation at the expense of cell cycle progression and anabolic programs is unexpected, considering the positive role of Notch signaling in proliferative responses during initial T cell activation (Adler et al., 2003; Amsen et al., 2015; Guy et al., 2013; Palaga et al., 2003). Our study thereby highlights context-dependent roles of Notch signaling in T cell responses that can be targeted for therapeutic benefits. The detailed biochemical basis by which Pofut1 regulates Notch signaling is a key question for future studies.
Recent emphasis has placed on how T cell heterogeneity affects the efficacy of immune checkpoint blockade (ICB) in the tumor microenvironment (TME) and during chronic infection. Several studies reveal that the TCF1+ precursor cells, but not terminally exhausted cells, are able to expand and respond to ICB therapy for cancer (Kallies et al., 2020). Also, TCF1+ precursor cells are the predominate population responding to anti-PD-1 blockade in chronic infections (He et al., 2016; Im et al., 2016). Here, we found that loss of Pofut1 promoted the expansion of cells in an intermediate state without compromising the long-term persistence of TMEM cells, which highlights mechanisms of precursor T cell reprogramming in the context of acute infection. To explore the possible role of Pofut1 in the TME and during chronic infection, we examined the correlation of Pofut1-dependent signature (Table S6) with patient survival datasets in The Cancer Genome Atlas (TCGA) and with the responsiveness to ICB therapies in public datasets (Sade-Feldman et al., 2018). We found that Pofut1-dependent signature was inversely correlated with survival of patients with certain tumors, and such signature in CD8+ T cells was also inversely correlated with the responsiveness to immunotherapies (our unpublished findings). Therefore, targeting Pofut1 may represent a unique opportunity with broad implications for T cell-mediated therapies for cancer.
Collectively, by integrating multiple functional immunogenomic approaches (e.g. in vivo pooled screening, transcriptome, ATAC-seq and scRNA-seq) and extensive experimental validations, our study provides a comprehensive view of how diverse nutrient signaling pathways negatively shape the quantity and quality of TMEM cells. Overall, we predict that the gain-of-function effects elicited by targeting these metabolic and nutrient signaling regulators will likely open new avenues for therapeutic invention of infection and cancer.
STAR*METHODS
RESOURCE AVAILABILITY
Lead Contact
Further information and requests for resources and reagents should be directed to and will be fulfilled by the Lead Contact, Hongbo Chi (Hongbo.Chi@STJUDE.ORG).
Materials Availability
This study did not generate new unique reagents.
Data and Code Availability
The accession number for the microarray, ATAC-seq and scRNA-seq data reported in this paper is GEO SuperSeries: GSE148681.
EXPERIMENTAL MODEL AND SUBJECT DETAILS
Mice
Mice, including both sexes, between the ages of 7–16 weeks were used for the study. We crossed Rosa26-Cas9 knockin mice (Platt et al., 2014) with OT-1 (Hogquist et al., 1994) or P14 transgenic mice (Pircher et al., 1989) to express Cas9 in antigen-specific CD8+ T cells. The Cas9 expressing mice were fully backcrossed to the C57BL/6 background. T cell-specific deletion of Pofut1 was generated by breeding Cd4Cre mice with Pofut1fl/fl mice (Stahl et al., 2008). To generate T cell specific deletion of Slc38a2, the Slc38a2tm1a(KOMP)Wtsi mutant mouse line (INFRAFRONTIER/EMMA) was bred with FLP1 recombinase transgenic mice (The Jackson Laboratory) and then with Cd4Cre mice. All mice were housed in specific-pathogen-free conditions in the Animal Resource Center at St Jude Children’s Research Hospital. Experiments and procedures were performed in accordance with the Institutional Animal Care and Use Committee of St. Jude Children’s Research Hospital.
Adoptive transfer, infection, and recall assays
For adoptive transfer of naïve P14 cells, a total of 5×10³ cells were transferred intravenously (i.v.) into naïve mice. For adoptive transfer of retrovirus-transduced antigen-specific cells, a total of 1− 2×10⁴ [for experiments at day ≥ 5 post-infection (p.i.)] or 1.5×10⁶ (for experiments at day 2.5 p.i.) were adoptively transferred i.v. into naïve mice. We applied both single-color and dual-color transfer systems to derive discrete functional effects, e.g. for therapeutic effects via the single-color and cell-intrinsic effects via the dual-color transfer systems. Specifically, in the single-color transfer system, antigen-specific T cells transduced with sgNTC or the indicated sgRNAs, with the same fluorescent reporter protein, were transferred to separate hosts. In the dual-color transfer system, cells transduced with the indicated sgRNAs marked by the expression of Ametrine, were mixed at a 1:1 ratio with those transduced with sgNTC labelled with GFP or mCherry (called ‘spike’), followed by adoptive tran sfer to the same host. To calculate fold changes in the dual-color transfer system, the proportion of sgRNA-transduced cells were divided by the proportion of ‘spike’ cells. In the panels that included the quantification of cell numbers from the dual-color transfer system, we presented the number of indicated sgRNA-transduced cells and that of the ‘spike’ cells (sgN TC) from the same host. Unless otherwise noted, for long-term experiments (day > 30 p.i.), antigen-specific cells were transferred to Cas9-expressing naïve hosts to minimize the potential rejection. For pathogen-induced infections, 2×10⁵ plaque-forming units (PFU) of LCMV Armstrong strain virus (LCMV-Arm) or 3×10⁴ clone-forming units (CFU) of Listeria monocytogenes expressing ovalbumin (OVA; Lm-OVA) were injected intraperitoneally or i.v., respectively. To evaluate TMEM recall responses, 5×10³ splenic TMEM cells were sorted and transferred to naïve C57BL/6 hosts and re-challenged with 2×10⁵ PFU of LCMV-Arm or 5×10⁴ CFU of Lm-OVA one day after TMEM transfer. The recall responses were analyzed at day 6 after re-challenge. In indicated experiments, 2×10⁶ PFU of LCMV clone 13 were administrated i.v. to host mice that were previously infected with LCMV-Arm at day > 30 prior.
In vivo tumor transplant experiment
sgNTC- or sgPofut1-transduced OT-1 cells (1×10⁴) were transferred to naïve C57BL/6 mice (7–10 weeks of age) followed by 3×10⁴ CFU of Lm-OVA infection. At day > 30 p.i., B16-OVA cells (1×10⁷) were injected subcutaneously into above mice. Tumors were measured every three days with a digital caliper, and tumor volumes were calculated by the formula: length × width × [(length × width)0.5] × π/6 as previously described (Wei et al., 2019). Mice were euthanized at humane endpoints when tumors reached 15 mm in the longest dimension.
In vivo killing assay
In vivo killing assay was performed as previously described (Kim et al., 2014). Briefly, CD45.1+ splenocytes were pulsed with 1 mg/ml of OVA257–264 peptide or gp33 peptide or phosphate-buffered saline (PBS) at 37 °C for 1 h. These antigen- or PBS-pulsed splenocytes were then labelled with 0.5 μM of CellTrace Violet (CTVlo) (Thermo Fisher Scientific) or 5 μM of CellTrace Violet (CTVhi), respectively, at 37 °C for 15 min. The CTVlo and CTVhi labelled splenocytes were mixed at a 1:1 ratio and a total of 2×10⁷ cells were transferred to host mice that were challenged with Lm-OVA or LCMV at day > 35 prior, followed by analysis of in vivo cytotoxicity against these splenocytes after 2.5 h.
Mixed bone marrow chimera generation
Mixed bone marrow (BM) chimeras were constructed by mixing BM cells from CD45.2+ Cd4CrePofut1wt or Cd4CrePofut1fl/fl mice and CD45.1+ ‘spike’ mice at a 1:1 ratio, followed by injection into sub-lethally irradiated Rag1–/– recipient mice. Mice were analyzed at 7–8 weeks after reconstitution.
METHOD DETAILS
T cell isolation, viral transduction and culture
Naïve Cas9-expressing P14 or OT-1 cells were isolated from the spleen and peripheral lymph nodes (pLN) of Cas9-P14 or Cas9-OT-1 mice by magnetic bead purification using a naïve CD8α+ T cell isolation kit according to the manufacturer’s instructions (Miltenyi Biotech). Purified naïve P14 or OT-1 cells were activated in vitro for 18 h with plate-bound anti-CD3 (10 μg/ml; Bio-X-Cell) and anti-CD28 (5 μg/ml; Bio-X-Cell) antibodies. Viral transduction was performed by spin-infection at 900 g at 25 °C for 3 h with 10 μg/ml polybrene (Sigma-Aldrich) followed by 3 h rest at 37 °C and 5% CO2. Cells were washed and cultured with mouse IL-7 (12.5 ng/ml; Peprotech) and IL-15 (25 ng/ml; PeproTech) for 4 days. Cells were sorted based on the expression of fluorescent proteins using a Reflection cell sorter (iCyt) before adoptive transfer to recipients. sgRNAs were designed by using the following principles. For the genes that were included in our metabolic library, we routinely chose two guides with the highest levels of enrichment in our primary screening. For other genes (e.g. Fcsk) that were not included in our metabolic library, we designed at least two independent guides (using the platform from Broad Institute https://portals.broadinstitute.org/gpp/public/analysis-tools/sgrna-design) for phenotypic analyses. We verified that at least two guides induced similar phenotypes. sgRNAs used in this study were listed in Table S7.
Lentiviral and retroviral sgRNA vector design
The lentiviral sgRNA vector was previously described (Wei et al., 2019). Briefly, the EF-1α PuroR fragment of the lentiGuide-puro vector was replaced with a mouse PGK promoter-driven Ametrine (or GFP or mCherry) fluorescent protein. The retroviral sgRNA vector was generated from previously described pLMPd-Amt vector (Chen et al., 2014) by replacing the miR30 shRNA cassette with the U6 promoter driven gRNA cassette that was from the lentiGuide-puro vector.
CRISPR-Cas9 mutagenesis screening using the lentiviral metabolic library
Lentiviral sgRNA metabolic library construction
A custom mouse metabolic library containing 3,017 genes was synthesized based on the gene list from reported human metabolic genes (Birsoy et al., 2015). A total of six gRNAs were designed for each gene according to previously published criteria (Sanson et al., 2018). Two sub-libraries (AAAQ05 and AAAR07; Table S8) were made, with each containing 3 gRNAs targeting one gene and 500 non-targeting controls. The synthesis, purification and quality control of the library was described previously (Wei et al., 2019).
In vivo screening
The in vivo screening approach was modified based on previous studies (Chen et al., 2014; Wei et al., 2019). Briefly, lentivirus was produced by co-transfecting the lentiviral metabolic library plasmids, psPAX2, and pCAG4-Eco in HEK293T cells. At 48 h after transfection, the supernatant was harvested and frozen at −80 °C. Naïve Cas9-expressing P14 cells were isolated and pooled from 11 Cas9-P14 mice and transduced at a MOI of 0.3 to achieve ~20% transduction efficiency immediately after T cell purification. After viral transduction, cells were activated with plate-bound anti-CD3 (10 μg/ml; Bio-X-Cell) and anti-CD28 (5 μg/ml; Bio-X-Cell) antibodies for 2 days and cultured with human IL-2 (100 IU/ml; Peprotech), mouse IL-7 (2.5 ng/ml; Peprotech) and IL-15 (25 ng/ml; Peprotech) for 4 days to expand and allow gene editing to occur. Transduced cells were sorted based on the expression of Ametrine, and an aliquot of 5×10⁶ transduced P14 cells was saved as “day 0 input” (a round 500× cell coverage per sgRNA). Transduced P14 cells (0.75×10⁶) were then transferred i.v. to naïve C57BL/6 mice followed by LCMV-Arm infection (2×10⁵ PFU) 2 h later. A total of sixty recipients were randomly divided into 3 groups as biological replicates. At day 7.5 after infection, donor-derived TE (KLRG1+CD127−) and MP (KLRG1−CD127+) cells were sorted and frozen at −80 °C until genomic DNA extraction. A minimum of 2.4×10⁶ P14 cells per sample (> 240× cell coverage per sgRNA) was recovered for further analysis.
Library preparation
Genomic DNA was extracted by using the DNeasy Blood & Tissue Kits (Qiagen) according to the manufacturer’s instruction. Subsequent primary PCR was performed by using the KOD Hot Start DNA Polymerase (Sigma-Aldrich). Primers sequences to amplify sgRNAs for the first PCR were:
Nextera NGS-F:
TCGTCGGCAGCGTCAGATGTGTATAAGAGACAGTTGTGGAAAGGACGAAACACCG;
Nextera NGS-R:
GTCTCGTGGGCTCGGAGATGTGTATAAGAGACAGCCACTTTTTCAAGTTGATAACGG.
PCR products were then purified using AMPure XP beads (Beckman Coulter). A second PCR was performed to attach Illumina adaptors and indexes to barcode samples. The library sequencing (Illumina) was performed in Hi-seq (Illumina) platform.
RNA isolation, transcriptome profiling and quantitative real-time PCR
A total of 1×10⁵ donor-derived P14 cells were sorted and RNA was isolated using the RNeasy Micro Kit (Qiagen) following the manufacturer’s instructions. The RNA Integrity Number (RIN) and concentration of RNA were measured by Agilent 2100 bioanalyzer. RNA (1 ng) was used for subsequent microarray analysis with Clariom S mouse array platform (Thermo Fisher Scientific).
To perform quantitative real-time PCR analysis, cDNA was synthesized from the RNA generated above using SuperScript® III First-Strand Synthesis System (Thermo Fisher Scientific). The cDNA was then diluted and added to Power SYBR Green Master Mix (Thermo Fisher Scientific) containing specific PCR primers and gene amplification was assessed using an Applied Biosystems 7900HT quantitative PCR machine.
ATAC-seq
A total of 5×10⁴ sgNTC-, or sgPofut1-transduced P14 cells were incubated in 50 μl ATAC-seq lysis buffer (10 mM Tris-HCl, pH 7.4, 10 mM NaCl, 3 mM MgCl2, 0.1% IGEPAL CA-630) on ice. After 10 min, samples were centrifuged at 500 g for 10 min at 4 °C to pellet nuclei. The supernatant was carefully removed, and the pellet was resuspended in 50 μl transposase reaction mix (25 μl 2× TD buffer, 22.5 μl nuclease-free water, and 2.5 μl transposase) (Illumina). The reaction was incubated for 30 min at 37 °C to allow tagmentation occur. Following tagmentat ion, the DNA was immediately purified using the MinElute kit (Qiagen). Nextera indexing of the tagmented DNA was run using the NEBNext HiFi kit (NEB) based on manufacturer’s instructions, and amplified for 5 cycles as described (Buenrostro et al., 2013). PCR product (5 μl) from above reaction was then used for a quantitative PCR (KAPA SYBRFast system; Kapa Biosystems) to determine the remaining number of PCR cycles required (as determined by the cycle number of each sample when it reaches 1/3 the fluorescence threshold). The remaining 45 μl of PCR reaction was then amplified in the same reaction mix using the optimal cycle number (20 cycles) on an Applied Biosystems 7900HT quantitative PCR machine. The PCR products were purified using AMPure XP beads followed by two 70% (v/v) ethanol washes, and elution of DNA in buffer EB (Qiagen). Each sample was quantified in using a tapestation (Agilent) and then sequenced on an Illumina NovaSeq to a sequencing depth of 300 million reads per sample.
Single-cell RNA sequencing
P14 cells transduced with sgNTC (GFP+ ‘spike’ cells) or sg Pofut1 (Ametrine+) and P14 cells transduced with empty vector (Ametrine+ ‘spike’ cells) or pMIGII-NICD (GFP+) were transferred at a 1:1 ratio to naïve mice that were subsequently infected with LCMV and sorted from spleen at day 7 p.i. Sorted cells were spun down at 2,000 rpm for 5 min. The supernatant was removed, and cells were resuspended and diluted in 1× PBS (Thermo Fisher Scientific) containing 0.04% BSA (Amresco) at concentration of 1×10⁶ cells/ml. Single cell libraries were prepared using the Chromium Next GEM Single Cell 3′ v3.1 kit (10X Genomics). Briefly, the single-cell suspensions were loaded onto the Chromium Controller according to their respective cell counts to generate 9,000 single-cell gel beads in emulsion (GEMs) per sample. Each sample was loaded into a separate channel. The complementary DNA content of each sample after cDNA amplification of 11 cycles was quantified and quality checked using a high-sensitivity DNA chip in a tapestation (Agilent). 25% of cDNA from the previous step was used for fragmentation, end repair and A-tailing followed by adaptor ligation and PCR indexing. After library quantification and quality checking by tapestation (Agilent), samples were diluted and loaded onto the NovaSeq (Illumina) to a sequencing depth of 500 million reads per sample (approximately 50,000 reads per cell).
Protein extraction and immunoblot analysis
1×10⁶ to 5×10⁶ cells were lysed in RIPA buffer (Thermo Fisher Scientific). The desired amount of 4× loading buffer was added into the cell lysate, and the samples were boiled at 100 °C for 5 min. The resulting samples were loaded in 4–12% Cri terion XT Bis-Tris Protein gels and transferred to PVDF membrane. After blocking with 5% nonfat milk for 1 h, the membranes were incubated with primary antibodies for overnight. Membranes were washed 3 times with TBST and then incubated with 1:5,000 diluted HRP-conjugated secondary antibody (Promega) for 1 h. After washing 3 times with TBST, the membranes were exposed using enhanced chemiluminescence (Thermo Fisher Scientific) detection reagents and images were captured using the ODYSSEY Fc Analyzer (LI-COR).
Tissue dissociation of non-lymphoid organs
Lung and liver were collected and minced into small pieces using razor blades. The organs were digested in dissociation buffer containing 1 mg/ml of collagenase IV (Worthington Biochemicals) and 0.5 mg/ml of DNase I (Sigma-Aldrich) at 37 °C for 30 min with gentle rocking. The cell suspensions were then passed through 70-μm filters to remove undigested tissues followed by density-gradient centrifugation over Percoll (GE Healthcare ).
Seahorse metabolic assay
Oxygen consumption rate (OCR) and extracellular acidification rate (ECAR) were measured following the manufacturer’s instructions of Seahorse XF Cell Mito Stress Test Kit (Agilent). In brief, 2.5×10⁵ donor-derived P14 cells were sorted and suspended in XF medium and then plated in a poly-L-lysine-coated XF96 plate. The OCR and ECAR under basal conditions and in response to 1 μM oligomycin, 1.5 μM fluoro-carbonylcyanidephenylhydrazone (FCCP) and 500 nM rotenone were measured using an XF96 Extracellular Flux Analyzer (Seahorse Bioscience).
Measurement of genome editing efficiency
Targeted amplicons were generated using gene-specific primers with partial Illumina adapter overhangs and sequenced as previously described (Sentmanat et al., 2018). Briefly, cell pellets of approximately 1×10⁵ cells were lysed and used to generate gene-specific amplicons with partial Illumina adapters in the first round of PCR. Amplicons were indexed in a second round of PCR and pooled with other targeted amplicons for other loci to create sequence diversity. Additionally, 10% PhiX Sequencing Control V3 (Illumina) was added to the pooled amplicon library prior to running the sample on an Miseq Sequencer System (Illumina) to generate paired 2 × 250 bp reads. Samples were demultiplexed using the index sequences, fastq files were generated, and insertion and deletion (indel) mutation analysis was performed using CRIS.py (Connelly and Pruett-Miller, 2019).
GDP-fucose measurement
A total of 5×10⁶ donor-derived P14 cells were sorted and snap frozen in liquid nitrogen after wash with ice-cold saline. The cell pellets were lysed with chloroform/methanol/water (3:4:1, v/v/v) and the hydrophilic fraction was extracted from upper aqueous phase followed by lyophilization. To measure GDP-fucose, the dried extracts were dissolved in 5% acetonitrile solution and then analyzed by liquid chromatography with tandem mass spectrometry (LC-MS/MS). In brief, liquid chromatography was performed using the Vanquish Horizon UHPLC system equipped with an Accucore C30 (50×2.1 mm, 2.6 μm) column (Thermo Fisher Scientific). Column temperature was maintained at 45 °C and the mobile phases A consisted of water/acetonitrile (97:3, v/v) containing 10 mM ammonium acetate and 10 mM ammonium hydroxide. Acetonitrile was used as mobile phase B. The system was operated using the following linear gradient conditions: 0–0.5 min 2% B; 0.5–1.5 min 2 to 96% B; 1.5–2.5 min 96% B; 2.5–3.5 min 96 to 2% B; 3.5–5 min 2% B. The flow rate was 300 μl/min and the injection volume was 3 μl. Mass spectrometry analysis was performed under Q Exactive hybrid quadrupole-Orbitrap mass spectrometer (QE-MS) system equipped with a HESI-II probe (Thermo Fisher Scientific). The detection was run in the negative ion mode using a targeted selected ion monitoring followed by a data-dependent MS/MS method (tSIM/dd-MS2). The QE-MS was operated at a resolution of 140,000 (FWHM, at m/z 200), AGC targeted of 1×10⁶ and max injection time of 80 msec. The conditions for the dd-MS2 were as follows: a resolution of 35,000, AGC targeted of 1×10⁵, max injection time of 40 msec, MS2 isolation width 0.5 m/z and NCE 35. The source’s operating conditions were: Sheath gas flow 45, Aux gas flow 8, Sweep gas 1, Spray voltage 2.6 kV in negative ion mode, Capillary temp 325 °C, S-lenses RF level 55 and Aux gas heater 325 °C. Data were quantified using Xcalibur™ software (T hermo Fisher Scientific) after validation with authentic GDP-fucose standard (Sigma-Aldrich).
Glutamine uptake and intracellular glutamine measurement
Naïve CD8+ T cells from Cd4CreSlc38a2wt and Cd4CreSlc38a2fl/fl mice were stimulated with plate-bound anti-CD3 (10 μg/ml) and anti-CD28 (5 μg/ml) in the presence of IL-2 (100 U). After 24 h of stimulation, cells were either directly collected or incubated with medium containing 2 mM [U-13C]-glutamine for 10 min. The cells were washed once with ice-cold saline, and then polar metabolites were extracted and derivatized by acetonitrile. The intracellular glutamine or 13C-glutamine [M+5] was analyzed with liquid chromatography with tandem mass spectrometry (LC-MS/MS). Data were quantified using Xcalibur™ so ftware (Thermo Fisher Scientific).
Flow cytometry
For the analysis of surface markers, cells were stained in PBS containing 2% fetal bovine serum (FBS) for 20 min at room temperature. Transcription factor staining was performed using Foxp3/transcription factor staining buffers, according to the manufacturer’s instructions (eBioscience). GzmB (BioLegend) staining was followed by surface staining, fixation and permeabilization using a fixation/permeabilization kit (BD Biosciences). To examine intracellular cytokine production, splenocytes were stimulated with 0.5 μg/ml gp33 peptide in the presence of monensin (GolgiSTOP; BD Biosciences) for 5 h and stained with anti-IFN-γ (BioLegend) and anti-TNF-α (Thermo Fisher Scientific) using a fixation/permeabilization kit (BD Biosciences). Active caspase-3 staining was performed following the instructions of the Active Caspase-3 Apoptosis Kit (BD Biosciences). BrdU staining (pulsed for 18 h for day 6.5– 7.5 analysis or 12 h for day 4.5–5 analysis) was pe rformed with APC BrdU Flow Kit (BD Biosciences) per the manufacturer’s instructions. Fixable viability dye (Thermo Fisher Scientific) was used for dead-cell exclusion. The following antibodies were used: anti-mouse CD3, anti-mouse CD44 (both from BD Biosciences); anti-mouse TCR-Vα2, anti-mouse Ki-67, anti-mouse CX3CR1, anti-mouse Bcl2, anti-mouse KLRG1, anti-mouse CXCR3, anti-mouse CD62L, anti-mouse Cat1 (encoded by Slc7a1) (all from BioLegend); anti-mouse TCF1 (Cell Signaling Technology); anti-mouse Thy-1.2, anti-mouse Thy-1.1, anti-mouse Foxp3, anti-mouse CD98, anti-mouse CD71, anti-mouse CD27, anti-mouse CD45.1, anti-mouse CD4 (all from Thermo Fisher Scientific); anti-mouse CD127, anti-mouse CD45.2, anti-mouse CD8α (all from Tonbo Biosciences). For measurement of ROS, mitochondrial mass and mitochondrial membrane potential, lymphocytes were incubated for 30 min at 37 °C with medium containing surface markers and 10 μM CellROX Deep Red (Thermo Fisher S cientific), 10 nM Mito Tracker Deep Red (Thermo Fisher Scientific), and 20 nM TMRM (ImmunoChemistry Technologies), respectively. For detection of phosphorylated S6 (pS6) (S235/236) ex vivo, mice were euthanized and a small portion of spleen was collected and fixed immediately in 1× Lyse/Fix buffer (BD Biosciences) followed by preparation of a single-cell suspension. Permeabilization was achieved by incubation with ice-cold Perm III buffer (BD Biosciences) for 30 min and staining with antibody recognizing pS6 (S235/236) (Cell Signaling Technology). pS6 (S235/236) levels in peptide-stimulated lymphocytes was assessed by fixation in 1× Lyse/Fix buffer, followed by permeabilization by ice-cold Perm III buffer (BD Biosciences) and staining with anti-pS6 (S235/236). To perform tetramer staining, cells were stained in PBS containing 2% FBS with Db/gp33 tetramer (NIH Tetramer Core Facility) for 45 min followed by staining with additional surface antibodies for 30 min at room temperature. For flow cytometry analysis, the BD™ LSR II instrument was used, and data were analyzed with FlowJo 10.4.2 software (TreeStar). Unless otherwise noted, the spleen was used for all immune analyses.
QUANTIFICATION AND STATISTICAL ANALYSIS
Data processing of in vivo pooled CRISPR screening
For data analysis, raw FASTQ files obtained after sequencing were demultiplexed using the HiSeq Analysis software (Illumina), as described (Wei et al., 2019). Single-end reads were trimmed and quality-filtered using the CLC Genomics Workbench v.11 (Qiagen) and matched against sgRNA sequences from the sgRNA metabolic library. Read counts for sgRNAs were normalized against total read counts across all samples. For each sgRNA, the fold change (FC; log2-transformed ratio) for enrichment was calculated between each of the biological replicates and the input experiment. After merging the quantification results from two sub-libraries, the FC (log2-transformed ratio) of genes was calculated on the basis of the average enrichment of their six gene-specific sgRNAs. The gene-level false-discovery-rate (FDR)-adjusted P value was calculated among multiple sgRNAs (n = 6) of each gene, using a two-tailed paired Student’s t-test between log2-transformed average normalized read counts of MP samples and those of TE samples, between counts of MP samples and those of input sample, or between counts of TE samples and those of input sample. The P value was further adjusted using Bonferroni correction with gene size. The FC and P value of 1,000 negative control sgRNAs were calculated accordingly.
Transcriptome profiling
To perform microarray analyses, the gene expression signals were summarized with the robust multi-array average algorithm (Affymetrix Expression Console v1.1). The differentially expressed gene analysis was performed using lmFit method implemented in R package limma v.3.34.9 (Ritchie et al., 2015). FDR was calculated by Benjamini–Hochberg method. The TE ′, MP and TINT subset-specific genes were defined by selectively upregulated genes in each subset compared to the other two subsets using the R package limma v.3.34.9 (Ritchie et al., 2015). Principal component analysis was performed using R function prcomp (). All the plots were generated using the R package ggplot2 v.2.2.1.
Gene set enrichment analysis and functional gene set enrichment
Gene set enrichment analysis (GSEA) and functional gene set enrichment was performed as previously described (Subramanian et al., 2005) using C7 immunological collections and Hallmark collections from the Molecular Signatures Database (http://www.broadinstitute.org/gsea/msigdb/). Several gene sets that were frequently used in this study were renamed as follows: MP signature, “IL-7R low vs high eff CD8 T cell DN” (Joshi et al., 2007); TE signature, “IL-7R low vs high eff CD 8 T cell UP” (Joshi et al., 2007); early-effector-like signatures, “Day 6 vs day 10 eff CD8 T cell UP” and “Day 6 vs day 10 Traf6KO eff CD8 T cell UP” (Pearce et al., 2009); and cell cycle-related signatures, “Hallmark E2F targets” and “Hallmark G2M checkpoint”.
ATAC-seq data analysis
ATAC-seq data processing
ATAC-seq analysis was performed by following pipelines previously described (Karmaus et al., 2019; Wei et al., 2019). In brief, 2×50-bp paired-end reads obtained from NovaSeq were trimming for Nextera adaptor by trimmomatic (v0.36, paired-end mode, with parameter LEADING:10 TRAILING:10 SLIDINGWINDOW:4:18 MINLEN:25) and aligned to mouse genome mm9 downloaded from gencode release M1 (https://www.gencodegenes.org/mouse/releases.html) by BWA (version 0.7.16, default parameters) (Li and Durbin, 2009). Duplicated reads were then marked with Picard (v2.9.4) and only non-duplicated proper paired reads have been kept by samtools (parameter ‘-q 1 -F 1804’ v1.9) (Li et al., 2009). After adjustment of Tn5 shift (reads were offset by +4-bp for the sense strand and −5-bp for the antisense strand), we separated reads into nucleosome-free, mononucleosome, dinucleosome and trinucleosome [as previously described (Buenrostro et al., 2013)] by fragment size and generated .bigwig files by using the center 80-bp of fragments and scaled to 30×106 nucleosome-free reads. We observed reasonable nucleosome-free peaks and a pattern of mono-, di- and tri-nucleosomes on IGV (v2.4.13) (Robinson et al., 2011). All samples in this study had approximately 15×106 nucleosome-free reads, indicative of good data quality. Next, peaks were called on nucleosome-free reads by MACS2 (v2.1.1.20160309, with default parameters with ‘–extsize 200–nomodel’) (Zhang et a l., 2008). To assure replicability, we first finalized nucleosome-free regions for each sample and retained a peak only if it called with a higher cut-off (MACS2 -q 0.05). We further generated consensus peaks for each group by keeping peaks that were present in at least 50% of the replicates and discarding the remaining, non-reproducible peaks. The reproducible peaks were further merged between sgNTC- and sgPofut1-transduced samples if they overlapped by 100-bp and then nucleosome-free reads from each of the eight samples was counted using bedtools (v.2.25.0) (Quinlan and Hall, 2010). To identify the differentially accessible open chromatin regions (OCRs), we first normalized raw nucleosome-free read counts per million (CPM) followed by differential accessibility analysis by implementation of the negative binomial model in the DESeq2 R package (Love et al., 2014). FDR-corrected P value < 0.05 and |log2 FC| > 0.5 were used as cut-offs for more- or less-accessible regions in sgPofut1-transduced samples compared to their sgNTC-transduced ‘spike’ cells. Principal component analysis was performed using function prcomp () in R. We then assigned the differentially accessible OCRs in the ATAC-seq data for the nearest genes to generate a list of DA genes using HOMER (Heinz et al., 2010). Functional peak set enrichment was then performed in C7 immunological collection using those DA genes.
Motif analysis and footprinting of transcription-factor binding sites
For motif analysis (Karmaus et al., 2019), we further selected 1,000 unchanged regions log2 FC < 0.05 and FDR-corrected P value > 0.5 as control regions. FIMO from MEME suite (v4.11.3, ‘– thresh 1e-4–motif-pseudo 0.0001’) (Bailey et al., 2009) was used for scanning motifs (TRANSFAC database release 2019, only included Vertebrata and not 3D structure-based) matches in the nucleosome-free regions and two-tailed Fisher’s exact test was used to determine whether a motif was significantly enriched in differentially accessible compared to the control regions. To perform footprinting analysis of transcription-factor binding site analysis, the RGT HINT application was used to infer transcription factor activity and to plot the results (Li et al., 2019).
Analysis of scRNA-seq data
Alignment, barcode assignment and unique molecular identifier counting
scRNA-seq data, either from a public dataset of P14 cells isolated at day 8 after LCMV-Arm infection [GSM3785518, (Chen et al., 2019)] or from sgNTC- and sgPofut1-transduced P14 cells or from empty vector and pMIGII-NICD transduced P14 cells at day 7 after LCMV-Arm infection, were pre-processed using Cell Ranger (10X Genomics) software and Seurat R package (v3.1.2) (Butler et al., 2018). Briefly, the Cell Ranger 1.3 Single-Cell software suite (10X Genomics) was implemented to process the raw sequencing data from the Illumina NovaSeq run. This pipeline performed demultiplexing alignment (using the mouse genome mm10 from ENSEMBL GRCm38) and barcode processing to generate gene–cell matrices used for downstream analysis. Cells with low unique molecular identifiers (UMI) counts (potentially dead cells with broken membranes) or high UMI counts (potentially two or more cells in a single droplet) were removed from the subsequent analysis. Cells with high percent (> 4%) of mitochondrial reads were also removed. We normalized the expression level of each gene using regularized negative binomial regression with sctransform R package (v0.2.1) (Hafemeister and Satija, 2019).
Unsupervised clustering of P14 cells and data visualization
To identify different clusters among the P14 cells, data were further analyzed using Seurat and visualized by UMAP [Uniform Manifold Approximation and Projection, (McInnes et al., 2018)] after regressing out cell cycle effects during data scaling, which partitioned cells into three clusters based on their transcriptomes. Non-parametric Wilcoxon rank sum test was used to compare the gene expression of cells in each cluster (versus cells in the other two clusters) and then genes in each comparison were ranked based on their log2 FC. To identify the enriched pathways in each cluster, pre-ranked GSEA (Korotkevich et al., 2019), an analysis of GSEA against a user-supplied, ranked list of genes, was then performed with the C7 immunological collection using fGSEA R package (v1.10.1) for each comparison. Curated violin plots that represent the expression level of genes were generated by VlnPlot function in Seurat R package. The activity of Pofut1-dependent signature [defined by downregulated genes from microarrays in sgPofut1- compared to sgNTC-transduced P14 cells isolated at day 7.5 p.i.; FDR < 0.05; log2 FC (sgPofut1/sgNTC) < –0.5)] was calculated using method AUCell (Aibar et al., 2017) and color-coded (from low to high, blue–red) on the UMAP visualization.
RNA velocity-based cell fate tracing
To perform the RNA velocity analysis, the spliced and unspliced reads were recounted by the velocyto Python package based on previous aligned bam files of scRNA-seq data (La Manno et al., 2018). The calculation of RNA velocity values for each gene in each cell and embedding RNA velocity vector to low-dimension space were performed using velocyto.R pipeline. We estimated RNA velocity using the gene-relative model, with k = 50 cell kNN pooling and using top/bottom 2% quantiles for gamma fit. The velocity was visualized on the UMAP embedding with the show.velocity.on.embedding.cor function.
Statistical analysis for biological experiments
For biological experiment (non-omics) analyses, data were analyzed using Prism 7 software (GraphPad) by two-tailed paired Student’s t-test (when comparing to the co-transferred ‘spike’ cells) or two-tailed unpaired Student’s t-test. Two-way ANOVA was performed for comparing tumor growth curves. The log-rank (Mantel–Cox) test was performed for comparing mouse survival curves. P < 0.05 was considered significant. In all bar plots, data are presented as mean ± s.e.m.
Supplementary Material
(A and B) P14 cells transduced with the same sgNTC but with different fluorescent proteins (GFP+ or Ametrine+) were mixed at a 1:1 ratio and transferred to naïve hosts followed by LCMV infection (dual-color transfer system). Flow cytometry of Ametrine versus GFP (left) or CD127 versus KLRG1 expression (pre-gated as indicated; right) in splenic P14 cells at day 7.5 p.i. (A) and day > 30 p.i. (B). (C) Summary of genome editing efficiencies of the major metabolic regulators investigated in this study. g1, guide 1; g2, guide 2. (D and E) Flow cytometry of CD127 versus KLRG1 expression (D) and quantification of MP/TE ratio (E; left) and proportions of CXCR3hiCD27hi (E; middle) and CD62L+ (E; right) cells. (F) Immunoblot analysis of Pten in sgNTC- and sgPten-transduced P14 cells at day 3 or day 4 post-activation. (G and H) Flow cytometry of CD127 versus KLRG1 expression (G) and quantification of the MP/TE ratio (H; left) and proportions of CXCR3hiCD27hi (H; middle) and CD62L+ (H; right) cells. (I) Quantification of normalized ratio (to sgNTC-transduced cells) of MP versus TE cells in splenic P14 cells transduced with the indicated sgRNAs (single-color transfer system) at day 7.5 p.i. g1 or g2, two individual sgRNAs targeting the same gene. Asterisks indicate significance between indicated sgRNAs and sgNTC. (J) Immunoblot analysis of Slc7a1 expression in sgNTC- or sgSlc7a1-transduced cells at day 7.5 p.i. (K) Real-time PCR analysis of Slc38a2 expression in sgNTC- or sgSlc38a2-transduced cells at day 7.5 p.i. (L) P14 cells transduced with sgNTC or the indicated sgRNAs (dual-color transfer system) were analyzed at day 7.5 p.i. Flow cytometry of CD127 versus KLRG1 expression (left) and quantification (right) of the MP/TE ratio. (M) Quantification of the MP/TE ratio (left) and proportions of CXCR3hiCD27hi (middle) and CD62L+ (right) cells among OT-1 cells at day 7.5 after Lm-OVA infection. Data are from one (C and F), representative of at least two (A, B, and J), or compiled from at least two (D, E, G–I, K, and M) independent experiments, with ≥ 2 (C), ≥ 4 (D, E, and I), 3 (G and H), or ≥ 5 (L and M) biological replicates per group. *P < 0.05, **P < 0.01, and ***P < 0.001; two-tailed paired Student’s t-test (E, H, L, and M) or two-tailed unpaired Student’s t-test (I and K). Data are presented as mean ± s.e.m.
(A) Quantification of the numbers of TCM (CD62L+; left) and TEM (CD62L−; right) cells from mice described in Figure 2B from the single-color transfer system at day > 30 p.i. Fold changes between the groups in different organs are shown above the bar graphs. pLN, peripheral lymph nodes; BM, bone marrow. Total, the sum of donor-derived cells in pLN, spleen, BM, liver and lung. (B) Longitudinal analysis of the relative fold change (normalized to ‘spike’ cells) of indicated sgRNA-transduced OT-1 cells in the blood during Lm-OVA infection. (C) Flow cytometry (left) and quantification of the relative fold change (normalized to ‘spike’ cells; right) in indicated organs at day > 30 p.i. (D) Flow cytometry (left) and quantification of the frequency (middle) and number (right) of donor-derived splenic P14 cells transduced with indicated sgRNAs at day 6 after the secondary challenge. (E) Flow cytometry (left) and quantification of the relative fold change (normalized to ‘spike’ cel ls; right) of splenic OT-1 cells transduced with indicated sgRNAs at day 6 after the secondary Lm-OVA challenge. (F–H) Real-time PCR analysis of Asns and Trib3 (F and G) or Ass1 (H) in the indicated P14 cells at day 7.5 p.i. (I) Real-time PCR analysis of Slc38a2 in naïve CD8+ T cells from Cd4CreSlc38a2wt and Cd4CreSlc38a2fl/fl mice. (J) Quantification of [U-13C] glutamine uptake in WT and Slc38a2-deficient cells. (K) Quantification of intracellular glutamine content in WT and Slc38a2-null cells. (L) Flow cytometry of pS6 phosphorylation (pS6) in P14 cells transduced with sgNTC. (M) Flow cytometry (left) and quantification (right) of the mean fluorescence intensity (MFI) of Slc7a1 at day 3 p.i. CTV, CellTrace Violet. Data are representative of at least two (L), or compiled from at least two (A–K and M) independent experiments, with ≥ 4 (A, C, L, and M), 9 (B), ≥ 5 (D–H), or 6 (I–K) biological replicates per group . *P < 0.05, **P < 0.01, and ***P < 0.001; NS, not significant; two-tailed paired Student’s t-test (A and M) or two-tailed unpaired Student’s t-test (B–K). Data are presented as mean ± s.e.m.
(A) Immunoblot analysis of Pofut1 in P14 cells transduced with sgNTC or sgPofut1 at day 7.5 post-infection (p.i.). Non-specific bands are indicated by an asterisk (*); Pofut1 band is indicated by an arrow. (B) Flow cytometry (left) and quantification (right) of the frequency of IFN-γ+TNF-α+ cells in donor-derived P14 cells [transduced with sgNTC (GFP+ ‘spike’ cells) or sgPofut1 (Ametrine+)] after gp33 peptide stimulation. (C) Flow cytometry (left) and quantification (right) of the proportion of donor-derived CXCR3hiCD27hi cells. (D) Flow cytometry (left) and quantification of the proportions of donor-derived KLRG1−CD127+ (middle) and KLRG1+CD127− (right) cells. (E) The indicated OT-1 cells (from dual-color transfer system) were analyzed in the blood at day 7.5 after Lm-OVA infection. Quantification of the MP/TE ratio (left) and the proportion of CXCR3hiCD27hi cells (right). (F) The indicated OT-1 cells (from single-color transfer system) were analyzed in the spleen at day > 30 after Lm-OVA infection. Flow cytometry (left) and quantification (right) of the proportion of donor-derived OT-1 cells among total CD8+ T cells. (G and H) Flow cytometry of CD4+ and CD8+ cells (G) and quantification of the frequencies (H; left) and numbers (H; right) of conventional CD4+ T cells (Tconv), CD8+ T cells, and Treg cells in spleen of WT and Cd4CrePofut1fl/fl mice. (I and J) Cd4CrePofut1wt and Cd4CrePofut1fl/fl mice were infected with LCMV and analyzed in the spleen at day 7.5 p.i. (I) Flow cytometry of CD127 versus KLRG1 expression (left) and quantification of the MP/TE ratio (right) among gp33 tetramer-positive cells. (J) Flow cytometry (left) and quantification (right) of the proportion of CXCR3hiCD27hi cells in gp33 tetramer-positive cells . (K–M) Mixed BM chimeras (see Methods) were infected with LCMV and analyzed at day 7.5 p.i. (K) Quantification of the MP/TE ratio (left) and the proportion of CXCR3hiCD27hi cells (right) among gp33 tetramer-positive cells from the spleen. (L) Flow cytometry (left; from spleen) and quantification (right) of the proportion of CD45.2+ gp33 tetramer-positive cells among total cells in the indicated organs (right). pLN, peripheral lymph nodes. (M) Quantification of splenic donor-derived (CD45.2+) IFN-γ+ and TNF-α+ CD8+ T cells after gp33 peptide stimulation. (N) Flow cytometry of gp33 tetramer-positive cells among total CD8+ T cells (left) and quantification of the proportion (upper right) and number (lower right) in the indicated organs (right) of LCMV-infected mice at day > 50 p.i. (O) WT or Pofut1-deficient (CD45.1+CD45.2+) splenic TMEM cells (5×10³) from the mice described in (N) were sorted and transferred to naïve C57BL/6 hosts (CD45.2+) followed by LCMV re-challenge and analysis at day 6 after re-challenge. Flow cytometry of frequency of donor-derived gp33 tetramer-positive cells compared to endogenous (endo) gp33 tetramer-positive cells (left) and quantification of the number of donor-derived gp33 tetramer-positive cells in the indicated organs (right). Total, the sum of donor-derived gp33 cells in pLN, spleen, BM, liver and lung. Data are from one (K–M), representative of two (A), or compiled from at least two (B–J, N, and O) independent experiments, with 11 (B), 5 (C), 9 (D and O), 19 (E), ≥ 7 (F), ≥ 4 (G–M), or 3 (N) biological replicates per group. *P < 0.05, **P < 0.01, and ***P < 0.001; NS, not significant; two-tailed paired Student’s t-test (B–E) or two-tailed unpaired Student’s t-test (F–O). Data are presented as mean ± s.e.m.
(A and B) Enrichment plots of TE (A, left), MP (A, right), or “early-effector-like” signatures (B) in sgPofut1- compared to sgNTC-transduced cells in the transcriptome profiling described in Figure 4A. NES, normalized enrichment score; FDR, false discovery rate. (C) Flow cytometry (left) and quantification of the frequency (right) of Ki-67+ cells among conventional CD4+ T cells (Tconv), Treg cells and CD8+ T cells in the spleen of Cd4CrePofut1wt and Cd4CrePofut1fl/fl mice. (D) Naïve CD8+ T cells from Cd4CrePofut1wt and Cd4CrePofut1fl/fl mice were stimulated with different doses of anti-CD3 for 72 h, followed by [3H] thymidine incorporation analysis. (E–H) P14 cells transduced with sgNTC (GFP+ ‘spike’ cells) or sg Pofut1 (Ametrine+) were transferred at a 1:1 ratio to naïve mice that were subsequently infected with LCMV and analyzed at the indicated time points post-infection (p.i.). (E) Prior to transfer, P14 cells were labelled with CellTrace Violet (CTV). Flow cytometry of CTV dilution in P14 cells transduced with sgNTC or sgPofut1 at day 2.5 p.i. (F) Quantification of the mean fluorescence intensity (MFI) of CXCR3 in sgNTC- and sgPofut1-transduced P14 cells at day 2.5 p.i. (G) Longitudinal analysis of the relative fold change (normalized to ‘spike’ cells) of sgPofut1-transduced P14 cells during LCMV infection. (H) Flow cytometry (left) and quantification of relative frequency (right) of BrdU+ cells in sgNTC- and sgPofut1-transduced P14 cells at day 4.5–5 p.i. (I) Enrichment plots of cell cycle-related signatures in published TE versus MP cells (Joshi et al., 2007). (J) Flow cytometry (left) and quantification (right) of relative frequency of BrdU+ cells in TE compared to MP (normalized to 1) cells in the spleen at day 6.5–7.5 p.i. Data are from one (A, B, and I), representative of two (E), or compiled from at least two (C, D, F–H, and J) independent experiments, with ≥ 4 (A–C, G, and J), 3 (D), 6 (F), or 7 (H) biologica l replicates per group. *P < 0.05, **P < 0.01, and ***P < 0.001; NS, not significant; two-tailed paired Student’s t-test (F, H, and J) or two-tailed unpaired Student’s t-test (C, D, and G). Data are presented as mean ± s.e.m.
(A) Non-parametric Wilcoxon rank sum test was used to compare gene expression of cells in one cluster versus those in the other two clusters (clusters as defined in Figure 4D) followed by pre-ranked GSEA [based on log2 fold change (FC)] using the C7 immunological collections. Shown are the top 6 enriched gene sets related to CD8+ T cells from each cluster. (B) Heatmap showing the top 25 genes upregulated in each cluster. (C) Gating strategy (left) and quantification (right) of the proportions of TE′ (KLRG1hiCXCR3loCD127lo), MP (KLRG1loCXCR3hiCD127hi) and TINT cells (CXCR3hiCD127lo) among P14 cells transduced with sgNTC at day 7.5 post-infection (p.i.). (D) OT-1 cells transduced with sgNTC were transferred to naïve mice that were subsequently infected with Lm-OVA and analyzed at day 7.5 p.i. Quantification of the proportions of TEFF subsets described in (C). (E) Functional enrichment of population-specific genes (defined by upregulated genes in TE′, MP or TINT cells versus the other two populations; see also Figure 4G) using C7 immunological collection. Shown are the top 5 enriched gene sets related to CD8+ T cells from each cluster. (F) Enrichment plots of cell cycle-related signatures among TE′, MP and TINT cells as described in Figure 4G. (G) RNA velocity analysis (La Manno et al., 2018) showing the putative lineage relationship among TE′, MP and TINT cells. Data are from one (A, B, E–G, and J), or compiled from at le ast two (C and D) independent experiments, with 15 (C), 24 (D), or 4 (F) biological replicates per group. ***P < 0.001; two-tailed unpaired Student’s t-test (C and D). Data are presented as mean ± s.e.m.
(A) Heatmap showing the expression of TE′, MP or TINT population-specific genes and their expression in sgNTC- and sgPofut1-transduced P14 cells from the spleen at day 7.5 post-infection (p.i.). (B) Enrichment plots of TE′, MP and TINT signature genes (genes specifically expressed in the three TEFF subsets, Table S6) in the transcriptome profiling described in Figure 4A. (C) UMAP plot (see also Figure 4L) of the activity of TE′ signature (defined in Table S6; left panel;) in sgNTC- (black; middle panel) and sgPofut1- (red; right panel) transduced P14 cells. (D and E) PCA plot of ATAC-seq data of sgNTC- and sgPofut1-transduced P14 cells, with the percentage of variance indicated. (E) Footprinting analysis of selective transcription factors from the Sp family and KLF family in ATAC-seq data from (D). Data are from one experiment (A–E), with 4 biological replicates per group (A–E). Data are presented as mean ± s.e.m.
(A) Immunoblot analysis of Pofut1. Non-specific bands are indicated by asterisks (*); Pofut1 band is indicated by an arrow. (B-E) P14 cells transduced with sgNTC or the indicated sgRNAs were transferred at a 1:1 ratio to naïve mice that were subsequently infected with LCMV (dual-color transfer system). At day 7.5 post-infection (p.i.), donor-derived P14 cells were sorted from the spleen. (B) Quantification of genome editing efficiency. (C) Flow cytometry analysis of CD127 versus KLRG1 expression (left) and quantification of the MP/TE ratio (right) in P14 cells transduced with the indicated constructs. dKO, co-transduction of sgGmds and sgFcsk. (D) Flow cytometry (left) and quantification (right) of mean fluorescence intensity (MFI) of Mitotracker, TMRM and CellROX in P14 cells transduced with sgNTC or the indicated sgRNAs. dKO, co-transduction of sgGmds and sgFcsk. (E) Quantification of the relative intracellular GDP-fucose level by liquid chromatography with tandem mass spectrometry (LC-MS/MS). (F) Enrichment plot of Hallmark Notch signaling among the transcriptome of TE′, MP and TINT cells in profiling described in Figure 4G. (G) P14 cells transduced with the indicated sgRNAs were sorted from the dual-color transfer system at day 7.5 p.i. for real-time PCR analysis of Dtx1 expression. (H) PCA plot of the transcriptome of Cd4CrePoful1wt and Cd4CrePoful1fl/fl P14 cells with or without NICD overexpression. The percentage of variance is indicated. Data are from one (B, F, and H), representative of two (A), or compiled from at least two (C–E and G) independent experiments, with 3 (B), 6 (C), or ≥ 4 (D–H) biological replicates per group. * P < 0.05, **P < 0.01, and ***P < 0.001; NS, not significant; two-tailed unpaired Student’s t-test (B, C, E, and G) or two-tailed paired Student’s t-test (D). Data are presented as mean ± s.e.m.
Table S1. Initial in vivo CRISPR screening results; Related to Figure 1. Three comparisons (MP versus TE, MP versus input and TE versus input) are shown.
Table S2 Putative negative regulators for MP cells [log2 FC (MP/TE) > 0.58; log2 FC (MP/input) > 0.58; adjusted P (MP/TE) < 0.05)]; Related to Figures 1–7.
Table S3. GSEA results of the differential enrichment of C7 gene sets (immunological collections) in transcriptomes of sgPofut1- versus sgNTC-transduced P14 cells (FDR < 0.05); Related to Figure 4. Two subtables (Tables S3–2 and S3–2) are grouped based on downregulated or upregulated gene sets.
Table S4. Preranked GSEA results of the enriched gene sets (FDR < 0.05; NES > 0) from C7 immunological collections in clusters 1, 2, or 3 identified by scRNA-seq analysis; Related to Figure S4. Three subtables (Tables S4–1–S4–3) list enrichment results in different clusters (1–3). The top 6 CD8+ T cell-related gene sets in each cluster are highlighted in yellow.
Table S5. List of subset-specific genes identified by the transcriptomic analysis of sorted TE’, MP and TINT cells; Related to Figure 4. The genes selectively upregulated in one subset compared to the other two subsets were considered as subset-specific genes.
Table S6. List of Pofut1-dependent gene signature. Related to Figure 4. Pofut1-dependent gene signature is defined by significantly downregulated genes (FDR < 0.05; log2 FC < –0.5) from transcriptome profiles of sgPofut1- versus sgNTC-transduced P14 cells as described in Figure 4A.
Table S7. sgRNA target sequence used in this study; Related to STAR Methods.
Table S8. Information of the mouse sgRNA metabolic library used in this study; Related to STAR Methods. All the sgRNAs in the mouse sgRNA metabolic sub-libraries are listed in two columns, AAAQ05 and AAAR07. Each sub-library consists of 9,051 sgRNAs targeting 3,017 cell metabolism-related genes (3 sgRNAs per gene per sub-library) encoding metabolic enzymes, small molecule transporters, and metabolism-related transcriptional regulators, as well as 500 non-targeting control sgRNAs.
KEY RESOURCES TABLE
| REAGENT or RESOURCE | SOURCE | IDENTIFIER |
|---|---|---|
| Antibodies | ||
| Anti-mouse CD4, PE (RM4–5) | Thermo Fisher Scientific | Cat# 12–0042-83; RRID:AB_465511 |
| Anti-mouse CD8α, PerCP (53–6.7) | Tonbo Biosciences | Cat# 65–0081; RRID:AB_2621882 |
| Anti-mouse CD45.1, FITC (A20) | Thermo Fisher Scientific | Cat# 11–0453-85; RRID:AB_465059 |
| Anti-mouse CD45.2, VioletFluor 450 (104) | Tonbo Biosciences | Cat# 75–0454; RRID:AB_2621950 |
| Anti-mouse CD44, Brilliant Violet 711 (IM7) | BD Biosciences | Cat# 563971; RRID:AB_2738518 |
| Anti-mouse CD62L, Brilliant Violet 711 (MEL-14) | BioLegend | Cat# 104445; RRID:AB_2564215 |
| Anti-mouse CXCR3, Brilliant Violet 650 (CXCR3–173) | BioLegend | Cat# 126531; RRID:AB_2563160 |
| Anti-mouse CD127, APC (A7R34) | Tonbo Biosciences | Cat# 20–1271, RRID:AB_2621588 |
| Anti-mouse KLRG1, Brilliant Violet 605 (2F1/KLRG1) | BioLegend | Cat# 138419; RRID:AB_2563357 |
| Anti-mouse granzyme B, Alexa Fluor 647 (GB11) | BioLegend | Cat# 515405; RRID:AB_2294995 |
| Anti-mouse IFN-γ, PE-Cyanine7 (XMG1.2) | BioLegend | Cat# 505826; RRID:AB_2295770 |
| Anti-mouse TNF-α, APC (MP6- XT22) | Thermo Fisher Scientific | Cat# 17–7321-82; RRID:AB_469508 |
| Anti-mouse CD27, PE (LG.7F9) | Thermo Fisher Scientific | Cat# 12–0271-81; RRID:AB_465613 |
| Anti-mouse Caspase-3, Alexa Fluor 647 (C92–605) | BD Biosciences | Cat# 560626; RRID:AB_1727414 |
| Anti-mouse Slc7a1 (Cat-1, ERR), PE (SA191A10) | BioLegend | Cat# 150503; RRID:AB_2566324 |
| Anti-mouse TCF1, Alexa Fluor 647 (C63D9) | Cell Signaling Technology | Cat# 6709; RRID:AB_2797631 |
| Anti-mouse BCL2, Alexa Fluor 647 (BCL/10C4) | BioLegend | Cat# 633510; RRID:AB_2274702 |
| Anti-mouse pS6 (S235/236), Pacific Blue (D57.2.2E) | Cell Signaling Technology | Cat# 8520; RRID:AB_2797646 |
| Anti-mouse CD3, FITC (17A2) | BD Biosciences | Cat# 555274; RRID:AB_395698 |
| Anti-mouse CD71, eFluor 450 (R17217) | Thermo Fisher Scientific | Cat# 48–0711-82; RRID:AB_2574027 |
| Anti-mouse CD98, PE (RL388) | Thermo Fisher Scientific | Cat# 12–0981-83; RRID:AB_465794 |
| Anti-mouse Foxp3, FITC (FJK-16s) | Thermo Fisher Scientific | Cat# 11–5773-82, RRID:AB_465243 |
| Anti-mouse CX3CR1, Brilliant Violet 421 (SA011F11) | BioLegend | Cat# 149023; RRID:AB_2565706 |
| Anti-mouse Ki-67, Pacific Blue (16A8) | BioLegend | Cat# 652422; RRID:AB_2564490 |
| Anti-mouse TCR-Valpha2, APC (B20.1) | BioLegend | Cat# 127810; RRID:AB_1089250 |
| Anti-mouse Thy-1.1, eFluor 450 (HIS51) | Thermo Fisher Scientific | Cat# 48–0900-82; RRID:AB_1272254 |
| Anti-mouse Thy-1.2, PE (53–2.1) | Thermo Fisher Scientific | Cat# 12–0902-83; RRID:AB_465777 |
| Anti-CD3 (145–2C11) | Bio-X-Cell | Cat# BE0001–1; RRID: AB_2714218 |
| Anti-CD28 (37.51) | Bio-X-Cell | Cat# BE0015–1; RRID: AB_1107624 |
| Anti-mouse Pten (138G6) | Cell Signaling Technology | Cat# 9559, RRID; AB_390810 |
| Anti-β-actin (AC-74) | Sigma-Aldrich | Cat# A2228; RRID:AB_476697 |
| Anti-Cat-1 | Proteintech | Cat# 14195–1-AP; RRID:AB_2190723 |
| Anti-Pofut1 | Proteintech | Cat# 14929–1-AP; RRID:AB_2166123 |
| Anti-Cleaved Notch1 (Val1744) (D3B8) | Cell Signaling Technology | Cat# 4147S; RRID:AB_2153348 |
| Mouse IgG (H+L), HRP conjugate | Promega | Cat# W4021; RRID: AB_430834 |
| Rabbit IgG (H+L), HRP conjugate | Promega | Cat# W4011; RRID: AB_430833 |
| Bacterial and Virus Strains | ||
| Ovalbumin (OVA) expressing Listeria monocytogenes | In house | N/A |
| LCMV Armstrong | In house | N/A |
| LCMV clone 13 | In house | N/A |
| Chemicals, Peptides, and Recombinant Proteins | ||
| Db/gp33 tetramer | NIH Tetramer Core Facility | N/A |
| Gp33 peptide | Macromolecular Synthesis Core Facility, St. Jude Children’s Research Hospital | N/A |
| OVA peptide (257–264) | Macromolecular Synthesis Core Facility, St. Jude Children’s Research Hospital | N/A |
| Collagenase, type IV | Worthington Biochemicals | Cat# LS004188 |
| Bovine pancreatic deoxyribonuclease I (DNase I) | Sigma-Aldrich | Cat# DN25–1G |
| CellTrace Violet | Thermo Fisher Scientific | Cat# C34557 |
| Mitotracker | Thermo Fisher Scientific | Cat# M22426 |
| CellROX | Thermo Fisher Scientific | Cat# C10422 |
| TMRM | ImmunoChemistry Technologies | Cat# 9105 |
| Ionomycin calcium salt | Sigma-Aldrich | Cat# I0634 |
| GolgiSTOP | BD Biosciences | Cat# 554724 |
| Fixable Viability Dye eFluor 780 | Thermo Fisher Scientific | Cat# 65–0865–14 |
| RIPA buffer | Thermo Fisher Scientific | Cat# 89901 |
| Polybrene | Sigma-Aldrich | Cat# H9268 |
| KOD Hot Start DNA Polymerase | Sigma-Aldrich | Cat# 71086 |
| Percoll | GE Healthcare | Cat#17089101 |
| AMPure XP beads | Beckman Coulter | Cat# A63881 |
| Guanosine 5′-diphospho-β-L-fucose sodium salt | Sigma-Aldrich | Cat# G4401 |
| L-Glutamine (13C5, 99%) | Cambridge Isotope Laboratories | Cat# CLM-1822-H-0.1 |
| Critical Commercial Assays | ||
| APC BrdU Flow Kit | BD Biosciences | Cat# 552598 |
| Fixation/Permeabilization Concentrate | Thermo Fisher Scientific | Cat# 00–5123-43 |
| Fixation/Permeabilization Diluent | Thermo Fisher Scientific | Cat# 00–5223-56 |
| Permeabilization Buffer | Thermo Fisher Scientific | Cat# 00–8333-56 |
| Seahorse XF Cell Mito Stress Test Kit | Agilent | Cat# 103015–100 |
| Transfection reagent | Mirus | Cat# MIR2706 |
| Fixation and Permeabilization Solution | BD Biosciences | Cat# 554722 |
| Perm/Wash Buffer | BD Biosciences | Cat# 554723 |
| Lineage cell depletion kit | Miltenyi Biotec | Cat# 130–090-858 |
| Naïve CD8+ T cell isolation kit | Miltenyi Biotec | Cat# 130–096-543 |
| Serum-free expansion medium | STEMCELL technologies | Cat# 09600 |
| SuperSignal West Femto Maximum Sensitivity Substrate | Thermo Fisher Scientific | Cat# 34096 |
| RNeasy Micro Kit | Qiagen | Cat# 74004 |
| DNeasy Blood & Tissue Kits | Qiagen | Cat# 69504 |
| Clariom S mouse array | Thermo Fisher Scientific | Cat# 902930 |
| MinElute | Qiagen | Cat# 28004 |
| Nextera DNA sample preparation kit | Illumina | Cat# FC-121–1031 |
| BD Phosflow™ Fix Buffer I | BD Biosciences | Cat# 557870 |
| Phosflow™ Perm Buffer II | BD Biosciences | Cat# 558052 |
| NEBNext HiFi 2× PCR master mix | NEB | Cat# M0541S |
| High Sensitivity D5000 ScreenTape | Agilent | Cat# 5067–5592 |
| High Sensitivity D5000 Reagents | Agilent | Cat# 5067–5593 |
| Chromium Next GEM Single Cell 3ʹ GEM, Library & Gel Bead Kit v3.1 | 10X Genomics | Cat# PN-1000128 |
| Chromium Next GEM Chip G Single Cell Kit | 10X Genomics | Cat# PN-1000127 |
| Chromium i7 Sample Index Plate | 10X Genomics | Cat# PN-220103 |
| Kapa SybrFast qPCR Master Mix | Kapa Biosystems | Cat# KK4600 |
| Qiaquick PCR purification Kit (250) | Qiagen | Cat# 28106 |
| SuperScript™ III First-Strand Synthesis System | Thermo Fisher Scientific | Cat# 18080051 |
| Power SYBR™ Green PCR Master Mix | Thermo Fisher Scientific | Cat# 4367659 |
| RNaseOUT™ Recombinant Ribonuclease Inhibitor | Thermo Fisher Scientific | Cat# 10777019 |
| Random Primers | Thermo Fisher Scientific | Cat#48190011 |
| Deposited Data | ||
| Data files for microarray | This paper | GSE148681 |
| Processed single-cell RNA sequencing data | This paper | GSE148681 |
| Data files for ATAC-seq | This paper | GSE148681 |
| Experimental Models: Cell Lines | ||
| B16-OVA | Dr. Dario A. Vignali, University of Pittsburgh | N/A |
| Plat-E | Dr. Yun-Cai Liu, La Jolla Institute of Immunology | N/A |
| Experimental Models: Organisms/Strains | ||
| Mouse: B6 (C57BL/6J) mice | The Jackson Laboratory | Cat# JAX:000664; RRID: IMSR_JAX:000664 |
| Mouse: P14 mice | Dr. Benjamin A. Youngblood, St. Jude Children's Research Hospital | N/A |
| Mouse: Pofut1fl/fl mice | The Jackson Laboratory | Cat# JAX:000664; RRID:IMSR_JAX: 000664 |
| Mouse: Slc38a2tm1a(KOMP)Wtsi mice | INFRAFRONTIER/EMMA | Cat# EM: EM:09889 |
| Mouse: Rosa26-Cas9 knock-in mice | The Jackson Laboratory | Cat# JAX:026179, RRID:IMSR_JAX:02617 9 |
| Mouse: ACTB:FLPe B6J mice | The Jackson Laboratory | Cat# JAX: 005703; RRID:IMSR_JAX: 005703 |
| Mouse: OT-1 mice | The Jackson Laboratory | Cat# JAX:003831 RRID:IMSR_JAX:00383 1 |
| Mouse: CD45.1+: B6.SJL-Ptprca Pep3b/BoyJ | The Jackson Laboratory | Cat# 002014; RRID:IMSR_JAX:00201 4 |
| Mouse: Cd4Cre: Tg(Cd4- cre)1Cwi/BfluJ | The Jackson Laboratory | Cat# 017336; RRID:IMSR_JAX:01733 6 |
| Mouse: Rag1–/–: Rag1tm1Mom/J | The Jackson Laboratory | Cat# 002216; RRID:IMSR_JAX:00221 6 |
| Oligonucleotides | ||
| Nextera NGS-F TCGTCGGCAGCGTCAGATGTGT ATAAGAGACAGTTGTGGAAAGGACGAAACACCG |
This paper | N/A |
| Nextera NGS-R: GTCTCGTGGGCTCGGAGATGTG TATAAGAGACAGCCACTTTTTCAAGTTGATAACGG |
This paper | N/A |
| NICD-F GGAATTCGCCACCATGCTTGCA TGCCTGCAGGTCGACT |
This paper | N/A |
| NICD-R CAATTGGGATCCTTATTTAAAT GCCTCTGGAATGT |
This paper | N/A |
| Pofut1-F GGAATTCGCCACCATGGGCGCCGCCGCGTGGGCACCGCCA |
This paper | N/A |
| Pofut1-R CAATTGGGATCCTCAAAATTCA TCCCGAAGCTGGGA |
This paper | N/A |
| sgRNA targeting sequences | This paper | See Table S8 |
| Recombinant DNA | ||
| lentiGuide-puro | (Sanjana et al., 2014) | Addgene plasmid # 52963 |
| pLMPd-Amt | (Chen et al., 2014) | Yun-Cai Liu, La Jolla Institute of Immunology |
| pCAG4-Eco | Addgene plasmid # 12260 | |
| psPAX2 | Addgene plasmid # 12259 | |
| 3XFlagNICD1 | Addgene plasmid # #20183 | |
| Metabolic library | (Wei et al., 2019) | Dr. Hongbo Chi, St. Jude Children's Research Hospital |
| Software and Algorithms | ||
| FlowJo software 10.4.2 | Tree Star | https://www.flowjo.com |
| GraphPad PRISM 7.0 | Graphpad Software | https://www.graphpad.com/scientificsoftware/prism/ |
| HiSeq Analysis software | Illumina | https://support.illumina.com/sequencing/sequencing_software/hiseq-analysis-software-v2-1.html |
| CLC Genomics Workbench v.11 | Qiagen | https://digitalinsights.qiagen.com/products-overview/discovery-insights-portfolio/analysis-and-visualization/qiagen-clc-genomics-workbench/ |
| limma v.3.34.9 | (Ritchie et al., 2015) | https://www.bioconductor.org/packages/devel/bioc/vignettes/limma/inst/doc/usersguide.pdf |
| Gene set enrichment analysis (GSEA) | (Subramanian et al., 2005) | http://www.broadinstitute.org/gsea/msigdb/ |
| BWA v 0.7.16 | (Li and Durbin, 2009) | https://github.com/lh3/bwa/releases |
| Samtools | (Li et al., 2009) | http://www.htslib.org/ |
| IGV v2.4.13 | (Robinson et al., 2011) | https://software.broadinstiute.org/software/igv/download |
| MACS2 v2.1.1.20160309 | (Zhang et al., 2008) | https://pydoc.net/MACS2/2.1.1.20160309/ |
| DESeq2 | (Love et al., 2014) | https://bioconductor.org/packages/release/bioc/html/DESeq2.html |
| HOMER | (Heinz et al., 2010) | |
| MEME suite | (Bailey et al., 2009) | http://meme-suite.org/ |
| RGT HINT | (Li et al., 2019) | http://www.regulatory-genomics.org/hint/introduction/ |
| Cell Ranger 1.3 | 10X Genomics | https://support.10xgenomics.com/single-cell-gene-expression/software/pipelines/latest/installation |
| sctransform v0.2.1 | (Hafemeister and Satija, 2019) | https://www.rdocumentatin.org/packages/sctransform/versions/0.2.1 |
| Seurat R package (v3.1.2) | (Butler et al., 2018) | https://satijalab.org/seurat/ |
| UMAP | (McInnes et al., 2018) | https://arxiv.org/abs/1802.03426 |
| fGSEA v1.10.1 | (Korotkevich, 2019) | https://www.biorxiv.org/content/10.1101/060012v2.full |
| AUCell | (Aibar et al., 2017) | https://bioconductor.org/packages/release/bioc/html/AUCell.html |
| velocyto.R | (La Manno et al., 2018) | https://github.com/velocyto-team/velocyto.R |
| Bedtools v.2.25.0 | (Quinlan and Hall, 2010) | https://github.com/arq5x/bedtools2/releases |
| CRIS.py | (Connelly and Pruett-Miller, 2019) | https://github.com/patrickc01/CRIS.py |
| Other | ||
| LSR II flow cytometer | BD Biosciences | N/A |
| Reflection cell sorter | iCyt | N/A |
| Seahorse XFe96 analyzer | Agilent | N/A |
| Agilent 2100 bioanalyzer | Agilent | N/A |
| Hiseq and NovaSeq | Illumina | N/A |
| 4200 TapeStation System | Agilent | N/A |
| ODYSSEY Fc Analyzer | LI-COR | N/A |
| Chromium Single Cell Controller | 10X Genomics | N/A |
Highlights.
Systematic discovery of metabolic regulators for CD8+ T cell fate decisions in vivo.
Amino acids restrict quantity of T cell memory.
Pofut1 loss promotes TEFF and TMEM responses by blocking terminal differentiation.
Pofut1 links GDP-fucose availability to Notch–Rbpj signaling in fate decisions.
ACKNOWLEDGMENTS
The authors acknowledge B.A. Youngblood for P14 mice; D.A. Vignali for B16-OVA cell line; Y.C. Liu for Plat-E cells; E.J. Wherry and Z. Chen for scientific discussions; Y. Wang for editing the manuscript; M. Hendren, A. KC and S. Rankin for animal management; St. Jude Immunology flow cytometry core facility for cell sorting; The Hartwell Center for microarray, ATAC-seq and scRNA-seq analyses; Center for Advanced Genome Engineering for targeted sequencing; and Veterinary Pathology Core for histology examination. This work was supported by AI105887, AI131703, AI140761, CA176624 and CA221290 (to H.C.). The content is solely the responsibility of the authors and does not necessarily represent the official views of the National Institutes of Health.
Footnotes
Publisher's Disclaimer: This is a PDF file of an unedited manuscript that has been accepted for publication. As a service to our customers we are providing this early version of the manuscript. The manuscript will undergo copyediting, typesetting, and review of the resulting proof before it is published in its final form. Please note that during the production process errors may be discovered which could affect the content, and all legal disclaimers that apply to the journal pertain.
DECLARATION OF INTERESTS
H. Chi is a consultant for Kumquat Biosciences, Inc.
References
- Aibar S, Gonzalez-Blas CB, Moerman T, Huynh-Thu VA, Imrichova H, Hulselmans G, Rambow F, Marine JC, Geurts P, Aerts J, et al. (2017). SCENIC: single-cell regulatory network inference and clustering. Nat Methods 14, 1083–1086. [DOI] [PMC free article] [PubMed] [Google Scholar]
- Amsen D, Helbig C, and Backer RA (2015). Notch in T Cell Differentiation: All Things Considered. Trends Immunol 36, 802–814. [DOI] [PubMed] [Google Scholar]
- Araki K, Turner AP, Shaffer VO, Gangappa S, Keller SA, Bachmann MF, Larsen CP, and Ahmed R (2009). mTOR regulates memory CD8 T-cell differentiation. Nature 460, 108–112. [DOI] [PMC free article] [PubMed] [Google Scholar]
- Bailey TL, Boden M, Buske FA, Frith M, Grant CE, Clementi L, Ren J, Li WW, and Noble WS (2009). MEME SUITE: tools for motif discovery and searching. Nucleic Acids Res 37, W202–208. [DOI] [PMC free article] [PubMed] [Google Scholar]
- Birsoy K, Wang T, Chen WW, Freinkman E, Abu-Remaileh M, and Sabatini DM (2015). An Essential Role of the Mitochondrial Electron Transport Chain in Cell Proliferation Is to Enable Aspartate Synthesis. Cell 162, 540–551. [DOI] [PMC free article] [PubMed] [Google Scholar]
- Buenrostro JD, Giresi PG, Zaba LC, Chang HY, and Greenleaf WJ (2013). Transposition of native chromatin for fast and sensitive epigenomic profiling of open chromatin, DNA-binding proteins and nucleosome position. Nat Methods 10, 1213–1218. [DOI] [PMC free article] [PubMed] [Google Scholar]
- Butler A, Hoffman P, Smibert P, Papalexi E, and Satija R (2018). Integrating single-cell transcriptomic data across different conditions, technologies, and species. Nat Biotechnol 36, 411–420. [DOI] [PMC free article] [PubMed] [Google Scholar]
- Carty SA, Gohil M, Banks LB, Cotton RM, Johnson ME, Stelekati E, Wells AD, Wherry EJ, Koretzky GA, and Jordan MS (2018). The Loss of TET2 Promotes CD8(+) T Cell Memory Differentiation. J Immunol 200, 82–91. [DOI] [PMC free article] [PubMed] [Google Scholar]
- Chapman NM, Boothby MR, and Chi H (2020). Metabolic coordination of T cell quiescence and activation. Nat Rev Immunol 20, 55–70. [DOI] [PubMed] [Google Scholar]
- Chen R, Belanger S, Frederick MA, Li B, Johnston RJ, Xiao N, Liu YC, Sharma S, Peters B, Rao A, et al. (2014). In vivo RNA interference screens identify regulators of antiviral CD4(+) and CD8(+) T cell differentiation. Immunity 41, 325–338. [DOI] [PMC free article] [PubMed] [Google Scholar]
- Chen Z, Ji Z, Ngiow SF, Manne S, Cai Z, Huang AC, Johnson J, Staupe RP, Bengsch B, Xu C, et al. (2019). TCF-1-Centered Transcriptional Network Drives an Effector versus Exhausted CD8 T Cell-Fate Decision. Immunity 51, 840–855.e845. [DOI] [PMC free article] [PubMed] [Google Scholar]
- Chen Z, Arai E, Khan O, Zhang Z, Ngiow SF, He Y, Huang H, Manne S, Cao Z, Baxter AE, et al. (2020). In vivo CRISPR screening identifies Fli1 as a transcriptional safeguard that restrains effector CD8 T cell differentiation during infection and cancer. bioRxiv preprint at 10.1101/2020.1105.1120.087379. [DOI]
- Connelly JP, and Pruett-Miller SM (2019). CRIS.py: A Versatile and High-throughput Analysis Program for CRISPR-based Genome Editing. Sci Rep 9, 4194. [DOI] [PMC free article] [PubMed] [Google Scholar]
- Crompton JG, Sukumar M, and Restifo NP (2014). Uncoupling T-cell expansion from effector differentiation in cell-based immunotherapy. Immunol Rev 257, 264–276. [DOI] [PMC free article] [PubMed] [Google Scholar]
- Endo Y, Onodera A, Obata-Ninomiya K, Koyama-Nasu R, Asou HK, Ito T, Yamamoto T, Kanno T, Nakajima T, Ishiwata K, et al. (2019). ACC1 determines memory potential of individual CD4+ T cells by regulating de novo fatty acid biosynthesis. Nature Metabolism 1, 261–275. [DOI] [PubMed] [Google Scholar]
- Fraietta JA, Nobles CL, Sammons MA, Lundh S, Carty SA, Reich TJ, Cogdill AP, Morrissette JJD, DeNizio JE, Reddy S, et al. (2018). Disruption of TET2 promotes the therapeutic efficacy of CD19-targeted T cells. Nature 558, 307–312. [DOI] [PMC free article] [PubMed] [Google Scholar]
- Geltink RIK, Kyle RL, and Pearce EL (2018). Unraveling the Complex Interplay Between T Cell Metabolism and Function. Annu Rev Immunol 36, 461–488. [DOI] [PMC free article] [PubMed] [Google Scholar]
- Gerlach C, Moseman EA, Loughhead SM, Alvarez D, Zwijnenburg AJ, Waanders L, Garg R, de la Torre JC, and von Andrian UH (2016). The Chemokine Receptor CX3CR1 Defines Three Antigen-Experienced CD8 T Cell Subsets with Distinct Roles in Immune Surveillance and Homeostasis. Immunity 45, 1270–1284. [DOI] [PMC free article] [PubMed] [Google Scholar]
- Guruharsha KG, Kankel MW, and Artavanis-Tsakonas S (2012). The Notch signalling system: recent insights into the complexity of a conserved pathway. Nat Rev Genet 13, 654–666. [DOI] [PMC free article] [PubMed] [Google Scholar]
- Guy CS, Vignali KM, Temirov J, Bettini ML, Overacre AE, Smeltzer M, Zhang H, Huppa JB, Tsai YH, Lobry C, et al. (2013). Distinct TCR signaling pathways drive proliferation and cytokine production in T cells. Nat Immunol 14, 262–270. [DOI] [PMC free article] [PubMed] [Google Scholar]
- Hafemeister C, and Satija R (2019). Normalization and variance stabilization of single-cell RNA-seq data using regularized negative binomial regression. Genome Biol 20, 296. [DOI] [PMC free article] [PubMed] [Google Scholar]
- Haines RJ, Pendleton LC, and Eichler DC (2011). Argininosuccinate synthase: at the center of arginine metabolism. Int J Biochem Mol Biol 2, 8–23. [PMC free article] [PubMed] [Google Scholar]
- Hamilton SE, and Jameson SC (2012). CD8 T cell memory: it takes all kinds. Front Immunol 3, 353. [DOI] [PMC free article] [PubMed] [Google Scholar]
- Hand TW, Cui W, Jung YW, Sefik E, Joshi NS, Chandele A, Liu Y, and Kaech SM (2010). Differential effects of STAT5 and PI3K/AKT signaling on effector and memory CD8 T-cell survival. Proc Natl Acad Sci U S A 107, 16601–16606. [DOI] [PMC free article] [PubMed] [Google Scholar]
- He R, Hou S, Liu C, Zhang A, Bai Q, Han M, Yang Y, Wei G, Shen T, Yang X, et al. (2016). Follicular CXCR5- expressing CD8(+) T cells curtail chronic viral infection. Nature 537, 412–428. [DOI] [PubMed] [Google Scholar]
- Hedrick SM, Hess Michelini R, Doedens AL, Goldrath AW, and Stone EL (2012). FOXO transcription factors throughout T cell biology. Nat Rev Immunol 12, 649–661. [DOI] [PMC free article] [PubMed] [Google Scholar]
- Heinz S, Benner C, Spann N, Bertolino E, Lin YC, Laslo P, Cheng JX, Murre C, Singh H, and Glass CK (2010). Simple combinations of lineage-determining transcription factors prime cis-regulatory elements required for macrophage and B cell identities. Mol Cell 38, 576–589. [DOI] [PMC free article] [PubMed] [Google Scholar]
- Herndler-Brandstetter D, Ishigame H, Shinnakasu R, Plajer V, Stecher C, Zhao J, Lietzenmayer M, Kroehling L, Takumi A, Kometani K, et al. (2018). KLRG1(+) Effector CD8(+) T Cells Lose KLRG1, Differentiate into All Memory T Cell Lineages, and Convey Enhanced Protective Immunity. Immunity 48, 716–729.e718. [DOI] [PMC free article] [PubMed] [Google Scholar]
- Hogquist KA, Jameson SC, Heath WR, Howard JL, Bevan MJ, and Carbone FR (1994). T cell receptor antagonist peptides induce positive selection. Cell 76, 17–27. [DOI] [PubMed] [Google Scholar]
- Hsiao HW, Liu WH, Wang CJ, Lo YH, Wu YH, Jiang ST, and Lai MZ (2009). Deltex1 is a target of the transcription factor NFAT that promotes T cell anergy. Immunity 31, 72–83. [DOI] [PubMed] [Google Scholar]
- Huang H, Long L, Zhou P, Chapman NM, and Chi H (2020). mTOR signaling at the crossroads of environmental signals and T-cell fate decisions. Immunol Rev. [DOI] [PMC free article] [PubMed]
- Im SJ, Hashimoto M, Gerner MY, Lee J, Kissick HT, Burger MC, Shan Q, Hale JS, Lee J, Nasti TH, et al. (2016). Defining CD8+ T cells that provide the proliferative burst after PD-1 therapy. Nature 537, 417–421. [DOI] [PMC free article] [PubMed] [Google Scholar]
- Jameson SC, and Masopust D (2018). Understanding Subset Diversity in T Cell Memory. Immunity 48, 214–226. [DOI] [PMC free article] [PubMed] [Google Scholar]
- Joshi NS, Cui W, Chandele A, Lee HK, Urso DR, Hagman J, Gapin L, and Kaech SM (2007). Inflammation directs memory precursor and short-lived effector CD8(+) T cell fates via the graded expression of T-bet transcription factor. Immunity 27, 281–295. [DOI] [PMC free article] [PubMed] [Google Scholar]
- Kaech SM, and Cui W (2012). Transcriptional control of effector and memory CD8+ T cell differentiation. Nat Rev Immunol 12, 749–761. [DOI] [PMC free article] [PubMed] [Google Scholar]
- Kallies A, Zehn D, and Utzschneider DT (2020). Precursor exhausted T cells: key to successful immunotherapy? Nat Rev Immunol 20, 128–136. [DOI] [PubMed] [Google Scholar]
- Karmaus PWF, Chen X, Lim SA, Herrada AA, Nguyen TM, Xu B, Dhungana Y, Rankin S, Chen W, Rosencrance C, et al. (2019). Metabolic heterogeneity underlies reciprocal fates of TH17 cell stemness and plasticity. Nature 565, 101–105. [DOI] [PMC free article] [PubMed] [Google Scholar]
- Kilberg MS, Balasubramanian M, Fu L, and Shan J (2012). The transcription factor network associated with the amino acid response in mammalian cells. Adv Nutr 3, 295–306. [DOI] [PMC free article] [PubMed] [Google Scholar]
- Kim MV, Ouyang W, Liao W, Zhang MQ, and Li MO (2014). Murine in vivo CD8(+) T Cell Killing Assay. Bio Protoc 4. [DOI] [PMC free article] [PubMed] [Google Scholar]
- Korotkevich G, Sukhov V, and Sergushichev A (2019). Fast gene set enrichment analysis. Preprint at 10.1101/060012. [DOI]
- La Manno G, Soldatov R, Zeisel A, Braun E, Hochgerner H, Petukhov V, Lidschreiber K, Kastriti ME, Lonnerberg P, Furlan A, et al. (2018). RNA velocity of single cells. Nature 560, 494–498. [DOI] [PMC free article] [PubMed] [Google Scholar]
- Lefrançois L, and Obar JJ (2010). Once a killer, always a killer: from cytotoxic T cell to memory cell. Immunol Rev 235, 206–218. [DOI] [PMC free article] [PubMed] [Google Scholar]
- Li H, and Durbin R (2009). Fast and accurate short read alignment with Burrows-Wheeler transform. Bioinformatics 25, 1754–1760. [DOI] [PMC free article] [PubMed] [Google Scholar]
- Li H, Handsaker B, Wysoker A, Fennell T, Ruan J, Homer N, Marth G, Abecasis G, and Durbin R (2009). The Sequence Alignment/Map format and SAMtools. Bioinformatics 25, 2078–2079. [DOI] [PMC free article] [PubMed] [Google Scholar]
- Li Z, Schulz MH, Look T, Begemann M, Zenke M, and Costa IG (2019). Identification of transcription factor binding sites using ATAC-seq. Genome Biol 20, 45. [DOI] [PMC free article] [PubMed] [Google Scholar]
- Love MI, Huber W, and Anders S (2014). Moderated estimation of fold change and dispersion for RNA-seq data with DESeq2. Genome Biol 15, 550. [DOI] [PMC free article] [PubMed] [Google Scholar]
- Ma EH, Verway MJ, Johnson RM, Roy DG, Steadman M, Hayes S, Williams KS, Sheldon RD, Samborska B, Kosinski PA, et al. (2019). Metabolic Profiling Using Stable Isotope Tracing Reveals Distinct Patterns of Glucose Utilization by Physiologically Activated CD8(+) T Cells. Immunity 51, 856–870.e855. [DOI] [PubMed] [Google Scholar]
- Matsushita K, Takeuchi O, Standley DM, Kumagai Y, Kawagoe T, Miyake T, Satoh T, Kato H, Tsujimura T, Nakamura H, et al. (2009). Zc3h12a is an RNase essential for controlling immune responses by regulating mRNA decay. Nature 458, 1185–1190. [DOI] [PubMed] [Google Scholar]
- McInnes L, Healy J, and Melville J (2018). UMAP: uniform manifold approximation and projection for dimension reduction. Preprint at https://arxiv.org/abs/1802.03426
- Okajima T, Xu A, Lei L, and Irvine KD (2005). Chaperone activity of protein O-fucosyltransferase 1 promotes notch receptor folding. Science 307, 1599–1603. [DOI] [PubMed] [Google Scholar]
- Omilusik KD, and Goldrath AW (2019). Remembering to remember: T cell memory maintenance and plasticity. Curr Opin Immunol 58, 89–97. [DOI] [PMC free article] [PubMed] [Google Scholar]
- Palaga T, Miele L, Golde TE, and Osborne BA (2003). TCR-mediated Notch signaling regulates proliferation and IFN-gamma production in peripheral T cells. J Immunol 171, 3019–3024. [DOI] [PubMed] [Google Scholar]
- Pearce EL, Walsh MC, Cejas PJ, Harms GM, Shen H, Wang LS, Jones RG, and Choi Y (2009). Enhancing CD8 T-cell memory by modulating fatty acid metabolism. Nature 460, 103–107. [DOI] [PMC free article] [PubMed] [Google Scholar]
- Pircher H, Burki K, Lang R, Hengartner H, and Zinkernagel RM (1989). Tolerance induction in double specific T-cell receptor transgenic mice varies with antigen. Nature 342, 559–561. [DOI] [PubMed] [Google Scholar]
- Platt RJ, Chen S, Zhou Y, Yim MJ, Swiech L, Kempton HR, Dahlman JE, Parnas O, Eisenhaure TM, Jovanovic M, et al. (2014). CRISPR-Cas9 knockin mice for genome editing and cancer modeling. Cell 159, 440–455. [DOI] [PMC free article] [PubMed] [Google Scholar]
- Pollizzi KN, Sun IH, Patel CH, Lo YC, Oh MH, Waickman AT, Tam AJ, Blosser RL, Wen J, Delgoffe GM, et al. (2016). Asymmetric inheritance of mTORC1 kinase activity during division dictates CD8(+) T cell differentiation. Nat Immunol 17, 704–711. [DOI] [PMC free article] [PubMed] [Google Scholar]
- Quinlan AR, and Hall IM (2010). BEDTools: a flexible suite of utilities for comparing genomic features. Bioinformatics 26, 841–842. [DOI] [PMC free article] [PubMed] [Google Scholar]
- Restifo NP, and Gattinoni L (2013). Lineage relationship of effector and memory T cells. Curr Opin Immunol 25, 556–563. [DOI] [PMC free article] [PubMed] [Google Scholar]
- Ritchie ME, Phipson B, Wu D, Hu Y, Law CW, Shi W, and Smyth GK (2015). limma powers differential expression analyses for RNA-sequencing and microarray studies. Nucleic Acids Res 43, e47. [DOI] [PMC free article] [PubMed] [Google Scholar]
- Robinson JT, Thorvaldsdottir H, Winckler W, Guttman M, Lander ES, Getz G, and Mesirov JP (2011). Integrative genomics viewer. Nat Biotechnol 29, 24–26. [DOI] [PMC free article] [PubMed] [Google Scholar]
- Rutishauser RL, Martins GA, Kalachikov S, Chandele A, Parish IA, Meffre E, Jacob J, Calame K, and Kaech SM (2009). Transcriptional repressor Blimp-1 promotes CD8(+) T cell terminal differentiation and represses the acquisition of central memory T cell properties. Immunity 31, 296–308. [DOI] [PMC free article] [PubMed] [Google Scholar]
- Sade-Feldman M, Yizhak K, Bjorgaard SL, Ray JP, de Boer CG, Jenkins RW, Lieb DJ, Chen JH, Frederick DT, Barzily-Rokni M, et al. (2018). Defining T Cell States Associated with Response to Checkpoint Immunotherapy in Melanoma. Cell 175, 998–1013.e1020. [DOI] [PMC free article] [PubMed] [Google Scholar]
- Sanson KR, Hanna RE, Hegde M, Donovan KF, Strand C, Sullender ME, Vaimberg EW, Goodale A, Root DE, Piccioni F, et al. (2018). Optimized libraries for CRISPR-Cas9 genetic screens with multiple modalities. Nat Commun 9, 5416. [DOI] [PMC free article] [PubMed] [Google Scholar]
- Saravia J, Raynor JL, Chapman NM, Lim SA, and Chi H (2020). Signaling networks in immunometabolism. Cell Res. [DOI] [PMC free article] [PubMed]
- Sarkar S, Kalia V, Haining WN, Konieczny BT, Subramaniam S, and Ahmed R (2008). Functional and genomic profiling of effector CD8 T cell subsets with distinct memory fates. J Exp Med 205, 625–640. [DOI] [PMC free article] [PubMed] [Google Scholar]
- Saxton RA, and Sabatini DM (2017). mTOR Signaling in Growth, Metabolism, and Disease. Cell 168, 960–976. [DOI] [PMC free article] [PubMed] [Google Scholar]
- Schneider M, Al-Shareffi E, and Haltiwanger RS (2017). Biological functions of fucose in mammals. Glycobiology 27, 601–618. [DOI] [PMC free article] [PubMed] [Google Scholar]
- Sentmanat MF, Peters ST, Florian CP, Connelly JP, and Pruett-Miller SM (2018). A Survey of Validation Strategies for CRISPR-Cas9 Editing. Sci Rep 8, 888. [DOI] [PMC free article] [PubMed] [Google Scholar]
- Shi S, and Stanley P (2003). Protein O-fucosyltransferase 1 is an essential component of Notch signaling pathways. Proc Natl Acad Sci U S A 100, 5234–5239. [DOI] [PMC free article] [PubMed] [Google Scholar]
- Stahl M, Uemura K, Ge C, Shi S, Tashima Y, and Stanley P (2008). Roles of Pofut1 and O-fucose in mammalian Notch signaling. J Biol Chem 283, 13638–13651. [DOI] [PMC free article] [PubMed] [Google Scholar]
- Subramanian A, Tamayo P, Mootha VK, Mukherjee S, Ebert BL, Gillette MA, Paulovich A, Pomeroy SL, Golub TR, Lander ES, et al. (2005). Gene set enrichment analysis: a knowledge-based approach for interpreting genome-wide expression profiles. Proc Natl Acad Sci U S A 102, 15545–15550. [DOI] [PMC free article] [PubMed] [Google Scholar]
- Uehata T, Iwasaki H, Vandenbon A, Matsushita K, Hernandez-Cuellar E, Kuniyoshi K, Satoh T, Mino T, Suzuki Y, Standley DM, et al. (2013). Malt1-induced cleavage of regnase-1 in CD4(+) helper T cells regulates immune activation. Cell 153, 1036–1049. [DOI] [PubMed] [Google Scholar]
- Verbist KC, Guy CS, Milasta S, Liedmann S, Kaminski MM, Wang R, and Green DR (2016). Metabolic maintenance of cell asymmetry following division in activated T lymphocytes. Nature 532, 389–393. [DOI] [PMC free article] [PubMed] [Google Scholar]
- Verrey F, Closs EI, Wagner CA, Palacin M, Endou H, and Kanai Y (2004). CATs and HATs: the SLC7 family of amino acid transporters. Pflugers Arch 447, 532–542. [DOI] [PubMed] [Google Scholar]
- Wei J, Long L, Zheng W, Dhungana Y, Lim SA, Guy C, Wang Y, Wang YD, Qian C, Xu B, et al. (2019). Targeting REGNASE-1 programs long-lived effector T cells for cancer therapy. Nature 576, 471–476. [DOI] [PMC free article] [PubMed] [Google Scholar]
- Wherry EJ, Teichgraber V, Becker TC, Masopust D, Kaech SM, Antia R, von Andrian UH, and Ahmed R (2003a). Lineage relationship and protective immunity of memory CD8 T cell subsets. Nat Immunol 4, 225–234. [DOI] [PubMed] [Google Scholar]
- Wherry EJ, Blattman JN, Murali-Krishna K, van der Most R, and Ahmed R (2003b). Viral persistence alters CD8 T-cell immunodominance and tissue distribution and results in distinct stages of functional impairment. J Virol 77, 4911–4927. [DOI] [PMC free article] [PubMed] [Google Scholar]
- Yamada T, Park CS, Mamonkin M, and Lacorazza HD (2009). Transcription factor ELF4 controls the proliferation and homing of CD8+ T cells via the Kruppel-like factors KLF4 and KLF2. Nat Immunol 10, 618–626. [DOI] [PMC free article] [PubMed] [Google Scholar]
- Yang K, Shrestha S, Zeng H, Karmaus PW, Neale G, Vogel P, Guertin DA, Lamb RF, and Chi H (2013). T cell exit from quiescence and differentiation into Th2 cells depend on Raptor-mTORC1-mediated metabolic reprogramming. Immunity 39, 1043–1056. [DOI] [PMC free article] [PubMed] [Google Scholar]
- Zhang Y, Liu T, Meyer CA, Eeckhoute J, Johnson DS, Bernstein BE, Nusbaum C, Myers RM, Brown M, Li W, et al. (2008). Model-based analysis of ChIP-Seq (MACS). Genome Biol 9, R137. [DOI] [PMC free article] [PubMed] [Google Scholar]
Associated Data
This section collects any data citations, data availability statements, or supplementary materials included in this article.
Supplementary Materials
(A and B) P14 cells transduced with the same sgNTC but with different fluorescent proteins (GFP+ or Ametrine+) were mixed at a 1:1 ratio and transferred to naïve hosts followed by LCMV infection (dual-color transfer system). Flow cytometry of Ametrine versus GFP (left) or CD127 versus KLRG1 expression (pre-gated as indicated; right) in splenic P14 cells at day 7.5 p.i. (A) and day > 30 p.i. (B). (C) Summary of genome editing efficiencies of the major metabolic regulators investigated in this study. g1, guide 1; g2, guide 2. (D and E) Flow cytometry of CD127 versus KLRG1 expression (D) and quantification of MP/TE ratio (E; left) and proportions of CXCR3hiCD27hi (E; middle) and CD62L+ (E; right) cells. (F) Immunoblot analysis of Pten in sgNTC- and sgPten-transduced P14 cells at day 3 or day 4 post-activation. (G and H) Flow cytometry of CD127 versus KLRG1 expression (G) and quantification of the MP/TE ratio (H; left) and proportions of CXCR3hiCD27hi (H; middle) and CD62L+ (H; right) cells. (I) Quantification of normalized ratio (to sgNTC-transduced cells) of MP versus TE cells in splenic P14 cells transduced with the indicated sgRNAs (single-color transfer system) at day 7.5 p.i. g1 or g2, two individual sgRNAs targeting the same gene. Asterisks indicate significance between indicated sgRNAs and sgNTC. (J) Immunoblot analysis of Slc7a1 expression in sgNTC- or sgSlc7a1-transduced cells at day 7.5 p.i. (K) Real-time PCR analysis of Slc38a2 expression in sgNTC- or sgSlc38a2-transduced cells at day 7.5 p.i. (L) P14 cells transduced with sgNTC or the indicated sgRNAs (dual-color transfer system) were analyzed at day 7.5 p.i. Flow cytometry of CD127 versus KLRG1 expression (left) and quantification (right) of the MP/TE ratio. (M) Quantification of the MP/TE ratio (left) and proportions of CXCR3hiCD27hi (middle) and CD62L+ (right) cells among OT-1 cells at day 7.5 after Lm-OVA infection. Data are from one (C and F), representative of at least two (A, B, and J), or compiled from at least two (D, E, G–I, K, and M) independent experiments, with ≥ 2 (C), ≥ 4 (D, E, and I), 3 (G and H), or ≥ 5 (L and M) biological replicates per group. *P < 0.05, **P < 0.01, and ***P < 0.001; two-tailed paired Student’s t-test (E, H, L, and M) or two-tailed unpaired Student’s t-test (I and K). Data are presented as mean ± s.e.m.
(A) Quantification of the numbers of TCM (CD62L+; left) and TEM (CD62L−; right) cells from mice described in Figure 2B from the single-color transfer system at day > 30 p.i. Fold changes between the groups in different organs are shown above the bar graphs. pLN, peripheral lymph nodes; BM, bone marrow. Total, the sum of donor-derived cells in pLN, spleen, BM, liver and lung. (B) Longitudinal analysis of the relative fold change (normalized to ‘spike’ cells) of indicated sgRNA-transduced OT-1 cells in the blood during Lm-OVA infection. (C) Flow cytometry (left) and quantification of the relative fold change (normalized to ‘spike’ cells; right) in indicated organs at day > 30 p.i. (D) Flow cytometry (left) and quantification of the frequency (middle) and number (right) of donor-derived splenic P14 cells transduced with indicated sgRNAs at day 6 after the secondary challenge. (E) Flow cytometry (left) and quantification of the relative fold change (normalized to ‘spike’ cel ls; right) of splenic OT-1 cells transduced with indicated sgRNAs at day 6 after the secondary Lm-OVA challenge. (F–H) Real-time PCR analysis of Asns and Trib3 (F and G) or Ass1 (H) in the indicated P14 cells at day 7.5 p.i. (I) Real-time PCR analysis of Slc38a2 in naïve CD8+ T cells from Cd4CreSlc38a2wt and Cd4CreSlc38a2fl/fl mice. (J) Quantification of [U-13C] glutamine uptake in WT and Slc38a2-deficient cells. (K) Quantification of intracellular glutamine content in WT and Slc38a2-null cells. (L) Flow cytometry of pS6 phosphorylation (pS6) in P14 cells transduced with sgNTC. (M) Flow cytometry (left) and quantification (right) of the mean fluorescence intensity (MFI) of Slc7a1 at day 3 p.i. CTV, CellTrace Violet. Data are representative of at least two (L), or compiled from at least two (A–K and M) independent experiments, with ≥ 4 (A, C, L, and M), 9 (B), ≥ 5 (D–H), or 6 (I–K) biological replicates per group . *P < 0.05, **P < 0.01, and ***P < 0.001; NS, not significant; two-tailed paired Student’s t-test (A and M) or two-tailed unpaired Student’s t-test (B–K). Data are presented as mean ± s.e.m.
(A) Immunoblot analysis of Pofut1 in P14 cells transduced with sgNTC or sgPofut1 at day 7.5 post-infection (p.i.). Non-specific bands are indicated by an asterisk (*); Pofut1 band is indicated by an arrow. (B) Flow cytometry (left) and quantification (right) of the frequency of IFN-γ+TNF-α+ cells in donor-derived P14 cells [transduced with sgNTC (GFP+ ‘spike’ cells) or sgPofut1 (Ametrine+)] after gp33 peptide stimulation. (C) Flow cytometry (left) and quantification (right) of the proportion of donor-derived CXCR3hiCD27hi cells. (D) Flow cytometry (left) and quantification of the proportions of donor-derived KLRG1−CD127+ (middle) and KLRG1+CD127− (right) cells. (E) The indicated OT-1 cells (from dual-color transfer system) were analyzed in the blood at day 7.5 after Lm-OVA infection. Quantification of the MP/TE ratio (left) and the proportion of CXCR3hiCD27hi cells (right). (F) The indicated OT-1 cells (from single-color transfer system) were analyzed in the spleen at day > 30 after Lm-OVA infection. Flow cytometry (left) and quantification (right) of the proportion of donor-derived OT-1 cells among total CD8+ T cells. (G and H) Flow cytometry of CD4+ and CD8+ cells (G) and quantification of the frequencies (H; left) and numbers (H; right) of conventional CD4+ T cells (Tconv), CD8+ T cells, and Treg cells in spleen of WT and Cd4CrePofut1fl/fl mice. (I and J) Cd4CrePofut1wt and Cd4CrePofut1fl/fl mice were infected with LCMV and analyzed in the spleen at day 7.5 p.i. (I) Flow cytometry of CD127 versus KLRG1 expression (left) and quantification of the MP/TE ratio (right) among gp33 tetramer-positive cells. (J) Flow cytometry (left) and quantification (right) of the proportion of CXCR3hiCD27hi cells in gp33 tetramer-positive cells . (K–M) Mixed BM chimeras (see Methods) were infected with LCMV and analyzed at day 7.5 p.i. (K) Quantification of the MP/TE ratio (left) and the proportion of CXCR3hiCD27hi cells (right) among gp33 tetramer-positive cells from the spleen. (L) Flow cytometry (left; from spleen) and quantification (right) of the proportion of CD45.2+ gp33 tetramer-positive cells among total cells in the indicated organs (right). pLN, peripheral lymph nodes. (M) Quantification of splenic donor-derived (CD45.2+) IFN-γ+ and TNF-α+ CD8+ T cells after gp33 peptide stimulation. (N) Flow cytometry of gp33 tetramer-positive cells among total CD8+ T cells (left) and quantification of the proportion (upper right) and number (lower right) in the indicated organs (right) of LCMV-infected mice at day > 50 p.i. (O) WT or Pofut1-deficient (CD45.1+CD45.2+) splenic TMEM cells (5×10³) from the mice described in (N) were sorted and transferred to naïve C57BL/6 hosts (CD45.2+) followed by LCMV re-challenge and analysis at day 6 after re-challenge. Flow cytometry of frequency of donor-derived gp33 tetramer-positive cells compared to endogenous (endo) gp33 tetramer-positive cells (left) and quantification of the number of donor-derived gp33 tetramer-positive cells in the indicated organs (right). Total, the sum of donor-derived gp33 cells in pLN, spleen, BM, liver and lung. Data are from one (K–M), representative of two (A), or compiled from at least two (B–J, N, and O) independent experiments, with 11 (B), 5 (C), 9 (D and O), 19 (E), ≥ 7 (F), ≥ 4 (G–M), or 3 (N) biological replicates per group. *P < 0.05, **P < 0.01, and ***P < 0.001; NS, not significant; two-tailed paired Student’s t-test (B–E) or two-tailed unpaired Student’s t-test (F–O). Data are presented as mean ± s.e.m.
(A and B) Enrichment plots of TE (A, left), MP (A, right), or “early-effector-like” signatures (B) in sgPofut1- compared to sgNTC-transduced cells in the transcriptome profiling described in Figure 4A. NES, normalized enrichment score; FDR, false discovery rate. (C) Flow cytometry (left) and quantification of the frequency (right) of Ki-67+ cells among conventional CD4+ T cells (Tconv), Treg cells and CD8+ T cells in the spleen of Cd4CrePofut1wt and Cd4CrePofut1fl/fl mice. (D) Naïve CD8+ T cells from Cd4CrePofut1wt and Cd4CrePofut1fl/fl mice were stimulated with different doses of anti-CD3 for 72 h, followed by [3H] thymidine incorporation analysis. (E–H) P14 cells transduced with sgNTC (GFP+ ‘spike’ cells) or sg Pofut1 (Ametrine+) were transferred at a 1:1 ratio to naïve mice that were subsequently infected with LCMV and analyzed at the indicated time points post-infection (p.i.). (E) Prior to transfer, P14 cells were labelled with CellTrace Violet (CTV). Flow cytometry of CTV dilution in P14 cells transduced with sgNTC or sgPofut1 at day 2.5 p.i. (F) Quantification of the mean fluorescence intensity (MFI) of CXCR3 in sgNTC- and sgPofut1-transduced P14 cells at day 2.5 p.i. (G) Longitudinal analysis of the relative fold change (normalized to ‘spike’ cells) of sgPofut1-transduced P14 cells during LCMV infection. (H) Flow cytometry (left) and quantification of relative frequency (right) of BrdU+ cells in sgNTC- and sgPofut1-transduced P14 cells at day 4.5–5 p.i. (I) Enrichment plots of cell cycle-related signatures in published TE versus MP cells (Joshi et al., 2007). (J) Flow cytometry (left) and quantification (right) of relative frequency of BrdU+ cells in TE compared to MP (normalized to 1) cells in the spleen at day 6.5–7.5 p.i. Data are from one (A, B, and I), representative of two (E), or compiled from at least two (C, D, F–H, and J) independent experiments, with ≥ 4 (A–C, G, and J), 3 (D), 6 (F), or 7 (H) biologica l replicates per group. *P < 0.05, **P < 0.01, and ***P < 0.001; NS, not significant; two-tailed paired Student’s t-test (F, H, and J) or two-tailed unpaired Student’s t-test (C, D, and G). Data are presented as mean ± s.e.m.
(A) Non-parametric Wilcoxon rank sum test was used to compare gene expression of cells in one cluster versus those in the other two clusters (clusters as defined in Figure 4D) followed by pre-ranked GSEA [based on log2 fold change (FC)] using the C7 immunological collections. Shown are the top 6 enriched gene sets related to CD8+ T cells from each cluster. (B) Heatmap showing the top 25 genes upregulated in each cluster. (C) Gating strategy (left) and quantification (right) of the proportions of TE′ (KLRG1hiCXCR3loCD127lo), MP (KLRG1loCXCR3hiCD127hi) and TINT cells (CXCR3hiCD127lo) among P14 cells transduced with sgNTC at day 7.5 post-infection (p.i.). (D) OT-1 cells transduced with sgNTC were transferred to naïve mice that were subsequently infected with Lm-OVA and analyzed at day 7.5 p.i. Quantification of the proportions of TEFF subsets described in (C). (E) Functional enrichment of population-specific genes (defined by upregulated genes in TE′, MP or TINT cells versus the other two populations; see also Figure 4G) using C7 immunological collection. Shown are the top 5 enriched gene sets related to CD8+ T cells from each cluster. (F) Enrichment plots of cell cycle-related signatures among TE′, MP and TINT cells as described in Figure 4G. (G) RNA velocity analysis (La Manno et al., 2018) showing the putative lineage relationship among TE′, MP and TINT cells. Data are from one (A, B, E–G, and J), or compiled from at le ast two (C and D) independent experiments, with 15 (C), 24 (D), or 4 (F) biological replicates per group. ***P < 0.001; two-tailed unpaired Student’s t-test (C and D). Data are presented as mean ± s.e.m.
(A) Heatmap showing the expression of TE′, MP or TINT population-specific genes and their expression in sgNTC- and sgPofut1-transduced P14 cells from the spleen at day 7.5 post-infection (p.i.). (B) Enrichment plots of TE′, MP and TINT signature genes (genes specifically expressed in the three TEFF subsets, Table S6) in the transcriptome profiling described in Figure 4A. (C) UMAP plot (see also Figure 4L) of the activity of TE′ signature (defined in Table S6; left panel;) in sgNTC- (black; middle panel) and sgPofut1- (red; right panel) transduced P14 cells. (D and E) PCA plot of ATAC-seq data of sgNTC- and sgPofut1-transduced P14 cells, with the percentage of variance indicated. (E) Footprinting analysis of selective transcription factors from the Sp family and KLF family in ATAC-seq data from (D). Data are from one experiment (A–E), with 4 biological replicates per group (A–E). Data are presented as mean ± s.e.m.
(A) Immunoblot analysis of Pofut1. Non-specific bands are indicated by asterisks (*); Pofut1 band is indicated by an arrow. (B-E) P14 cells transduced with sgNTC or the indicated sgRNAs were transferred at a 1:1 ratio to naïve mice that were subsequently infected with LCMV (dual-color transfer system). At day 7.5 post-infection (p.i.), donor-derived P14 cells were sorted from the spleen. (B) Quantification of genome editing efficiency. (C) Flow cytometry analysis of CD127 versus KLRG1 expression (left) and quantification of the MP/TE ratio (right) in P14 cells transduced with the indicated constructs. dKO, co-transduction of sgGmds and sgFcsk. (D) Flow cytometry (left) and quantification (right) of mean fluorescence intensity (MFI) of Mitotracker, TMRM and CellROX in P14 cells transduced with sgNTC or the indicated sgRNAs. dKO, co-transduction of sgGmds and sgFcsk. (E) Quantification of the relative intracellular GDP-fucose level by liquid chromatography with tandem mass spectrometry (LC-MS/MS). (F) Enrichment plot of Hallmark Notch signaling among the transcriptome of TE′, MP and TINT cells in profiling described in Figure 4G. (G) P14 cells transduced with the indicated sgRNAs were sorted from the dual-color transfer system at day 7.5 p.i. for real-time PCR analysis of Dtx1 expression. (H) PCA plot of the transcriptome of Cd4CrePoful1wt and Cd4CrePoful1fl/fl P14 cells with or without NICD overexpression. The percentage of variance is indicated. Data are from one (B, F, and H), representative of two (A), or compiled from at least two (C–E and G) independent experiments, with 3 (B), 6 (C), or ≥ 4 (D–H) biological replicates per group. * P < 0.05, **P < 0.01, and ***P < 0.001; NS, not significant; two-tailed unpaired Student’s t-test (B, C, E, and G) or two-tailed paired Student’s t-test (D). Data are presented as mean ± s.e.m.
Table S1. Initial in vivo CRISPR screening results; Related to Figure 1. Three comparisons (MP versus TE, MP versus input and TE versus input) are shown.
Table S2 Putative negative regulators for MP cells [log2 FC (MP/TE) > 0.58; log2 FC (MP/input) > 0.58; adjusted P (MP/TE) < 0.05)]; Related to Figures 1–7.
Table S3. GSEA results of the differential enrichment of C7 gene sets (immunological collections) in transcriptomes of sgPofut1- versus sgNTC-transduced P14 cells (FDR < 0.05); Related to Figure 4. Two subtables (Tables S3–2 and S3–2) are grouped based on downregulated or upregulated gene sets.
Table S4. Preranked GSEA results of the enriched gene sets (FDR < 0.05; NES > 0) from C7 immunological collections in clusters 1, 2, or 3 identified by scRNA-seq analysis; Related to Figure S4. Three subtables (Tables S4–1–S4–3) list enrichment results in different clusters (1–3). The top 6 CD8+ T cell-related gene sets in each cluster are highlighted in yellow.
Table S5. List of subset-specific genes identified by the transcriptomic analysis of sorted TE’, MP and TINT cells; Related to Figure 4. The genes selectively upregulated in one subset compared to the other two subsets were considered as subset-specific genes.
Table S6. List of Pofut1-dependent gene signature. Related to Figure 4. Pofut1-dependent gene signature is defined by significantly downregulated genes (FDR < 0.05; log2 FC < –0.5) from transcriptome profiles of sgPofut1- versus sgNTC-transduced P14 cells as described in Figure 4A.
Table S7. sgRNA target sequence used in this study; Related to STAR Methods.
Table S8. Information of the mouse sgRNA metabolic library used in this study; Related to STAR Methods. All the sgRNAs in the mouse sgRNA metabolic sub-libraries are listed in two columns, AAAQ05 and AAAR07. Each sub-library consists of 9,051 sgRNAs targeting 3,017 cell metabolism-related genes (3 sgRNAs per gene per sub-library) encoding metabolic enzymes, small molecule transporters, and metabolism-related transcriptional regulators, as well as 500 non-targeting control sgRNAs.
Data Availability Statement
The accession number for the microarray, ATAC-seq and scRNA-seq data reported in this paper is GEO SuperSeries: GSE148681.