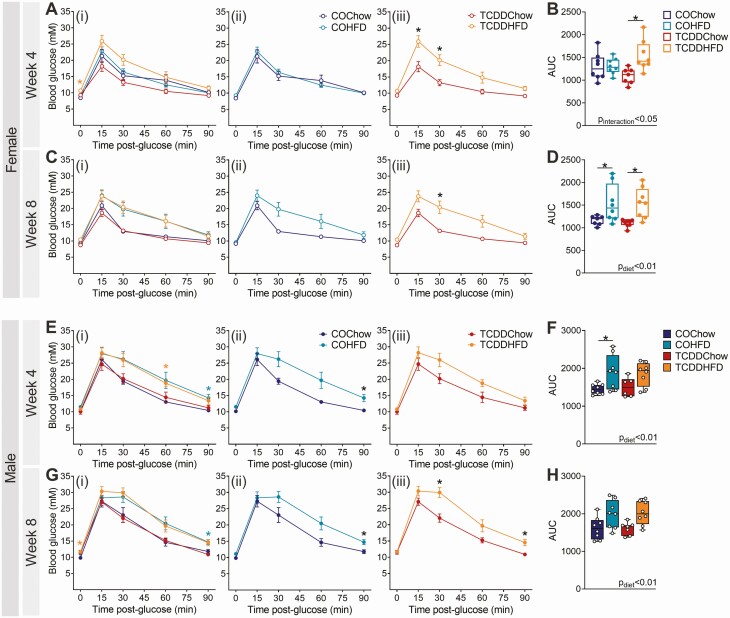
Figure 2.
TCDD exposure accelerates the onset of HFD-induced glucose intolerance in female mice. Glucose tolerance tests were performed after 4 and 8 weeks of TCDD exposure with/without HFD feeding (see Fig. 1A for study timeline). Blood glucose levels in (A-D) females and (E-H) males at (A, B, E, F) week 4 and (C, D, G, H) week 8 (n = 6-8 per group). (A, C, E, G) Blood glucose data are presented as (i) all groups compared to COChow, (ii) COHFD compared to COChow, and (iii) TCDDHFD compared to TCDDChow. Data are presented as mean ± SEM in line graphs or median with min/max values in box and whisker plots. Individual data points on box and whisker plots represent biological replicates (different mice). *P < 0.05, colored stars are versus COChow. The following statistical tests were used: (A, C, E, G) two-way RM ANOVA with Tukey’s multiple comparison test; (B, D, F, H) two-way ANOVA with Tukey’s multiple comparison test.

