

Abstract
Hypertension is a major cause of cardiovascular disease in African Americans. The excess morbidity and mortality due to cardiovascular disease in African Americans compared to Caucasians is not well explained. The purpose of this study was to examine the association between hypertension and other cardiovascular risk factors in young adult African Americans. A risk factor scoring system was developed, based on national guidelines for obesity, smoking, cholesterol levels, glucose tolerance, and blood pressure. Data from a previously studied cohort of 206 women and 117 men were analyzed for the association of hypertension with other risk factors. Among women, risk factor intensification is due to impaired glucose tolerance and obesity. Among men, intensification appears to be related to all major risk factor categories. These findings indicate that among hypertensive African Americans there is an amplification of other risk factors. The data also support the clinical management of multiple risk factors as well as the achievement of blood pressure control.
Hypertension is a major health problem that occurs at high rates in African Americans. 1 Approximately 33% of adult African Americans and 25% of adult Caucasians have hypertension in the United States. 2 , 3 Furthermore, African Americans have higher rates of morbidity and mortality, earlier onset, and possibly more cardiovascular risk factors associated with hypertension than other American ethnic groups. 2 , 4 However, there is limited information on the extent of multiple cardiovascular risk factor clustering with hypertension at an early age in African Americans. The purpose of this investigation was to examine the association of hypertension with other cardiovascular risk factors in African American men and women in early adulthood.
METHODS
Study Sample
Data were examined from a cohort of African American men and women. Subjects in this cohort have been under study in investigations of blood pressure (BP) and cardiovascular risk factors since adolescence. 5 The generally healthy cohort was initially recruited to over‐sample cases with high‐normal BP. No known diabetics were included on initial enrollment. Data from the most recent examination of 206 women and 117 men were included in this study. Age at the most recent examination ranged from 20–46 years (mean, 34) in women and 22–44 years in men (mean, 33). Written informed consent was obtained from each participant at the time of enrollment evaluation on an institutionally approved protocol and consent form.
Procedures
Information about health status and current health behaviors was obtained by interview. Smoking status was assessed according to present behavior and pack‐years smoked. Anthropometric measurements included height and weight. Body mass index (BMI) was calculated as weight (kg) divided by height squared (m2). BP was measured following a 10‐minute rest period in a seated position by means of auscultation with a mercury column sphygmomanometer. The averages of two determinations of systolic and diastolic pressures were used as the BP. An oral glucose tolerance test was conducted following a 12‐hour overnight fast. A fasting blood sample for serum lipids and glucose was obtained, and then 75 g of a glucose solution (Glucola, Ames Laboratories, Ames, IA) was ingested. Blood samples were obtained at 30, 60, 90, and 120 minutes post‐ingestion and were assayed for glucose and insulin concentrations. The fasting serum sample was sent to the Lipid Research Laboratory, where total cholesterol, high‐density lipoprotein cholesterol (HDL‐C), and total triglycerides were analyzed with standard enzymatic methods and an automated analyzer (Hitachi® 704, Roche, Basel, Switzerland). HDL‐C was isolated according to the method of Bachorik et al. 6 Low‐density lipoprotein cholesterol (LDL‐C) was calculated by the Friedewald equation. 7 Plasma glucose concentration was analyzed with the glucose oxidase technique (Glucostat, model 27, Yellow Springs Instruments, Yellow Springs, OH). The plasma insulin concentration was determined with a solid‐phase radioimmunoassay (Coat‐A‐Count®, Diagnostic Products Corp., Los Angeles, CA). The coefficient of variations for inter‐ and intra‐assay variability for glucose, insulin, and the lipid assays were <5%.
Cardiovascular Risk Assessment
A scoring system was developed to quantitate risk status in the categories of obesity, smoking, lipids, glucose tolerance, and BP. For each category a number score was assigned for level of risk (Table I). The risk factor scoring system was derived from published guidelines. 8 , 9 , 10 , 11 For example, normal BP (systolic ≤130 mm Hg and diastolic ≤85 mm Hg) equaled a score of 0. High‐normal BP (systolic 131–139 mm Hg or diastolic 86–89 mm Hg) equaled a score of 1. A score of 2 was given if the subject had hypertension (systolic ≥140 mm Hg or diastolic ≥90 mm Hg) or was taking antihypertensive medication. The sum of scores from all categories was the total risk score for each case. With this method, the range for total risk score was −1 to 10.
Table I.
Risk Factor Score Assignment
| BMI (kg/m2) | <30 | ≥30 | |
| 0 | 1 | ||
| Smoking | No | Yes | |
| 0 | 2 | ||
| Cholesterol | |||
| HDL (mg/dL) | ≥60 | 40–59 | <40 |
| −1 | 0 | 1 | |
| LDL (mg/dL) | <130 | 130–189 | ≥190 |
| 0 | 1 | 2 | |
| Glucose tolerance | |||
| Time 0 min (mg/dL) | <110 | 110–125 | >125 |
| and | or | or | |
| Time 120 min (mg/dL) | <140 | 140–199 | ≥200 |
| 0 | 1 | 2 | |
| Blood pressure | |||
| SBP (mm Hg) | ≤130 | 131–139 | ≥140 |
| and | or | or | |
| DBP (mm Hg) | ≤85 | 86–89 | ≥90 |
| 0 | 1 | 2 | |
| BMI=body mass index; HDL=high‐density lipoprotein; LDL=low‐density lipoprotein; SBP=systolic blood pressure; DBP=diastolic blood pressure | |||
Analysis
Data were summarized for the total cohort and stratified by gender. A histogram on the distribution of the total risk score was computed. The total risk factor score was adjusted for a BP score for analysis that compared normotensives with hypertensives. The BP adjusted score was the total risk factor score without the BP score for each case. Comparisons between normotensives and hypertensives were made on continuous variables by analysis of variance (ANOVA). For categorical variables, the chi‐square test (X 2) was used. P values of <0.05 were considered statistically significant.
RESULTS
In this cohort, 71 (34%) of the women and 29 (25%) of the men had hypertension. Of the hypertensives, 52% of the women and only 21% of the men were on medication. However, 23% of hypertensive women and only 10% of hypertensive men had their BP controlled to <140/90 mm Hg. Overall, 57% of women and 39% of men had a BMI of >30 kg/m2. In addition, 28% of the cohort had impaired glucose tolerance, and 8% were found to be diabetic by oral glucose tolerance testing. Forty‐nine percent of the women were smokers, and 37% of the men. The range of cardiovascular risk factor scores detected in the cohort was −1 to 9. For women, the range of total risk factor score was −1 to 9, and for men the range was −1 to 7. Risk factor scores were normally distributed, with a mean score of 3.0±2.1 for women and 2.7±1.8 for men (Figure 1). Only about 10% of the cohort was without any cardiovascular risk (scores of 0 and −1). Mean values for age and each risk variable are presented in Table II and Table III. The women in this cohort were more obese than the men, with an average BMI of 32±8 kg/m2. The men had an average BMI of 28 ±6 kg/m2. The mean Bps for the women and men were 125/79 mm Hg and 128/79 mm Hg, respectively.
Figure 1.
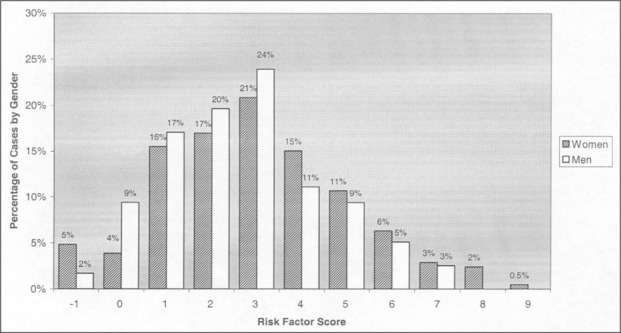
The percentage of cases for each total risk factor score in men and women. The distribution is normal over the range of risk factor scores. The mean total risk factor score for all men was 2.7±1.8, and for women, 3.0±2.1.
Table II.
Mean Variables by Blood Pressure Status in Women (means±SD)
| All | NTN | HTN | p< | |
|---|---|---|---|---|
| n | 206 | 135 | 71 | |
| Age (years) | 34±5 | 34±5 | 36±4 | 0.001 |
| BMI (kg/m2) | 32±8 | 31±8 | 35±8 | 0.001 |
| SBP (mm Hg) | 125±19 | 116±11 | 144±16 | ‐ |
| DBP (mm Hg) | 79±14 | 72±10 | 93±11 | ‐ |
| HDL‐C (mg/dL) | 51±15 | 51±17 | 50±11 | 0.44 |
| LDL‐C (mg/dL) | 105±35 | 102±34 | 111±36 | 0.07 |
| TG (mg/dL) | 102±54 | 98±55 | 137±69 | 0.02 |
| Glu,t=0 (mg/dL) | 101±25 | 99±28 | 104±20 | 0.13 |
| Glu,t=120 (mg/dL) | 135±35 | 130±52 | 145±56 | 0.046 |
| Smokers* | 49% | 47% | 52% | 0.52 |
| Average risk score | 2.2±1.6 | 1.9±2.3 | 2.8±3 | 0.001 |
| NTN=normotensives; HTN=hypertensives; BMI=body mass index; SBP=systolic blood pressure; DBP=diastolic blood pressure; HDL‐C=high‐density lipoprotein cholesterol; LDL‐C=low‐density lipoprotein cholesterol; TG=triglycerides; Glu,t=glucose, time; *chi‐square analysis | ||||
Table III.
Mean Variables by Blood Pressure Status in Men (Means±SD)
| All | NTN | HTN | p< | |
|---|---|---|---|---|
| n | 117 | 88 | 29 | |
| Age (years) | 33±4 | 33±4 | 34±5 | 0.29 |
| BMI (kg/m2) | 28±6 | 27±5 | 31±8 | 0.005 |
| SBP (mm Hg) | 128±15 | 122±11 | 144±15 | ~ |
| DBP (mm Hg) | 79±14 | 74±9 | 96±13 | ~ |
| HDL‐C (mg/dL) | 49±15 | 49±14 | 47±18 | 0.56 |
| LDL‐C (mg/dL) | 114±36 | 113±37 | 115±32 | 0.86 |
| TG (mg/dL) | 102±62 | 92±46 | 131±88 | 0.002 |
| Glu,t=0 (mg/dL) | 102±19 | 100±11 | 107±32 | 0.10 |
| Glu,t=120 (mg/dL) | 119±38 | 116±31 | 126±53 | 0.21 |
| Smokers* | 37% | 35% | 45% | 0.35 |
| Average risk score | 1.9±1.4 | 1.7±1.9 | 2.5±2.1 | 0.01 |
| NTN=normotensives; HTN=hypertensives; BMI=body mass index; SBP=systolic blood pressure; DBP=diastolic blood pressure; HDL=high‐density lipoprotein cholesterol; LDL=low‐density lipoprotein cholesterol; TG=triglycerides; Glu,t=glucose, time; *chi‐square analysis | ||||
Among women, the hypertensives were 2 years older than the normotensives, and this age difference was significant. Statistically significant differences between hypertensives and normotensives were observed for BMI, triglycerides, blood glucose concentration at 2 hours, and mean adjusted risk score (p<0.001). There were no significant differences between hypertensives and normotensives for HDL‐C, LDL‐C, and baseline glucose concentrations.
Among men, there was no significant difference in age between the hypertensives and the normotensives. Statistically significant differences were observed for BMI, triglycerides, and average risk score (Table III). The average adjusted risk scores for hypertensives and normotensives were 2.5±2.1 and 1.7±1.9 (p<0.01), respectively. There were no significant differences for HDL‐C levels, LDL‐C levels, or blood glucose concentrations at baseline and at 2 hours.
The distribution of risk factors adjusted for the BP score was then examined. Among women (Figure 2), the adjusted risk factor score was highest among the hypertensives and lowest among the normotensives. The same pattern was apparent in men (Figure 3).
Figure 2.
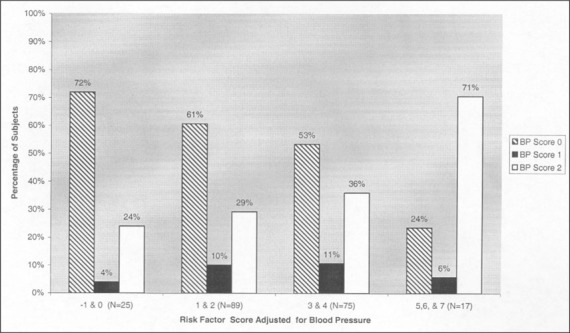
Female subjects are presented according to blood pressure (BP) status and BP‐adjusted cardiovascular risk score. Normotensive cases are depicted by the slashed bar; high‐normal cases are represented by the black bar; hypertensive cases are represented by the white bar. The portion of hypertensive cases is greatest at the higher adjusted risk score. The reverse occurs among normotensives, with more cases at the lower risk scores.
Figure 3.
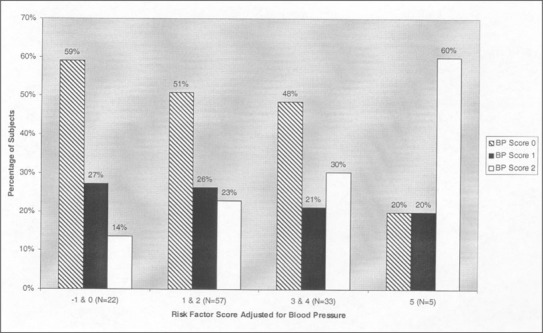
Male subjects are presented according to blood pressure (BP) status and BP‐adjusted cardiovascular risk score. Normotensive cases are depicted by the slashed bar; high‐normal cases are represented by the black bar; hypertensive cases are represented by the white bar. The portion of hypertensive cases is greatest at the higher adjusted risk score. The reverse occurs among normotensives, with more cases at the lower risk scores.
To determine if specific risk factors (HDL‐C, LDL‐C, BMI, glucose tolerance, and smoking status) were categorically associated with BP status, chi‐square analysis was used to compare BP status with individual risk factors. A statistically significant association was observed for glucose tolerance (p<0.0073) and BMI (p<0.0001) in women. In men, no specific risk factor association was detected.
DISCUSSION
Assessment of cardiovascular risk factors in this cohort of relatively young adult African Americans indicates that 90% of subjects had one or more risk factors. The data also show that among those with hypertension, there was augmentation of other risk factors for cardiovascular disease, adding to the risk of cardiovascular disease. Among hypertensive women, the higher risk factor score was linked with impaired glucose tolerance and obesity. Hypertensive men also had significantly higher risk factor scores than normotensive men. In men, the high risk factor scores appeared to be related to all risk categories. The combination of a suboptimal rate of BP control and the demonstration of related risk factors for cardiovascular disease indicate that this group would benefit from more direct clinical attention.
The rates of hypertension in this cohort were similar to those reported for the United States as a whole. 8 In our cohort, 34% of women and 25% of the men had stage 1 hypertension. Data from the National Health and Nutrition Examination Survey (NHANES) III showed that 33.2% of African American women in the 40–49‐year age group had hypertension, and 22.5% of African American men in the 30–39‐year age group had hypertension. 3 The increased BMI and obesity that were detected among women in our cohort were also similar to the general description of African American women in the United States. 12 Previous reports have shown that diabetes increases the expression of cardiovascular disease in women. 13 , 14 An association between higher BP and impaired glucose tolerance was detected in our cohort. 5 Therefore, our finding that the high risk score in hypertensive women is related to abnormal glucose tolerance is consistent with these reports. 12 , 13
Previous studies have disclosed that medically treated African Americans achieved similar BP control rates and a reduction of coronary heart disease mortality rates comparable to those in Caucasians. 15 , 16 In our cohort, the rate of BP control among treated hypertensives was lower than those of other reports. 13 For example, NHANES III demonstrated that 46% of hypertensive African American men were treated, and that 47% of these men had their BP controlled to <140/90 mm Hg. 13 In our cohort, only 21% of the hypertensive African American men were treated, and 48% of the treated men had their BP controlled. In other words, only about 10% of the young adult hypertensive men had their BP controlled. A similar pattern was observed in the African American women in our cohort. Only 23% of women with hypertension had treated BP levels of <140/90 mm Hg. Our findings indicate that more emphasis should be placed on treatments that achieve BP control in young adult African Americans.
The Coronary Artery Risk Development in Young Adults (CARDIA) study 17 included a sample of young adult African Americans. However, the CARDIA cohort was healthier than our cohort. For instance, the African Americans in the CARDIA study had an average BP of 112/69 mm Hg, as compared to an average BP of 126/79 mm Hg in our cohort. Only 22% of the African Americans in the CARDIA cohort had high‐normal BP or hypertension at enrollment. In our cohort, 46% of women and men had high‐normal BP or hypertension. 18 Among the African Americans in the CARDIA cohort, 33.6% were smokers. 19 In our cohort, 45% were smokers. Also, in the CARDIA cohort the African American women and men were leaner than in our cohort, at an average BMI of 26 and 24 kg/m2, respectively. 19 Furthermore, in a longitudinal study of elevated BP in the CARDIA cohort, Dyer et al. 18 identified obesity, triglycerides, and smoking among the risk factors associated with a 10‐year incidence of increased BP in both ethnic groups. These findings compare favorably to the increase in risk in our cohort, to which obesity was a significant contributor. However, in our study, smoking was not directly related to BP status. There was also a significant difference in triglyceride levels between normotensives and hypertensives in both genders.
There are some limitations in our study. For instance, the sample was unbalanced between men and women. Had our sample of men been equivalent to that of women, we may have been able to identify specific risk categories linked with hypertension in men, as we did in women. Our study was also limited to a cross‐sectional analysis. Longitudinal data to examine the relationship between each cardiovascular risk factor and morbidity and cardiovascular events could provide more information on the relationship of risk factors to outcome in this ethnic group.
In summary, this study demonstrated the association of multiple cardiovascular risk factors with hypertension in African Americans. Our observations also indicate that clinical management of hypertension should be aimed at achieving higher rates of BP control in young adult African Americans. Moreover, clinical attention should be applied to assessment and management of related risk factors in African Americans.
Acknowledgments: This work was supported in part by the following grants from the National Institutes of Health: DK4601, HL51547, T35‐HL07845, and by a Dean's Fellowship from Jefferson Medical College.
References
- 1. Wali RK, Weir MR. Hypertensive cardiovascular disease in African Americans. Curr Hypertens Rep. 1999;1:521–528. [DOI] [PubMed] [Google Scholar]
- 2. Lackland DT, Keil JE. Epidemiology of hypertension in African Americans. Semin Nephrol. 1996;16:63–70. [PubMed] [Google Scholar]
- 3. Burt VL, Cutler JA, Higgins M, et al. Trends in the prevalence, awareness, treatment, and control of hypertension in the US population. Hypertension. 1995;26:60–69. [DOI] [PubMed] [Google Scholar]
- 4. Potts JL, Thomas J. Traditional coronary risk factors in African Americans. Am J Med Sci. 1999;317:189–192. [DOI] [PubMed] [Google Scholar]
- 5. Falkner B, Sherif K, Sumner AE, et al. Blood pressure increase with impaired glucose tolerance in young adult American blacks. Hypertension. 1999;34:1086–1090. [DOI] [PubMed] [Google Scholar]
- 6. Bachorik PS, Walker RE, Virgil DG. High‐density‐lipoprotein cholesterol in heparin‐MnCl2 supernates determined with the Dow enzymic method after precipitation of Mn2+ with HCO3‐. Clin Chem. 1984;30:839–842. [PubMed] [Google Scholar]
- 7. Friedewald WT, Levy RI, Frederickson DS. Estimation of the concentration of low‐density lipoprotein cholesterol in plasma, without use of the preparative ultracentrifuge. Clin Chem. 1972;18:499–502. [PubMed] [Google Scholar]
- 8. Joint National Committee . The Sixth Report of the Joint National Committee on Prevention, Detection, Evaluation, and Treatment of High Blood Pressure. Arch Intern Med. 1997;157(24):2413–2446. [DOI] [PubMed] [Google Scholar]
- 9. Report of the Expert Committee on the diagnosis and classification of diabetes mellitus. Diabetes Care. 2001;21(suppl 1):S21–S24. [PubMed] [Google Scholar]
- 10. Executive summary of the clinical guidelines on the identification, evaluation, and treatment of overweight and obesity in adults. Arch Intern Med. 1998;158:1855–1867. [DOI] [PubMed] [Google Scholar]
- 11. NCEP Expert Panel . Executive Summary of The Third Report of The National Cholesterol Education Program (NCEP) Expert Panel on Detection, Evaluation, and Treatment of High Blood Cholesterol In Adults (Adult Treatment Panel III). JAMA. 2001;285:2486–2497. [DOI] [PubMed] [Google Scholar]
- 12. Folsom AR, Burke GL, Byers CL, et al. Implications of obesity for cardiovascular disease in blacks: the CARDIA and ARIC Studies. Am J Clin Nutr. 1991;53:1604S–1611S [DOI] [PubMed] [Google Scholar]
- 13. Jneid H, Thacker H. Coronary artery disease in women: different, often undertreated. Cleve Clin J Med. 2002;68:441–447. [DOI] [PubMed] [Google Scholar]
- 14. Steinberg HO, Paradasi G, Cronin J, et al. Type II diabetes abrogates sex differences in endothelial differences in pre‐menopausal women. Circulation. 2000;101:2040–2046. [DOI] [PubMed] [Google Scholar]
- 15. Ooi WL, Budner NS, Cohen H, et al. Impact of race on treatment response and cardiovascular disease among hypertensives. Hypertension. 1989;14:227–234. [DOI] [PubMed] [Google Scholar]
- 16. Hypertension Detection and Follow‐up Program Cooperative Group . Five‐year findings of the Hypertension Detection and Follow‐up Program. J Comm Health. 1984;9:314–327. [PubMed] [Google Scholar]
- 17. Friedman GD, Cutter GR, Donahue RP, et al. CARDIA: Study design, recruitment, and some characteristics of the examined subjects. J Clin Epidemiol. 1988;41:1105–1116. [DOI] [PubMed] [Google Scholar]
- 18. Dyer AR, Liu K, Walsh M, et al. Ten‐year incidence of elevated blood pressure and its predictors: the CARDIA study. Coronary Artery Risk Development in (Young) Adults. J Hum Hypertens. 1999;13:13–21. [DOI] [PubMed] [Google Scholar]
- 19. Liu K, Ballew C, Jacobs DR Jr, et al. Ethnic differences in blood pressure, pulse rate, and related characteristics in young adults: the CARDIA Study. Hypertension. 1989;14:218–226. [DOI] [PubMed] [Google Scholar]