

Abstract
Self‐monitoring of blood pressure actively involves patients in hypertension management. However, the usefulness of self‐monitoring of blood pressure may be limited by inaccurate patient reporting. The study objective was to assess reliability of patient blood pressure reporting over 6 months. Forty‐nine subjects with Joint National Committee stage 1 or 2 hypertension were enrolled. Unaware that the monitors electronically store readings, the subjects were asked to check and record outpatient blood pressures twice weekly. Stored and written readings were compared. On average, patient‐recorded blood pressures were equivalent to stored monitor values 80% or more of the time. Reliability of patient self‐reporting was sustained over the 6‐month study period. Notably, patients did not selectively report lower blood pressure readings. The overall mean self‐reported and stored monitor blood pressures were nearly identical: blood pressure (±SD) 134±16.8/78±11.6 mm Hg and 135±19.6/80±13.3 mm Hg, respectively. The reliability of self‐reporting of blood pressures for many patients supports the potential usefulness of self‐monitoring of blood pressure in hypertension management.
An estimated 50 million Americans with hypertension are at increased risk for acute myocardial infarction, stroke, congestive heart failure, and end‐stage renal disease. 1 Despite this, 75% of hypertensive individuals have poorly controlled blood pressure. 2 One major reason is that hypertension is largely asymptomatic. 1 Additionally, growing evidence suggests that office‐based blood pressures are measured too sporadically to adequately represent a patient's typical blood pressure. 3 , 4 Outpatient blood pressures, compared to office readings, may better predict left ventricular hypertrophy and cardiovascular mortality risk. 5 , 6 , 7 , 8
Oscillometric home sphygmomanometers for self‐monitoring of blood pressure have recently become available to the general public. Like home blood glucose measurement in managing diabetes, and expiratory peak flow assessment in managing asthma, patient self‐monitoring of blood pressures may result in improved identification and control of hypertension. 9 –15
While home sphygmomanometers have been greeted with some initial enthusiasm by both patients and physicians,10,16 there is concern that patients might under‐report uncontrolled blood pressures to their provider. This possibility was previously investigated utilizing electronic home monitors, sphygmomanometers containing a computer memory chip.17,18 Mengden and Johnson, with their collaborators, concluded that up to one half of patients erroneously reported pressure values when compared to electronically stored readings. These studies also found that patients may report readings not contained in the monitor, or selectively omit monitor readings. These two studies, 1–2 weeks in duration, did not address the long‐term accuracy of patient self‐reporting of blood pressures.
We designed this study to assess the long‐term accuracy of patient self‐reported blood pressures compared to electronically stored readings in primary care patients with hypertension. Based on previous studies of home monitor use, we anticipated high levels of inaccuracy. We expected that patients in primary care might seek to “please” their physicians by selectively reporting well controlled blood pressures, perhaps even creating fictitious readings. Our first research hypothesis was that patient‐reported blood pressures would not consistently match electronically stored pressures. Our second research hypothesis was that electronically stored pressures unreported by patients would be higher, on average, than reported pressures.
METHODS
This prospective, single‐blind cohort design study was conducted in an urban, university‐based family practice. The study protocol was approved by the University's Institutional Review Board. In this practice, 40,000 outpatients receive care from 30 attending physicians, 33 physicians‐in‐training (residents and fellows), and five nurse practitioners. The data analyzed were collected as part of a larger prospective, randomized, controlled trial of the effect of self‐monitoring of blood pressure on hypertension management.
Patient Selection/Eligibility Criteria
Patients, ages 20–75, receiving medication for Joint National Committee (JNC) VI stage 1 or 2 (mild or moderate) essential hypertension were eligible. To minimize risks of uncontrolled hypertension to the patient, patients with JNC VI stage 3 hypertension were excluded.
We used a clinical and financial database to generate a list of patients with a billing diagnosis of hypertension (ICD‐9 code, 401.1 or 401.9) from any office visit in 1999. Because certain medical conditions could either complicate hypertension or the ability to record blood pressures regularly, we excluded patients with a psychiatric diagnosis of dementia, schizophrenia, or major depression, and those with ongoing drug‐ or alcohol‐related diagnoses, chronic obstructive pulmonary disease, cirrhosis, Alzheimer's disease, metastatic cancer, or HIV/AIDS.
We asked the physicians of potential subjects to further exclude patients already using self‐monitoring, patients with secondary causes of hypertension, and morbidly obese patients, as extra‐large arm cuffs were not available.
Study Protocol
After obtaining informed consent and collecting demographic information (age, sex, race, educational level, occupation, concomitant diseases, and medications), the study coordinator instructed patients in the proper use of a home blood pressure monitor (Omron model HEM‐725 CIC [Intensive Control]; Omron Healthcare, Inc., Vernon Hills, IL). Both standard and large cuffs were available and customized to the size of each patient's arm circumference. This monitor uses the same technology as the previously validated Omron model HEM‐507 CP monitor. 19 A special feature of this monitor is the inclusion of a memory chip that stores up to 350 readings; stored data can be directly downloaded into a computer. Patients were not informed of this feature, although the study protocol allowed for disclosing this information if they asked. The Omron monitors were initially calibrated with in‐office blood pressure devices.
Patients were asked to measure their pressures twice a week, taking two consecutive readings each time. They were instructed to record these blood pressure readings at the time of measurement, together with the corresponding time of measurement, in a calendar‐format diary with tear‐out pages specifically designed for the study. The calendar contained enough space for patients to enter up to four blood pressures on any given day. Patients were instructed to tear off completed pages and mail them to the study coordinator in the business reply envelopes supplied.
We asked patients to take a minimum of four blood pressure measurements per week, but did not instruct patients to limit their use of the monitor. Also, we did not specifically instruct patients to record their pressures simultaneously with monitor use. Our intention was both to simplify the study protocol and allow us to assess the frequency of actual monitor use by patients.
Measure of Accuracy
During the course of the study, we observed that many patients recorded blood pressures in the written diaries identical to pressures recorded by the monitor, but with dates that conflicted with the monitor date of measurement. For example, some patients may have misaligned the dates by recording in the diary using a date that was 1 week later or earlier than the actual date, even though the blood pressures agreed exactly.
This led us to our primary measure of agreement, in which self‐reported and monitor‐stored pressures were defined as “matching.” We defined a match as a pair of self‐reported and monitor‐stored blood pressures with ≤2‐mm Hg difference in systolic and diastolic pressures, recorded by patients in their diaries within 1 week of the monitor date. While previous short‐term studies have required matched self‐reported and monitor‐stored readings to have identical days and times, we attempted to create a definition that would more closely approximate how diary readings would be recorded by patients in actual practice, especially given the long duration of this study.
The percent agreement for each patient was calculated by dividing the number of self‐reported blood pressures that matched monitor‐stored pressures by the total number of self‐reported blood pressures. A distribution of these percentages was formed, and the median calculated. This reliability assessment was performed only for months in which the patient returned written diary readings.
To determine whether there was a difference in reported and unreported blood pressure recordings, we also calculated the mean of the unmatched and matched monitor readings (stored in the monitor, with no matching diary reading) for each patient. In addition to measuring agreement, we also collected data on patient demographics (age, ethnicity, educational level, duration of hypertension), and on utilization of both the monitor and diary sheets.
RESULTS
We enrolled 52 patients, 49 of whom completed the study. One patient dropped out due to “personal life stress;” another discontinued participation for “insurance reasons.” Another patient shared her monitor with her husband; therefore, we did not include her blood pressure readings in our data analysis. Data from the remaining 49 subjects are included in all subsequent analyses. Three quarters of the patients were female, and approximately two thirds were African American. The mean patient age was 56, and the mean educational level was 1 year beyond high school (Table I). No subjects were aware of the presence of the memory chip contained within the monitor.
Table I.
Subject Demographics
| Total number of subjects | 49; 75% female, 25% male |
| Age | Mean, 56; range, 25–75 years |
| Ethnic composition | African American, 73%, Caucasian, 25%; other, 2% |
| Educational level | Mean, 13 years (1 year beyond high school); range, 8–18 |
| Duration of hypertension | Mean, 10 years; range, 1–30 years |
Patients both used the monitor and recorded diary readings for a mean of 5.1 months. During this time interval, the mean number of diary readings reported was 76.5; the mean number of monitor readings stored was 100.5. Over the 6‐month study period, the number of patients completing at least the minimum number of requested readings dropped from 85% to 45% (Figure 1). Figure 2 illustrates the total number of diary and monitor readings completed by patients. All patients used the monitor more often than the minimum number of times requested; nearly all (96%) had unmatched diary readings (diary recordings that did not match with electronically monitored readings).
Figure 1.
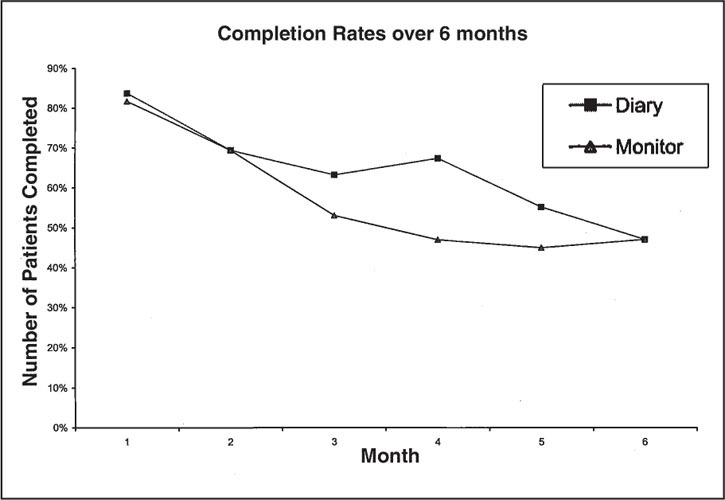
Attenuation in patient compliance with blood pressure study protocol over 6 months. Patient compliance was defined as completing the minimum number of requested readings (four per week) using both the written diary and the electronic monitor.
Figure 2.
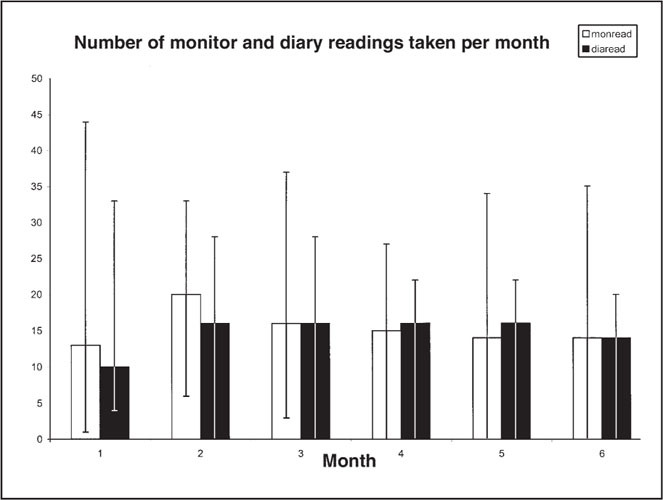
Monthly median monitor‐recorded and self‐reported (diary) blood pressure readings. In this plot, the short, wide bars represent the median number of readings per month. The long, thin, extending lines represent the 10th to 90th percentile range of these median values for the 49 patients in our study.
The median percent agreement for the 49 subjects was 80%, with a range of 18%–100%. One third of subjects had 90% or higher percent agreement (Table II). The consistency of agreement between patient‐reported and monitor values was maintained throughout the 6‐month study period, with a minimum monthly median value of 75% in month four (Figure 3). Patients with controlled and uncontrolled (systolic>140 or diastolic>90) hypertension at baseline recorded pressures with the same degree of accuracy.
Table II.
Patients With Varying Percentages of Agreement Between Reported and Stored Monitor Readings
| Percent Agreement | Number Of Patients | Cumulative% OF Patients | Individual%of Patients |
|---|---|---|---|
| 0–10 | 0 | 0 | 0 |
| 11–20 | 0 | 0 | 0 |
| 21–30 | 4 | 8.2 | 8.2 |
| 31–40 | 1 | 10.2 | 2.0 |
| 41–50 | 8 | 26.5 | 16.3 |
| 51–60 | 6 | 38.8 | 12.2 |
| 61–70 | 4 | 46.9 | 82 |
| 71–80 | 2 | 51.0 | 4.1 |
| 81–90 | 9 | 69.4 | 18.4 |
| 91–100 | 15 | 100 | 30.6 |
| Totals | 49 | 100 | 100 |
Figure 3.
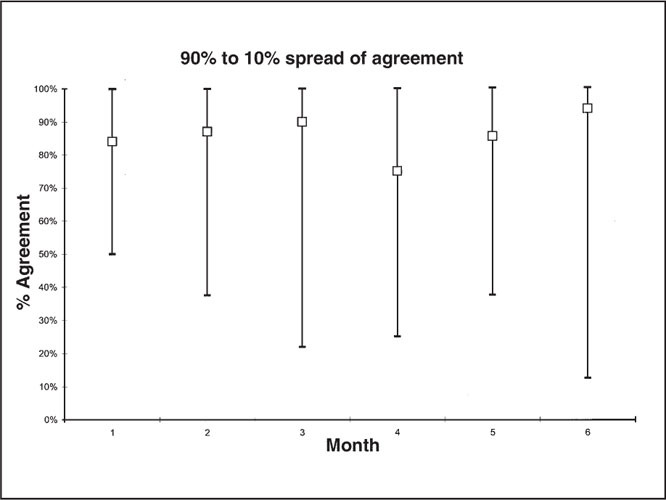
Range (10th to 90th percentile) of agreement over time (6‐month study period). In this plot, the open box represents the median percent agreement for each month. The long, thin, extending lines represent the 10th to 90th percentile range of these median values for the 49 patients in our study.
Patients did not selectively record lower blood pressure readings in their diaries. The overall mean self‐reported blood pressure was nearly identical to the mean monitor‐stored blood pressure: blood pressure (±SD) 134±16.8/78±11.6 mm Hg; monitor‐stored: 135±19.6/80±13.3 mm Hg. Approximately one half (47%) of patients had mean matched and unmatched systolic readings that were within 5 mm Hg of each other, while 63% of patients had mean matched and unmatched diastolic readings within 5 mm Hg of agreement (Table III). Overall, 78% and 90% of patients, respectively, possessed mean matched/unmatched systolic and diastolic readings within 10 mm Hg of agreement.
Table III.
Difference in Means of Matched/Unmatched Monitor Blood Pressure Readings From Mean Unmatched Readings: Mean Unmatched Systolic (or Diastolic) Reading − Mean Matched Systolic (or Diastolic) Reading
| Mean Difference Systolic | Number of Patients | Percent of Patients |
| More than −10 mmHg | 7 | 14.3 |
| −5 to −10 mmHg | 4 | 8.2 |
| −2 to −5 mmHg | 5 | 10.2 |
| −2 to 0 mmHg | 5 | 10.2 |
| 0–2 mmHg | 2 | 4.1 |
| 2–5 mmHg | 11 | 22.4 |
| 5–10 mmHg | 11 | 22.4 |
| More than +10 mmHg | 4 | 8.2 |
| Mean Difference Diastolic | Number of Patients | Percent of Patients |
| More than −10 mmHg | 1 | 2.0 |
| −5 to −10 mmHg | 3 | 6.1 |
| −2 to −5 mmHg | 3 | 6.1 |
| −2 to 0 mmHg | 5 | 10.2 |
| 0–2 mmHg | 8 | 16.4 |
| 2–5 mmHg | 15 | 30.6 |
| 5–10 mmHg | 10 | 20.4 |
| More than +10 mmHg | 4 | 8.2 |
| Data were calculated by subtracting mean matched reading from mean unmatched readings: mean unmatched systolic (ordiastolic) reading minus mean matched systolic (ordiastolic) reading. | ||
DISCUSSION
The median level of agreement between self‐recorded blood pressures and blood pressure readings stored in the home monitor memory chip for subjects in this study was 80%, with one third of subjects recording pressures with better than 90% accuracy. While mean compliance with recording and measuring the minimum number of requested readings declined from 85% to 45% over time, the reliability of recorded readings, which was the primary end point of the study, was maintained. Patients who reported pressures reliably did so consistently over the entire 6‐month study period. These findings suggest that patients who report blood pressures reliably during an initial trial period would continue to do so over a prolonged period of time.
Johnson et al.18 found that the majority of their subjects reported at least two self‐reported readings that differed from electronically monitored readings by more than 10 mm Hg (83%/62%, respectively, for systolic/diastolic readings). In our study, 13 subjects had mean matched and mean unmatched systolic or diastolic readings that differed by more than 10 mm Hg. While 10 mm Hg represents a large difference in blood pressure measurement clinically, we expected to find a discrepancy of this magnitude in more than the 26% of patients in our results.
We decided to link self‐reported pressures with monitor‐stored pressures that were within 1 week of each other. In order to simplify the study protocol, we instructed patients to record blood pressures accurately; we did not stress the need to record dates with strict accuracy. Therefore, we surmised that patients were probably less concerned with recording the exact date of the blood pressure recordings correctly.
Patients may have written their monitor pressures down at the time of the reading for later transfer to the diary, promoting inaccuracy in recording the date of the actual recording. Given the calendar diary format, it would have been relatively simple to transpose readings incorrectly by a day or week's time. We plan to collect data on this issue in a future study. Also supportive of our conclusion that many patients report home blood pressures accurately was that the mean difference between self‐reported and electronically stored pressures in our patients was clinically insignificant (0.7 mm Hg systolic and 1.4 mm Hg diastolic).
Mengden and Johnson and their collaborators17,18 found that up to 100% of patients failed to report values from the electronic monitor. We were not surprised to find, similarly, that 100% of our patients had a larger number of monitor readings than diary readings. In fact, we expected patients in our study to have more monitor readings for several reasons. We anticipated that use of the monitor would stimulate patient interest in following their blood pressures, resulting in a higher number of monitor readings. Accordingly, we did not instruct patients to limit their use of the monitor.
The resulting number of monitor readings was consistently higher than the number of diary readings throughout the entire 6‐month study, which provides evidence suggestive of sustained interest in home monitor use. Also, space was limited in the diary format, perhaps discouraging patients from recording additional readings beyond the four per week they were instructed to record. Finally, some stored readings may have been blood pressures of friends or relatives of study subjects who used the monitor, although we instructed patients not to share their monitors with others.
While all patients used the monitor more often than the minimum number of times requested, they did not selectively delete aberrant readings. The overall mean self‐reported and monitor‐stored blood pressures were nearly identical. Comparing mean matched and unmatched blood pressure readings, nearly one half of patients' systolic and diastolic readings were within 5 mm Hg of agreement, while 80% of patients' systolic and diastolic readings agreed within 10 mm Hg. While only one half of mean matched and unmatched readings were within 5 mm Hg of each other, physicians are likely to use the overall mean of home readings clinically. Therefore, the finding that the means of total patient‐reported and monitor‐stored readings, both systolic and diastolic, were nearly identical is both reassuring and supportive of the potential usefulness of home blood pressure readings in hypertension management.
Mengden and Johnson and colleagues17,18 also discovered that over one half (52%–63%) of their subjects added values not found in the monitor. In our study, 96% of patients reported “phantom” readings (unmatched diary readings) as well. Although we instructed patients to record only readings generated by the home monitor in their diaries, some patients may have recorded readings obtained elsewhere (i.e., drugstore, at the doctor's office, etc.).
The fact that this study was conducted in a single urban family practice with a small number of mildly hypertensive patients limits the generalizability of our results. Additionally, we may have overestimated the reliability of patients' self‐reporting, if patients made extra efforts to report their pressures accurately because they knew they were being observed in a research protocol. However, the fact that patients were unaware that their reported blood pressures were being “checked” by the electronic memory chip somewhat argues against this.
Our results are similar to those from prior studies, where many subjects misreported pressures. However, we were also able to demonstrate that one half of our patients, a significant proportion, reported pressures with 80% or better reliability over a 6‐month period of time. These findings should serve to stimulate continued inquiry in response to concerns regarding the reliability of self‐reported blood pressures that were raised following the publication of earlier studies.20 Further studies, using larger numbers of subjects, are needed to predict characteristics of patients likely to report pressures consistently and reliably. Conversely, for patients anticipated to report blood pressures less accurately, electronic monitors with a memory chip could be used.
As with home glucose monitoring in diabetes, self‐monitoring of blood pressure has the potential to actively involve patients in hypertension disease management and control. Sharing of blood pressure data between patient and provider fosters a partnership approach to hypertension management, and could promote heightened interest and compliance with taking medication. Additionally, home blood pressures give medical providers additional data to better inform their hypertension decision‐making. The reliability and durability of self‐reporting of blood pressures found in this study supports the potential usefulness of self‐monitoring of blood pressure in managing hypertension.
Results of this study were presented at the Meeting of the National Primary Care Research Group (NAPCRG), Amelia Island, FL, November 2000 and the American Society of Hypertension Meeting, San Francisco, CA, May 2001.
Acknowledgments: Partial funding was provided by Omron Healthcare, Incorporated, The Edna G. Kynett Memorial Foundation, Novartis Pharmaceuticals Corporation, and a grant from the Health Resources and Services Administration. We gratefully acknowledge the tremendous efforts of Lori L. Trapani, RN, our study coordinator, and Candra Wooten, BS, our research assistant, without whom this study would not have been possible. We would also like to gratefully acknowledge the assistance of Bonita Falkner, MD in reviewing our preliminary drafts of this manuscript.
References
- 1. Joint National Committee. Sixth Report of the Joint National Committee on Detection, Evaluation, and Treatment of High Blood Pressure. Washington, DC:National Institutes of Health; 1993. publication No. 98‐4080. [Google Scholar]
- 2. Adults taking action to control their blood pressure—United States, 1990. MMWR. 1994;43:509–517. [PubMed] [Google Scholar]
- 3. Coats AJS, Radaelli R, Clark SJ, et al. The influence of ambulatory blood pressure monitoring on the design and interpretation of trials in hypertension. J Hypertens. 1992; 10:385–391. [DOI] [PubMed] [Google Scholar]
- 4. Perry HMJ, Miller JP. Difficulties in diagnosing hypertension. J Hypertens. 1992;10:887–896. [PubMed] [Google Scholar]
- 5. Ibrahim MM, Tarazi RC, Dustan HP, et al. Electrocardiogram in evaluation of resistance to antihypertensive therapy. Arch Intern Med. 1977;137:1125–1129. [PubMed] [Google Scholar]
- 6. Kleinert HD, Harshfield GA, Pickering TG, et al. What is the value of home blood pressure measurement in patients with mild hypertension? Hypertension. 1984;6:574–578. [DOI] [PubMed] [Google Scholar]
- 7. Ohkubo T, Imai Y, Tsuji I, et al. Home blood pressure measurement has a stronger predictive power for mortality than does screening blood pressure measurement: a population‐based observation in Ohasama, Japan. J Hypertens. 1998;16:971–975. [DOI] [PubMed] [Google Scholar]
- 8. Staessen JA, Thijs L, Fagard R, et al. Predicting cardiovascular risk using conventional vs. ambulatory blood pressure in older patients with systolic hypertension. JAMA. 1999;282:539–546. [DOI] [PubMed] [Google Scholar]
- 9. Pickering T. Recommendations for the use of home (self) and ambulatory blood pressure monitoring. American Society of Hypertension Ad Hoc Panel. Am J Hypertens. 1996;9:1–11. [DOI] [PubMed] [Google Scholar]