15.1. INTRODUCTION
As a common medical condition that produces excessive thirst, continuous urination and severe weight loss, Diabetes# has interested medical researchers for over three millennia. Unfortunately it wasn’t until the early 20th century that the prognosis for this condition became any better than it was 3000 years ago. Today, approximately 150 million people worldwide are affected by diabetes. With its prevalence still rising, diabetes still continues to fascinate, practitioners and researchers alike, by its elusive cause and its many manifestations.
While the Ebers Papyrus, which was written around 1500 BC, excavated in 1862 AD from an ancient grave in Thebes, Egypt, described the first reference to Diabetes Mellitus, it was physicians in India at around the same time that developed the first crude test for diabetes. They observed that the urine from people with diabetes attracted ants and flies. They subsequently named the condition “madhumeha” or “honey urine” [1].
The important elements of our current understanding of diabetes can be traced to the early to mid 19th century. In 1815 Eugene Chevreul in Paris concluded that the sugar in urine was indeed Glucose, the first quantitative test for glucose in urine being developed by Von Fehling some years later in 1848 [2].
Over one-hundred and fifty years later, significant attention is still given to the development of physiological glucose monitoring [3–36]. This is because one important aspect for diabetes management, involves the tight control of blood glucose levels, so as to manage food intake and the dosage and timing of insulin injection. Tests for determining serum glucose concentration typically require blood collection by some invasive technique, usually a needle or other device causing arterial or venous puncture.
Currently, millions of diabetics are left with very few alternatives, except to invasively draw blood many times daily to determine their blood sugar levels. To this end, many technologies have been developed over the past 20 years in an attempt to provide a technology, which promises both non-invasive and continuous physiological glucose monitoring. These include near infrared spectroscopy [3,4], optical rotation [5,6], colorimetric [7,8] and fluorescence detection [9–13], to name but just a very few.
Recently we have seen the launch of the new GlucoWatch, which approved by the FDA in 2001, is the first step towards both the continuous and non-invasive monitoring of physiological glucose. However, in addition to wearing this wrist watch based glucose sensor, it is also recommended that glucose monitoring by another blood sampling technique be additionally used from time to time. Other technologies, which are presently emerging, include, glucose monitoring skin patches, implantable glucose sensors coupled insulin pumps, and laser blood drawing, which is deemed less painful than finger pricking with a lancet or needle. Yet with all these emerging technologies, there is still a need for new technologies, which are truly non-invasive and continuous. To this end our laboratories have been developing glucose sensing contact lenses which when worn by diabetics, who often require vision correction in any case, can potentially monitor tear glucose levels, which are known to directly relate and track blood glucose levels [14–17].
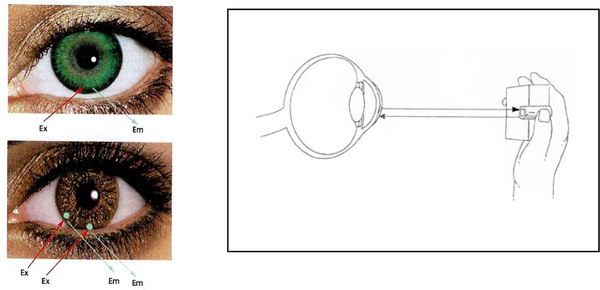
In this review chapter, we employ the notion of elevated tear glucose levels during hyperglycemia to investigate, for the first time, the possibility of monitoring tear glucose and therefore blood glucose, using a disposable, off-the-shelf, contact lens. By incorporating new monosaccharide fluorescent signaling boronic acid containing probes (BAFs) within such a lens, we can indeed make progress towards this non-invasive and continuous approach for glucose monitoring, Figure 15.1.
Figure 15.1.
Potential methods for non-invasive continuous tear glucose monitoring. (Top left) BAF doped contact lens as described here, and (Bottom left) Sensor spots on the surface of the lens to additionally monitor other analytes in addition to glucose, such as drugs, biological markers, Ca2+, K+, Na+, O2 and Cl−. Sensor regions may also allow for ratiometric, lifetime or polarization based fluorescence glucose sensing. (Right) Schematic representation of the possible tear glucose sensing device.
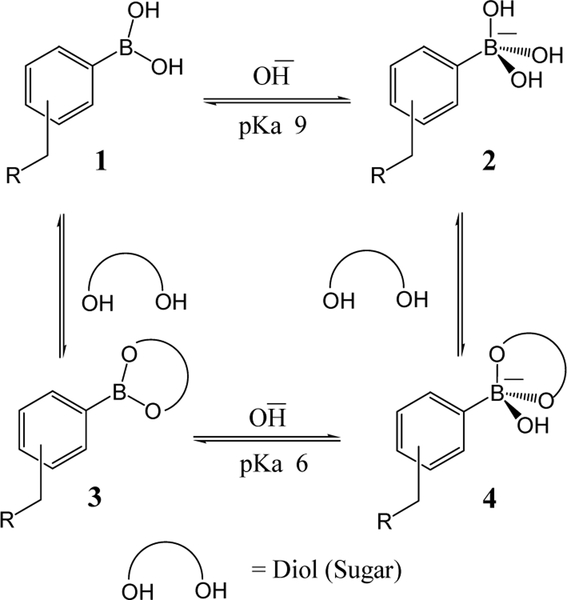
As with any sensors, there are several issues that have to be addressed. The first is to identify suitable transduction elements, which in the presence of glucose, can report / produce suitable signals. The second is the design of the matrix to incorporate the transduction elements. For this, we have chosen an off-the-shelf disposable plastic contact lens, primarily because its physiological compatibility has already been assessed, and finally, the optimization of the sensor, with regard to sensitivity, response time, reversibility and shelf-life etc. The later two issues will be discussed throughout much of this review and indeed in past papers by the authors [14–17]. For the identification of suitable transduction elements, boronic acid has been known to have high affinity for diol-containing compounds such as carbohydrates [18–20], Scheme 15.1, where the strong complexation has been used for the construction of carbohydrate sensors [21–28], transporters [29] and chromatographic materials [30]. Boronic acid compounds have also been used for the synthesis of glucose sensors [31–36], where we note the work of Shinkai [31,32] and Lakowicz [33–36] to name but just a few workers in this field. In this review chapter, we discuss how one can develop a suitable transduction mechanism for continuous glucose monitoring, using a disposable, colorless and daily use contact lens.
Scheme 15.1.
Equilibrium between the various forms of the boronic acid in solution, and diol (sugar) interaction.
15.2. GLUCOSE SENSING USING BORONIC ACID PROBES IN SOLUTION
The potential applicability of the boronic acid probes to glucose sensing is evident from the vast amount of data published on this topic. In this regard we are interested to provide an overview on the glucose sensing using boronic acid probes in solution, which may help the reader to understand the subsequent sections of this chapter. Boronic acid forms reversible covalent bonds with vicinal dihydroxy containing compounds such as saccharides, and during this, the electronic properties and geometry at the boron atom are altered (Scheme 15.1). Subsequently, the changes in electronic properties at the boron atom are being transferred to the appended fluorophore, leading to the spectral shift and/or intensity changes observed, depending on the transduction mechanism. The equilibrium involved with the boronic acid and diol interaction is illustrated in Scheme 15.1 and can be described as follows. Boronic acids are weak Lewis Acids composed of an electron deficient boron atom and two hydroxyl groups, (1 in Scheme 15.1), with trigonal planar conformation, and which can interact with strong bases like OH− to from the anionic boronate ester form (2 in Scheme 15.1), that having the tetrahedral geometry at the boron atom. The boronic acid group (1) typically shows high pKa, around 9 [37,38]. Boronic acids couple with diols to form a boronic acid diester group (3 in Scheme 15.1). In comparison to the boronic acid group, the boronic acid diester group is relatively more acidic (pKa ≈ 6) due to a higher electrophilic boron atom.
The affinity of the boronic acid is directly proportional to the number of available vicinal hydroxyl groups. Subsequently, the monophenylboronic acid shows higher affinity towards D-fructose over D-glucose because of stronger tridentate and weaker bidentate type binding with D-fructose and D-glucose respectively, with binding constants of ≈ 0.5 and 10 mM respectively [38]. The affinity of the boronic acid towards sugars is tunable by adjusting the geometry and substituents on the fluorophore moiety. A geometrically placed diboronic acid containing fluorophore shows higher affinity towards D-glucose over D-fructose. Hence glucose sensitive probes can be made with a variety of affinities, in the mM range for blood glucose [34–36], and in the μM range for tear glucose [39,40]. Also the pKa of the boronic acid can be modulated according to the medium of interest. For example, as we can see in this section, the sugar response of most of the probes reported in the literature has been conducted in slightly elevated pH solutions such as pH 8. In contrast to this, also which is thought be one of the reasons of incompatibility of these probes within the acidic contact lens, the new probes developed based on the quinolinium moiety show an excellent sugar response in physiological pH solutions but not in slightly acidic media such as in a contact lens (see section 15.5.3). This is due to the reduced pKa of the new quinolinium probes. An increase and decrease in boronic acid pKa can be observed with substituents with electron donating and accepting nature, respectively, on the phenyl ring. Here we have used strategic design logic by using a electron withdrawing quaternary nitrogen center within the interacting space of boronic acid to reduce the boronic acid pKa. Also, in contrast to the other probes, because of the positively charged quinolinium moiety, these probes are readily water soluble and are therefore potentially useful for physiological applications.
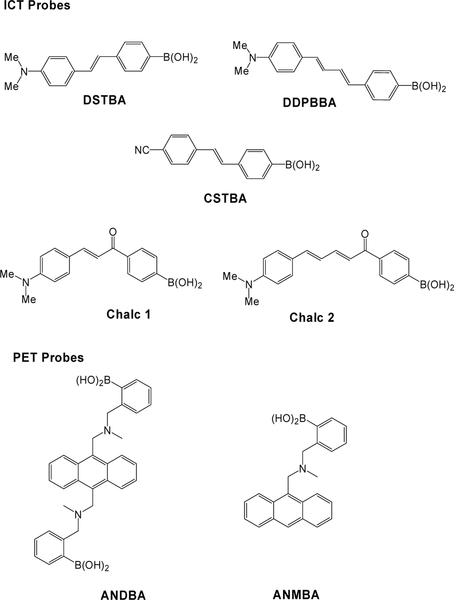
A wide range of signaling mechanisms have been employed in the design of boronic acid containing fluorophores including intramolecular charge transfer (ICT), and the photoinduced electron transfer mechanism (PET). The extent of transduction during the sugar binding results in the spectral modifications, which in-turn, can be quantified to construct the calibration curves for accurate sugar detection. In the following section we have described the response of a few representative boronic acid probes using each mechanism towards monosaccharides in buffered solutions. The molecular structures of the probes are shown in Chart 15.1.
Chart 15.1.
Molecular structures of the ICT and PET probes studied in the contact lens. DSTBA - 4’-Dimethylaminostilbene-4-boronic acid; CSTBA - 4’-Cyanostilbene-4-boronic acid; DDPBBA - 1-(p-Boronophenyl)-4-(p-dimethylaminophenyl)buta-1,4-deine; Chalc 1 – 3-[4’(Dimethylamino)phenyl]-1-(4”-boronophenyl)-prop-2-en-1-one; Chalc 2 – 5-[4’-(Dimethylamino)phenyl]-1-(4’-boronophenyl)-pent-2,4-dien-1-one; ANDBA – 9,10-bis-[[N-methyl-N-(o-boronobenzyl)amino]methyl]anthracene; and ANMBA – 9-[[N-methyl-N-(o-boronobenzyl)amino]methyl]anthracene.
15.2.1. Probes employing the intramolecular charge transfer mechanism (ICT).
Compounds with suitably placed electron donor and acceptor groups can show intramolecular charge transfer (ICT) features in their spectra. The extent of ICT in a system can be easily altered by changing the external parameters such as polarity of the medium; an increase in ICT is a common observation with increasing solvent polarity. An increase in ICT would result in red shift of the spectrum. An opposite observation is true when the polarity of the medium is reduced. It is also commonly observed that most probes show reduced and increased fluorescence quantum efficiencies with an increase and decrease in ICT efficiency of the system, respectively.
In addition, modulations in the donating and accepting capabilities of the donor and acceptor, result in spectral shifts as can be seen by the external spectral parameters. As mentioned in the last paragraph, the electronic properties of boronic acid can be altered during the binding with saccharides; boronic acid is an electron acceptor and the corresponding boronate diester is no longer an acceptor and acts as a donor when it is coupled with a suitable acceptor group on the fluorophore moiety. As a result, boronic acid probes employing the ICT mechanism show spectral shifts with changes in quantum yield upon binding with saccharides, providing unique ratiometric probes for saccharide sensing. Here we can demonstrate these features with a few examples. The molecular structures of the probes are shown in Chart 15.1. As shown, two stilbene derivatives (DSTBA and CSTBA) a polyene derivative DDPBBA and two chalcone derivatives (Chalc 1 and Chalc 2) are considered. DSTBA ad DDPBBA combines the electron-donating dimethylamino group with the electron withdrawing boronic acid group, and CSTBA combines the electron withdrawing cyano group with the boronic acid, in essence these two sets of probes show both decreased and increased ICT respectively, upon binding with glucose.
Chalcone derivatives, Chalc 1 and Chalc 2, unlike the stilbenes have the advantage of much longer wavelength emission. This is particularly attractive as longer wavelength emission potentially reduces the detection of any lens or eye autofluorescence, as well as scatter (λ−4 dependence), and also allows the use of cheaper and longer wavelength laser or light emitting diode excitation sources, reducing the need for UV excitation in the eye.
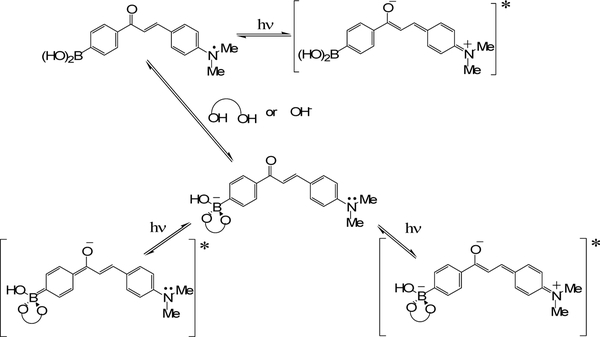
In chalcone probes the boronic acid group does not produce resonance forms with the electron donating amino group. The CT occurs between the dimethylamino group (electron donating group) and the carbonyl group (electron withdrawing group) (Scheme 15.2). Upon sugar binding to the boronic acid group, then a change in the electronic properties of the boron group, both when free and when complexed with sugar, leads to a change in the electronic density of the acetophenone moiety and subsequently the CT properties of the excited state of the fluorophore, noting that boronic acid group is in resonance with the carbonyl group.
Scheme 15.2.
Ground and excited state electronic distributions involved in the neutral and anionic forms of the boronic acid group of Chalc 1. For the case of interaction with OH−, the diol should be replaced by two OH− groups.
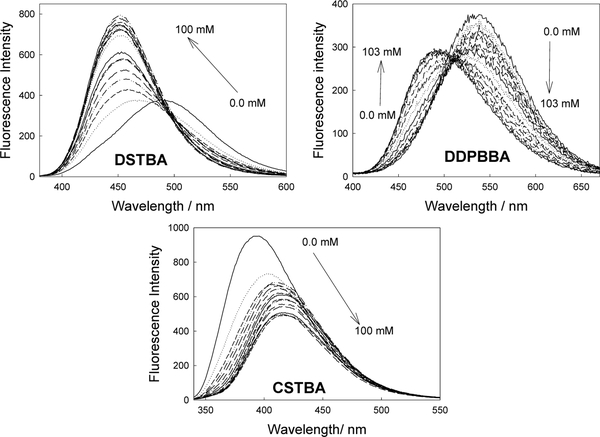
Figure 15.2 shows the effect of sugar on the emission properties of DSTBA in pH 8.0 buffer-methanol (2:1, v/v) solution. The emission spectrum shows a hypsochromic shift of about 30 nm and an increase in fluorescence intensity as the concentration of fructose increases (Figure 15.2 – Top left). These dramatic and useful changes can simply be explained by the loss of the electron withdrawing property of the boronic acid group following the formation of the anionic form as shown in Scheme 15.1. A similar response has been observed with the polyene derivative DDPBBA (Figure 15.2 – Top right).
Figure 15.2.
Emission spectra of DSTBA (Top left), DDPBBA (Top right) and CSTBA (Bottom) in pH 8.0 buffer/methanol (2:1) with increasing concentrations of fructose, λex for DSTBA and DDPBBA is 340 and for CSTBA, 320 nm.
The other stilbene derivative CSTBA possesses two electron withdrawing groups, boronic acid and cyano groups. In the presence of sugar as shown in Figure 15.2 – Bottom, we can observe a bathochromic shift of about 25 nm, and a decrease in the intensity at pH 8, which is opposite to that observed for DSTBA. This change has been attributed to an excited CT state present for the anionic form of CSTBA, where no CT state has been observed for the neutral form of the boronic acid group [41], suggesting that the anionic form of the boronic acid group can act as an electron donor group. Similarly Chalc 1 and Chalc 2 show an excellent response to sugar and pH, resulting from the reduced ICT in the systems upon sugar binding [39,41].
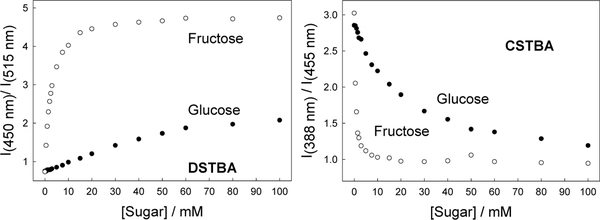
A few representative titration curves for DSTBA and CSTBA are shown in Figure 15.3, the dissociation constants for DSTBA, DDPBBA, CSTBA, Chalk 1 and Chalc 2, are shown in Table 15.1. As previously mentioned, monoboronic acid derivatives show higher affinities for D-Fructose, and the affinity decreases for D-Glucose. As for the data provided in this section, one quickly realizes that the probes based on the ICT mechanism are potential candidates for physiological glucose monitoring.
Figure 15.3.
Ratiometric response plot for DSTBA (Left) and CSTBA (Right) in pH 8.0 buffer / methanol (2:1) with glucose and fructose.
Table 15.1.
Dissociation constants (KD, mM) of the boronic acid probes for glucose and fructose.
| DSTBA | DDPBBA | CSTBA | Chalc 1 | Chalc 2 | ANDBA | ANMBA | |
|---|---|---|---|---|---|---|---|
| Glucose | 98 | 17 | 18 | 34 | 30 | 0.51 | 21.3 |
| Fructose | 2.5 | 1.1 | 0.65 | 2.5 | 2.1 | --- | --- |
The dissociation constant (KD) values of DSTBA, DDPBBA and CSTBA were measured at pH 8.0 for that of Chalc 1 and Chalc 2 were obtained in pH 6.5 buffer.
15.2.2. Probes employing the photoinduced intramolecular electron transfer mechanism, (PET).
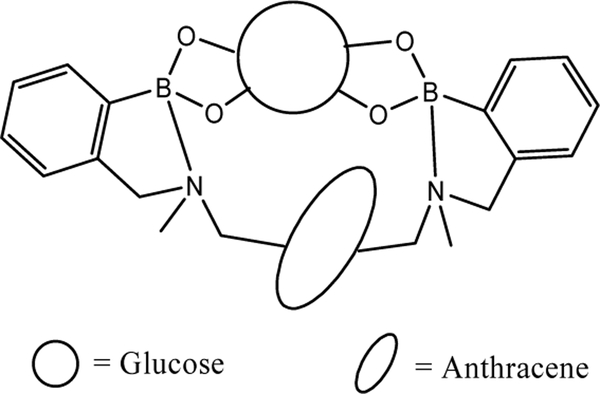
The anthracenediboronic acid derivative, ANDBA, is the one of the well-known boronic acid probes specific for glucose detection, developed by Shinkai et al. in 1995. The corresponding monophenylboronic acid probe ANMBA (Chart 15.1), is nonspecific for any saccharide, and shows high affinity towards fructose, as is the case with any monophenyl boronic acid based probe. The glucose specificity for ANDBA is due to the geometrically suitably appended two boronic acid moieties: the two boronic acid groups bind either side of the plane of the glucose ring (Figure 15.4). This novel approach of designing glucose specific probes has triggered vast amounts of interest in the research community over the last 10 years.
Figure 15.4.
A Schematic representation of glucose binding with the diboronic acid derivative, ANDBA.
The fluorescence spectra of ANDBA and ANMBA in pH 8.0 buffer-methanol (2:1, v/v) with glucose are shown in Figure 15.5. The fluorescence intensity of these probes increases with increasing concentrations of the monosaccharides. This is because; originally in these systems a photoinduced electron transfer from the donor amine to the acceptor anthracene results in fluorescence quenching. Subsequent binding with monosaccharides, shows increased acidity and thus reduces the PET interaction in the system. The suppressed PET interaction results in the emission enhancement of that probe. Subsequently the probes show fluorescence enhancement in the presence of glucose. In contrast the monophenylboronic acid derivative ANMBA shows relatively weaker affinity towards glucose over the diboronic acid derivative ANDBA. The measured dissociation constants (KD) are 21.3 and 0.51 mM for ANMBA and ANDBA, respectively, with glucose (Table 15.1).
Figure 15.5.
Fluorescence spectral changes of ANMBA (A) and ANDBA (B) in pH 8.0 buffer / methanol (1:2) with increasing concentrations of glucose. λex = 365 and 380 nm for ANMBDA and ANDBA, respectively.
Figure 15.6 shows frequency domain decay profiles of ANMBA and ANDBA with glucose. Similar to the wavelength ratiometric sensing of analytes, lifetime based sensing has intrinsic advantages for biomedical fluorescence sensing and is thus considered to provide for a more reliable analytical method. As seen from Figure 15.6, these probes show increases in lifetime with increasing concentrations of glucose. A fluorescence lifetime change from 9.8 to 12.4 and 5.7 to 11.8 ns for ANMBA and ANDBA respectively, has been observed. Although these probes are insoluble in water or indeed in physiological fluids, based on the results from steady-state and lifetime measurements, they serve to demonstrate that these probes, especially ANDBA, are potential PET based boronic acid probes for physiological glucose sensing applications.
Figure 15.6.
Effect of glucose on the frequency-domain decay profiles for ANMBA (A) and ANDBA (B) in pH 8.0 buffer / methanol (2:1) mixture. The lines represented the global fits with two lifetimes.
15.3. LENS FEASIBITY STUDY
As briefly mentioned in the introduction, the continuous monitoring of glucose may be possible using a contact lens embedded with a suitable glucose sensing probe, whose glucose sensing response is retained within the contact lens environment. In this regard we are interested to see the applicability of the probes discussed in section 15.2 towards glucose monitoring in a disposable, off-the-shelf, contact lens.
15.3.1. Lens doping and contact lens holder
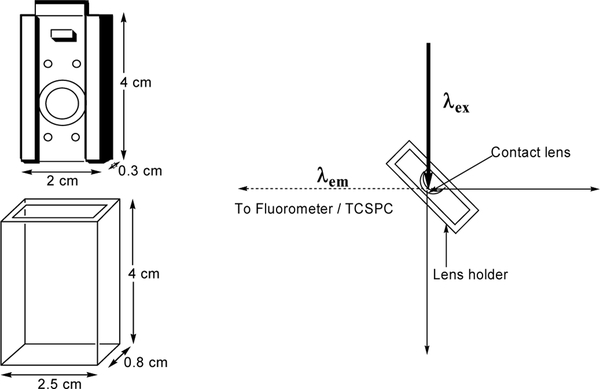
The contact lenses were washed several times with Millipore water at 20oC to remove the salts and other preservatives in the contact lens. The contact lens is a polyvinyl alcohol type photocured polymer which swells slightly in water. Its hydrophilic character readily allows for the diffusion of the analytes in tears. The probe doping was conducted by incubating the lenses in a high concentration of the respective BAFs solution for 24 hrs before being rinsed with Millipore water. Lenses were used directly after being prepared. Doped contact lenses, which were allowed to leach excess dye for 1 hr, were inserted in the contact lens holder, Figure 15.7. The quartz lens holder, which was used in all the lens studies, has dimensions of 4*2.5*0.8 cm, all 4 sides being of optical quality. The contact lens is mounted onto a stainless steel mount of dimensions 4*2*0.4 cm, which fits tightly within the quartz outer holder. A circular hole in the center of the mount with a 1.5 cm ID, has a raised quartz lip, which enables the lens to be mounted. The mount and holder readily allow for ≈ 1.5 cm3 of solution to be in contact with the front and back sides of the lens for the sugar sensing experiments. Buffered solutions of sugars were then added to the lens. Fluorescence spectra were typically taken 15 mins after each sugar addition to allow the lens to reach equilibrium. Excitation and emission was performed using a Varian Fluorometer, where the geometry shown in Figure 15.7 – right, was employed to reduce any scattering of the excitation light, the concave edge of the lens facing towards the excitation source. We additionally tested the lens excited from the convex edge, just as would be used in the eye, and encouragingly found identical results.
Figure 15.7.
Contact lens mount and quartz holder (Left top and Bottom, respectively) and experimental geometry used for contact lens glucose sensing (Right).
15.3.2. Response of ICT probes with in the contact lens
15.3.2.1. Stilbene Derivatives
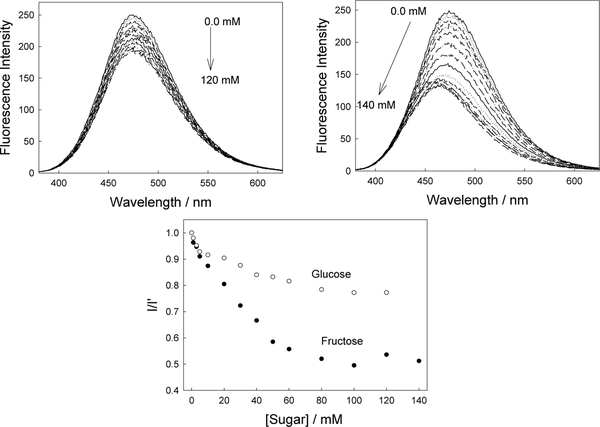
Figure 15.8 shows the emission spectra and titration curves for a DSTBA doped contact lens towards both glucose and fructose. As expected the magnitude of the response towards fructose is greater, reflecting the higher affinity of mono boronic acids for fructose [41]. Comparing the response of DSTBA in both solution and lens (Figure 15.3 left and Figure 15.8 Bottom), we can see that an opposite response is observed in the lens, where the emission spectra similarly shows a blue shift, accompanied by a decrease in intensity as the fructose concentration is increased. In addition the sugar affinity is decreased slightly in the lens.
Figure 15.8.
Emission spectra of the DSTBA doped contact lens, pH 8.0 buffer / methanol (2:1), with increasing concentrations of glucose (Top left) and corresponding spectra with increasing concentrations of fructose (Top right). λex = 340 nm. Intensity ratio plot for the DSTBA doped contact lens towards both glucose and fructose (Bottom), where I and I’ are the intensities in the presence and absence of sugar respectively at λem max.
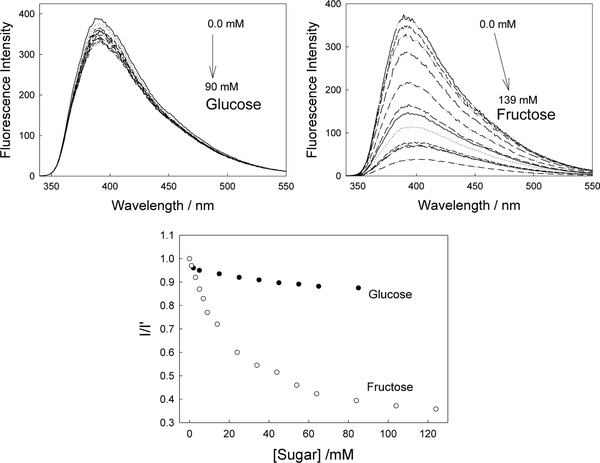
Similarly Figure 15.9 shows the response of CSTBA in the lens for both glucose and fructose. While a similar reduction in intensity is observed as compared to solution, no red shift in the emission is observed, indicative of a reduction in the electron donating capability of the anionic sugar bound form.
Figure 15.9.
Emission spectra of the CSTBA doped contact lens, pH 8.0 buffer / methanol (2:1), with increasing concentrations of glucose (top left) and corresponding spectra with increasing concentrations of fructose (top right). λex = 320 nm. Intensity ratio plot for CSTBA doped contact lens towards both glucose and fructose (bottom), where I and I’ are the intensities in the presence and absence of sugar respectively at λem max.
The lack of suitable spectral shifts in the presence of sugar eliminates, at this stage, the possibility of wavelength ratiometric sensing as shown for the solution based measurements in Figures 15.3. Subsequently, Figure 15.8-bottom and Figure 15.9-bottom compares the responses of the stilbene probes, DSTBA and CSTBA, based on a simple intensity ratio measurement. It is interesting to see the much greater response for fructose for CSTBA in the lens as compared DSTBA, where notable changes in intensity occur at < 20 mM [fructose]. However the glucose response of DSTBA in the contact lens appears more promising for [glucose] < 10 mM, where a 10 % fluorescence intensity change is observed for ≈ 10 mM glucose at pH 8.0. The greater response of CSTBA within the contact lens may arise from the relatively lower pKa value for CSTBA over the DSTBA probe. The apparent pKa values for CSTBA and DSTBA are 8.17 and 9.14, respectively.
3.2.2. Polyene Derivative
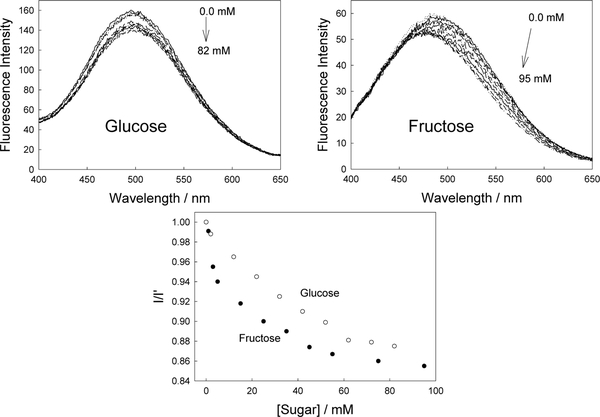
The spectral response of DDPBBA in the contact lens is also different to that observed in solution, c.f. Figure 15.2-top right and Figure 15.10, where a decrease in intensity is typically observed for increasing sugar concentration, and a slight blue shift is evident for fructose binding. This is in contrast to solution-based responses which show both a blue shifted and increased emission, Figure 15.2-top right. While the general spectral changes observed for both DSTBA (figure 15.8) and DDPBBA (Figure 15.10), are similar, a greater dynamic response to sugar is observed for DSTBA as compared to DDPBBA, c.f. figure 15.8 – bottom and Figure 15.10 – bottom. In addition the response of DDPBBA towards both glucose and fructose are similar over the sugar concentration range studied, Figure 15.10 – bottom, as compared to the significantly different responses observed for both sugars for DSTBA and figure 15.8-bottom and Figure 15.9-bottom.
Figure 15.10.
Emission spectra of the DDPBBA doped contact lens, pH 8.0 buffer / methanol (2:1), with increasing concentrations of glucose (Top left) and corresponding spectra with increasing concentrations of fructose (Top right). λex = 320 nm. Intensity ratio plot for DDPBBA doped contact lens towards both glucose and fructose (Bottom), where I and I’ are the intensities in the presence and absence of sugar respectively at λem max.
3.2.3. Chalcone Derivatives
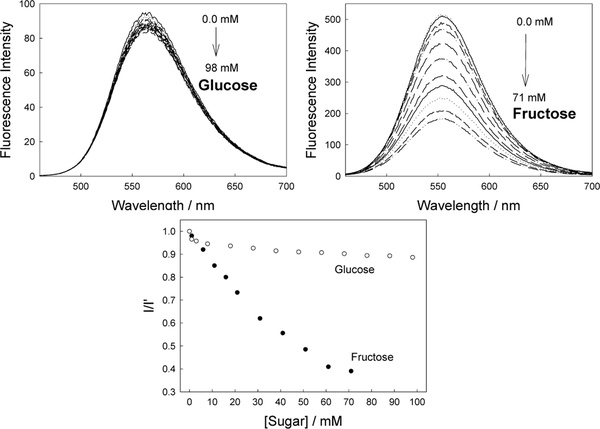
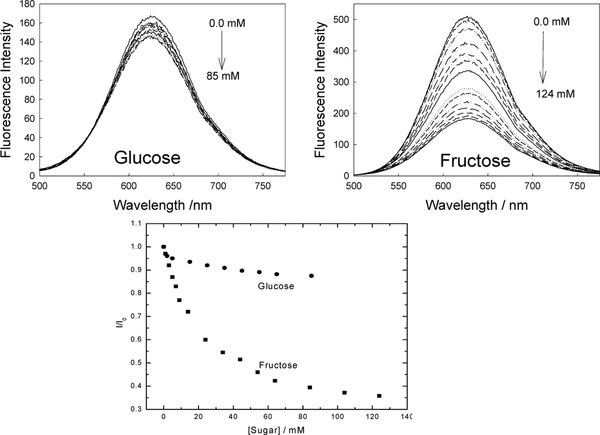
The response of Chalc 1 and Chalc 2 doped contact lenses towards sugar are shown in Figures 15.11 and 15.12 respectively. Both chalcone doped lenses display similar responses to sugar, Figures 15.11 and 15.12 – bottom respectively, only their respective emission wavelengths differ. Chalc 1 shows an emission centered around 560 nm in the lens as compared to 580 nm in solution (not shown), while Chalc 2 shows an emission centered at 630 nm as compared to 665 nm in solution. In contrast to the responses observed in solution, a reduction in fluorescence intensity is observed for both Chalc 1 and 2 doped contact lenses. Interestingly, the solution response for Chalc 2 towards 100 mM fructose at pH 8.0 produces a ≈ 3 fold increase in fluorescence emission, as compared to the ≈ 2.6 fold reduction for the same fructose concentration in the contact lens.
Figure 15.11.
Emission spectra of Chalc 1 doped contact lens, pH 8.0 buffer / methanol (2:1), with increasing concentrations of glucose (Top left) and corresponding spectra with increasing concentrations of fructose (Top right). λex = 430 nm. Intensity ratio plot for Chalc 1 doped contact lens towards both glucose and fructose (bottom), where I and I’ are the intensities in the presence and absence of sugar respectively at λem max.
Figure 15.12.
Emission spectra of Chalc 2 doped contact lens, pH 8.0 buffer / methanol (2:1), with increasing concentrations of glucose (Top left) and corresponding spectra with increasing concentrations of fructose (Top right). λex = 460 nm. Intensity ratio plot for Chalc 2 doped contact lens towards both glucose and fructose (Bottom), where I and I’ are the intensities in the presence and absence of sugar respectively at λem max.
15.3.3. Response of the PET probes within the contact lens
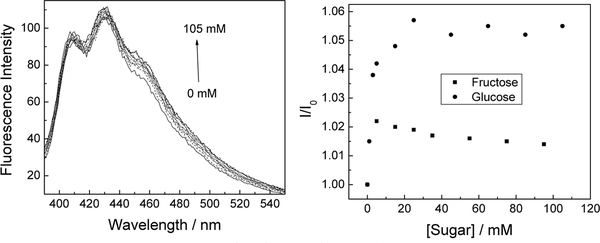
The emission spectra of ANDBA in the lens with glucose are presented in Figure 15.13. The response of the probe towards glucose and fructose in the lens is compared in Figure 15.13-right. It is evident from the figure that ANDBA in a contact lens has lost its ability to respond to glucose, an insignificant spectral change is observed within the contact lens. Similar to ANDBA, the monophenylboronic acid derivative ANMBA shows non responsive spectral behavior towards glucose and fructose within the contact lens. Still it is of interest to note here that the diboronic acid derivative ANDBA still shows the glucose selectivity over the fructose, Figure 15.13-right.
Figure 15.13.
Emission spectra of ANDBA doped contact lens, pH 8.0 buffer / methanol (2:1), with increasing concentrations of glucose (Left). λex = 365 nm. Intensity ratio plot for ANDBA doped contact lens towards both glucose and fructose (Right), where I and I0 are the intensities in the presence and absence of sugar respectively at λem max.
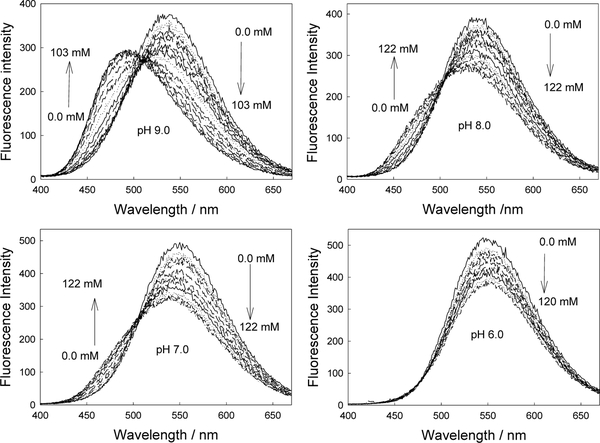
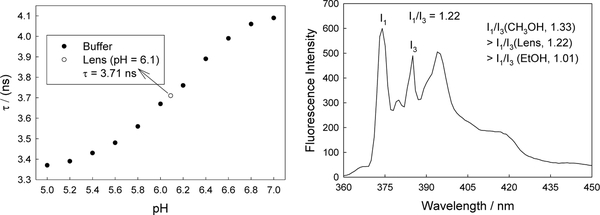
In most cases the response towards glucose in the lenses was significantly different, with drastically reduced glucose responses, as compared to the response typically observed at physiological pH. To understand the different response of these probes within the contact lens, a compared to that in buffer we have estimated the local pH and polarity of the contact lens and effect of the pH on the signaling behavior of the probes. Figure 15.14 shows the emission spectra of DDPBBA in different pH solutions in the presence of increasing concentrations of glucose. As with all the other probes studied, we observed that the response towards glucose in the contact lens was similar to the response observed in ≈ pH 6.0 bulk solution, c.f. Figure 15.10-top right and 15.14 bottom right. We subsequently doped the well-known pH sensitive probe fluorescein [41] within the lenses, and determined that the lenses had an unbufferable pH of ≈ 6.1, Figure 15.15-left. However, the influence of an acidic lens pH does not solely explain the spectral shifts observed in Figure 15.10 and 15.14, with DDPBBA additionally showing a 50 nm hyposchromic shift in the contact lens. An investigation of the polarity within the contact lens, using the pyrene I1 and I3 band ratio’s (I1/I3) [14,42,43], Figure 15.15-right, revealed a lens polarity similar to that of methanol, which in hindsight was not too surprising, given the nature of the polymer, i.e. it is PVA based. Thus the difference in the polarity and pH may cause the difference in the response of the probes within the contact lens when compared to that in solution.
Figure 15.14.
Emission spectra of DDPBBA in different pH media (buffer/methanol, 2:1) with increasing glucose concentrations. λex = 340 nm.
Figure 15.15.
Fluorescein lifetime versus pH of the medium, and the lifetime of a fluorescein doped contact lens, (Left). Fluorescence spectra of pyrene doped contact lens to asses the polarity inside the contact lens (Right). The obtained I1/I3 data is close to that of methanol.
15.4. RATIONALE FOR THE DESIGHN OF NEW GLUCOSE SENSING PROBES
Feasibility studies of doped lenses using the above mentioned boronic acid probes produced poor glucose responses, rationaled as due to the mildly acidic pH and methanol like polarity within the contact lens, and the subsequent effect on the transduction mechanisms, ICT or PET. This was also not surprising given the fact that these probes were designed for sensing at a physiological pH of ≈ 7.4, the probes typically having pKa around 9. Hence to obtain a notable glucose response in the contact lens polymer, it was deemed necessary to design new probes with significantly reduced sugar-bound pKa values. In addition to the environmental parameters and constraints of pH and polarity, the probes also have to be sensitive to the very low concentrations of tear glucose, ≈ 500 μM for a healthy person, increasing up to several mM for diabetics, recalling that the blood glucose levels for a healthy person are ≈ 10-fold higher [14–17].
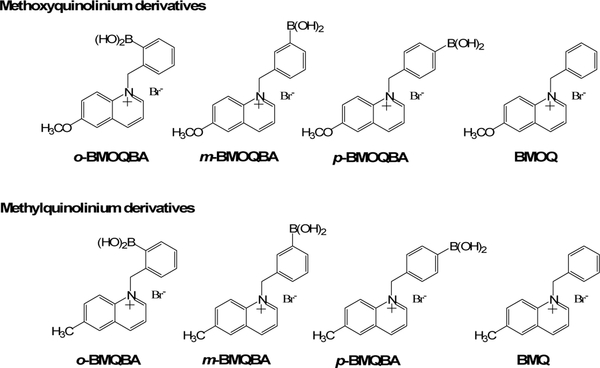
As mentioned in section 15.2, the pKa of phenyl boronic acid is known to be tunable with the appropriate substituents [44], for example, an electron withdrawing group reduces the pKa of the sugar bound form, while an electron donating group increases it. We therefore considered the interaction between the quaternary nitrogen of the 6-methyl- and methoxyquinolinium moieties, and the boronic acid group, which reduces the pKa of the probe. In this regard we have synthesized 2 new classes of isomeric boronic acid containing probes (8-probes in total), Chart 15.2, where the spacing between the interacting moieties, quaternary nitrogen of the 6-methyl- or methoxyquinolinium and boronic acid groups, enables both an understanding of the sensing mechanism to be realized, and the selection of the most suitable isomer based on its glucose binding affinity. In addition, control compounds (BMQ and BMOQ), which do not contain the boronic acid moiety, and are therefore insensitive towards sugar, were synthesized to understand the spectral properties and responses of the probes, Chart 15.2.
Chart 15.2.
Molecular structure of the boronic acid probes based on quinolinium nucleus as the fluorophore. o-, m-, and p- BMOQBA – N-(2, 3, 4-boronobenzyl)-6-methoxylquinolinium bromide, and the control compound (BMOQ–N-benzyl-6-methoxyquinolinium bromide); o-, m-, and p-BMQBA – N-(2, 3, 4, -boronobenzyl)-6-methylquinolinium bromide, and the corresponding control compound (BMQ-N-benzyl-6-methylquinolinium bromide)
15.5. GLUCOSE SENSING PROBES BASED ON THE QUINILOINIUM MOIETY
The new quinolinium based boronic acid containing probes (o-BMQBA – N-(2-boronobenzyl)-6-methylquinolinium bromide, m-BMQBA–N-(3-boronobenzyl)-6-methylquinolinium bromide, p-BMQBA–N-(4-boronobenzyl)-6-methylquinolinium bromide) and the control compound (BMQ–N-benzyl-6-methylquinolinium bromide), were conveniently prepared using a generic one step synthetic procedure described elsewhere by the authors. Similarly, the corresponding 6-methoxyquinoline nucleus; o-, m- and p-BMOQBA and a control compound BMOQ, were prepared in an analogous manner to the methyl quinolinium probes. These probes, because of the quaternized nitrogen center, are readily water soluble, alleviating the need to use methanol to solubalize the probes as discussed in section 15.2.
15.5.1. Photophysical Characterization of the Quinolinium probes
Figure 15.16 shows representative absorption and emission spectra for the ortho-isomers of the BMQBA and BMOQBA probes. Photophysical data of the probes is shown in Table 15.2. Typical absorption and emission band maximum of the probes can be seen at 318 and 450 nm, and 319 and 427 nm for the BMOQBA and BMQBA probes respectively. The additional absorption band at ≈ 350 nm for BMOQBA is attributed to the n→π* transition of the oxygen of 6-methoxy group [45]. The excitation independent emission band at ≈ 450 nm indicates only one ground-state species is present for BMOQ and BMOQBAs probes. The large Stokes-shifted fluorescence emission band of ≈ 100 nm is ideal for fluorescence sensing, allowing easy discrimination of the excitation wavelengths [41,45]. All probes were found to be readily water soluble, a function of the quaternized structure.
Figure 15.16.
Absorption and emission spectra of o-BMQBA (Left) and o-BMOQBA (Right) in water. The spectra are representative of the respective isomeric phenylboronic acid containing fluorophores and the control compounds.
Table 15.2.
Photophysical data of the quinolinium probes in water at room temperature.
| Property | o-BMOQBA | m-BMOQBA | p-BMOQBA | BMOQ |
| λabs (max) / nm | 318, 346 | 318, 347 | 318, 346 | 318, 347 |
| λem (max) / nm | 450 | 450 | 451 | 453 |
| Φf | 0.46 | 0.51 | 0.49 | 0.54 |
| τf/ ns | 26.7 | 25.9 | 24.9 | 27.3 |
| o-BMQBA | m-BMQBA | p-BMQBA | BMQ | |
| λabs (max) / nm | 319 | 322 | 322 | 322 |
| λem (max) / nm | 427 | 427 | 427 | 427 |
| Φf | 0.043 | 0.025 | 0.023 | 0.045 |
| τf/ ns | 4.01a | 3.72 a | 2.10 a | 2.59 |
Mean fluorescence lifetime.
Table 15.2 shows the quantum yield values for the probes in water, obtained from a spectral comparison with N-(3-sulfopropyl)-6-methoxyquinolinium [ (SPQ) (Φf = 0.53 in water [46])], where we can see that the BMOQBA probes have significantly higher quantum yields as compared to the BMQBA probes. Another reference compound, N-methyl-6-methylquinolinium bromide (MMQ) previously published by the authors [47] exhibits very similar spectral properties to that of BMQ and BMQBA probes, except for a noticeable quantum yield and mean lifetime difference, approximately 10-fold higher than its methyl quinolinium counterpart, namely BMQBA. This indicates an interaction between the phenyl ring and methylquinolinium moiety of the BMQBA and BMQ probes, Table 2, which is not present, or present to a much lesser extent, for the BMOQBA probes. We have attributed the relatively shorter lifetime and quantum yields of the new BMQBA probes and control compound to a photo-induced electron transfer mechanism, where the phenyl ring of BMQBA is the donor, and the methylquinolinium moiety is the acceptor. In the case of BMOQ and BMOQBA probes because of relatively more electron donating methoxy group, methoxyquinolinium is a weak acceptor and hence the PET mechanism is insignificant in these systems. Subsequently, the BMOQBA probes were found to have monoexponential lifetimes (≈ 24.9 → 26.7 ns) as compared to the BMQBA probes which were biexponential in water, with significantly reduced lifetimes of 2.18 (46 % amplitude) and 4.74 ns (54 % amplitude), for the ortho-isomer. Both control compounds were found to have monoexponential lifetimes in water, with the BMOQ over ten times longer, 27.3 ns, as compared to BMQ, 2.59 ns. These lifetime changes further support the electron transfer hypothesis, the B−(OH)3 present at neutral pH further reducing the lifetime of the boronic acid probes, i.e. 2 in Scheme 15.1.
In addition to the quantum yield and fluorescence lifetime differences between the phenyl ring containing BMQBA and BMQ probes, and the MMQ probe, we can also see lifetime differences between the BMQBA isomers themselves. We have attributed these changes due to the changes in electron donating ability of the different phenyl isomers, and additionally to their different through-space / through-bond interactions [48,49] with the methylquinolinium moiety, noting again that some [B−(OH)3] is likely to be present at neutral pH.
The quantum yield values of the BMOQBA isomers are slightly lower than that of the control compound (BMOQ), the quantum yield values increasing in the order ortho-, para- and meta-. In contrast the monoexponential fluorescence lifetimes of the isomers increased in the order para-, meta- and then ortho-, which was slightly surprising as the quantum yields and lifetimes usually change in unison. Similar to having the highest quantum yield, the control compound also had as expected, the longest lifetime of 27.3 ns. One explanation for these differences between the isomers, lies in the interaction between the boronate ester form (B−(OH)3, 2 in Scheme 15.1) present in solution and the positively charged nitrogen center at neutral pH, the extent of which being determined by the isomer spacing.
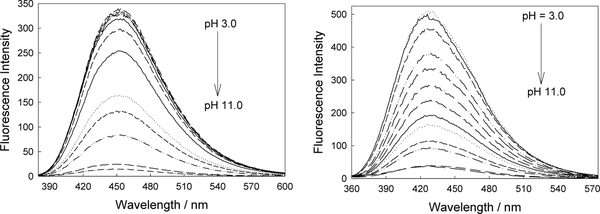
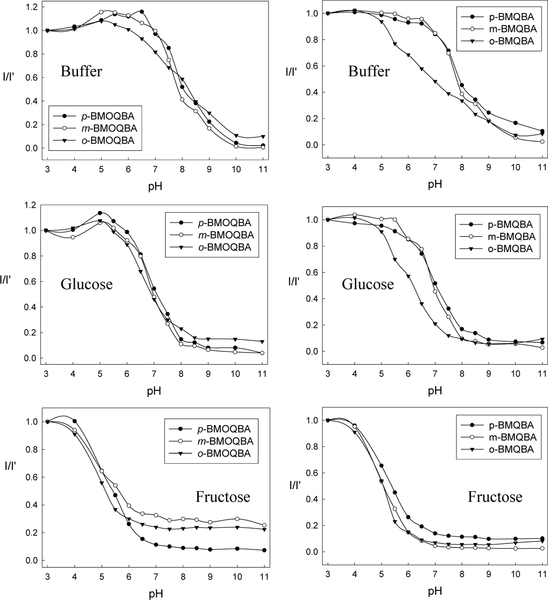
Figure 15.17 shows the emission spectra of o-BMOQBA and o-BMQBA in buffer media whose pH is increased from pH 3 to 11. The emission spectra of the new boronic acid containing probes typically show a steady decrease in fluorescence intensity with increase in pH from 3 to 11. In contrast, the control compounds, (BMOQ and BMQ) having no boronic acid group, show no change in fluorescence intensity. Subsequently the corresponding titration curves in the absence and in the presence of 100 mM glucose and fructose, obtained by plotting the normalized intensities at band maximum versus pH, are shown in Figure 15.18.
Figure 15.17.
Emission spectra of o-BMOQBA (Left) and o-BMQBA (Right) in buffer media. λex for BMOQBA and BMQBA was 345 and 320 nm, respectively.
Figure 15.18.
The ratio of the emission intensities at band maximum as a function of pH for BMOQBAs (Top left) and BMQBAs (Top Right) and with 100 mM Glucose (Middle left and Middle right) and 100 mM Fructose (Bottom left and Bottom right) respectively.
The apparent pKa values obtained from the titration curves shown in Figure 15.18 are shown in Table 15.3. We can see considerably reduced pKa values for the new phenylboronic acid containing fluorophores in buffered media, as compared to the typical boronic acid probes reported in the literature [31–36], which are in the range 8–9. For comparison the pKa values for the probes mentioned in Section 15.3 are depicted in Table 15.3. The quaternary nitrogen of the quinolinium nucleus not only reduces the pKa of the probes, but also serves to stabilize the boronatediester, formed upon sugar complexation. This in turn increases the affinity of the probes for sugar as shown in Table 3. Hence the reduced sugar bound pKa of these new probes, coupled with their increased glucose affinity, is most attractive for our glucose sensing contact lens application, noting our previous findings of a lens pH around 6.1 [14].
Table 15.3.
Apparent pKa values for boronic acid probes in buffer and effect of 100 mM sugars.
| Probe | In buffer | +100 mM Glucose | +100 mM Fructose |
|---|---|---|---|
| o-BMOQBA | 7.90 | 6.62 | 4.80 |
| m-BMOQBA | 7.70 | 6.90 | 5.00 |
| p-BMOQBA | 7.90 | 6.90 | 5.45 |
| o-BMQBA | 6.70 | 6.10 | 5.00 |
| m-BMQBA | 7.75 | 6.85 | 5.05 |
| p-BMQBA | 7.80 | 6.95 | 5.45 |
| DSTBA | 9.14a | 8.34 | 6.61 |
| CSTBA | 8.17 | 7.30 | 5.84 |
| DDPBBA | 8.90 | 6.97 | 6.20 |
| Chalc 1 | 7.50 | --- | 5.40 |
| Chalc 2 | 7.50 | --- | 5.20 |
The pKa values for the probes DSTBA, CSTBA, DDPBBA, Chalc 1 and Chalc 2 are from Ref. xx.
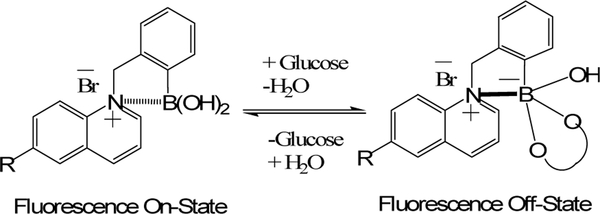
To understand this new fluorescence signaling based mechanism and the response of the probes towards both pH and monosaccharides, it is informative to consider the schematic representation shown in Figure 15.19. The boronic acid group is an electron-deficient Lewis acid having an sp2-hybridized boron atom with a trigonal planar conformation. The anionic form of the boronic acid, formed in high pH solutions, is characterized by a more electron rich sp3-hybridized boron atom with a tetrahedral geometry. The change in the electronic properties and the geometry at the boron atom induces the fluorescence spectral changes of the probes. It is well-known that the quinine/quinoline compounds exhibit high quantum yields in acidic media, from the corresponding quaternized salt [46,47]. Similarly here, the boronic acid probes are more fluorescent in acidic solutions. However, when the pH of the medium is increased the electron density on the boron atom is increased, facilitating the partial neutralization of the positively charged quaternary nitrogen of the quinolinium moiety. We have termed this interaction as a charge neutralization-stabilization mechanism, and a schematic representation of this mechanism with regard to glucose binding / sensing is illustrated in Figure 15.19. In contrast, the control compounds BMQ and BMOQ are unperturbed in the presence of pH or monosaccharides.
Figure 15.19.
A schematic representation of the charge neutralization-stabilization mechanism with regard to glucose sensing. The bold-line between the N+ and boron atom in the structure shown in the right side of the equation indicates the increased interaction between them, and is not intended to show covalent bond formation between the two atoms.
15.5.2. Sugar response of the Quinolinium probes in solution
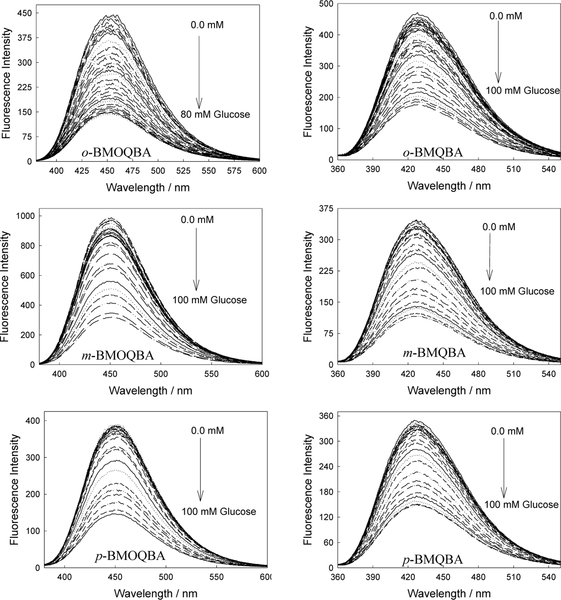
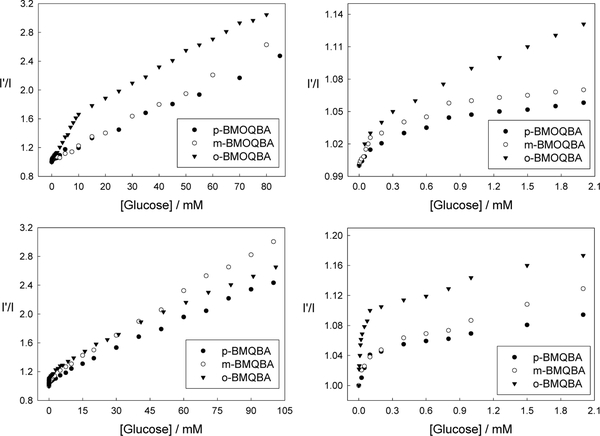
The monosaccharide induced spectral changes of the probes are shown in Figure 15.20. In an analogous manner to that described for increasing pH above, we observed a systematic decrease in fluorescence intensity of the boronic acid containing probes in pH 7.5 phosphate buffer, for increasing glucose concentrations. The corresponding titration curves obtained by plotting I’ divided by I, where I’ and I are fluorescence intensities at 427 nm for BMQBA and 450 nm for BMOQBA, in the absence and presence of sugar respectively, versus glucose concentration, are also shown in Figure 15.21. The right-hand column of Figure 15.21 shows the response of the probes in the tear glucose concentration range.
Figure 15.20.
Emission spectra of BMOQBAs (Left column) and BMQBAs (Right column) in pH 7.5 phosphate buffer with increasing glucose concentration. The λex for BMOQBAs was 345 nm and for BMQBAs 320 nm.
Figure 15.21.
Respective intensity ratio for all three isomers of BMOQBAs in the absence, I’, and in the presence, I, of glucose, (Top left), and in the tear glucose concentration range (Top right). The corresponding plots for BMQBAs are also shown in the blood glucose concentration range and tear glucose concentration range, (Bottom right and Bottom left, respectively).
For the BMOQBA probes we typically see a greater response for the para-isomer, with a 2.4-fold change in signal for 50 mM glucose. Interestingly, a ≈ 13 % change in signal is observed up to 2 mM glucose, noting that glucose levels in tears can change from ≈ 500 μM for a healthy person, and up to 5 mM for diabetics. For ortho-BMQBA, then a ≈16 % change in fluorescence signal can be observed over a similar glucose range. Interestingly, for both classes of probes, the para-isomers show the weakest response towards glucose, Figure 15.21. Given that the through-bond mechanism is expected to be prevalent for the para-isomers, and the ortho-isomer is expected to show both through bound and through space interactions, then a greater response was indeed expected, as is observed, for the ortho-isomer. However, the much weaker response of the para-isomer suggests that steric hindrance, with regard to glucose binding, is not present here.
The dissociation constants of the probes with both glucose and fructose in pH 7.5 phosphate buffer are presented in Table 15.4. As expected, a higher affinity for fructose is observed (lower KD value), which is a general observation for monophenyl boronic acid derivatives [31–36], but it should be noted that the concentration of fructose in tears is substantially lower than for glucose [14–17]. A comparison of the trends in glucose response observed in Figure 15.21, and the recovered KD values in Table 15.4, show some differences, which we have attributed to the difficulties encountered during data fitting. While beyond the scope of this text, these fitting difficulties clearly reflect the need for a new kinetic sugar binding function with our new probes. Further studies are underway in this regard. Based on the data presented here, these probes having lower pKa values, may be useful for the continuous monitoring of glucose using disposable contact lenses.
Table 15.4.
Dissociation constants, Kd (mM), of the probes with glucose and fructose in buffer and in the contact lens.
| Glucose | Fructose | |||
|---|---|---|---|---|
| Probe | Buffer | Lens | Buffer | Lens |
| o-BMOQBA | 49.5 | 322.6 | 0.65 | 84.7 |
| m-BMOQBA | 1000 | 54.6 | 1.8 | 4.9 |
| p-BMOQBA | 430.0 | 111.1 | 9.1 | 34.7 |
| o-BMQBA | 100 | 17.9 | 4.7 | 34.8 |
| m-BMQBA | 476 | 58.1 | 13.2 | 21.6 |
| p-BMQBA | 370 | 128.2 | 13.8 | 12.9 |
15.5.3. Response of the new Glucose Signaling Probes in the Contact Lens
Doped contact lenses, which were previously washed and allowed to leach dye for 1 hour were tested with both glucose and fructose. Buffered solutions of sugars were added to the lens, pH 7.5 phosphate buffer, in an analogous manner to ocular conditions. Fluorescence spectra were typically taken 15 mins after each sugar addition to allow the lens to reach equilibrium. The 90 % response time, the time for the fluorescence signal to change by 90 % of the initial value, was ≈ 10 minutes.
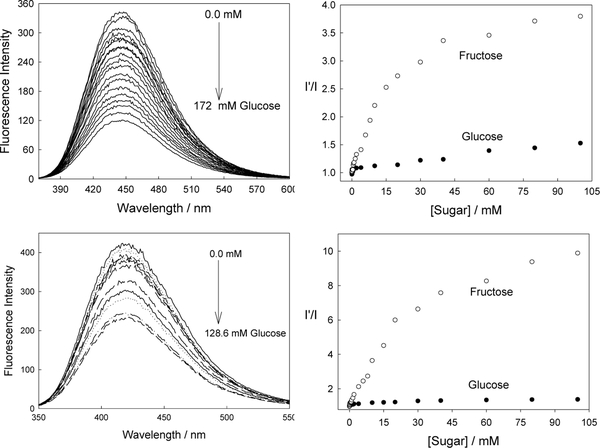
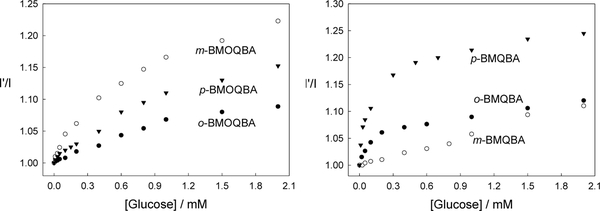
Figure 15.22 shows the response of o-BMOQBA and o-BMQBA, Top and Bottom left respectively, for increasing concentrations of glucose injected into the 1.5 cm3 contact lens volume. Similar to the solution based measurements, the probes show a decrease in fluorescence intensity, which we attribute to the complexation of glucose with boronic acid and the subsequent charge neutralization mechanism described earlier. We were again able to construct the I’/I plots, where I’ is the intensity in the absence of sugar, Figure 15.22 Right. As was observed in solution, Fructose had a greater response, reflecting the greater affinity of mono phenyl boronic acid derivatives for fructose. However, in the low sugar concentration ranges, < 2 mM sugar, the response towards both sugars was comparable [15–17]. Differences in the response towards glucose for the isomers could also be observed in the lenses, Figure 15.23, where m-BMOQBA was found to have the greatest response amongst this class of probes. From Figure 15.23 we can clearly see a greater response in the lens towards sugars than in our solution based studies at pH 7.5, with p-BMQBA showing a greater than 20 % fluorescence signal change with as little as 2 mM glucose. This wasn’t unexpected, and is simply explained by the pKa of the probes being < 7, the probes being compatible with the mildly acidic lens environment. The dissociation constants (KD) obtained for all six probes with glucose and fructose within the contact lens are shown in Table 15.4. As seen from the table, the affinity of the probes towards sugar is relatively less in the contact lens, and that may be due to the nonbufferable pH as mentioned earlier in Section 15.3.
Figure 15.22.
The emission spectra of an o-BMOQBA and o-BMQBA doped contact lens in the presence of increasing glucose concentrations (Top left and Bottom Left, respectively). λex = 345 nm for o-BMOQBA and 320 nm for o-BMQBA. The corresponding emission intensity ratio at band maximum for o-BMOQBA and o-BMQBA doped contact lens in the absence, I’, and presence, I, of both Glucose and Fructose (Top right and Bottom right, respectively).
Figure 15.23.
The response of BMOQBAs (Left) and BMQBAs (Right) in the contact lens and in the tear glucose concentration range.
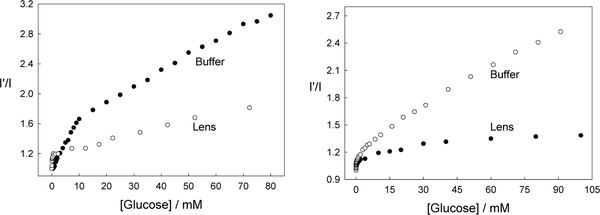
Figure 15.24 directly compares the response of the probes in both the contact lens and buffer, where we can see a comparable if not better response towards glucose in the lens in the low concentration range of sugar. However, in the high concentration range, the probe doped contact lens shows a smaller response towards sugar, and we are uncertain at this time but we speculate that the binding efficiency of the probes or the local environment such as pH and polarity of the lens still play a role on the binding interaction of the probes. Also, the probe location in the contact lens, glucose diffusion, and probe leaching from the lens may well complicate the sensing response of the probes from within the contact lens as evident from the I’ /I Vs [sugar] plots. In this regard, the response of doped lenses also shows complex behavior towards mM fructose concentrations, with much simpler kinetics observed in the tear glucose concentration range (data not shown).
Figure 15.24.
A comparison of the emission intensity ratio for the o-BMOQBA doped contact lens with that obtained in pH 7.5 phosphate buffer, in the absence, I’, and presence, I, of Glucose (Left) and the corresponding plot for o-BMQBA (Right).
For all our glucose contact lens sensing studies we repeated these doped lens experiments several times, and in all cases the trends were reproducible. It is difficult to assess the effect of the PVA hydroxyl groups of the contact lens polymer on the response of boronic acid to sugar, but our studies with solutions of glycerol indicated that sugar had much higher binding affinities than glycerol hydroxyl groups. We therefore speculate that sugars will preferentially bind boronic acid groups in the PVA lens polymer. In any event the boronic acid probes function well (reversibly) towards sugars in the lens, in what is likely to be an environment saturated with PVA hydroxyl groups.
15.6. PROBE LEACHING, INTERFERENTS AND SHELF LIFE
Leaching studies of the probes from the contact lens polymer were undertaken using the lens holder shown in Figure 15.7, which contained ≈ 1.5 cm3 buffer at 200 C. A Varian fluorometer measured the intensity change as a function of time to determine the percentage signal change, corresponding to dye leaching. It should be noted that with no sample present, no intensity fluctuations or drifts were observed, indicating stability of the fluorometer Xenon-arc source.
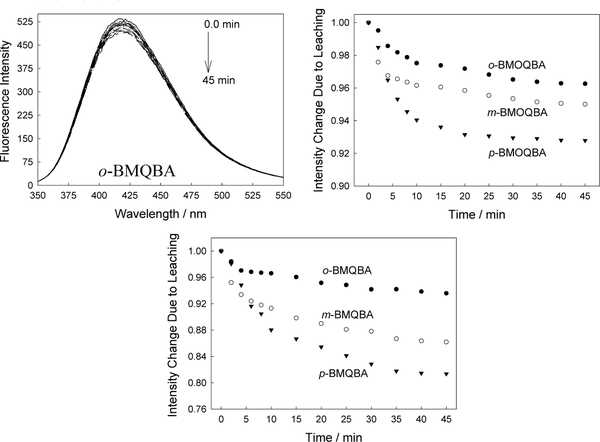
We were able to observe up to about 8 % change in fluorescence intensity, attributed due to dye leaching, for the BMOQBA class of probes, with very little change after about 25 minutes, Figure 15.25. In contrast, the BMQBA probes show a much greater extent of leaching over the same time period and under identical conditions. Given that the BMQBA probes typically showed a greater response towards glucose in the lens, then this suggests that the BMQBA probes may be more accessible in the lens, than the BMOQBA probes. In addition, similar results were obtained at 380C but with a different leaching rate.
Figure 15.25.
Emission spectra of o-BMQBA doped contact lens immersed in pH 7.5 buffer with time (Top left). λex = 320 nm. Normalized intensity change at band maximum of BMOQBA with time due to leaching (Top right), and that for the BMQBAs (Bottom).
In all our lens response studies described here, lenses were pre-leached to a steady-state fluorescence intensity before use. After glucose measurements were undertaken the outer lens fluid volume surrounding the contact lens was found to be non-fluorescent indicating that dye had not leached from the lens during actual glucose sensing measurements. It should be noted that while chemistries are available to covalently label our probes within the contact lens polymer, which would eliminate any leaching, it is an important design concern for our approach that the lenses remain unmodified, so that their physiological characteristics and compatibilities remain unchanged. In fact our approach is targeted at reducing future lens redesign costs for industry, by using simple probe doping.
As with all sensors it is important to consider the effects of potential interferents and sensor shelf-life on the working response of the device. Throughout much of this paper we have shown the response of the probes towards fructose, primarily because of its well-known greater affinity for the boronic acid moiety [31–36]. However, the concentration of fructose in blood is ≈ 10 times lower than glucose [14], a relationship which is also thought to occur in tears [14]. Hence fructose is not thought to be a major interferent in tears, simply shown here to place the binding trends in context. However, tears are a complex mixture of proteins and other analtyes, such as sodium (120–170 mM), potassium (6–26 mM) and chloride (100 mM) [50]. We subsequently tested these new contact lens probes with various aqueous halides, given that Na+ and K+ are unlikely to perturb our fluorophores, Table 15.5. As expected, the BMOQBA probes are modestly quenched by chloride, with steady-state Stern-Volmer constants in the range 170–182 M−1 the BMQBA probes having significantly smaller quenching constants in the range 17–44 M−1. This result is simply explained by the shorter lifetime of the BMQBA probes as compared to the BMOQBA probes, and the probability of an excited-state chloride ion encounter [41,45]. Encouragingly, the BMQBA probes typically showed a greater response towards glucose, as well as being the least perturbed by aqueous chloride. In any event, simple corrections in the fluorescence signal can readily account for chloride interference on the glucose response. This is shown in Figure 15.1. Sensors spots on the surface of the lens could contain a reference chloride compound or indeed another probe sensitive to both glucose and chloride. By employing the extended Stern-Volmer equation for multiple analytes [45], one can easily correct for background interferences.
Table 15.5.
Stern-Volmer (KSV, M−1) constants of the probes with halides in water.
| Probe | Cl− | Br− | I− |
|---|---|---|---|
| o-BMOQBA | 170 | 332a | 471a |
| m-BMOQBA | 182 | 413 | 540 |
| p-BMOQBA | 177 | 370 | 595 |
| BMOQ | 222 | 384 | 520 |
| o-BMQBA | 44.0 | 55.0 | 97.0 |
| m-BMQBA | 20.0 | 32.0 | 48.0 |
| p-BMQBA | 17.0 | 26.5 | 42.0 |
| BMQ | 35.0 | 55.0 | 71.0 |
The concentrations of Br− and I− in tears is extremely low and is unlikely to be an interferent in our glucose measurements.
It is also informative to consider the pH of tears as a potential interferent, given the response of these probes to pH as shown in Figure 15.8. It is known that unstimulated tear pH levels can vary in the range 7.14 – 7.82 measured from healthy subjects at different times of the day, with a typical mean value around pH 7.45 [50]. However, a more acidic pH of less than 7.3 is found following prolonged lid closure, e.g. after sleep, which is thought to result from carbon dioxide produced by the cornea and trapped in the tear pool under the eye lids. While solutions of these new probes would be susceptible to these changes in pH, we have found that the doped lenses we studied were indeed unbufferable, hence external changes in pH are most unlikely to affect the glucose response
With regard to the glucose-sensing contact lens shelf-life, lenses that had been doped, leached and stored for several months both wet and dry, gave identical sugar sensing results, indicating no lens polymer – fluorophore interactions over this time period, or indeed probe degradation.
15.7. FUTURE DEVELOPMENTS BASED ON THIS TECHNOLOGY
15.7.1. Continuous and Non-invasive Glucose Monitoring
In this chapter, we have shown that fluorescent probes can be fabricated to be compatible with in the commercially available daily use disposable contact lenses, which have already been assessed and optimized with regard to vision correction and oxygen permeability. This has enabled the first prototype based on this new approach to be realized. With regard to glucose monitoring by this approach, we speculate on several future improvements to this technology:
• Clear or Colored Contact Lenses
Many boronic containing fluorophores have a visible absorption [31–36], which apart from their lack of glucose sensitivity in the lens as discussed earlier [14], would introduce color into a doped lens. While colored lenses are attractive to a few people as sports or even fashion accessories, the majority of contact lenses worn today are clear, hence our colorless lenses described here are ideal in this regard. One disadvantage however with our lenses is the requirement for an excitation and detection device as shown in Figure 15.1. One improvement to our technology could be the use of colored contact lenses, which change color due to the concentration of tear and therefore blood glucose. This can be achieved by the ground-state binding of glucose to boronic acid and the subsequent changes in fluorophore absorption spectrum. A patient wearing the lenses could simply look in the mirror, or the color even determined by an on-looker, and compared to a precalibrated color strip, one could assess the extent of hyperglycemia. This technology would be most attractive to parents of young diabetic children or for care workers of the elderly. Work in currently underway in our laboratories in this regard.
• Sensor Spots or Doped Lenses
As briefly mentioned earlier and shown in Figure 15.1, sensor spots on the surface of contact lenses could correct signal responses for interferents such as aqueous chloride. Indeed the spots could either be visible to the wearer (self-readout) or readable by an external monitoring device.
• Detection Methods
While simple colorimetric methods are likely to be the most simple to introduce to the market place, other fluorescence sensing methodologies, such as polarization, lifetime and ratiometric sensing, offer many spectroscopic sensing advantages over the simple intensity measurements described for our lenses [41]. For example, fluorescence lifetime and ratiometric measurements are independent on total light intensity or indeed fluctuations in ambient room light.
15.7.2. Clinical Condition and Diagnosis from Tears
Given that tear glucose can be continuously and non-invasively monitored using our lens approach, then it may be possible for both clinical condition assessment and disease diagnosis using the contact lens sensing platform, and suitably designed fluorophores. In fact, as compared to saliva, tears represent a more stable body fluid of low protein concentration and with only modest variations in pH.
For example, for clinical condition assessment, Na+, K+, Ca2+, Mg2+, pH, Histamine, Urea, Lactate, Cholesterol and Glucose in tears are known to directly track or relate to the serum levels [50]. Indeed, one could potentially even track body core temperature using thermochromic type probes [51], embedded within contact lenses or even sensor spots.
For disease diagnosis, the possibility of diagnosing; Glaucoma, Sjogrens disease, Lysosomal storage diseases, corneal ulceration and bacterial infections could be realized by designing lenses to detect; Catecholamines, Lysozyme, Lysosomal enzymes, Collagenase and α-Antitrypsin respectively. It is possible that many other clinical conditions and diseases could also be either monitored or diagnosed via this approach, although relatively little tear biochemistry is known [50].
15.7.3. Drug Testing, Compliance and Screening
Saliva is and has been used for therapeutic drug monitoring, by predicting the free fraction of drugs in blood from that determined in saliva. Changes in the free drug levels can have important clinical consequences, since either toxic or sub-therapeutic levels may exist, even when the total drug concentration is in the normal range. Coupled with the fact that saliva concentrations varying greatly in both pH and composition, obviates the need for a novel clinical sensing platform for drug testing, compliance and screening. As mentioned earlier, tear fluid has a relatively lower protein concentration with only slight changes in pH, where the passage of drugs from plasma to tears takes place by diffusion of the non-protein bound fraction [50]. Subsequently, tears have already been used to assess the concentration of antibiotics such as Ampicillin and the Anticonvulsants, Phenobarbital and Carbamazepine [50]. However, these drug concentration measurements are inherently difficult due to the 5 −10 μL total tear volume to be sampled [50]. Indeed, while tear glucose levels have been known to be elevated during hyperglycemia for nearly 70 years, it is the difficulties associated with tear collection, which has limited the practical use of tears for diabetes mellitus assessment. However, similar to our glucose sensing contact lenses, it may be possible to develop lenses for drug testing, based on either colorimetric or other fluorescence spectroscopic based methodologies.
15.8. CONCLUDING REMARKS
We have developed a range of new glucose sensing contact lenses, by doping strategically designed fluorescent probes into commercially available contact lenses. The probes are completely compatible with the new lenses and can readily detect glucose changes up to several mM glucose, appropriate for the tear glucose concentration range for diabetics, i.e. ≈ 500 μM → 5 mM [14].
The lenses have a 90 % response time of about 10 minutes, allowing the continuous and noninvasive monitoring of ocular glucose. This is a significant improvement over enzymatic methods based on blood sampling by finger pricking, with many diabetics begrudgingly testing between 4 and 6 times daily.
With diabetes being widely recognized as one of the leading causes of death and disability in the western world, we believe our boronic acid doped contact lens approach and findings, are a notable step forward towards the continuous and non-invasive monitoring of physiological glucose.
15.9. ACKNOWLEDGEMENTS
The authors would like to thank the University of Maryland Biotechnology Institute and the NIH, National Center for Research Resources, RR-08119, for financial support.
Footnotes
The term “Diabetes” was first used around 230 BC by Apollonius of Mephis, which in Greek means “to pass through” (Dia – through, betes – to go) [1].
15.10. REFERENCES
- 1.Principles of Diabetes Mellitus, edited by Poretsky Leonid, Kluwer Academic Plenum Publishers, Norwell Massachusetts, USA, 2002. [Google Scholar]
- 2.Medvei VC, The 18th Century and the beginning of the 19th Century, In: The history of clinical endocrinology: a comprehensive account of endocrinology from earliest times to present day, Parthenon Publishing, New York, 1993. [Google Scholar]
- 3.Robinson MR, Eaton RP, Haaland DM, Koepp GW, Thomas EV, Stallard BR and Robinson PL (1992). Non-invasive glucose monitoring in diabetic patients: A preliminary evaluation, Clin. Chem. 38, 1618–1622. [PubMed] [Google Scholar]
- 4.Heise HM, Marbach R, Koschinsky TH, and Gries FA (1994). Non-invasive blood glucose sensors based on near-infrared spectroscopy, Ann. Occup. Hyg., 18, 439–447. [DOI] [PubMed] [Google Scholar]
- 5.March WF, Rabinovitch B, Adams R, Wise JR and Melton M (1982). Ocular Glucose sensor, Trans. Am. Soc. Artif. Intern. Organs, 28, 232–235. [PubMed] [Google Scholar]
- 6.Rabinovitch B, March WF and Adams RL (1982). Non-invasive glucose monitoring of the aqueous humor of the eye, Part 1, Measurement of very small optical rotations, Diabetes Care, 5, 254–258. [DOI] [PubMed] [Google Scholar]
- 7.Schier GM, Moses RG, Gan IET, and Blair SC (1988). An evaluation and comparison of reflolux Iiand Glucometer II, two new portable reflectance meters for capillary blood glucose determination, Diabetes Res. Clin. Pract, 4,177–181. [DOI] [PubMed] [Google Scholar]
- 8.Clarke W, Becker DJ, Cox D, Santiago JV, White NH, Betschart J, Eckenrode K, Levandoski LA, Prusinki EA, Simineiro LM, Snyder AL, Tideman AM and Yaegar T (1988). Evaluation of a new system for self blood glucose monitoring, Diabetes Res. Clin. Pract, 4, 209–214. [DOI] [PubMed] [Google Scholar]
- 9.Trettnak W and Wolfbeis OS (1989). Fully reversible fiber-optic glucose biosensor based on the intrinsic fluorescence of glucose-oxidase, Anal. Chim. Acta, 221,195–203. [Google Scholar]
- 10.Meadows D and Schultz JS (1988). Fiber optic biosensor based on fluorescence energy transfer, Talanta, 35, 145–150. [DOI] [PubMed] [Google Scholar]
- 11.Tolosa L, Malak H, Rao G, and Lakowicz JR (1997). Optical assay for glucose based on the luminescence decay time of the long wavelength dye Cy5, Sensors Actuators B., 45, 93–99. [DOI] [PMC free article] [PubMed] [Google Scholar]
- 12.Tolosa L, Gryczynski I, Eichorn LR, Dattelbaum JD, Castellano FN, Rao G and Lakowicz JR (1999). Glucose sensors for low cost lifetime-based sensing using a genetically engineered protein, Anal. Biochem, 267,114–120. [DOI] [PMC free article] [PubMed] [Google Scholar]
- 13.D’Auria S, Dicesare N, Gryczynski Z, Gryczynski I, Rossi M and Lakowicz JR (2000). A thermophilic apoglucose dehydrogenase as a nonconsuming glucose sensor, Biochem. Biophys Res. Commun, 274, 727–731. [DOI] [PubMed] [Google Scholar]
- 14.Badugu R, Lakowicz JR, and Geddes CD (2004). The non-invasive continuous monitoring of physiological glucose using a novel monosaccharide-sensing contact lens, Anal. Chem, 76, 610–618. [DOI] [PMC free article] [PubMed] [Google Scholar]
- 15.Badugu R, Lakowicz JR, and Geddes CD (2003). A Glucose Sensing Contact Lens: A Non-Invasive Technique for Continuous Physiological Glucose Monitoring, J. Fluorescence, 13, 371–374. [DOI] [PMC free article] [PubMed] [Google Scholar]
- 16.Geddes CD Badugu R, and Lakowicz JR, (2004). Contact lenses may provide window to blood glucose, Biophotoincs international, February (2), 50–53. [Google Scholar]
- 17.Badugu R, Lakowicz JR, and Geddes CD (2004). Ophthalmic glucose sensing: A novel monosaccharide sensing disposable and colorless contact lens, The Analyst, 129, 516–521 [DOI] [PMC free article] [PubMed] [Google Scholar]
- 18.Sugihara JM and Bowman CM (1958). Cyclic Benzeneboronate Esters, J. Am. Chem. Soc, 80(10), 2443–2446. [Google Scholar]
- 19.Lorand JP and Edwards JO (1959). Polyol Complexes and Structure of the Benzeneboronate Ion, J. Org. Chem, 24(6), 769–774. [Google Scholar]
- 20.Springsteen G and Wang B (2002). A detailed examination of boronic acid-diol complexation Tetrahedron, 58(26), 5291–5300. [Google Scholar]
- 21.James TD, Sandanayake KRAS and Shinkai S, (1995). Chiral discrimination of monosaccharides using a fluorescent molecular sensor, Nature, 374, 345. [Google Scholar]
- 22.Norrild JC and Eggert H (1995). Evidence for monodentate and bidentate boronate complexes of glucose in the furanose form – application of (1)J(C-C)-coupling-constants as a structural probe, J. Am. Chem. Soc, 117(5), 1479–1484. [Google Scholar]
- 23.Eggert H, Frederiksen J, Morin C and Norrild JC (1999). A new glucose-selective fluorescent bisboronic acid. First report of strong alpha-furanose complexation in aqueous solution at physiological pH, J. Org. Chem, 64(11), 3846–3852. [Google Scholar]
- 24.Yang W, He H, Drueckhammer DG (2001). Computer-guided design in molecular recognition: Design and synthesis of a glucopyranose receptor, Angew. Chem. Int. Ed, 40(9), 1714–1718. [PubMed] [Google Scholar]
- 25.Wang W, Gao S, and Wang B (1999). Building Fluorescent Sensors by Template Polymerization: The Preparation of a Fluorescent Sensor for D-Fructose, Org. Letts, 1(8) 1209–1212. [DOI] [PubMed] [Google Scholar]
- 26.Gao S, Wang W and Wang B (2001). Building Fluorescent Sensors for Carbohydrates Using Template-Directed Polymerizations, Bioorg. Chem, 29, 308–320. [DOI] [PubMed] [Google Scholar]
- 27.Lavigne JJ, Anslyn EV (1999). Teaching Old Indicators New Tricks: A Colorimetric Chemosensing Ensemble for Tartrate/Malate in Beverages, Angew. Chem. Int. Ed, 38(24), 3666–3669. [PubMed] [Google Scholar]
- 28.Yoon J and Czarnik AW (1992). Fluorescent chemosensors of carbohydrates. A means of chemically communicating the binding of polyols in water based on chelation-enhanced quenching, J. Am. Chem. Soc, 114, 5874–5875. [Google Scholar]
- 29.Smith BD, Gardiner SJ, Munro TA, Paugam MF and Riggs JA (1998). Facilitated transport of carbohydrates, catecholamines, and amino acids through liquid and plasticized organic membranes, J. Incl. Phenom. Mol. Recogn. Chem. 32, 121–131. [Google Scholar]
- 30.Soundararajan S, Badawi M, Kohlrust CM, Hagerman JH (1989).Boronic acids for affinity – chromatography – spectral methods for determinations of ionization and diol-binding constants, Anal. Biochem, 178, 125–134. [DOI] [PubMed] [Google Scholar]
- 31.James TD, S KRA, and Shinkai S (1994). A glucose-selective molecular fluorescence sensor, Angew, Chem. Int. Ed, 33(21), 2207–2209. [Google Scholar]
- 32.James TD, Sandanayake KRAS, Iguchi R, and Shinkai S (1995). Novel saccharide-photoinduced electron-transfer sensors based on the interaction of boronic acid and amine, J. Am. Chem. Soc, 117(35), 8982–8987. [Google Scholar]
- 33.Dicesare N and Lakowicz JR (2001). Evaluation of two synthetic glucose probes for fluorescence-lifetime based sensing, Anal. Biochem, 294, 154–160. [DOI] [PMC free article] [PubMed] [Google Scholar]
- 34.Dicesare N and Lakowicz JR (2001). Wavelength-ratiometric probes for saccharides based on donor-acceptor diphenylpolyenes, J. Photochem. Photobiol. A: Chem., 143, 39–47. [DOI] [PMC free article] [PubMed] [Google Scholar]
- 35.Dicesare N and Lakowicz JR (2001). New color chemosensors for monosaccharides based on Azo dyes, Org. Lett, 3(24), 3891–3893. [DOI] [PMC free article] [PubMed] [Google Scholar]
- 36.Dicesare N and Lakowicz JR (2002). Chalcone-analogue fluorescent probes for saccharides signaling using the boronic acid group, Tet. Lett, 43, 2615–2618. [DOI] [PMC free article] [PubMed] [Google Scholar]
- 37.Karnati VV, Gao X, Gao S, Yang W, Ni W, Sankar S and Wang B (2002). A glucose-selective fluorescence sensor based on boronic acid-diol recognition, Bioorg. Med. Chem. Lett, 12, 3373–3377. [DOI] [PubMed] [Google Scholar]
- 38.Dicesare N and Lakowicz JR (2002). Charge transfer fluorescent probes using boronic acids for monosaccharide signaling, J. Biomedical Optics, 7(4), 538–545. [DOI] [PMC free article] [PubMed] [Google Scholar]
- 39.Badugu R, Lakowicz JR, Geddes CD (2004). Fluorescence Sensors for Monosaccharides Based on the 6-Methylquinolinium Nucleus and Boronic Acid Moiety: Application to Ophthalmic Diagnostics., Talanta, - In press. [DOI] [PMC free article] [PubMed] [Google Scholar]
- 40.Badugu R, Lakowicz JR, Geddes CD (2004). Boronic acid fluorescent sensors for monosaccharide signaling based on the 6-methoxyquinolinium heterocyclic nucleus: Progress towards noninvasive and continuous glucose monitoring, Bioorg. Med. Chem. Manuscript Submitted. [DOI] [PMC free article] [PubMed] [Google Scholar]
- 41.Lakowicz JR, Principles of Fluorescence Spectroscopy, 2nd Edition, Kluwer/Academic Plenum Publishers, New York, 1997. [Google Scholar]
- 42.Turro NJ, Baretz BH and Kuo PI (1984). Photo luminescence probes for the investigation of interactions between sodium dodecylsulfate and water-soluble polymers, Macromolecules, 17(7), 1321–1324. [Google Scholar]
- 43.Kalyanasundaram K and Thomas JK (1977). Environmental effects on vibronic band intensities in pyrene monomer fluorescence and their application in studies of micellar systems, J. Am. Chem. Soc, 99(7), 2039–2044. [Google Scholar]
- 44.Dicesare N, Lakowicz JR (2001). Spectral properties of fluorophores combining the boronic acid group with electron donor or withdrawing groups. Implication in the development of fluorescence probes for saccharides, J. Phys. Chem. A, 105(28), 6834–6840. [DOI] [PMC free article] [PubMed] [Google Scholar]
- 45.Geddes CD (2001). Optical halide sensing using fluorescence quenching: theory, simulations and applications-a review, Meas. Sci. and Tech, 12(9), R53. [Google Scholar]
- 46.Wolfbeis OS, Urbano E (1982). J. Heterocyclic Chem, 19, 841–843. [Google Scholar]
- 47.Geddes CD, Apperson K, Karolin J, Birch DJS (2001). Chloride sensitive probes for biological applications, Dyes & Pigments, 48, 227–231. [Google Scholar]
- 48.Fox MA, Chanon M, Eds. Photoinduced Electron Transfer; Elsevier: New York, 1998, Parts A-D. [Google Scholar]
- 49.Kavarnos GJ, Fundamentals of Photoinduced Electron Transfer; VCH: New York, 1993. [Google Scholar]
- 50.Van Haeringen NJ (1981). Climical Biochemistry in Tears, Survey of Ophthalmology, 26 (2), 84–96, [DOI] [PubMed] [Google Scholar]
- 51.Chandrasekharan N and Kelly L, Progress towards fluorescent molecular thermometers, in Reviews in Fluorescence 2003, edited by Geddes CD and Lakowicz JR, Kluwer Academic Plenum Publishers, New York, 2004. [Google Scholar]


