

Abstract
Background
Relapse (the re‐emergence of depressive symptoms after some level of improvement but preceding recovery) and recurrence (onset of a new depressive episode after recovery) are common in depression, lead to worse outcomes and quality of life for patients and exert a high economic cost on society. Outcomes can be predicted by using multivariable prognostic models, which use information about several predictors to produce an individualised risk estimate. The ability to accurately predict relapse or recurrence while patients are well (in remission) would allow the identification of high‐risk individuals and may improve overall treatment outcomes for patients by enabling more efficient allocation of interventions to prevent relapse and recurrence.
Objectives
To summarise the predictive performance of prognostic models developed to predict the risk of relapse, recurrence, sustained remission or recovery in adults with major depressive disorder who meet criteria for remission or recovery.
Search methods
We searched the Cochrane Library (current issue); Ovid MEDLINE (1946 onwards); Ovid Embase (1980 onwards); Ovid PsycINFO (1806 onwards); and Web of Science (1900 onwards) up to May 2020. We also searched sources of grey literature, screened the reference lists of included studies and performed a forward citation search. There were no restrictions applied to the searches by date, language or publication status .
Selection criteria
We included development and external validation (testing model performance in data separate from the development data) studies of any multivariable prognostic models (including two or more predictors) to predict relapse, recurrence, sustained remission, or recovery in adults (aged 18 years and over) with remitted depression, in any clinical setting. We included all study designs and accepted all definitions of relapse, recurrence and other related outcomes. We did not specify a comparator prognostic model.
Data collection and analysis
Two review authors independently screened references; extracted data (using a template based on the CHecklist for critical Appraisal and data extraction for systematic Reviews of prediction Modelling Studies (CHARMS)); and assessed risks of bias of included studies (using the Prediction model Risk Of Bias ASsessment Tool (PROBAST)). We referred any disagreements to a third independent review author. Where we found sufficient (10 or more) external validation studies of an individual model, we planned to perform a meta‐analysis of its predictive performance, specifically with respect to its calibration (how well the predicted probabilities match the observed proportions of individuals that experience the outcome) and discrimination (the ability of the model to differentiate between those with and without the outcome). Recommendations could not be qualified using the GRADE system, as guidance is not yet available for prognostic model reviews.
Main results
We identified 11 eligible prognostic model studies (10 unique prognostic models). Seven were model development studies; three were model development and external validation studies; and one was an external validation‐only study. Multiple estimates of performance measures were not available for any of the models and, meta‐analysis was therefore not possible. Ten out of the 11 included studies were assessed as being at high overall risk of bias. Common weaknesses included insufficient sample size, inappropriate handling of missing data and lack of information about discrimination and calibration. One paper (Klein 2018) was at low overall risk of bias and presented a prognostic model including the following predictors: number of previous depressive episodes, residual depressive symptoms and severity of the last depressive episode. The external predictive performance of this model was poor (C‐statistic 0.59; calibration slope 0.56; confidence intervals not reported). None of the identified studies examined the clinical utility (net benefit) of the developed model.
Authors' conclusions
Of the 10 prognostic models identified (across 11 studies), only four underwent external validation. Most of the studies (n = 10) were assessed as being at high overall risk of bias, and the one study that was at low risk of bias presented a model with poor predictive performance. There is a need for improved prognostic research in this clinical area, with future studies conforming to current best practice recommendations for prognostic model development/validation and reporting findings in line with the Transparent Reporting of a multivariable prediction model for Individual Prognosis Or Diagnosis (TRIPOD) statement.
Keywords: Humans; Bias; Depressive Disorder, Major; Models, Theoretical; Multivariate Analysis; Prognosis; Recurrence; Reproducibility of Results
Plain language summary
Predicting relapse or recurrence of depression
What is the aim of this review?
Relapse and recurrence (becoming unwell again after making an improvement) are common in depression and lead to increased disability and decreased quality of life for patients. Relapse is a re‐emergence of the initial episode of depression after some initial improvement, whereas recurrence is the onset of a new episode of depression after recovery. Outcomes, such as relapse and recurrence, can sometimes be predicted while people are well, using information available at the time. A mathematical calculation can be performed to assess an individual person's risk; this calculation is known as a 'prognostic model' or a prediction tool. In most health services, including the National Health Service (NHS) in the UK, resources such as doctors and therapists need to be used in the best way possible, for the people who will gain the most benefit from them. If accurate prediction tools are available, the information can be used to identify the most 'high risk' patients and make sure they receive additional support to try to prevent a relapse or a recurrence.
The aim of this review was to identify studies that have attempted to develop a prediction tool for relapse or recurrence of depression in adults. We were interested in studies that had attempted to make this prediction while patients were well. We also included tools that predicted the chance of patients staying well. If we had found multiple studies that tested the same prediction tool, we planned to combine these to work out a better summary of how well that tool worked.
Key messages
We identified 10 prediction tools (over 11 studies) for relapse or recurrence. These were either not proven to be good at predicting relapse/recurrence, or the studies had problems with how they were carried out, meaning that none of the prediction tools were at a stage where they could be used in the real world. Further work is needed to improve prediction of relapse or recurrence of depression.
What was studied in the review?
We collected and analysed the results of 11 relevant studies. We were interested in several things: how researchers had defined relapse and recurrence (for example, whether they had used clinical interviews or self‐report questionnaires to diagnose depressive symptoms); what information was gathered to help make predictions; the techniques used by the researchers to help develop the tools; and how well the tools predicted. We were also interested in whether the tools were tested in a separate group of participants, which is essential to ensure that the model can predict accurately in patients in the real world.
Finally, we assessed the studies to determine how confident we could be in the results, given the approaches taken by researchers (this is called 'risk of bias') and how relevant the studies were to our review (this is called 'applicability').
What are the main results of the review?
We found 11 studies. Ten of these developed different models and one study tested one of the models developed in a previous study. It was not possible to combine results for any particular tool.
Ten of the 11 studies were rated at high risk of bias. This means that we cannot be confident in the results that were presented, due to some issues with the way the studies were conducted. The most common issue was that there were not enough participants included in the studies. Other common problems involved the statistical approaches used by the researchers.
One study was at low overall risk of bias, which means that we can be more confident in trusting the results. However, this tool did not make accurate predictions about relapse or recurrence.
We found no studies that could be used in clinical practice; further work is needed to develop tools for predicting relapse or recurrence of depression.
How up‐to‐date is the review?
The literature search for this review was completed in May 2020.
Background
Description of the condition
Depression is the leading cause of disability worldwide (WHO 2018). After a first episode of depression, approximately half of patients will experience a relapse or a recurrence, and those who experience a relapse or recurrence are more likely to relapse again in future compared with those who do not (Burcusa 2007). Relapse in the context of depression has been defined as the re‐emergence of depressive symptoms following some level of remission but preceding recovery, and is distinguished in the literature from recurrence (the onset of a new episode of depression following an extended period of remission) (Beshai 2011). Remission and recovery are similarly differentiated, with remission meaning asymptomatic but still ‘in episode’ and recovery being defined as resolution of the underlying episode (usually after 6 to 12 months) (Bockting 2015). ‘Response’ is often used to describe some improvement but not fully well (i.e. not yet achieving remission). The precise temporal cut‐offs of these terms have not been robustly validated empirically and are inconsistently operationalised in the scientific literature (Buckman 2018). However, a recent study found that, of those who do experience a relapse or recurrence, most do so within the first six months (Ali 2017). This review focuses on major depressive disorder (defined using validated diagnostic criteria) and those participants who meet criteria for remission or recovery (i.e. not meeting diagnostic criteria for major depressive episode) at the point of prediction.
Description of the prognostic models
Prognosis refers to future outcomes given a particular baseline condition or disease. The Prognosis Research Strategy (PROGRESS) framework was developed in 2013 (Hemingway 2013), and describes four main categories of prognosis research: overall prognosis; prognostic factor research; prognostic model research; and predictors of treatment effect. This review focuses on prognostic model research (Riley 2019a). A prognostic factor is a variable that is associated with an increased risk of a future outcome. A multivariable prognostic model is a way (usually a mathematical equation) of combining information about multiple prognostic factors (hence multivariable) to produce an estimate of an individual’s risk of developing a particular outcome in the future (Riley 2019a). A recent systematic review of prognostic factors found that the strongest prognostic factors associated with increased risk of relapse and recurrence of depression are childhood maltreatment, history of recurrent depression and presence of residual depressive symptoms (Buckman 2018). Comorbid anxiety (anxiety which is present at the same time as depression), rumination (the tendency towards excessive, repetitive thoughts which interferes with other mental processing), neuroticism and a younger age of onset have also been associated with increased risk of relapse or recurrence (Buckman 2018).
We described the terms remission and recovery above. Sustained remission can be thought of as the inverse, or opposite, of relapse; and recovery as the inverse of recurrence. Both of these hold potentially valuable prognostic information pertinent to relapse risk prediction models in depression. We therefore reviewed the predictive performance, type of model, included predictors and clinical utility of all multivariable prognostic models developed to predict relapse, recurrence, sustained remission or recovery of remitted depression. The starting point of prediction is when a person with depression has responded to treatment and meets criteria for remission. The included models had to have been developed with the intention of providing individualised risk predictions (binary or time‐to‐event outcomes) and we excluded papers reporting multivariable models not intended for this purpose. We also planned to include models predicting outcomes on a continuous scale if these had been identified, provided they met the other inclusion criteria (i.e. remitted major depressive disorder at start‐point).
Health outcomes
This review focuses on outcomes for adults only (those aged 18 years and above). The health outcomes of interest are relapse or recurrence of depression, and sustained remission or recovery from depression, all as defined by authors of individual studies.
Why it is important to do this review
There is evidence to suggest that relapse or recurrence of depression results in an increased risk of subsequent relapse (Burcusa 2007) and, possibly, increased treatment resistance (Post 1992), and so there are potential benefits of intervening to prevent relapse from occurring. Reliable prediction of individuals’ risk of relapse and recurrence might enable more efficient allocation, in practice, of interventions to prevent relapse. While a single prognostic factor can help refine the estimate of overall prognosis to particular subgroups, combining several prognostic factors within the same model usually results in better individualised risk predictions (Riley 2019a). A systematic review of existing prognostic models for the intended population, outcome and setting and their performance is a recommended first step before considering the development of a novel prognostic model. If an existing model performs satisfactorily, adjusting this for the intended population (recalibration) and externally validating the model is likely to be a better use of resources than developing a model from the beginning (Riley 2019a).
The predictive performance of a prognostic model can be measured in several ways which include: overall measures of model fit (for example R2, which measures explained variation for models with continuous outcomes, or generalisations of R2 for models with binary or time‐to‐event outcomes); calibration (which measures the extent to which risk predictions and observed outcomes are in agreement); and discrimination (the model’s ability to separate patients who develop the outcome of interest and those who do not, usually measured using the Concordance (C‐) statistic or area under the curve (AUC)). Clinical utility is also important to consider when a model’s predicted risks are to be used to inform decision‐making. This can be measured by the net benefit at a particular risk threshold, and by plotting decision curves of the net‐benefit across a range of relevant thresholds (Vickers 2016).
There have been some attempts to derive and validate prognostic models to predict depression‐related outcomes (Angstman 2017; King 2010; Rubenstein 2007; Van Bronswijk 2019). In a scoping review, we identified only one model developed to predict risk of recurrence of depression over three years (C‐statistic of 0.72 on external validation; confidence interval not reported) (Wang 2014). There has been no previous systematic review to identify all such models.
Objectives
Primary objective
To summarise the predictive performance of prognostic models developed to predict the risk of relapse, recurrence, sustained remission or recovery in adults with major depressive disorder who meet criteria for remission or recovery.
Secondary objectives
To describe the characteristics of models identified, including predictors and method of derivation (e.g. regression, machine learning, neural networks etc.)
To review the clinical utility (net benefit) of identified models, where this has been reported
To summarise the value of updating or modifying an existing prognostic model or to identify whether the development of a novel prognostic model to predict relapse and recurrence of major depressive disorder is required. We planned to make this decision through discussion involving the whole team, guided by 'Risk of bias' assessment, applicability of methods and predictive performance
Investigation of sources of heterogeneity between studies
We anticipated between‐study heterogeneity in model performance, with sources of heterogeneity likely to relate to population/case mix (e.g. age of participants and multimorbidity); study setting of models (e.g. differences between models developed in primary and secondary care settings); and study design (e.g. follow‐up time, source of data, outcome definition and sample size). We planned to take these into account in the event that we conducted a meta‐analysis.
Methods
Criteria for considering studies for this review
The eligibility criteria required for studies to be included in the review were informed by the following PICOTS criteria (Table 1).
1. PICOTS Criteria for inclusion in the review.
| P | Population | Adult patients (18 years and over) diagnosed with depression and meeting criteria for remission |
| I | Index prognostic model | All prognostic models predicting relapse, recurrence, sustained remission or recovery in patients with remitted depression |
| C | Comparator prognostic model | None |
| O | Outcomes | Relapse, recurrence, sustained remission or recovery in depression |
| T | Timing | Start‐point: the point at which a patient has responded to treatment and is identified as meeting criteria for remission |
| S | Setting | Any setting (primary, secondary or community care) |
Population — adult participants (18 years and over) diagnosed with depression and meeting study‐defined criteria for remission.
Index model — all prognostic models predicting relapse, recurrence, sustained remission or recovery in people with depression.
Comparator — there is no comparator in this review.
Outcomes — relapse, recurrence, sustained remission or recovery in depression. We accepted and clearly documented any definition reported by authors.
Timing — our prespecified start‐point was the point at which a participant has responded to treatment and was identified as meeting criteria for remission. The end points are those described under ‘Outcomes’ over any time period.
Setting — any setting (primary, secondary or community care). We included models developed for participants from high‐, medium‐ or low‐income countries.
Types of studies
Wolff 2019 defined three types of prognostic model study:
· Prediction model development without external validation: these studies aim to identify important predictors of the outcome of interest, assign weights (usually in the form of regression coefficients) to each predictor during multivariable analysis, develop a prediction model for individualised risk predictions and quantify the model’s predictive performance in the development set. They should use internal validation techniques to adjust for optimism and reduce overfitting;
· Prediction model development with external validation: these studies undertake the development steps as described previously and then attempt to quantify the model’s performance in data external to the development data;
· Prediction model external validation studies: attempt to externally validate an existing prediction model.
We included all model development and validation (internal and external) studies, including those that updated existing models (i.e. extended or modified existing models with new predictor information). While external validation is described as the “evaluation of performance in data that were not used to develop the model”(Collins 2014), this does not generally mean a random split of the development dataset to produce two separate datasets. This approach is best considered an inefficient form of internal validation (Riley 2019a). External validation can, however, be performed in a dataset produced by a non‐random split, for example participants from the same institution but at different time points (temporal validation) or by location (geographical validation) (Collins 2014; Moons 2012). We included these as examples of external validation studies for the purpose of this review. If a sufficient number of external validation studies were identified for a particular model, we planned to perform a meta‐analysis to provide a quantitative summary of that model’s predictive performance. We planned to treat updated models as separate models for the purposes of meta‐analysis.
Eligible studies included those that developed prognostic models using data from cohort studies (prospective and retrospective, including registries and cohorts from randomised controlled trial data) and any other sources of data if they meet the other inclusion criteria. Reports of impact assessments of prognostic models (studies that assess the impacts of the models when translated and implemented into practice, for example in randomised trials) were not included in this review, as these studies require different methodology. We did not include prognostic factor studies, which set out to examine the adjusted association of prognostic factors on risk of relapse or recurrence (generally in the form of relative risk ratios or odds ratios) but do not derive a multivariable prognostic model to calculate individualised risk of outcome (Riley 2019a).
Targeted population
Adults (18 years and over) who have been diagnosed (using a validated diagnostic tool or diagnostic interview) with major depressive disorder and meet criteria for remission at point of prediction. We excluded models developed in populations with comorbid severe mental illness (for example, schizophrenia and bipolar affective disorder), as these patients will typically receive more intensive psychiatric input and results would be less generalisable. This included studies with mixed populations (e.g. those with and without these comorbid illnesses). We excluded people below 18 years old, as children with depressive disorders are treated in very different settings with different practitioners and follow‐up schedules, and are likely to have meaningfully different predictors from independent adults. We planned to include older adults, being mindful that multimorbidity may be more common in the older population and may impact on depression outcomes in this population, more so than in a general adult population.
Types of prognostic models
All multivariable prognostic models developed to predict the risk of relapse, recurrence, sustained remission or recovery in individuals with depression who have entered remission. We were interested in all multivariable models, whether they were developed to guide therapeutic decision‐making or for any other purpose. Included models must have been developed with the intention of providing individual risk predictions, and not for other purposes (e.g. to quantify the adjusted effect of a prognostic factor). It is good practice for metrics for discrimination or calibration (preferably both) to be reported.
Types of outcomes to be predicted
Relapse, recurrence, sustained remission or recovery in major depressive disorder over any time period. We accepted all definitions. We did not include models that predict sustained depressive symptoms, as these models require a different population (i.e. those who have been diagnosed as depressed and continue to experience symptoms rather than those with depression who have subsequently entered remission).
Search methods for identification of studies
Electronic searches
An Information Specialist conducted searches on the following bibliographic databases using relevant subject headings (controlled vocabularies) and search syntax, appropriate to each resource. The search strategies were designed to identify prognostic models developed to predict the risk of relapse, recurrence, sustained remission or recovery in adults with (unipolar) depression who have entered remission.
Cochrane Library, 2020 Issue 5;
Ovid MEDLINE Search‐1, (1946 to 04 November 2019);
Ovid MEDLINE Search‐2, (1946 to 16 March 2020);
Ovid Embase (1974 to Week 19 2020);
Ovid PsycINFO (1806 to May Week 1 2020).
We applied no restrictions by date, language or publication status. We conducted an initial MEDLINE search in November 2019 and carried all records forward to full‐text screen as a subsequent benchmark for the remaining database search strategies. We searched the additional databases between 16 March and 8 May 2020.
Searching other resources
The Information Specialist also searched the following sources of grey literature (primarily for dissertations and theses).
Open Grey (www.opengrey.eu);
ProQuest Dissertations & Theses Global (www.proquest.com/products-services/pqdtglobal.html);
DART‐Europe E‐theses Portal (www.dart-europe.eu);
EThOS ‐ the British Libraries e‐theses online service (ethos.bl.uk);
Open Access Theses and Dissertations (oatd.org).
Reference lists
We checked the reference lists of all included articles and conducted a forward citation search on the Web of Science (12 March 2021), to identify additional studies missed from the original electronic searches (e.g. unpublished or in‐press citations).
Personal communication
We contacted authors and subject experts for information on unpublished or ongoing studies, or to request additional data.
Data collection
Selection of studies
Two review authors (ASM and NM) independently reviewed the titles and abstracts of studies identified by the search strategy and full texts obtained for studies potentially meeting the inclusion criteria. We excluded prognostic model studies that clearly did not meet our inclusion criteria at the title and abstract screening stage. For any prognostic model studies where there was uncertainty, we undertook a full‐text review. We resolved uncertainty or disagreement in judgements through discussion or, if necessary, by referral to a third review author (KIES or DM).
Data extraction and management
Two independent review authors (ASM and NM) conducted the data extraction. The Checklist for Critical Appraisal and Data Extraction for Systematic Reviews of Prediction Modelling Studies (CHARMS) has been developed to guide data extraction in systematic reviews of prognostic models, and was used for this review. We extracted the following data for all included studies:
method of depression diagnosis;
year of participant recruitment and follow‐up;
setting;
source of data;
participants' characteristics;
study design;
definition of relapse and recurrence;
information on number and type of candidate predictors;
sample size;
number of events;
missing data;
type of model used for development (e.g. logistic regression, Cox regression, machine learning, neural network) and any adjustment for model overfitting (e.g. using penalisation or shrinkage techniques);
model performance: calibration, discrimination and classification measures, including optimism‐adjusted estimates in the development data. Calibration (preferably a calibration plot) and discrimination (C‐statistic) should be reported, at a minimum. A C‐statistic of 1 indicates that a model has perfect discrimination while a C‐statistic of 0.5 means that the model performs no better than chance (Riley 2019a);
model evaluation: whether internal and external validation were done, whether optimism‐adjusted measures were reported from internal validation, model updating in case of poor validation;
results: interpretation and discussion of generalisability, strengths and weaknesses;
clinical utility: usually assessed through net benefit analysis (Vickers 2016), a means of progressing beyond the predictive performance of the developed model and considering its implementation and impact in a healthcare setting, usually using decision analytic techniques. We describe this for included studies where it has been reported.
We also collected information on how the model was presented (risk chart, nomogram, full regression formula) and whether it is possible to use a model based on the information presented in the article. Where measures of predictive performance were not available directly, we planned to calculate these from other information available with reference to recent guidance (Debray 2019).
Assessment of risk of bias in included studies
Risk of bias (assessed as low, high or unclear) relates to the ability of the primary study to answer its own question and whether shortcomings in the methods used mean that the authors’ conclusions lack internal validity, with the predictive accuracy of the model likely to be distorted (Wolff 2019). Applicability (also assessed as low, high, or unclear concern about applicability) refers to the extent to which the primary study is relevant to the systematic review criteria, or how well the study meets the inclusion criteria set out in the Methods section. Two independent review authors (ASM and NM) assessed risks of bias using the Prediction model risk of bias assessment tool (PROBAST), which assesses risk of bias over four domains, as well as applicability (Moons 2019; Riley 2019a; Wolff 2019)
Participants: this domain assessed whether appropriate data sources and inclusion/exclusion criteria were used;
Predictors: assesses whether predictors were defined and assessed in a similar way for all participants; assessed without knowledge of outcomes; and available at the time at which the model is intended for use;
Outcomes: assesses whether outcomes were determined appropriately; whether they were prespecified; whether predictors were excluded from outcome definition; whether they were defined and determined in a similar way for all participants; whether they were determined without knowledge of predictors; and whether there was an appropriate time interval between predictor assessment and outcome determination;
Analysis: assesses whether there was a reasonable number of participants with the outcome; whether there was appropriate handling of continuous and categorical predictors; whether all enrolled participants were included in the analysis; whether missing data were handled appropriately; whether relevant model performance measures were presented; whether overfitting and optimism in performance were accounted for; and whether predictors and assigned weights in the final model correspond to results from multivariable analysis.
We discuss how the included studies performed in the Results section. Here, we expand on some aspects of the 'Analysis' domain and how we applied this when making judgements in this review. Predictor selection is an important part of prognostic model development and occurs in two stages: selecting predictors for consideration in the model (candidate predictors) and selecting predictors during model development (predictors in final model). When using regression analysis, selection of candidate predictors is best done on robust a priori grounds and usually following a literature search or clinical consensus, or both (Riley 2019a). When selecting predictors for inclusion in the final model, it is recommended that statistical significance on univariable analysis between a candidate predictor and the outcome of interest is avoided as a method of selection. Forward selection is also best avoided. These approaches risk overfitting the model to the development dataset and excluding important predictors from the final model. Recommended approaches include fitting the full model (including all predictors felt to be important either clinically or based on the literature, regardless of statistical significance), using variable selection using backward selection (all predictors included and those found not to be statistically significant are excluded in a stepwise manner, with internal validation to then apply shrinkage to deal with overfitting) (Riley 2019a), or penalised regression such as the LASSO or elastic net.
When determining whether an appropriate sample size was used, we adhered to PROBAST recommendations, which use the rule of thumb using events per predictor parameter (EPP). The PROBAST guidance suggests an EPP of 20 and over for development studies (although those between 10 and 20 EPP can be rated 'probably yes' or 'probably no', depending on outcome frequency, overall model performance and distribution of predictors in the model) and that validation studies must have at least 100 participants with the outcome and 100 without the outcome. EPP refers to the number of candidate predictors rather than just those included in the final model. Specifying the number of parameters rather than the number of predictors takes into account whether there have been any transformations of continuous variables (e.g. when checking for correct functional form) and indicator variables for categorical predictors with multiple categories and interactions.
Because prognostic models are often developed on data collected for a different purpose, missing data are common. A complete‐case analysis to compensate for missing data is not generally recommended (unless there is very little missing), due to waste of valuable data. There are several more acceptable ways of accounting for missing data. Multiple imputation is considered more appropriate when data are missing at random (Riley 2019a) and is recommended by PROBAST (Moons 2019).
The PROBAST tool has been developed primarily for studies that used a more traditional regression method and guidance on best practice for machine learning (ML) models is less widely available. There is debate over the minimum number of EPP required, with guidance stating between 10 and 50 required for model development using classical modelling techniques, such as logistic regression. The guidance and literature that does exist would suggest that we should demand, if anything, significantly larger sample sizes when using a ML approach to prognostic model development, with one paper estimating that one would need more than 10 times the EPP required for regression models to achieve a stable area under the curve (AUC) and small optimism (Van Der Ploeg 2014). Another suggestion is that prediction models developed using ML techniques require EPP of more than 200 to avoid overfitting (Wolff 2019). In the case of any ML models identified, we applied the PROBAST guidance as described for traditional regression techniques, but judgements should be interpreted with these limitations in mind.
Measures of association or predictive performance measures to be extracted
We extracted information about the models’ predictive performance, in terms of discrimination (C‐statistic) and calibration (calibration slope, ratio of observed (O) to expected (E) events (O:E ratio), calibration plots), and net benefit measures.
Dealing with missing data
When performance measures (such as C‐statistic, O:E ratio) were not reported in the paper, we contacted authors. Where possible, we used standard methods and formulae described by Debray and colleagues to estimate the O:E ratio and C‐statistic and associated standard errors (Debray 2017).
Assessment of heterogeneity
Reviews of prognostic studies often have to deal with a substantial amount of heterogeneity. We planned to assess the impact of heterogeneity in predictive performance across validation studies, where there were enough data to do so, by calculating prediction intervals that provide a range for the potential performance of a model in a new validation study (Debray 2017). We also planned to calculate I2 and Tau2 statistics. If reported, we would have extracted performance in subgroups.
Data synthesis
Data synthesis and meta‐analysis approaches
If there were enough studies reporting external validation performance, we planned to conduct random‐effects meta‐analyses to summarise performance of prognostic models, as data were likely to be highly heterogeneous. We aimed to pool information about each model’s discrimination (using C‐statistic or equivalent), calibration (using calibration slope, calibration‐in‐the‐large; and O:E ratio) and equivalents from time‐to‐event models (e.g. Harrell’s C‐statistic, calibration slope, D statistic, O:E at each time point). We planned to summarise performance measures separately, first transforming them to an appropriate scale where necessary (logit C‐statistic and log O:E ratio) to produce summary results (with 95% confidence intervals (CIs)) that quantified the average performance across studies (Snell 2018). To better account for the uncertainty in the estimated between‐study heterogeneity, we planned to use the restricted maximum likelihood (REML) estimation, with 95% CIs for the summary (average) performance of a model, derived using the Hartung‐Knapp‐Sidik‐Jonkmann method, as recommended by Debray 2017 and Langan 2018. In the absence of sufficient data for a meta‐analysis, we have used a narrative synthesis instead.
Subgroup analysis and investigation of heterogeneity
We planned that, if there were sufficient data (a minimum of 10 studies), we would investigate potential sources of heterogeneity using meta‐regression with the summary estimate of model performance (e.g. logit C‐statistic or log O:E ratio) as a dependent variable and study‐level covariates (population/case‐mix (age of participants and multimorbidity), study setting of models (primary and secondary care settings) and study design (follow‐up time, source of data, outcome definition and sample size)) as explanatory variables.
Sensitivity analysis
If we had sufficient studies for meta‐analysis, we planned to evaluate the impact of risks of bias by conducting analyses only including studies assessed at low risk of bias.
Rating the certainty of evidence and summary of findings
The GRADE system was developed to guide the interpretation of certainty (or confidence) in the results of intervention reviews. GRADE assesses the overall certainty of evidence for the estimate of effect by addressing the domains of: risk of bias, inconsistency, imprecision, indirectness and publication bias. GRADE can be applied to some prognosis reviews, with proposed extensions available for reviews of overall prognosis (Iorio 2015) and prognostic factors (Foroutan 2020; Huguet 2013). As discussed, heterogeneity is more likely and might be more acceptable in reviews of prognostic model and factor studies due to the inevitable study differences in methods of measurement, adjustment factors and statistical analysis methods, amongst others. Publication bias is also likely to be more severe in prognosis reviews than in those of intervention studies. Due to incomplete guidance on application of GRADE to prognostic model reviews, we did not conduct GRADE assessments for this review. We have focused on risk of bias (using PROBAST) to guide our assessment of the certainty of the evidence.
Results
Results of the search
We identified a total of 7964 studies initially, with one study located through a forward citation search performed on 12 March 2021 (Van Loo 2020). There were 5366 citations to screen after 2599 duplicates were removed. The 5366 records underwent title and abstract screening by two independent review authors (ASM and NM), 50 underwent full‐text screening and 11 unique studies were included in the final review (12 separate references). One of the final 11 included studies (Wang 2014) had two separate references associated with the same study, one being the main report and one being a conference abstract. Van Loo 2020 reported the external validation of the model developed in Van Loo 2018. Trivedi 2016 is a conference abstract and we were unable to obtain a response from the authors after attempting to contact the corresponding author three times. There were insufficient data available to make a decision on inclusion/exclusion, so we classified this reference as awaiting assessment.
Studies excluded after full‐text screening (n = 37) fell into two categories: not meeting study design criteria (model not intended for prediction) or not meeting participant population criteria (see Figure 1 and Characteristics of excluded studies for more information). Most were excluded for not meeting study design criteria (n = 30); at full‐text review most of these were identified as prognostic factor rather than prognostic model studies. The studies excluded for not meeting participant population criteria (n = 7) either predicted outcomes in people with current depression (rather than remitted depression) at the start‐point or, in the case of one of these studies, looked at a mixed population of participants with anxiety or depression, and predicted relapse of either (Lorimer 2020).
1.
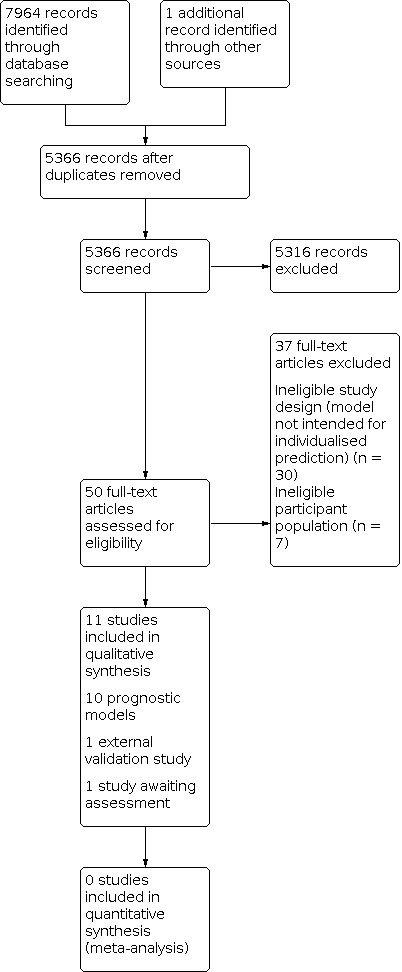
Study flow diagram.
Risk of bias and applicability assessment of included studies
Two independent review authors performed 'Risk of bias' and applicability assessment (see Table 2 and Table 3) on all included studies, using the PROBAST tool (Wolff 2019), which rates risk of bias in the four domains of participants, predictors, outcome and analysis. Level of concern about applicability is assessed for the first three of these domains only.
2. Risk of bias and applicability assessment of included studies.
| Study | ||||||||||||||
| Backs‐Dermott 2010 | Berlanga 1999 | Johansson 2015 | Judd 2016 | Klein 2018 | Pintor 2009 | Ruhe 2019 | Van Loo 2015 | Van Loo 2018 | Van Loo 2020 | Wang 2014 | ||||
| Type of study | Dev | Dev | Dev | Dev | Dev | Val | Dev | Dev | Dev | Val | Dev | Val | Dev | Val |
| Domain 1: Participants | ||||||||||||||
| Risk of bias | Low | Low | Low | Low | Low | Low | Low | Low | Low | Low | Low | Low | Low | Low |
| Concern about applicability | Low | Unclear | Low | Low | Low | Low | Low | Low | Low | Low | Low | Low | Low | Low |
| Domain 2: Predictors | ||||||||||||||
| Risk of bias | Low | Low | Low | Low | Low | Low | Unclear | Low | Low | Low | Unclear | High | Low | Low |
| Concern about applicability | Low | Low | Low | Low | Low | Low | Low | Low | Low | Low | Low | Low | Low | Low |
| Domain 3: Outcome | ||||||||||||||
| Risk of bias | Unclear | Unclear | Unclear | Low | Low | Low | Unclear | Unclear | Unclear | Unclear | Unclear | Unclear | Unclear | Unclear |
| Concern about applicability | Low | Low | Low | Low | Low | Low | Low | Low | Low | Low | Low | Low | Low | Low |
| Domain 4: Analysis | ||||||||||||||
| Risk of bias | High | High | High | High | Low | Low | High | High | High | High | High | High | High | High |
| Overall assessment of risk of bias | High | High | High | High | Low | Low | High | High | High | High | High | High | High | High |
| Overall concern for applicability | Low | Unclear | Low | Low | Low | Low | Low | Low | Low | Low | Low | Low | Low | Low |
Dev: Prognostic model development study; Val: External validation study of prognostic model
3. Detailed risk of bias and applicability assessment.
| Study | ||||||||||||||
| Backs‐Dermott 2010 | Berlanga 1999 | Johansson 2015 | Judd 2016 | Klein 2018 | Pintor 2009 | Ruhe 2019 | Van Loo 2015 | Van Loo 2018 | Van Loo 2020 | Wang 2014 | ||||
| Type of study | Development | Development | Development | Development | Development | Validation | Development | Development | Development | Validation | Development | Validation | Development | Validation |
| Domain 1: Participants | ||||||||||||||
| A. Risk of bias | ||||||||||||||
| 1.1. Appropriate data sources? | Yes | Yes | Yes | Yes | Yes | Yes | Yes | Yes | Yes | Yes | Yes | Yes | Yes | Yes |
| 1.2. Appropriate inclusions and exclusion? | Yes | Yes | Yes | Yes | Yes | Yes | Yes | Yes | Yes | Yes | Yes | Yes | Yes | Yes |
| Risk of bias | Low | Low | Low | Low | Low | Low | Low | Low | Low | Low | Low | Low | Low | Low |
| B. Applicability | ||||||||||||||
| Concern about applicability | Low | Unclear | Low | Low | Low | Low | Low | Low | Low | Low | Low | Low | Low | Low |
| Domain 2: Predictors | ||||||||||||||
| A. Risk of bias | ||||||||||||||
| 2.1. Defined and assessed in similar way for all participants? | Yes | Yes | Yes | Yes | Yes | Yes | Yes | Yes | Yes | Yes | Yes | Yes | Yes | Yes |
| 2.2. Assessments made without knowledge of outcome? | Probably yes | Probably yes | Yes | Yes | Yes | Yes | No information | Yes | Probably yes | Probably yes | No information | No information | Probably yes | Probably yes |
| 2.3. All available at time of model’s intended use? | Yes | Yes | Yes | Yes | Yes | Yes | Yes | Yes | Yes | Yes | Yes | No | Yes | Yes |
| Risk of bias | Low | Low | Low | Low | Low | Low | Unclear | Low | Low | Low | Unclear | High | Low | Low |
| B. Applicability | ||||||||||||||
| Concern about applicability | Low | Low | Low | Low | Low | Low | Low | Low | Low | Low | Low | Low | Low | Low |
| Domain 3: Outcome | ||||||||||||||
| A. Risk of bias | ||||||||||||||
| 3.1. Determined appropriately? | Yes | Yes | Yes | Probably yes | Yes | Yes | No information | Yes | Yes | Yes | Yes | Yes | Probably yes | Probably yes |
| 3.2. Pre‐specified or standard definition? | Yes | Yes | Yes | Yes | Yes | Yes | Yes | Yes | Yes | Yes | Yes | Yes | Yes | Yes |
| 3.3. Predictors excluded from outcome definition? | Yes | Yes | Yes | Yes | Yes | Yes | Yes | Yes | Yes | Yes | Yes | Yes | Yes | Yes |
| 3.4. Defined and determined similar for all participants? | Yes | Yes | Yes | Yes | Yes | Yes | Yes | Yes | Yes | Yes | Yes | Yes | Yes | Yes |
| 3.5. Determined without knowledge of predictors? | No information | No information | No information | Probably yes | Yes | Yes | No information | No information | No information | No information | No information | No information | No information | No information |
| 3.6. Appropriate time interval between predictor assessment and outcome determination? | Yes | Yes | Yes | Yes | Yes | Yes | Yes | Yes | Yes | Yes | Yes | Yes | Yes | Yes |
| Risk of bias | Unclear | Unclear | Unclear | Low | Low | Low | Unclear | Unclear | Unclear | Unclear | Unclear | Unclear | Unclear | Unclear |
| B. Applicability | ||||||||||||||
| Concern about applicability | Low | Low | Low | Low | Low | Low | Low | Low | Low | Low | Low | Low | Low | Low |
| Domain 4: Analysis | ||||||||||||||
| 4.1. Reasonable number of participants with outcome? | Probably yes | No | No | No | Probably yes | Yes | No | No | No | No | No | Probably yes | No information | Yes |
| 4.2. Predictors handled appropriately? | Yes | Probably yes | Yes | No | Probably yes | Probably yes | No | Probably no | No | No | Probably yes | Probably yes | No | No |
| 4.3. All enrolled participants included in analysis? | No | No | Yes | No | Yes | Yes | Yes | No | Probably yes | Probably yes | No | Yes | Yes | Yes |
| 4.4. Missing data handled appropriately? | No information | No information | No information | Yes | Yes | Yes | No information | No | No | No | Yes | Yes | Probably no | Probably no |
| 4.5. Univariable analysis avoided? | No | No | No | No | Yes | NA | No | Yes | Yes | NA | Yes | NA | No | NA |
| 4.6. Complexities in data accounted for? | Probably yes | Probably yes | Probably yes | Yes | Yes | Yes | Probably yes | Yes | Probably yes | Probably yes | Yes | Probably yes | Probably yes | Probably yes |
| 4.7. Relevant performance measures? | No | No | No | No | Yes | Yes | No | No | No | No | No | No | No | No |
| 4.8. Overfitting and optimism accounted for? | No | No | No | No | Yes | NA | No | No | Yes | NA | Yes | NA | Yes | NA |
| 4.9. Final model corresponds to multivariable analysis? | No information | No information | Probably yes | No information | Yes | NA | No information | No information | Probably no | NA | Probably yes | NA | No information | NA |
| Risk of bias | High | High | High | High | Low | Low | High | High | High | High | High | High | High | High |
| Overall assessment of risk of bias | High | High | High | High | Low | Low | High | High | High | High | High | High | High | High |
| Overall concern for applicability | Low | Unclear | Low | Low | Low | Low | Low | Low | Low | Low | Low | Low | Low | Low |
Validation refers to external validation
We rated 10 of the 11 included studies as being at high overall risk of bias. Only Klein 2018 was assessed to be at low risk of bias in all four domains. Risk of bias was generally assessed as being low for most studies in the domains of participants and predictors. Predictors were generally measured appropriately and in the absence of knowledge about outcomes. An exception was Van Loo 2020, wherein predictor information was not available until after the point of prediction for some predictors. There were some infrequent examples of lack of clarity around the measurement of some of the predictors and outcomes; for example, Pintor 2009 described the assessment of relapse according to Frank et al.’s criteria (Frank 1991) applied to the Hamilton Depression Rating Scale‐21 but did not report cut‐offs or the evidence for them. Overall risk of bias was unclear for eight out of 11 of the studies in the domain of outcomes, because the studies did not state that outcomes were determined blind to the predictor information. It is possible that researchers were blinded and that the report papers just did not explicitly state this.
For the fourth domain (analysis), there was variable quality for the reported methods and some weaknesses and potential sources of bias were identified in this domain for 10 of the 11 included studies. The most common weakness related to sample size or number of events, or both, a lack of which seriously and adversely impairs the ability of a statistical model in the real world due to a significant risk of overfitting. Most studies did not describe how the sample size was determined. Klein 2018 was the only study with sufficient EPP for model development (104 recurrences, or events, for eight candidate predictor parameters). While this study did not meet the cut‐off of 20 EPP, we rated it as 'probably yes' for Item 4.1 (reasonable number of participants with the outcome) because the authors had used internal validation techniques to account for optimism in the model. All other regression models (Berlanga 1999; Johansson 2015; Judd 2016; Pintor 2009; Van Loo 2015; Van Loo 2018; Wang 2014) had inadequate sample size. The sample size determination used by Backs‐Dermott 2010, which used discriminant function analysis (DFA), appears to be appropriate according to their reported methods. Ruhe 2019 used an ML approach for model development. As discussed in the Methods section, formal guidance is lacking to aid sample size determinations for prognostic model studies using ML techniques. In light of the literature available, Ruhe 2019 did not have an adequate sample size according to any of the existing guidance and recommendations. For Van Loo 2020, while it was not explicitly stated, we made the assessment that the sample size probably met PROBAST requirements for external validation (at least 100 events).
Another common limitation of the included studies (n = 7) was their handling of missing data. Multiple imputation was used to model missing data in only four of the identified studies (Klein 2018; Judd 2016; Van Loo 2018; Van Loo 2020). The remaining studies either did not report their approach (Backs‐Dermott 2010; Berlanga 1999; Johansson 2015; Pintor 2009) or used more flawed approaches for handling missing data, such as imputing the mean (Ruhe 2019) or single imputation (Van Loo 2015; Wang 2014).
Finally, with respect to risk of bias, most studies (n = 10) did not present appropriate performance statistics. The PROBAST guidance recommends that, at a minimum, a calibration plot and discrimination statistics (AUC or C‐statistic) are presented as relevant performance measures from a prognostic model study (Wolff 2019). Goodness‐of‐fit tests, as presented by Wang 2014, are not recommended as an assessment of calibration, as they do not provide useful information about the presence or magnitude of any miscalibration. Classification measures, such as sensitivity and specificity, can be presented in addition to calibration and discrimination statistics, but they have the drawback of loss of information and of requiring risk thresholds to be specified, often based on the data rather than on meaningful, clinical grounds. Overall, of the studies included in this review, only Klein 2018 presented a calibration plot and C‐statistic in line with best practice. Van Loo 2020, which externally validated the model developed in Van Loo 2018, did not present any information about calibration.
We had low concern about applicability for all included studies except for Berlanga 1999, which was rated at an unclear level of concern. It was unclear whether all of the participants had reached remission and it appears that a proportion of participants would have met criteria for depression according to the Hamilton Depression Rating Scale. Our inclusion criteria were purposely broad, as we were interested in exploring a range of models and settings, which might explain the overall low concern about applicability. A point of note is that five of the studies here had significant time periods between data collection and publication of the data analysis. This period was nine years in the case of Wang 2014 and for four of the studies, this gap was more than a decade (13 years for Van Loo 2020; 18 years for Van Loo 2015; 21 years for Van Loo 2018; and 35 years for Judd 2016). While not explicitly addressed in the 'Risk of bias' assessment, this could have implications for reliability and applicability of results.
Findings
Description of studies
We identified 11 studies of prognostic models for relapse or recurrence in depression. Three were development and external validation studies (model development and external validation of the developed model were reported in the same article) (Klein 2018; Van Loo 2015; Wang 2014), seven were development studies only (Backs‐Dermott 2010; Berlanga 1999; Johansson 2015; Judd 2016; Pintor 2009; Ruhe 2019; Van Loo 2018), and one (Van Loo 2020) was an external validation study. No prognostic model was externally validated in more than one included study. It was therefore not possible to perform a meta‐analysis of the predictive performance of any individual model and we therefore report a narrative synthesis and critical appraisal as planned.
Eight of the model development studies identified used regression analysis (Berlanga 1999; Johansson 2015; Judd 2016; Klein 2018; Pintor 2009; Van Loo 2015; Van Loo 2018; Wang 2014) for model development, one used machine learning (ML) (Ruhe 2019) and one used DFA (Backs‐Dermott 2010). Van Loo 2020 used logistic regression for external validation. There was geographic variation in terms of where the studies had been performed (see Characteristics of included studies).
Source of data and setting
The ideal sources of data for a prognostic model development or validation study are prospective cohort (including RCTs), nested case‐control or case‐cohort studies. All of the included studies used prospectively gathered data for developing the prognostic models. Four of the models were developed in secondary care (Berlanga 1999; Johansson 2015; Judd 2016; Pintor 2009). The other six were developed in a primary care (Klein 2018; Ruhe 2019) or community (Backs‐Dermott 2010; Van Loo 2015; Van Loo 2018; Wang 2014) setting. Two different development studies (Van Loo 2015; Van Loo 2018) used data drawn from the same source: the Virginia Adult Twin Study of Psychiatric and Substance Use Disorder (VATSPSUD), a population‐based longitudinal study of male–male and male–female white twin pairs. Van Loo 2015 used data from female‐female twin pairs and Van Loo 2018 used data from male–male and male–female twin pairs from VATSPSUD. Van Loo 2020 used a data‐set drawn from primary care, secondary care and community settings (the Netherlands Study of Depression and Anxiety (NESDA)) for external validation.
Participants
All studies identified were developed in a population matching our inclusion criteria: adults with a diagnosis of depression that met criteria for remission at the point of prediction. Two studies included only women (Backs‐Dermott 2010; Van Loo 2015). The authors of Van Loo 2015 explained that studying men and women separately might lead to more accurate prediction models because risk factors for relapse can be sex‐dependent. Characteristics of included studies describes the participant demographics, inclusion criteria and definitions of depression and remission for each individual study in more detail.
Outcome (end‐point)
All of the studies included in this review developed prognostic models to predict either relapse or recurrence in participants with remitted depression at the start‐point. None were identified predicting sustained remission or recovery. The included studies varied in their outcome definition. Most referenced Frank et al.’s relapse criteria (Frank 1991; Rush 2006) or used similar criteria using a mixture of diagnostic instruments and clinical interview. All primary studies identified gave a clear definition of relapse or recurrence and used this consistently across all participants in their studies.
'Recurrence' was defined in a number of ways, ranging from a re‐emergence of depressive symptoms at any point but not before two months (Johansson 2015) to within a median follow‐up time of 6.1 years (Van Loo 2015). 'Relapse' was defined as a re‐emergence of depressive symptoms occurring either within two months of achieving remission (Johansson 2015), within six months but after at least eight weeks of remission (Judd 2016) or within 12 months (Backs‐Dermott 2010). See Characteristics of included studies for further information on specific definitions used.
Predictors
The included studies covered a wide range of predictors. Most commonly these were disease‐related characteristics and demographic factors. Disease‐related characteristics included: number of previous episodes (Johansson 2015; Klein 2018; Ruhe 2019; Van Loo 2015; Van Loo 2018; Wang 2014); presence of residual symptoms (Klein 2018), and duration of index episode and speed of onset of response to treatment (Berlanga 1999). Demographic factors included: age (Wang 2014) and having a partner or not (Johansson 2015; Van Loo 2018). Some studies explored some less common predictors such as: neuropsychological predictors (specifically emotional categorisation, emotional memory and facial expression recognition) (Ruhe 2019); personality characteristics such as neuroticism (Berlanga 1999); psychosocial predictors such as life stress and interpersonal difficulties (Backs‐Dermott 2010); biochemical predictors such as results from the corticotrophin‐releasing factor test (Pintor 2009); and, in the case of Judd 2016, combinations of items from the Symptom Checklist (SCL‐90) (Derogatis 1973). Table 4 outlines the different predictors included in the final models and how they were measured for the individual studies.
4. Summary of final predictors and predictive performance of prognostic models.
| Predictive performance | ||||||
| Internal validation | External validation | |||||
| Study | Predictors included in final model | Calibration | Discrimination | Calibration | Discrimination | Other performance statistics presented |
| Backs‐Dermott 2010 | 'Psychosocial' predictors: Life stress; Cognitive‐Personality Vulnerability Factors; Social support; and Coping style:
|
Not reported | Not reported | Not applicable | Not applicable | The DFA was significant: Wilk's Lambda = 0.69, x2 (5) = 16.35, P = 0.006 Standardised discriminant function coefficients:
|
| Berlanga 1999 | 'Personality and clinical predictors':
|
Not reported | Not reported | Not applicable | Not applicable | Combination of 3 variables predicted recurrence of depression in 90% of cases. Threshold not specified Sensitivity: 89% Specificity: 92% Positive Predictive Value: 89% Negative Predictive Value: 92% |
| Johansson 2015 |
|
Not reported | Not reported | Not applicable | Not applicable | Sensitivity: 90% Specificity: 60% Overall accuracy: 78% (Threshold not defined) Measure of overall model fit: Nagelkerke’s R2 = 0.45 R2 = 2.97 (Hosmer and Lemeshow), 0.33 (Cox and Snell) Model Х2 = 20.66 (df = 2, P < 0.001) (compared with constant‐only model) Final model presented with regression coefficients and intercept:
|
| Judd 2016 | 12 SCL‐90 items in final model:
|
Not reported | Not reported | Not applicable | Not applicable | Predictive statistics for “experiencing any one or more of the 12 symptoms most predictive of relapse at a moderate or worse level of severity for the past week”: Sensitivity: 80.8% Specificity: 51.2% Positive Predictive Value: 21.5%; Negative Predictive Value: 94.2% |
| Klein 2018 |
|
Calibration slope = 0.81 | Harrell’s C‐statistic = 0.56 | Calibration slope = 0.56 | Harrell’s C‐statistic = 0.59 | Total risk score calculated from final model “scores”: low (< 35), moderate (35 ‐ 50), high (> 50) Cut‐off score 35 or more (37% risk of recurrence): Sensitivity: 52% Specificity: 69% PPV: 59% NPV: 63% Cut‐off score 50 or more (71% risk of recurrence): Sensitivity: 16% Specificity: 95% PPV: 72% NPV: 57% |
| Pintor 2009 |
|
Not reported | Not reported | Not applicable | Not applicable | Nagelkerke’s R2 = 0.797 Sensitivity: 89% Specificity: 92% Hosmer‐Lemeshow Goodness‐of‐fit test: χ2 = 2.23, df = 8, P = 0.97 |
| Ruhe 2019 | Best classifier included 4 predictors:
|
Not reported | Not reported | Not applicable | Not applicable | Results for “best classifier”: Sensitivity: 71.4 Specificity: 79.3 |
| Van Loo 2015 | Recent depressive episode:
Current state:
Psychiatric history (lifetime):
Family history:
Personality:
Adverse life events (early):
Adverse life events (recent):
Social and economic environment:
|
Not reported. | AUC = 0.79 | Not reported. | AUC = 0.61 | Comparable KM‐curves for the 2 lowest risk groups was used as evidence that the model is well‐calibrated for those at lower risk but less so for higher‐risk patients |
| Van Loo 2018 | Recent depressive episode:
Current state:
Psychiatric history (lifetime):
Family history:
Early adverse life events:
Recent adverse life events:
Social and economic environment:
|
Not reported | AUC in the male training sample = 0.785 AUC in male test sample = 0.710 |
Not applicable | Not applicable | KM‐curves for the low‐risk group in both training and test data were very similar, indicating good discrimination and calibration for participants with lower risk for depression. The KM‐curves for the intermediate and high‐risk groups were more similar in the test data than in the training data, which indicated that the model was less well‐ calibrated for higher risk patients |
| Van Loo 2020 | As for Van Loo 2018 | Not reported | Predicting MD over 0 ‐ 1 year: AUC = 0.73 (95% CI 0.69 to 0.76) |
Not reported | Predicting MD over 0 ‐ 2 years: AUC = 0.68 (95% CI: 0.66 to 0.71) Predicting MD over 0 ‐9 years: AUC = 0.72 (95% C: 0.69 to 0.75) |
‐ |
| Wang 2014 |
Depressive symptoms in MDE:
Interaction terms:
|
Not reported | C statistic = 0.75 | Not reported | C statistic = 0.7195 | Model development: Hosmer‐Lemeshow χ2 (8) = 10.48, P = 0.23 “Excellent calibration” External validation: Hosmer‐Lemeshow χ2 (8) = 3.51, P = 0.90 “Excellent calibration” In the combined development and validation data: C statistic of 0.7365 and “excellent calibration” (H–L χ2 (8) = 6.22, P = 0.62) Observed risk of recurrence over 3 years = 25.40% (95% CI 23.76% to 27.04%) Mean predicted risk of recurrence based on the model = 25.34% (95% CI 24.73% to 25.95%). “We visually compared the predicted versus the observed risk of recurrence by decile risk groups” |
Statistical analysis methods for model development
Of the 10 development studies included in this review, eight used regression analysis with a binary outcome (relapse/recurrence or no relapse/recurrence). Five of the studies used logistic regression (Berlanga 1999; Johansson 2015; Judd 2016; Pintor 2009; Wang 2014) to predict: "recurrence" at three years (Wang 2014); "relapse" within two years (Pintor 2009); "relapse/recurrence" within 12 to 14 months (Johansson 2015); "recurrence" within 12 months (Berlanga 1999); and “relapse” within six months (Judd 2016). Three studies used Cox proportional hazards regression to study time to recurrence; Klein 2018 predicted time to recurrence over two years; Van Loo 2015 predicted time to recurrence over a median follow‐up period of 5½ years (6.1 years for external validation); and Van Loo 2018 predicted time to recurrence up to five years.
Of the remaining two included studies, Ruhe 2019 used a machine learning (ML) support vector machine model to predict recurrence over a median period of 233 days. Backs‐Dermott 2010 used discriminant function analysis (DFA), a statistical method to identify which continuous variables (predictors) best discriminate between two or more groups (in this case, relapse or stable remission). DFA is used to answer the same questions as logistic regression but can be used only for continuous (not categorical) predictors. Significance testing (for example, using Wilks’ lambda) is used to identify which variables are most discriminatory (Tabachnick 1996) . A limitation is that the results are not probabilistic but instead present a categorisation that assumes equal utility for all participants without the necessary and important net benefit approach. Regression techniques are generally more appropriate for prognostic model development to present probabilities which can then be used, along with cost‐effectiveness information and qualitative data, to assign risk categories (Riley 2019a.)
Most studies used univariable analysis to guide predictor selection (Backs‐Dermott 2010; Berlanga 1999; Johansson 2015; Judd 2016; Pintor 2009; Wang 2014). Wang 2014 did retain some non‐significant predictors "on clinical grounds", and then used combined forward and backward selection for model development. See Characteristics of included studies for details of number of events and number of participants and the 'Risk of bias' section for a more detailed discussion of sample size considerations. Klein 2018 was the only study that reported a rationale for the sample sized used: "the rule of thumb of at least ten events (recurrences) per parameter was followed to obtain sufficient statistical power and prevent overfitting", and had 104 events for eight predictor parameters.
Predictive performance of prognostic models
The predictive performance of all included models is summarised in Table 4.
Predictive performance on internal validation
Internal validation techniques aim to reduce the risk of overfitting (where idiosyncrasies within the training data are modelled, thus leading to optimistic estimates of predictive performance and limiting its generalisability to external data) by assessing optimism within the developed model and using this assessment to modify the model. Recommended approaches to internal validation include resampling techniques such as bootstrapping and cross‐validation or penalised methods such as LASSO or elastic net. Internal validation is considered an essential step in prognostic model development (Riley 2019a). Only five of the studies identified reported their attempts to account for overfitting and optimism through internal validation. Klein 2018 used bootstrapping to estimate the amount of overfitting; shrinkage was determined for all statistics and subtracted from the apparent performance statistic to correct for overfitting. Wang 2014 also shrank the coefficients derived through logistic regression using a heuristic shrinkage factor. Ruhe 2019 used a leave‐one‐out procedure wherein the training set consisted of all but one participant and the left‐out sample was then used solely for validation. Van Loo 2015 and Van Loo 2018 used elastic net penalised regression to account for overfitting. The performance statistics after internal validation are reported in Table 4 where these were available.
Predictive performance on external validation
External validation is where the developed model is applied in a dataset entirely separate from the training dataset and gives a truer reflection of model performance and generalisability. Three of the included studies reported external validation of their developed model (Klein 2018; Van Loo 2015; Wang 2014). Van Loo 2020 presented the external validation of the model developed in Van Loo 2018. Klein 2018 used an RCT dataset separate from that used for development for external validation and presented a calibration slope of 0.56 (0.81 on internal validation) and a Harrell’s C‐statistic of 0.59 (0.56 on internal validation). This study was the only included study at overall low risk of bias and these statistics demonstrate that the model did not perform well on external data.
Van Loo 2015 used a temporal cut‐off to define their development and validation samples (temporal validation). They presented “comparable” Kaplan‐Meier curves as evidence that their prognostic model was well‐calibrated for people at lower risk of relapse but less so for higher‐risk participants. It is worth noting that this comparison is based on risk thresholds derived from the data and that Kaplan‐Meier curves from the training and test datasets were not overlain to allow for easy comparison. The model had an AUC of 0.61 on external validation (0.79 on internal validation). This AUC was calculated by averaging AUCs from “a range of different time‐points…all months in the interquartile range of follow‐up”, rather than presenting, for example, Harrell’s C‐statistic, a measure of discrimination designed specifically for models developed using time‐to‐event analysis (Riley 2019a).
Wang 2014 used data from the same source (the US National Epidemiological Survey on Alcohol and Related Conditions) but from a different geographical region (geographical validation) to define development and external validation datasets. The authors presented a C‐statistic of 0.72, indicating good discrimination, and presented the result of the Hosmer‐Lemeshow goodness‐of‐fit test (3.51, P = 0.9) as evidence of “excellent calibration”.
Van Loo 2020 presented the results of the developed model in two "test" sets. One of these (VATSPSUD) was actually data from the same sample used in Van Loo 2018 for model development and we have therefore classified this as an internal validation. The second test sample (NESDA) is separate from the development dataset and we have focused on this as the external validation. Discrimination was reported as good (AUC = 0.68 (95% confidence interval (CI) 0.66 to 0.71) predicting recurrence over 0 to 2 years; AUC = 0.72 (95% CI 0.69 to 0.75) predicting over 0 to 9 years); calibration was not reported. Of the external validations included in this review, only Van Loo 2020 included 95% confidence intervals for measures of discrimination/calibration.
Presentation of usability of the models
Klein 2018 was the only included study at low overall risk of bias and, as discussed, the predictive performance was poor on external validation. The paper presents all of the regression coefficients for the predictors included in the final model as well as the intercept and associated 95% confidence intervals. This model could therefore be used based on the information provided in the primary source. None of the included studies explored net benefit analysis with respect to the developed models.
Discussion
Summary of main results
This is the first systematic review looking at prognostic models predicting relapse and recurrence of depression. We have identified 10 unique models, across 11 included studies, all of which are different in their included predictors, intended setting and participant populations, and predictive performance. Three of these models were externally validated during the model development study, on a dataset separate from that used for development (Klein 2018; Van Loo 2015; Wang 2014). One of the models (Van Loo 2018) underwent external validation in a separate external validation study (Van Loo 2020). None of the models underwent independent external validation (i.e. by researchers not involved in the original model development) or net benefit analysis to assess clinical utility. Only one of the included models was found to be at overall low risk of bias (Klein 2018). This prognostic model, developed using Cox proportional hazards regression, predicted time to recurrence within two years and included the following predictors: number of previous episodes of depression (less than 3; 3 or 4; 5 or more), number of residual symptoms, severity of last depressive episode according to SCID‐I (mild or moderate; severe) and treatment (this was to control for the treatment received in the RCT and was a non‐significant predictor). The discrimination and calibration of this model were both poor on external validation. The other 10 studies had weaknesses in their analysis, particularly for sample size, handling of missing data and not presenting appropriate performance statistics.
Certainty of the evidence
Because there were insufficient external validation studies of the same model, meta‐analysis was not possible. We have presented a narrative synthesis and critical appraisal of the existing literature reporting efforts to develop relapse prediction models for people with remitted depression. As explained in the Methods section, we have not applied GRADE to this review. Most of the studies (10 out of 11) were classed as being at high risk of bias according to PROBAST, so results from the primary studies should therefore be interpreted with caution.
Strengths and weaknesses of the review
This was a wide‐ranging review in an innovative and developing area for Cochrane as a whole, and for the Cochrane Common Mental Disorders group. We have been guided by recent prognosis literature and guidance in developing our searches and in critically appraising the included studies. We have identified a range of models incorporating a range of predictors and using a variety of statistical methods. One weakness is that we were unable to perform our planned meta‐analysis due to a lack of eligible studies.
We undertook the 'Risk of bias' assessment using the PROBAST tool. It is important to note that PROBAST was primarily designed for the assessment of primary prognostic model studies using regression‐based techniques. One study identified in this review used machine learning (ML) techniques (Ruhe 2019). The PROBAST guidance is less directly applicable to ML techniques, although the guidance (Wolff 2019) does recommend tailoring the tool for different methodological approaches, and this can include ML. Longer‐term, formal guidance developed by experts is expected to ensure a more robust and consistent assessment of risk of bias for prognostic model studies using ML techniques.
Applicability of findings to clinical practice and policy
Relapse and recurrence of depression
Relapse and recurrence occur in a significant proportion of people with remitted depression and are a source of considerable morbidity, as well as a significant financial cost to society. Interventions to prevent relapse or recurrence of depression (including pharmacological and psychological approaches) are known to be effective (Clarke 2015; Geddes 2003). Psychological interventions, in particular, can however be resource‐intensive, and providing these for all people with remitted depression is probably unrealistic in most healthcare settings, given limitations of funding and other resources. Pharmacological interventions aimed specifically at relapse prevention also need input from trained healthcare professionals to enable counselling of patients about medications to encourage concordance and reduce the risk of adverse or withdrawal effects. A recent Cochrane Review explored the potential for pharmacist‐led interventions for medication management in depression (Brown 2019) which may be a feasible option in the longer term to increase the capacity to support this. An increased focus on self‐monitoring and recognising early warning signs of recurrence is also likely to be key, although the evidence base for this is also lacking at present, with a Cochrane Review on the subject currently in progress (Lenora 2019).
Until there is more robust evidence for these approaches, a potentially effective way of ensuring efficient allocation of relapse‐prevention interventions is by risk‐stratifying patients according to risk of relapse and recurrence. Interventions can then be provided to those most likely to benefit from them. Prognostic models are already well established in clinical practice for a number of physical health problems, for example cardiovascular health and primary prevention of cardiovascular disease (Steyerberg 2013). It is worth bearing in mind that, while there are many prognostic model development and validation studies reported in the literature, only a small proportion of these end up being implemented in a clinical setting (Steyerberg 2013). The range of models presented in this Cochrane Review suggests that this is a subject that researchers recognise as important. However, while many of the studies identified have reported promising predictive performance, the high risk of bias in the analysis and lack of external or independent validation means it is imperative that the results are interpreted with caution. Similarly, the clinical utility (net benefit) of using the models, which quantifies the overall utility of using a model to inform clinical decisions at thresholds of predicted risk (Vickers 2016), has not been examined.
Our inclusion criteria were purposely broad and unrestrictive; the included studies reflect this in their clinical settings, populations and predictors. Prognostic models for predicting relapse or recurrence of depression have been developed across primary care, secondary care and community settings. Attempts to implement prognostic models in practice must be mindful of the settings and populations in which the models were developed, and cognisant of the fact that models are unlikely to be generalisable to all settings. When considering whether any of these prognostic models would be useful in a particular clinical setting, clinicians should consider the target patient population, whether the included predictors are important to them and their patients and, crucially, whether the predictor information would be readily available in that clinical setting at the time of making a prediction. For example, information on biochemical (Pintor 2009) and neuropsychological (Ruhe 2019) predictors are unlikely to be routinely collected in most clinical settings.
In summary, this review confirms that there is limited evidence to guide individualised risk prediction of relapse and recurrence of depression in clinical practice.
Future research
This review has implications for depression research and for prognosis research more generally.
Relapse and recurrence
First, with respect to depression research, Frank 1991 described the following change‐points: relapse, recurrence, response, remission and recovery. The distinction between relapse and recurrence related to whether the re‐emergence of symptoms is classed as part of the index episode or whether it constitutes a separate episode of depression. We noted in the Background the lack of an empirically‐derived temporal cut‐off for these different change points (Frank 1991; Rush 2006) and that the terms remain inconsistently operationalised (Beshai 2011; Bockting 2015). Our findings confirm that the terms 'relapse' and 'recurrence' were inconsistently used in the primary prognostic model studies included here.
Given the range of definitions used, this review is unlikely to inform future deployment of the terms; future research should look to empirically test and update these definitions. The important point for prognostic model studies is that the model will aim to predict the outcome according to the definition used at the time of development. It is therefore important that clinicians are informed about the underlying theoretical basis for the models used in practice and the context in which they were developed. Further work to empirically validate the change‐points may help to standardise future prognosis research in this area.
Prognosis research, machine learning and depression
We have reported some key methodological weaknesses in the studies identified. Researchers should focus on improving these approaches in future and be mindful of the strengths and limitations of the different methods available. We have discussed the limitations of the sample sizes within the primary studies in this review, and considered events per predictor parameter (EPP) as a 'rule of thumb' for determining minimum sample size. EPP has recently been criticised as being too simplistic and not evidence‐based (Van Smeden 2016). More sophisticated guidance has been developed and reported (Riley 2019b; Riley 2020) in which adequate sample size is dependent on the number of outcome events, number of predictors and desired accuracy of the model. EPP is still the method of sample size determination suggested in the most recent iterations of the Transparent Reporting of a multivariable prediction model for Individual Prognosis Or Diagnosis (TRIPOD) (Moons 2015) and PROBAST (Wolff 2019) guidance. A recurring concern, noted by the authors of the PROBAST guidance, is that prognostic models are often developed using the data available, and sample size justifications are often unreported or are post hoc and descriptive (Moons 2015). Unless the sample size is adequate, there will be limitations to how far we can trust the predictive performance statistics presented by the model development study.
The review has also highlighted a range of methodological approaches to prognostic model development. A key dichotomy is between those using 'traditional' regression‐based techniques and those using ML techniques. When designing future prognosis research, researchers should be mindful of the relative benefits and disadvantaged associated with the different approaches. As discussed in the 'Statistical analysis' section, there are a range of ML approaches to prognostic model development. The ML study included in this review (Ruhe 2019) used a support vector data‐driven model. Other commonly‐used ML approaches include Classification And Regression Tree (CART) (sometimes referred to as 'tree‐based') methods and neural networks. ML may be a useful tool for developing dynamic prognostic models that adapt to course of illness over time and may identify patterns and associations in the data that were previously unknown (Riley 2019a). A recent paper compared logistic regression to a range of commonly‐used ML algorithms in developing a risk prediction tool for Type 1 diabetes (Lynam 2020), and found different approaches had different advantages, with comparable results overall.
There are several key criticisms of ML approaches. First, some ML models lack interpretability and transparency, and are therefore not considered explanatory. They are generally data‐driven and it is often unclear what the underlying model equation is and what the model is doing (this is sometimes described as the 'black box' problem). If the underlying model is not well understood, it is difficult to know when and if the model becomes invalid, such as when used out of scope. ‘Algorithm aversion’ also exists, whereby people prefer human judgement over algorithmic judgement, even if the performance of the algorithm is good (Dietvorst 2018). There is, however, a growing movement towards ‘explainable AI’ (Samek 2019), which may lead to improvements in this context.
The second problem with ML is that there is generally a need for much larger sample sizes for ML‐based models than traditional statistical approaches. If the predictive power of ML approaches are to be realised in mental health research, both the quality and quantity of data need to exist (Tiffin 2018). Finally, in general, the reporting standard of ML studies is variable, prompting concerns over the reproducibility of findings. One reason for this may be the absence of reporting guidelines. However, the development of TRIPOD‐ML (Collins 2019) may encourage greater consistency in reporting and thus reproducibility in the future.
Prognosis research has grown as an area over recent years (Riley 2019a) and, with the development of the PROGRESS initiative, there are now standards and guidelines for performing (Steyerberg 2013), reporting (Moons 2015) and appraising (Wolff 2019) prognostic model studies. Several of the studies in this review were carried out before the publication of this guidance and so perhaps it is not surprising that most were found to be at high risk of bias. Relapse and recurrence of depression has been highlighted as an area requiring improved risk predictions. Future studies looking to develop prognostic models for relapse and recurrence of depression should follow best practice guidance when designing methodology, and should be reported in line with the TRIPOD statement (Moons 2015).
With respect to prognostic models specifically for relapse and recurrence of depression, we have noted the deficiencies in sample size leading to a high risk of bias. It might be that data from multiple sources should be combined and harmonised to increase the available sample size for model development. It is notable that the data in the included studies were taken from samples collected for other purposes, for example RCTs and longitudinal cohort studies. While these are considered acceptable and feasible sources of data for prognostic model studies (Pajouheshnia 2019), there may be advantages to prospectively gathering data with the explicit purpose of prognostic model development (Riley 2020). A benefit of this approach is that researchers can control the collection and measurement of predictor and outcome information, but such an approach is more costly and time‐consuming than the secondary analysis of pre‐existing data. An important consideration for researchers is the context and setting in which a prognostic model is intended to be used. Models intended for a primary‐care setting may need to focus on a different set of predictors than those intended for use within a specialist service. Researchers should be mindful of these factors when designing future prognostic model studies.
Agreements and disagreements with other studies and reviews
Predictors of relapse and recurrence of depression
Summary of the pre‐existing literature
There have been no previous systematic reviews to identify prognostic models for predicting relapse or recurrence of depression. We consider here how our findings fit into the broader context of prognosis research in this area by first reviewing the extant prognostic factor literature. The 'consensus view' has long been that the two factors that most affect risk of relapse and recurrence of depression are residual depressive symptoms (subthreshold symptoms of depression that persist once acute treatment has ended) and a prior history of recurrence (Campbell 2009). Two recent systematic reviews and meta‐analyses have examined the most up‐to‐date evidence for prognostic factors of relapse and recurrence of depression (Buckman 2018; Wojnarowski 2019).
Buckman 2018 performed a four‐stage meta‐synthesis which consisted of: an umbrella review (or meta‐review) of 10 systematic reviews, a meta‐analysis of 12 cohort studies, a meta‐review of 27 non‐systematic reviews and a systematic review of 20 experimental and neuroimaging studies. Buckman 2018 reported "strong evidence" that residual depressive symptoms are prognostic for relapse and recurrence, and "good" evidence that the number of previous episodes are associated with increased risk of relapse and recurrence. Buckman 2018 suggested that residual symptoms may be a "prescriptive" (i.e. a moderator of treatment response) rather than just a prognostic factor (one that predicts outcome only) and that treating residual symptoms, for example through modified cognitive behavioural therapy (Fava 1998), may be protective against subsequent relapse or recurrence. There was no evidence that the number of previous episodes was a prescriptive factor.
In addition to the number of previous episodes and residual symptoms, the other prognostic factor that Buckman 2018 found to be most strongly associated with relapse was childhood maltreatment. There was also a possible prescriptive effect for those with severe (but not for those with less severe) childhood maltreatment in that those treated with mindfulness‐based cognitive therapy were less likely to relapse than those receiving treatment‐as‐usual. The factors found to be next most associated with relapse and recurrence were comorbid anxiety, neuroticism, age of first onset and rumination. A prescriptive effect was also confirmed for rumination, and there was some limited evidence for a prescriptive effect associated with coping style (Buckman 2018).
Wojnarowski 2019 performed a systematic review of predictors of relapse and recurrence of depression after cognitive behavioural therapy, with a meta‐analysis of five studies (n = 369). The authors confirmed the Buckman 2018 findings and found that residual depressive symptoms and number of previous depressive episodes were statistically significant predictors of relapse and recurrence. Wojnarowski 2019 also reported evidence that experiencing a higher number of dependent chronic stressors or a severe independent life event post‐treatment predicts a greater risk of relapse/recurrence. Hardeveld 2010 has previously demonstrated a higher odds of recurrence associated with both psychosocial impairment and poor coping skills, and Beshai 2011 similarly found that avoidant coping style and "daily hassles/life events" were prognostic of recurrence (although Buckman 2018 notes that this was a very low‐quality review, based on two primary studies only).
Some of the clinical factors that the pre‐existing literature has concluded do not appear to be predictive of relapse or recurrence include: insidiousness of onset; presence of precipitant (cause or trigger for current episode); previous treatment with tricyclics; history of hospitalisation; history of suicidal ideation or attempts; history of alcoholism or substance misuse; history of substance abuse; family history of depression; general level of functioning; biological functions and abnormal sleep patterns. Demographic factors lacking evidence supporting their role as prognostic factors for relapse or recurrence are: age, socioeconomic status, employment status, gender, marital status and intelligence (Buckman 2018; Burcusa 2007; Evans 1992; Thase 1992; Wojnarowski 2019).
Findings from this review
The findings from our review are broadly in agreement with these previous findings from prognosis studies for depressive relapse and recurrence. The number of previous episodes was the most common included predictor across the models identified in this review (n = 6) (Johansson 2015; Klein 2018; Ruhe 2019; Van Loo 2015; Van Loo 2018; Wang 2014). The presence of residual symptoms was used as a predictor only in the model developed by Klein 2018 and was defined using the Inventory of Depressive Symptomatology‐Self Report (IDS‐SR). It was selected as a predictor through backward selection using a significant level of P < 0.05 as a stopping rule (Hazard ratio: 1.04 (1.01 to 2.47) on multivariable analysis).
Childhood maltreatment was included as a predictor in four of the studies included in our review (Ruhe 2019; Van Loo 2015; Van Loo 2018; Wang 2014). The factors that Buckman 2018 found to be next most associated with relapse and recurrence were comorbid anxiety (which was included as a predictor in Wang 2014, Van Loo 2015 and Van Loo 2018), neuroticism (included in the model developed by Berlanga 1999) and age of onset (included in the models developed by Ruhe 2019 and Van Loo 2015). Notably, rumination was not explored as a predictor in any of the included prognostic models, despite good evidence that this is associated with increased risk of relapse (Buckman 2018; Hardeveld 2010). There are good reasons why prognostic factors known to be associated with outcomes might not be included as predictors in a final prognostic model. For example, they may not have been measured in the study; they may have been poorly recorded or missing in a large proportion of the data; or the measure may be impractical, may take too long to administer, or may not be felt to be relevant to the intended clinical context.
In line with the findings discussed in the previous section, Backs‐Dermott 2010 included coping style along with some other "psychosocial predictors" (emotion‐oriented coping; avoidance‐oriented coping; perceived social support from a significant other; perceived social support from friends; and interpersonal marked difficulties), and Pintor 2009 included stress (along with two other predictors) in their prognostic models.
Wang 2014 found that marital status "contributed to" the prediction of recurrence, while Johansson 2015 included having a partner or not as one of two predictors in their final model (odds ratio of 0.12 (95% CI 0.02 to 0.64), P = 0.01). As discussed, the extant literature does not support marital status as a predictor of recurrence (Burcusa 2007; Evans 1992). Neither Buckman 2018 nor Wojnarowski 2019 found conclusive evidence that marital status predicts relapse or recurrence (although one study included in the latter review found that unmarried participants were more likely to experience relapse/recurrence (Thase 1992)). With respect to the prognostic model study by Johansson 2015, perhaps "having a partner or not" better captures the presence of social support compared to marital status. As discussed, weaknesses in the methodology mean that we cannot make conclusive statements about this but, given the strength of the association presented by Johansson 2015, the prognostic significance of "having a partner or not" may warrant further investigation. The model development study by Van Loo 2018 supports the findings of earlier research suggesting that gender is unlikely to be predictive of relapse.
The prognostic model by Pintor 2009 was the only model identified in our review to include a biochemical predictor (net area under the cortisol curve, NAUCC) in the prognostic model. Hypothalamic‐pituitary‐adrenal (HPA) axis dysfunction has been explored and implicated in recurrent depression, with evidence that abnormalities persist into remission (Lok 2012). It has also been previously implicated as a predictor of depressive relapse (Applehof 2006; Buckman 2018). The prognostic model study by Pintor 2009 provides evidence that this relationship may be worth exploring further but did not provide robust evidence to confirm its role as a predictor. Pintor 2009 also included previous suicide attempt as a predictor, a factor that has previously been associated with time to recurrence in adolescents (Lewinsohn 1994) but not in adults (Burcusa 2007; Wojnarowski 2019).
The pre‐existing literature referred to in this section primarily consists of prognostic factor studies or reviews of prognostic factor studies. Where there is a lack of evidence for an association between a variable and an outcome on univariable analysis, this variable should not necessarily be excluded from a prognostic model study. However, this review is broadly in agreement with, and has not found strong evidence to challenge, the findings from the pre‐existing literature.
Predictive performance of prognostic models for depression outcomes
This Cochrane Review focuses on prognostic models which predicted relapse, recurrence, sustained remission or recovery in people with remitted depression. In addition to the studies included in this review, it may be helpful to consider other attempts to develop prognostic models for depression‐related outcomes. The aetiology of depression and depressive relapse is multifaceted, and multivariable models are likely to be a more helpful approach to predicting outcomes than relying on the presence or absence of single prognostic factors. There have been some attempts to derive and validate multivariable prognostic models to predict depression‐related outcomes. Existing prognostic models for depression outcomes include a model (the Depression Outcomes Calculator‐Six Items, (DOC‐6©)) to predict remission (C‐statistic (AUC) of 0.62 (95% CI 0.57 to 0.66)) or persistent depressive symptoms (C‐statistic (AUC) of 0.67 (95% CI 0.61 to 0.72)) at six months' post‐diagnosis (Angstman 2017); a model to predict persistent symptoms at six months (C‐statistic not reported; R2 of 0.40 in development sample and 0.27 in validation sample) (Rubenstein 2007); and a model to predict onset of depression in non‐depressed general practice attendees (C‐statistic of 0.79 (95% CI 0.77 to 0.81)) (King 2010).
The model development and external validation studies in this Cochrane Review present predictive statistics broadly in line with these (C‐statistic of 0.72 on external validation (Wang 2014); AUC of 0.61 (Van Loo 2015); AUC of 0.68 to 0.72 (Van Loo 2020)). Klein 2018 was the best study in terms of methodology, and presented a Harrell's C‐statistic of 0.59 and a calibration slope of 0.56 on external validation. This range of performance statistics suggests that successful individualised prediction might be possible for depression outcomes, but better‐quality studies and potentially different combinations of predictors are needed to explore this further.
Authors' conclusions
Implications for practice
This review has identified 10 prognostic models developed to predict risk of relapse or recurrence in people with remitted depression. The models were developed in a variety of clinical settings and patient populations and with a range of included predictors. In summary, we are not yet at the point where we can reliably predict outcomes for a given person with remitted depression based on their demographic, clinical and disease‐level characteristics. A robust clinical tool to risk‐stratify patients and then target relapse‐prevention interventions to those at increased risk could be of significant benefit to patients, clinicians and the health service as a whole.
Implications for research
We now have good evidence about some of the predictors of relapse and recurrence of depression. There is less strong evidence that these predictors can be incorporated into multivariable prognostic models to provide accurate individualised risk predictions. This review suggests that this might be possible, although the studies identified here were limited by their high risk of bias due to methodological weaknesses. Researchers should conform to best practice when developing prognostic models in future. Researchers should also be aware of the respective benefits and drawbacks of different methodological approaches to model development and internal validation. Beyond this, prognostic models require external validation, assessment of clinical utility and evaluation of implementation before they can successfully be translated into clinical practice.
What's new
| Date | Event | Description |
|---|---|---|
| 6 May 2021 | Amended | Title added to the plain language summary. |
History
Protocol first published: Issue 12, 2019 Review first published: Issue 5, 2021
Acknowledgements
We thank the Cochrane Prognosis Methods Group for providing guidance during protocol development; and the editorial team of the Cochrane Common Mental Disorders (CCMD) Group including Jessica Hendon (Managing Editor) and Sarah Dawson (Information Specialist). Sarah Dawson helped develop the search strategies and ran all searches. The authors are grateful to the following PPI group members who contributed to and provided constructive feedback on the Plain Language Summary: Gregory Ball, Joanne Castleton, Gillian Payne, Sue Penn and Emma Williams. The authors thank Professor Trevor Sheldon and Dr Paul Tiffin, who have provided comments and advice on drafts of this review through their roles as Thesis Advisory Panel members.
The authors and the CCMD Editorial Team are grateful to the following peer reviewers for their time and comments: Johanna Damen (Cochrane Prognosis Methods Group), Professor Patty Chondros (Department of General Practice, University of Melbourne) and Karen Morley (Cochrane Consumer). They would also like to thank Cochrane Copy Edit Support for the team's help.
The National Institute for Health Research (NIHR) is the largest single funder of the CCMD Group. Andrew Moriarty is funded by a NIHR Doctoral Research Fellowship for this research project (NIHR Doctoral Research Fellowship, Dr Andrew Moriarty, DRF‐2018‐11‐ST2‐044). Kym Snell is funded by the NIHR School for Primary Care Research (SPCR Launching Fellowship). This publication presents independent research funded by the NIHR. The views expressed are those of the authors and not necessarily those of the NHS, the NIHR or the Department of Health and Social Care.
Appendices
Appendix 1. Database searches
• Ovid MEDLINE Search‐1, (1946 to November 04, 2019), n = 2439
• Ovid MEDLINE Search‐2, (1946 to March 16, 2020), n = 1518 [937 new]
• Ovid Embase (1974 to 2020 Week 19), n = 1734
• Ovid PsycINFO (1806 to May Week 1 2020), n = 1148
• Cochrane Library, (Issue 5 of 12, 2020), n = 1121
• Theses databases 8 May 2020), n = 4
Total=7964
Duplicates removed=2599
Records to screen, n = 5365 (3376 already screened (MEDLINE searches))
New records to screen (May 2020), n = 1989
Search strategies
Ovid MEDLINE(R) and Epub Ahead of Print, In‐Process & Other Non‐Indexed Citations and Daily <1946 to November 04, 2019>
Search Strategy: Search‐1
‐‐‐‐‐‐‐‐‐‐‐‐‐‐‐‐‐‐‐‐‐‐‐‐‐‐‐‐‐‐‐‐‐‐‐‐‐‐‐‐‐‐‐‐‐‐‐‐‐‐‐‐‐‐‐‐‐‐‐‐‐‐‐‐‐‐‐‐‐‐‐‐‐‐‐‐‐‐‐‐
1 DEPRESSION/ (112826)
2 DEPRESSIVE DISORDER/ (71437)
3 DEPRESSIVE DISORDER, MAJOR/ (28737)
4 DEPRESSION, POSTPARTUM/ (5217)
5 DEPRESSIVE DISORDER, TREATMENT‐RESISTANT/ (1119)
6 (depress* adj3 (acute or clinical* or diagnos* or disorder* or major or unipolar or illness or scale* or score* or adult* or patient* or participant* or people or inpatient* or in‐patient* or outpatient* or out‐patient*)).ti,ab,kf. (154965)
7 (depress* and (Beck* or BDI* or DSM* or (Statistical Manual adj2 Mental Disorders) or Hamilton or HAM‐D or HAMD or MADRS or (International Classification adj2 Disease?) or ICD‐10 or ICD10 or ICD‐9 or ICD9 or PHQ‐9 or PHQ9 or patient health questionnaire or GDS or EPDS)).ab. (48479)
8 "with depressi*".ab. (25604)
9 (depressi* or depressed).ti. (138888)
10 (depress* adj3 (postnatal* or post‐natal* or postpartum* or post‐partum* or pregnan*)).ti,ab,kf. (8195)
11 (depress* adj3 (refractor* or resistan* or chronic* or persist*)).ti,ab,kf. (11891)
12 (depress* and ((antidepress* or anti‐depress* or SSRI* or SNRI* or serotonin or medication* or psychotropic or treatment*) adj2 (fail* or no* respon* or nonrespon* or non‐respon* or unrespon* or un‐respon*))).ti,ab,kf. (1539)
13 or/1‐12 (298517)
14 (recurr* or relaps* or remiss* or remitt*).ti,ab,kf,hw. (900693)
15 13 and 14 (20579)
16 ((recurr* or reoccur* or re‐occur* or new episode or another episode or relaps* or re‐emerg* or resurg* or re‐surg* or reappear* or re‐appear* or flare‐up) adj5 depress*).ti,ab,kf. (5822)
17 ((remiss* or remitt* or recover*) adj5 depress*).ti,ab,kf. (6368)
18 or/15‐17 (24010)
19 (Prognosis/ or Decision Support Techniques/) and (Algorithms/ or Logistic Models/ or Risk Assessment/) (45685)
20 ((prognos* or predict* or decision*) and (algorithm? or model* or rule? or risk? or outcome?)).ti,kf,hw. (410679)
21 ((prognos* or predict* or decision*) adj3 (algorith? or model* or rule? or risk? or outcome?)).ab. (251570)
22 clinical prediction.mp. (2545)
23 ((prognos* or predict* or decision*) and (history or variable* or criteria or scor* or characteristic* or finding* or factor*)).ti,kf,hw. (324146)
24 ((prognos* or predict* or decision*) adj3 (history or variable* or criteria or scor* or characteristic* or finding* or factor*)).ab. (236647)
25 or/19‐24 (838079)
26 18 and 25 (2455)
27 (exp animals/ or exp models, animal/) not humans.sh. (4641658)
28 (mice or mouse or murine or rat or rats or rodent* or animal model*).ti. (1421140)
29 26 not (27 or 28) (2450)
30 (comment or letter or editorial or news).sh. (1962401)
31 29 not 30 (2439)
***************************
Ovid MEDLINE(R) and Epub Ahead of Print, In‐Process & Other Non‐Indexed Citations and Daily <1946 to March 16, 2020>
Search Strategy: Search‐2
‐‐‐‐‐‐‐‐‐‐‐‐‐‐‐‐‐‐‐‐‐‐‐‐‐‐‐‐‐‐‐‐‐‐‐‐‐‐‐‐‐‐‐‐‐‐‐‐‐‐‐‐‐‐‐‐‐‐‐‐‐‐‐‐‐‐‐‐‐‐‐‐‐‐‐‐‐‐‐‐
1 *mood disorders/ or *depression/ or *depressive disorder/ or *depression, postpartum/ or *depressive disorder, major/ or *depressive disorder, treatment‐resistant/ (153536)
2 (depress* or ((mood* or affective) adj disorder*)).ti. (154316)
3 limit 2 to ("in data review" or in process or publisher) (8097)
4 1 or 3 (161633)
5 exp *Recurrence/ or *Secondary Prevention/ or *Disease Progression/ (12919)
6 (predict* adj5 (longterm or long term or recurr* or reoccur* or re‐occur* or new episode or another episode or relaps* or remission or re‐emerg* or resurg* or re‐surg* or reappear* or re‐appear* or flare‐up or ((future or repeat* or subsequent*) adj2 (depress* or episode?)) or ((clinical or depress* or illness) adj2 course) or ((remain* or stay*) adj (free or well or without depress*)) or (sustain* adj (recovery or remission)) or (future adj2 respon*))).ti,ab,kf. (47610)
7 5 or 6 (60278)
8 (algorithm? or decision tree? or model* or prognos* or risk? or predictors or probabilit* or ((protective or risk or sex or socioeconomic or time) adj factors)).ti,ab,kf,hw. (7782682)
9 4 and 7 and 8 (1362)
10 ((predict* adj3 (future or subsequent) adj3 (respon* or nonrespon* or treatment outcome?)) and depress*).ti,ab,kf. (67)
11 predict*.ti. and ((recurr* or relaps*) adj3 (probabilit* or likelihood? or rate? or risk?)).ti,ab,kf. and depress*.ti,kf,hw. (153)
12 predict*.ab. /freq=2 and ((recurr* or relaps*) adj3 (probabilit* or likelihood? or rate? or risk?)).ti,ab,kf. and depress*.ti,kf,hw. (227)
13 or/9‐12 (1532)
14 (exp animals/ or exp models, animal/) not humans.sh. (4680637)
15 (mice or mouse or murine or rat or rats or rodent* or animal model*).ti. (1436358)
16 (comment or letter or editorial or news).sh. (2003836)
17 or/14‐16 (6850921)
18 13 not 17 (1518)
***************************
Ovid Embase <1974 to 2020 Week 19>
Search Strategy:
‐‐‐‐‐‐‐‐‐‐‐‐‐‐‐‐‐‐‐‐‐‐‐‐‐‐‐‐‐‐‐‐‐‐‐‐‐‐‐‐‐‐‐‐‐‐‐‐‐‐‐‐‐‐‐‐‐‐‐‐‐‐‐‐‐‐‐‐‐‐‐‐‐‐‐‐‐‐‐‐
1 *depression/ or chronic depression/ or late life depression/ or major depression/ or "mixed anxiety and depression"/ or exp perinatal depression/ or post‐stroke depression/ or recurrent brief depression/ or treatment resistant depression/ (204720)
2 (depress* adj3 (acute or clinical* or diagnos* or disorder* or major or unipolar or illness or scale* or score* or adult* or patient* or participant* or people or inpatient* or in‐patient* or outpatient* or out‐patient*)).ti,ab,kw. (229377)
3 (depress* and (Beck* or BDI* or DSM* or (Statistical Manual adj2 Mental Disorders) or Hamilton or HAM‐D or HAMD or MADRS or (International Classification adj2 Disease?) or ICD‐10 or ICD10 or ICD‐9 or ICD9 or PHQ‐9 or PHQ9 or patient health questionnaire or GDS or EPDS)).ab. (80479)
4 "with depressi*".ab. (38096)
5 (depressi* or depressed).ti. (179033)
6 (depress* adj3 (postnatal* or post‐natal* or postpartum* or post‐partum* or pregnan*)).ti,ab,kw. (11865)
7 (depress* adj3 (refractor* or resistan* or chronic* or persist*)).ti,ab,kw. (17689)
8 or/1‐7 (366616)
9 (recurr* or relaps* or remiss*).ti,ab,kw,hw. (1428856)
10 (longterm or long term or recurr* or reoccur* or re‐occur* or new episode or another episode or re‐emerg* or resurg* or re‐surg* or reappear* or re‐appear* or flare‐up or ((future or repeat* or subsequent*) adj2 (depress* or episode?)) or ((clinical or depress* or illness) adj2 course) or ((remain* or stay*) adj (free or well or without depress*)) or (sustain* adj (recovery or remission)) or (future adj2 respon*)).ti,ab,kw. (1980780)
11 (recover* adj5 depress*).ti,ab,kw. (4130)
12 or/9‐11 (2505910)
13 8 and 12 (54304)
14 prognostic index/ (47)
15 (prognosis/ or prognostic assessment/ or prediction/ or predictor variable/) and (algorithm/ or statistical model/ or risk assessment/) (84998)
16 ((prognos* or predicti* or probabilit* or decision?) and (algorithm? or model? or tool? or risk assessment?)).ti,kw. (55679)
17 prediction/ and recurrent disease/ (3181)
18 (8 and 14) or (13 and (15 or 16 or 17)) (553)
19 depressi*.ti. and (recurr* or relaps* or remiss* or recovery).ti,hw. and ((predicti* or predictor? or probability or prognostic).ti,kw,hw. or ((predicti* or predictor? or probability or prognostic) adj (index or model or tool)).ab.) and (follow up or followup or followed or months or longterm or long term).mp. (520)
20 depressi*.ti. and ((predicti* or predictor? or probability or prognostic) adj3 (recurr* or re‐occur* or relaps* or remiss* or recovery)).ab. and (follow up or followup or followed or months or longterm or long term).mp. (346)
21 predict*.ti. and ((recurr* or relaps*) adj3 (probabilit* or likelihood? or rate? or risk?)).ti,ab,kw. and depress*.ti,kw,hw. (268)
22 or/18‐21 (1347)
23 predict*.ab. /freq=2 and ((recurr* or relaps*) and (probabilit* or likelihood? or rate? or risk?)).ti,ab,kw. and depress*.ti,kw,hw. (1038)
24 ((prognos* or predict* or decision*) and (algorithm? or model* or rule? or tool? or risk? or outcome?)).ti,kw,hw. (848336)
25 ((prognos* or predict* or decision*) and (history or variable* or criteria or scor* or characteristic* or finding* or factor*)).ti,kw,hw. (574927)
26 ((prognos* or predict* or decision*) adj3 (algorith? or model* or rule? or tool? or risk? or outcome?)).ab. (411074)
27 ((prognos* or predict* or decision*) adj3 (history or variable* or criteria or scor* or characteristic* or finding* or factor*)).ab. (376282)
28 "decision tree"/ (12592)
29 or/23‐28 (1468888)
30 13 and 29 (6371)
31 limit 30 to exclude medline journals (446)
32 22 or 31 (1734)
***************************
Ovid APA PsycInfo <1806 to May Week 1 2020>
Search Strategy:
‐‐‐‐‐‐‐‐‐‐‐‐‐‐‐‐‐‐‐‐‐‐‐‐‐‐‐‐‐‐‐‐‐‐‐‐‐‐‐‐‐‐‐‐‐‐‐‐‐‐‐‐‐‐‐‐‐‐‐‐‐‐‐‐‐‐‐‐‐‐‐‐‐‐‐‐‐‐‐‐
1 (depression or depressive disorder?).hw,id. (167436)
2 (depress* adj3 (acute or clinical* or diagnos* or disorder* or major or unipolar or illness or scale* or score* or adult* or patient* or participant* or people or inpatient* or in‐patient* or outpatient* or out‐patient*)).ti,ab,id. (141555)
3 (depress* and (Beck* or BDI* or DSM* or (Statistical Manual adj2 Mental Disorders) or Hamilton or HAM‐D or HAMD or MADRS or (International Classification adj2 Disease?) or ICD‐10 or ICD10 or ICD‐9 or ICD9 or PHQ‐9 or PHQ9 or patient health questionnaire or GDS or EPDS)).ab. (45623)
4 "with depressi*".ab. (23223)
5 (depressi* or depressed).ti. (112230)
6 (depress* adj3 (postnatal* or post‐natal* or postpartum* or post‐partum* or pregnan*)).ti,ab,id. (6619)
7 (depress* adj3 (refractor* or resistan* or chronic* or persist*)).ti,ab,id. (10062)
8 or/1‐7 (221741)
9 (recurr* or relaps* or remiss* or recovery).ti,ab,id,hw. (135977)
10 (longterm or long term or recurr* or reoccur* or re‐occur* or new episode or another episode or re‐emerg* or resurg* or re‐surg* or reappear* or re‐appear* or flare‐up or ((future or repeat* or subsequent*) adj2 (depress* or episode?)) or ((clinical or depress* or illness) adj2 course) or ((remain* or stay*) adj (free or well or without depress*)) or (sustain* adj (recovery or remission)) or (future adj2 respon*)).ti,ab,id. (181037)
11 or/9‐10 (273220)
12 8 and 11 (32711)
13 (prognos* or predicti*).hw,id. and (algorithms/ or models/ or risk assessment/ or risk factors/ or at risk populations/ or *treatment outcomes/) (7659)
14 ((prognos* or predicti* or probabilit* or decision?) and (algorithm? or model? or tool? or risk)).ti,id. (24658)
15 (prediction and (recurrent depression or ((relapse or remission or recovery) adj disorders))).hw. (402)
16 ((decision trees or prognosis) and recurrence).mh. (652)
17 12 and (13 or 14 or 15 or 16) (539)
18 depressi*.ti. and (recurr* or relaps* or remiss* or recovery).ti,hw. and ((predicti* or predictor? or probability or prognostic).ti,id,hw. or ((predicti* or predictor? or probability or prognostic) adj (index or model or tool)).ab.) and (follow up or followup or followed or months or longterm or long term).mp. (168)
19 depressi*.ti. and ((predicti* or predictor? or probability or prognostic) adj3 (recurr* or re‐occur* or relaps* or remiss* or recovery)).ab. and (follow up or followup or followed or months or longterm or long term).mp. (225)
20 predict*.ti. and ((recurr* or relaps*) adj3 (probabilit* or likelihood? or rate? or risk?)).ti,ab,id. and depress*.ti,id,hw. (135)
21 predict*.ab. /freq=2 and ((recurr* or relaps*) and (probabilit* or likelihood? or rate? or risk?)).ti,ab,id. and depress*.ti,id,hw. (481)
22 or/17‐21 (1148)
***************************
Cochrane Library, Issue 5 of 12, 2020
#1 (depression or depressive):kw 39486
#2 (depress* near/3 (acute or clinical* or diagnos* or disorder* or major or unipolar or illness or scale* or score* or adult* or patient* or participant* or people or inpatient* or in‐patient* or outpatient* or out‐patient*)):ti,ab 37753
#3 (depress* and (Beck* or BDI* or DSM* or (Statistical Manual and Mental Disorders) or Hamilton or HAM‐D or HAMD or MADRS or (International Classification and Disease*) or ICD‐10 or ICD10 or ICD‐9 or ICD9 or PHQ‐9 or PHQ9 or patient health questionnaire or GDS or EPDS)):ab 19009
#4 (with next depressi*):ab 3851
#5 (depressi* or depressed):ti 28545
#6 (depress* near/3 (postnatal* or post‐natal* or postpartum* or post‐partum* or pregnan*)):ti,ab 1671
#7 (depress* near/3 (refractor* or resistan* or chronic* or persist*)):ti,ab 2896
#8 (#1 or #2 or #3 or #4 or #15 or #6 or #7) 63071
#9 (recurr* or relaps* or remiss* or recovery):ti,ab,kw 163236
#10 (longterm or "long term" or recurr* or reoccur* or re‐occur* or “new episode” or “another episode” or re‐emerg* or resurg* or re‐surg* or reappear* or re‐appear* or flare‐up):ti,ab,kw 154244
#11 ((future or repeat* or subsequent*) near/2 (depress* or episode*)):ti,ab,kw 726
#12 ((clinical or depress* or illness) near/2 course):ti,ab,kw 3212
#13 ((remain* or stay*) next (free or well or without depress*)):ti,ab,kw 1272
#14 (future near/2 respon*):ti,ab,kw 159
#15 (#9 or #10 or #11 or #12 or #13 or #14) 243893
#16 #8 and #15 13670
#17 ((prognos* or predicti* or probabilit* or decision or decisions) and (algorithm* or model* or index or score or scores or tool* or risk or risks or rule or rules or tree*)):kw,ti 22750
#18 ((prognos* or predict* or decision*) and (history or variable* or criteria or characteristic* or finding* or factor* or outcome or outcomes)):ti,kw 28633
#19 ((prognos* or predicti* or probabilit* or decision or decisions) near (algorithm* or model* or index or score or scores or tool* or risk or risks or rule or rules or tree*)):ab and depress*:ti 235
#20 ((prognos* or predict* or decision*) near (history or variable* or criteria or characteristic* or finding* or factor* or outcome or outcomes)):ab and depress*:ti 864
#21 (predicti* near/3 (recurren* or relapse or remission or recovery)):ti,ab 786
#22 (#17 or #18 or #19 or #20 or #21) 40389
#23 (#16 and #22) 1056
#24 depressi*:ti and (recurr* or relaps* or remiss* or recovery):ti,kw and ((predicti* or predictor* or probability or prognostic):ti,kw or ((predicti* or predictor* or probability or prognostic) next (index or model or tool)):ab) and (follow up or followup or followed or months or longterm or long term):ti,ab,kw 93
#25 depressi*:ti and ((predicti* or predictor* or probability or prognostic) near (recurr* or re‐occur* or relaps* or remiss* or recovery)):ab and ("follow up" or followup or followed or months or longterm or "long term”):ti,ab,kw 117
#26 (#23 or #24 or #25) 1121
***************************
Characteristics of studies
Characteristics of included studies [ordered by study ID]
Backs‐Dermott 2010.
| Study characteristics | ||
| Study details |
Sponsorship source: Canadian Institutes of Health Research Country: Canada Setting: Community setting Year of recruitment: Not reported Author's contact details: barb.backsdermott@albertahealthservices.ca (B.J. Backs‐Dermott); ksdobson@ucalgary.c (K.S. Dobson) |
|
| Methods |
Type of study: Model development study Source of data: Prospective longitudinal cohort study Method used for model development: Differential Function Analysis Method used for internal validation: Not reported External validation: Not done Handling of missing data: Not reported Evaluation of clinical utility: Not assessed |
|
| Sample size |
Total number of participants (Number with event): 49 (29) Number of candidate predictor parameters: 11 Number of predictors in final model: 5 Number of events per candidate predictor parameter (EPP): Not applicable |
|
| Population |
Inclusion criteria:
Exclusion criteria:
|
|
| Baseline characteristics |
Mean age (SD): Relapse group: 43.1 (10.87); Stable remitted group: 43.65 (11.72) Gender (% Female): 100 |
|
| Start‐point (diagnosis of depression and remission) |
Depression: Diagnosis of DSM‐IV‐TR current Major Depressive Episode (MDE) or MDE within the past 8 weeks Remission: "per Frank 1991 criteria": 1) reported less than 2 symptoms of depression on the SCID‐I for at least 2 weeks; and 2) scored ≤ 13 on the BDI‐II |
|
| End‐point (diagnosis of relapse/recurrence) | Relapse within 12 months: meeting current criteria for MDE according to SCID‐I | |
| Timing (length of follow‐up) | 12 months | |
| Notes | ||
Berlanga 1999.
| Study characteristics | ||
| Study details |
Sponsorship source: Not reported Country: Mexico Setting: Secondary care (outpatients) Year of recruitment: 1994 ‐ 1996 Author's contact details: Mexican Institute of Psychiatry, Avenue México‐Xochimilco 101 Colonia San Lorenzo Huipulco, Tlalpan, Mexico D.F. 14370 (e‐mail: cisnerb@lmp.edu.mx) |
|
| Methods |
Type of study: Model development study Source of data: Post‐RCT* prospective follow‐up study Method used for model development: Logistic regression (multivariable analysis with a stepwise backward method in which variables that were significant in the univariable analysis were introduced into the model) Method used for internal validation: Not reported External validation: Not done Handling of missing data: Not reported Evaluation of clinical utility: Not assessed |
|
| Sample size |
Total number of participants (Number with event): 42 (18) Number of candidate predictor parameters: Not reported Number of predictors in final model: 3 Number of events per candidate predictor parameter (EPP): Unclear |
|
| Population |
Inclusion criteria:
Exclusion criteria:
|
|
| Baseline characteristics |
Mean age (SD): Recurrence group: 34.8 (11.1); No‐recurrence group: 37.2 (11.2) Gender (% Female): Recurrence group: 83; No‐recurrence group: 71 |
|
| Start‐point (diagnosis of depression and remission) |
Depression: Major depressive disorder according to DSM‐IV criteria and at least 18 points on the first 17 items of the 21‐item HAM‐D Remission: Definition of remission not reported |
|
| End‐point (diagnosis of relapse/recurrence) | Recurrence: Fulfilling criteria for MDD (clinical interview) per Frank 1991 | |
| Timing (length of follow‐up) | 12 months | |
| Notes | *The RCT compared the clinical efficacy and tolerance of the antidepressants nefazodone and fluoxetine. A 'washout period' of at least 3 weeks free of antidepressant medication was a requisite for all participants | |
Johansson 2015.
| Study characteristics | ||
| Study details |
Sponsorship source: Not reported Country: Sweden Setting: Secondary care (psychiatric outpatients) Year of recruitment: Not reported Author's contact details: Department of Psychology, Lund University, Box 213, 22100 Lund, olof.johansson@psy.lu.se |
|
| Methods |
Type of study: Model development study Source of data: Prospective cohort study Method used for model development: Logistic regression (the 2 predictor variables were chosen which showed the strongest independent correlations with relapse/recurrence) Method used for internal validation: Not reported External validation: Not done Handling of missing data: Not reported Evaluation of clinical utility: Not assessed |
|
| Sample size |
Total number of participants (Number with event): 51 (31) Number of candidate predictor parameters: 4 (based on univariable analysis) Number of predictors in final model: 2 Number of events per candidate predictor parameter (EPP): 7.75 |
|
| Population |
Inclusion criteria:
Exclusion criteria:
|
|
| Baseline characteristics |
Mean age (SD): 47 (SD = 17) Gender (% Female): 71 |
|
| Start‐point (diagnosis of depression and remission) |
Depression: ICD‐10 criteria for depressive episode or recurrent depressive disorder Remission: determined by psychiatrist at discharge and confirmed by structured clinical interview
|
|
| End‐point (diagnosis of relapse/recurrence) |
Relapse/recurrence: (per Frank 1991)
Relapse/recurrence and current depressive status established using the sections Mood Episodes and Mood Disorders from The Structured Clinical Interview for DSM‐IV Axis I Disorders (SCID‐I) |
|
| Timing (length of follow‐up) | 12‐14 months | |
| Notes | ||
Judd 2016.
| Study characteristics | ||
| Study details |
Sponsorship Source: Not reported Country: US Setting: Secondary care (academic centres) Year of Recruitment: 1978‐1981 Author's contact details: Department of Psychiatry, University of California, San Diego, La Jolla |
|
| Methods |
Type of study: Model development study Source of data: Prospective cohort study (the National Institute of Mental Health Collaborative Depression Study) Method used for model development: Forward and backward selection of pre‐selected predictors using stepwise mixed‐model logistic regression Method used for internal validation: Not reported External validation: Not done Handling of missing data: Multiple imputation Evaluation of clinical utility: Not assessed |
|
| Sample size |
Total number of participants (Number with event): 188 (58)* 514 SCL‐90 assessments (73 with relapse) Number of candidate predictor parameters: 17 Number of predictors in final model: 12 Number of events per candidate predictor parameter (EPP): 4.29 (17 candidate predictors to 73 "relapses") |
|
| Population |
Inclusion criteria:
Exclusion criteria:
|
|
| Baseline characteristics |
Mean age (SD): 37.8 (14.4) Gender (% female): 58.5 |
|
| Start‐point (diagnosis of depression and remission) |
Depression: Major depression, assessed by Research Diagnostic Criteria based on Schedule for Affective Disorders and Schizophrenia interviews (no lifetime bipolar disorder, schizoaffective disorder or schizophrenia) Remission: Psychiatric status rating of 1 (asymptomatic, returned to usual self with no symptoms of the episode) for at least 8 weeks |
|
| End‐point (diagnosis of relapse/recurrence) | Relapse (within 6 months): 2 consecutive weeks of psychiatric status ratings at threshold for defining episode of major or minor/dysthymic depression | |
| Timing (length of follow‐up) | 6 months | |
| Notes | *There were 514 SCL‐90 assessments taken from 188 participants. 73 of these assessments (from 58 participants) were identified as having relapsed | |
Klein 2018.
| Study characteristics | ||
| Study details |
Sponsorship source: Not reported Country: The Netherlands Setting: Primary care Year of recruitment: Development data: 2010 ‐ 2013; Validation data: 2009 ‐ April 2015 Author's contact details: Department of Psychiatry, Academic Medical Center, University of Amsterdam, Meibergdreef 9, 1105 AZ Amsterdam, The Netherlands. E‐mail address: c.l.bockting@amc.uva.nl (C.L.H. Bockting) |
|
| Methods |
Type of study: Model development study with external validation Source of data: Prospective data from 2 pragmatic RCTs Method used for model development: Cox proportional hazards regression (backward selection at P < 0.05) Method used for internal validation: Bootstrapping; shrinkage determined for all statistics External validation: Separate RCTs formed development and validation datasets Handling of missing data: Multiple imputation Evaluation of clinical utility: Not assessed |
|
| Sample size |
Total number of participants (Number with event): Development dataset: 235 (104); Validation dataset: 205 (116) Number of candidate predictor parameters: 8 Number of predictors in final model: 4 Number of events per candidate predictor parameter (EPP): 13 |
|
| Population |
Inclusion criteria:
Exclusion criteria:
|
|
| Baseline characteristics |
Mean age (SD): Development dataset: 46.8 (10.6); Validation dataset: 48.3 (9.9) Gender (% female): Development dataset: 74.5; Validation dataset: 66.5 |
|
| Start‐point (diagnosis of depression and remission) |
Depression: DSM‐IV criteria Remission: Assessed using SCID‐I and HRSD score ≤ 10 |
|
| End‐point (diagnosis of relapse/recurrence) | Recurrence (time to) within 2 years: assessed using SCID‐I | |
| Timing (length of follow‐up) | 2 years | |
| Notes | ||
Pintor 2009.
| Study characteristics | ||
| Study details |
Sponsorship source: Not reported Country: Spain Setting: Secondary care (outpatients) Year of recruitment: 2001 ‐ 2005 Author's contact details: Psychiatry Department, Neuroscience Institute, Hospital Clínico de Barcelona, C/Villarroel‐170, 08036 Barcelona, Spain. lpintor@clinic.ub.es (L. Pintor) |
|
| Methods |
Type of study: Model development Source of data: Prospective cohort study Method used for model development: Logistic regression Method used for internal validation: Not reported External validation: Not done Handling of missing data: Not reported Evaluation of clinical utility: Not assessed |
|
| Sample size |
Total number of participants (Number with event): 43 (18) Number of candidate predictors: Not reported Number of predictors in final model: 3 Number of events per candidate predictor parameter (EPP): Unclear |
|
| Population |
Inclusion criteria:
Exclusion criteria:
|
|
| Baseline characteristics |
Mean age (SD): Relapsed group: 50.67 (8.04); Non‐relapsed group: 51.88 (8.54) Gender (% female): Relapsed group: 50; Non‐relapsed group: 56 |
|
| Start‐point (diagnosis of depression and remission) |
Depression: SCID‐IV diagnosis for unipolar major depressive episode (first or recurrent) Remission: identified using Hamilton Depression Rating Scale (HDRS‐21); “Frank 1991 criteria were applied” (does not describe exactly how) |
|
| End‐point (diagnosis of relapse/recurrence) | Presence versus absence of relapse over 2‐year follow‐up: identified using Hamilton Depression Rating Scale (HDRS‐21); “Frank 1991 criteria were applied” (does not describe exactly how) | |
| Timing (length of follow‐up) | 2 years | |
| Notes | ||
Ruhe 2019.
| Study characteristics | ||
| Study details |
Sponsorship source: Not reported Country: The Netherlands Setting: Primary care Year of recruitment: Not reported Author's contact details: Henricus G. Ruhe: eric.ruhe@radboudumc.nl; h.g.ruhe@gmail.com |
|
| Methods |
Type of study: Model development study Source of data: Prospective cohort study Method used for model development: Machine learning support vector machine (SVM); data‐driven model (classification‐based algorithm) Method used for internal validation: "Leave‐one‐out" validation procedure External validation: Not done Handling of missing data: Mean imputation Evaluation of clinical utility: Not assessed |
|
| Sample size |
Total number of participants (Number with event): 64 (35) Number of candidate predictors: Not reported Number of predictors in final model: 4 Number of events per candidate predictor parameter (EPP): Unclear |
|
| Population |
Inclusion criteria:
Exclusion criteria:
|
|
| Baseline characteristics |
Mean age (SD): 53.4 (7.7) Gender (% female): 65.8 |
|
| Start‐point (diagnosis of depression and remission) |
Depression: Recurrent MDD: 2 or more MDD episodes according to the SCID‐I Remission: ≤ 7 on the HDRS) for ≥ 8 weeks and not fulfilling the criteria for a current MDD episode (SCID‐I) |
|
| End‐point (diagnosis of relapse/recurrence) | Recurrence: MDD according to SCID‐I. | |
| Timing (length of follow‐up) | Median follow up: 233 days (IQR 92 ‐ 461) | |
| Notes | ||
Van Loo 2015.
| Study characteristics | ||
| Study details |
Sponsorship source: Not reported Country: USA Setting: Community setting Year of recruitment: 1988 ‐ 1997 Author's contact details: Department of Psychiatry, University of Groningen, University Medical Center Groningen, Hanzeplein 1, PO box 30.001, 9700 RB Groningen, The Netherlands. h.van.loo@umcg.nl (H.M. van Loo) |
|
| Methods |
Type of study: Model development study with external validation Source of data: Prospective longitudinal data* Method used for model development: Elastic net penalised Cox proportional hazards regression Method used for internal validation: 10‐fold cross‐validation and shrinkage of beta‐coefficients External validation: Temporal validation Handling of missing data: Single imputation Evaluation of clinical utility: Not assessed |
|
| Sample size |
Total number of participants (Number with event): Development dataset: 194 (45); Validation dataset: 133 (57) Number of candidate predictor parameters: 81 candidate predictors (number of parameters unclear) Number of predictors in final model: 26 Number of events per candidate predictor parameter (EPP): Unclear |
|
| Population |
Inclusion criteria:
Exclusion criteria:
|
|
| Baseline characteristics |
Mean age (SD): Development dataset: 30.7 (7.1); Validation dataset: 32.4 (7.1) Gender (% female): 100 |
|
| Start‐point (diagnosis of depression and remission) |
Depression: DSM‐III MD episode in previous year (self‐report and confirmed by SCID) Remission: No longer meeting criteria according to SCID |
|
| End‐point (diagnosis of relapse/recurrence) |
Recurrence: first episode meeting DSM‐III‐R criteria after a period of not meeting the criteria (remission or recovery) for at least 4 months Time to recurrence: Number of months between initial interview and recurrence |
|
| Timing (length of follow‐up) | Development dataset: median follow‐up 5.5 years; Validation dataset: median follow‐up 6.1 years | |
| Notes | *Data from prospective longitudinal studies of Caucasian female‐female twin pairs (Virginia Adult Twin Study of Psychiatric and Substance Use Disorder) | |
Van Loo 2018.
| Study characteristics | ||
| Study details |
Sponsorship source: Not reported Country: USA Setting: Community setting Year of recruitment: 1988 ‐ 1997 Author's contact details: Department of Psychiatry, University of Groningen, University Medical Center Groningen, Hanzeplein 1, PO box 30.001, 9700 RB Groningen, The Netherlands. h.van.loo@umcg.nl (H.M. van Loo) |
|
| Methods |
Type of study: Model development study Source of data: Longitudinal cohort study* Method used for model development: Cox proportional hazards model with elastic net penalised regression analysis Method used for internal validation: Random split "test" sample. The final model was selected based on minimal prediction error as assessed in 10‐fold cross‐validation External validation: Not done Handling of missing data: Multiple imputation by chained equations Evaluation of clinical utility: Not reported |
|
| Sample size |
Total number of participants (Number with event): Total sample (men and women): 653** Number of candidate predictor parameters: 70 predictors (number of parameters unclear) Number of predictors in final model: 24 Number of events per candidate predictor parameter (EPP): Unclear |
|
| Population |
Inclusion criteria:
Exclusion criteria:
|
|
| Baseline characteristics |
Mean age (SD): 35 (8.8) Gender (% female): 34.6 |
|
| Start‐point (diagnosis of depression and remission) |
Depression: A diagnosis of MD in the year prior to baseline interview was based on the DSM‐III‐R criteria as assessed by the Structured Clinical Interview for DSM‐III‐R Remission: All participants reported a period of > 60 days of (partial) remission or recovery |
|
| End‐point (diagnosis of relapse/recurrence) |
Recurrence: First reported episode meeting DSM‐III‐R criteria in the year prior to follow‐up interview Time to recurrence: Time at risk for recurrence (follow‐up) was defined as the interval between the offset of MD in the year prior to baseline interview and the onset of MD in the year prior to follow‐up interview |
|
| Timing (length of follow‐up) | 5 years | |
| Notes | *Virginia Adult Twin Study of Psychiatric and Substance Use Disorders (VATSPSUD), a population‐based longitudinal study of male–male and male–female Caucasian twin pairs **This was the full sample size, including men and women. There were also separate analyses in women (n = 226) and in men (n = 427). The male cohort was split further into a training sample (n = 277) and a test sample (for external validation) |
|
Van Loo 2020.
| Study characteristics | ||
| Study details |
Sponsorship source: Funding for NESDA reported in paper Country: Netherlands (NESDA); USA (VATSPSUD) Setting: Primary care, secondary care and community setting (NESDA); Community setting (VATSPSUD) Year of recruitment: 2004 ‐ 2007 (NESDA); 1988‐1997 (VATSPSUD) Author's contact details: Department of Psychiatry, University of Groningen, University Medical Center Groningen, Hanzeplein 1, PO box 30.001, 9700 RB Groningen, The Netherlands. h.van.loo@umcg.nl (H.M. van Loo) |
|
| Methods |
Type of study: External validation study using NESDA data (internal validation also performed on VATSPSUD data) Source of data: 2 longitudinal cohort studies* Method used for model development: Not applicable Method used for internal validation: Random split sample of VATSPSUD data used in Van Loo 2018* External validation: Logistic regression using NESDA dataset** Handling of missing data: Multiple imputation by chained equations Evaluation of clinical utility: Not done |
|
| Sample size |
Total number of participants (Number with event): NESDA Test sample (n = 1925); VATSPSUD Test sample (n = 2301). Number with event not clear Number of candidate predictor parameters: Not applicable Number of predictors in final model: 24 Number of events per candidate predictor parameter (EPP): Not applicable |
|
| Population |
For external validation (NESDA): Inclusion criteria:
Exclusion criteria:
For internal validation (VATSPSUD): Female‐female twins (n = 757) and male‐male/male‐female twins (n = 1544) from the VATSPSUD study (only those not included in the original training sample used to develop the prediction model in Van Loo 2018) |
|
| Baseline characteristics |
Mean age (SD): NESDA Test sample: 42 (12.4); VATSPSUD Test sample: 34.9 (8.6) Gender (% female): NESDA Test sample: 68.6; VATSPSUD Test sample: 53.2 |
|
| Start‐point (diagnosis of depression and remission) |
Depression: Lifetime episode of MD at baseline Remission: Not described |
|
| End‐point (diagnosis of relapse/recurrence) |
Recurrence: Any episode of MD during follow‐up Time to recurrence: Follow‐up to 9 years |
|
| Timing (length of follow‐up) | ||
| Notes | *Two independent test samples from Virginia Adult Twin Study of Psychiatric and Substance Use Disorders (VATSPSUD) and the Netherlands Study of Depression and Anxiety (NESDA) **External validation performed on NESDA cohort |
|
Wang 2014.
| Study characteristics | ||
| Study details |
Sponsorship source: Not reported Country: USA Setting: Community setting Year of recruitment: 2001 ‐ 2005 Author's contact details: JianLi Wang, Department of Psychiatry, Faculty of Medicine, University of Calgary, Room 4D69, TRW Building, 3280 Hospital Drive NW, Calgary, AB Canada T2N 4Z6. E‐mail: jlwang@ucalgary.ca |
|
| Methods |
Type of study: Model development study with external validation Source of data: Prospective longitudinal dataset* Method used for model development: Logistic regression with combined forward and backward selection (compared C‐statistic with and without each predictor, then used Net Reclassification Improvement to examine if the predictor could correctly reclassify participants into appropriate categories) Method used for internal validation: Application of heuristic shrinkage factor External validation: Geographical validation Handling of missing data: Single imputation Evaluation of clinical utility: Not assessed |
|
| Sample size |
Total number of participants (number with event): Development dataset: 1518 (362); Validation dataset: 1195 (307) Number of candidate predictor parameters: Not reported Number of predictors in final model: 24 Number of events per candidate predictor parameter (EPP): Unclear |
|
| Population |
Inclusion criteria:
Exclusion criteria:
|
|
| Baseline characteristics |
Mean age (SEM): Development dataset: 45.38 (0.37); Validation dataset: 45.37 (0.41) Gender (% Female): Development dataset: 77.4%; Validation dataset: 74.9% |
|
| Start‐point (diagnosis of depression and remission) |
Depression: DSM‐IV Remission: “Having remitted from recent depressive episode for at least 2 months” |
|
| End‐point (diagnosis of relapse/recurrence) | Recurrence, within 3 years: Meeting DSM‐IV diagnostic criteria for MDE | |
| Timing (length of follow‐up) | 3 years | |
| Notes | *Data from the US National Epidemiological Survey on Alcohol and Related Conditions | |
HAM‐D: Hamilton rating scale for depression; HDRS‐S: Hamilton depression rating scale ‐ self‐rating; IQR: inter‐quartile range; MADRS: Montgomery‐Asberg depression rating scale; MDD: major depressive disorder; MDE: major depressive episode; SCID‐1: Structured Clinical Interview for DSM‐IV Axis I Disorders; SD: standard deviation
Characteristics of excluded studies [ordered by study ID]
| Study | Reason for exclusion |
|---|---|
| Andreescu 2008 | Ineligible participant population, predictions of treatment response in currently depressed people |
| Angstman 2017 | Ineligible participant population, predictions of clinical outcomes in currently depressed people |
| Berwian 2019 | Ineligible study design, prognostic factor study |
| Berwian 2020 | Ineligible study design, prognostic factor study |
| Bockting 2006 | Ineligible study design, prognostic factor study |
| Brouwer 2019 | Ineligible study design, prognostic factor study |
| Brugha 1997 | Ineligible participant population, non‐remitted depression |
| Chekroud 2016 | Ineligible participant population, non‐remitted depression |
| Cohen 2009 | Ineligible study design, prognostic factor study |
| Colman 2011 | Ineligible study design, prognostic factor study |
| Conradi 2008 | Ineligible study design, prognostic factor study |
| Deng 2018 | Ineligible study design, prognostic factor study |
| Dowrick 2011 | Ineligible participant population, non‐remitted depression |
| Fava 2009 | Ineligible study design, prognostic factor study |
| Giles 1989 | Ineligible study design, prognostic factor study |
| Hardeveld 2013a | Ineligible study design, prognostic factor study |
| Hardeveld 2013b | Ineligible study design, prognostic factor study |
| Ishak 2013 | Ineligible study design, prognostic factor study |
| Judd 1998 | Ineligible study design, prognostic factor study |
| Kanai 2003 | Ineligible study design, prognostic factor study |
| Katz 2009 | Ineligible study design, prognostic factor study |
| Keller 1983 | Ineligible study design, prognostic factor study |
| Kessing 2000 | Ineligible study design, prognostic factor study |
| Kessing 2004 | Ineligible study design, prognostic factor study |
| Kivela 2000 | Ineligible study design, prognostic factor study |
| Kuehner 2013 | Ineligible study design, prognostic factor study |
| Kumagai 2019 | Ineligible study design, prognostic factor study |
| Lin 1998 | Ineligible study design, prognostic factor study |
| Lorimer 2020 | Ineligible participant population, anxiety or depression |
| Mueller 1999 | Ineligible study design, prognostic factor study |
| Mulder 2009 | Ineligible study design, prognostic factor study |
| O'Leary 2000 | Ineligible study design, prognostic factor study |
| O'Leary 2010 | Ineligible study design, prognostic factor study |
| Rucci 2011 | Ineligible study design, prognostic factor study |
| Ten Doesschate 2010 | Ineligible study design, prognostic factor study |
| Van Bronswijk 2019 | Ineligible participant population, not all remitted |
| Wade 2017 | Ineligible study design, prognostic factor study |
Characteristics of studies awaiting classification [ordered by study ID]
Trivedi 2016.
| Notes | Conference abstract; Authors contacted 3 times for further details of results and further publications ‐ no response received |
Differences between protocol and review
None.
Contributions of authors
All authors, other than Kym Snell and Lewis Paton, contributed to the protocol. Kym Snell and Lewis Paton joined the author team at the review stage.
ASM: Lead author of the review. Responsible for screening and selection of studies, data extraction, "Characteristics of studies" tables, risk of bias and applicability assessment.
NM: Contributed to the write‐up of the review. Responsible for screening and selection of studies, data extraction, "Characteristics of studies" tables, risk of bias and applicability assessment.
KIES: Third review author in screening of references and selection of studies and 'Risk of bias' assessment. Contributed to the write‐up of the review. Methodological expertise.
RDR: Contributed to the write‐up of the review. Methodological expertise.
LWP: Contributed to the write‐up of the review.
SG: Contributed to the conception of the review. Content expertise.
CACG: Contributed to the conception and write‐up of the review. Content expertise.
RC: Contributed to the write‐up of the review.
RSP: Commented on the final draft and provided methodological expertise.
SA: Contributed to the conception of the review and commented on the final draft.
DM: Contributed to the conception of the review and commented on the final draft. Content expertise.
Sources of support
Internal sources
University of York, UK
Hull York Medical School, UK
External sources
-
National Institute for Health Research (NIHR), UK
NM and RC work on this review is supported by NIHR Cochrane Infrastructure funding to the Common Mental Disorders Cochrane Review Group. ASM is funded by a NIHR Doctoral Research Fellowship for this research project. This publication presents independent research funded by the NIHR. The views expressed are those of the authors and not necessarily those of the NHS, the NIHR or the Department of Health and Social Care.
Declarations of interest
ASM: No conflicts of interest. NM: No conflicts of interest. KIES: No conflicts of interest. RDR: receives personal fees for statistical consultancy from the BMJ and in‐house training courses, including other universities and Roche. LWP: No conflicts of interest. CACG: No conflicts of interest. SG: No conflicts of interest. RC: Leads and has responsibility for Cochrane Common Mental Disorders, which has supported parts of the review process and is largely funded by a grant from the National Institute for Health Research (NIHR) in the UK. RSP: No conflicts of interest SA: No conflicts of interest DM: No conflicts of interest
Edited (no change to conclusions)
References
References to studies included in this review
Backs‐Dermott 2010 {published data only}
- Backs-Dermott BJ, Dobson KS, Jones SL. An evaluation of an integrated model of relapse in depression. Journal of Affective Disorders 2010;124(1-2):60–7. [DOI] [PubMed] [Google Scholar]
Berlanga 1999 {published data only}
- Berlanga C, Heinze G, Torres M, Apiquián R, Caballero A. Personality and clinical predictors of recurrence of depression. Psychiatric Services 1999;50(3):376-80. [DOI] [PubMed] [Google Scholar]
Johansson 2015 {published data only}
- Johansson O, Lundh LG, Bjärehed J. 12-month outcome and predictors of recurrence in psychiatric treatment of depression: a retrospective study. Psychiatric Quarterly 2015;86(3):407–17. [DOI] [PubMed] [Google Scholar]
Judd 2016 {published data only}
- Judd LL, Schettler PJ, Rush AJ. A brief clinical tool to estimate individual patients’ risk of depressive relapse following remission: proof of concept. American Journal of Psychiatry 2016;173(11):1140–6. [DOI] [PubMed] [Google Scholar]
Klein 2018 {published data only}
- Klein NS, Holtman GA, Bockting CL, Heymans MW, Burger H. Development and validation of a clinical prediction tool to estimate the individual risk of depressive relapse or recurrence in individuals with recurrent depression. Journal of Psychiatric Research 2018;104:1-7. [DOI] [PubMed] [Google Scholar]
Pintor 2009 {published data only}
- Pintor L, Torres X, Navarro V, Martinez de Osaba MJ, Matrai S, Gastó C. Prediction of relapse in melancholic depressive patients in a 2-year follow-up study with corticotropin releasing factor test. Progress in Neuro-Psychopharmacology and Biological Psychiatry 2009;33(3):463-9. [DOI] [PubMed] [Google Scholar]
Ruhe 2019 {published data only}
- Ruhe HG, Mocking RJ, Figueroa CA, Seeverens PW, Ikani N, Tyborowska A, et al. Emotional biases and recurrence in major depressive disorder. Results of 2.5 years follow-up of drug-free cohort vulnerable for recurrence. Frontiers in Psychiatry 2019;10:1-18. [DOI] [PMC free article] [PubMed] [Google Scholar]
Van Loo 2015 {published data only}
- Van Loo HM, Aggen SH, Gardner CO, Kendler KS. Multiple risk factors predict recurrence of major depressive disorder in women. Journal of Affective Disorders 2015;180:52-61. [DOI] [PMC free article] [PubMed] [Google Scholar]
Van Loo 2018 {published data only}
- Van Loo HM, Aggen SH, Gardner CO, Kendler KS. Sex similarities and differences in risk factors for recurrence of major depression. Psychological Medicine 2018;48:1685–93. [DOI] [PubMed] [Google Scholar]
Van Loo 2020 {published data only}
- Van Loo HM, Bigdeli TB, Milaneschi Y, Aggen SH, Kendler KS. Data mining algorithm predicts a range of adverse outcomes in major depression. Journal of Affective Disorders 2020;276:945-53. [DOI] [PubMed] [Google Scholar]
Wang 2014 {published data only}
- Wang J. #2477: Development and validation of a risk prediction algorithm for recurrence of major depression. Journal of Mental Health Policy and Economic 2015;1:S392015. [DOI] [PubMed] [Google Scholar]
- Wang JL, Patten S, Sareen J, Bolton J, Schmitz N, MacQueen G. Development and validation of a prediction algorithm for use by health professionals in prediction of recurrence of major depression. Depression and Anxiety 2014;31(5):451-7. [DOI] [PMC free article] [PubMed] [Google Scholar]
References to studies excluded from this review
Andreescu 2008 {published data only}
- Andreescu C, Mulsant BH, Houck PR, Whyte EM, Mazumdar S, Dombrovski AY, et al. Empirically derived decision trees for the treatment of late-life depression. American Journal of Psychiatry 2008;165(7):855-62. [DOI] [PMC free article] [PubMed] [Google Scholar]
Angstman 2017 {published data only}
- Angstman KB, Garrison GM, Gonzalez CA, Cozine DW, Cozine EW, Katzelnick DJ. Prediction of primary care depression outcomes at six months: validation of DOC-6 ©. Journal of the American Board of Family Medicine 2017;30(3):281-7. [DOI] [PubMed] [Google Scholar]
Berwian 2019 {published data only}
- Berwian IM, Schneebeli M, Renz DL, Collins AG, Seifritz E, Stephan KE, et al. A combined reinforcement-learning drift-diffusion model to understand choice behaviour in remitted depression and relapse after antidepressant discontinuation. Biological Psychiatry 2019;85(10 Supplement):S266. [Google Scholar]
Berwian 2020 {published data only}
- Berwian IM, Wenzel JG, Collins AG, Seifritz E, Stephan KE, Walter H, et al. Computational mechanisms of effort and reward decisions in patients with depression and their association with relapse after antidepressant discontinuation. JAMA Psychiatry 2020;77(5):513-22. [DOI: 10.1001/jamapsychiatry.2019.4971] [DOI] [PMC free article] [PubMed] [Google Scholar]
Bockting 2006 {published data only}
- Bockting CL, Spinhoven P, Koeter MW, Wouters LF, Schene AH, Depression Evaluation Longitudinal Therapy Assessment Study Group. Prediction of recurrence in recurrent depression and the influence of consecutive episodes on vulnerability for depression: a 2-year prospective study. Journal of Clinical Psychiatry 2006;67(5):747-55. [PubMed] [Google Scholar]
Brouwer 2019 {published data only}
- Brouwer ME, Williams AD, Forand NR, DeRubeis RJ, Bockting CL. Dysfunctional attitudes or extreme response style as predictors of depressive relapse and recurrence after mobile cognitive therapy for recurrent depression. Journal of Affective Disorder 2019;243:48-54. [DOI] [PubMed] [Google Scholar]
Brugha 1997 {published data only}
- Brugha TS, Bebbington PE, Stretch DD, MacCarthy B, Wykes T. Predicting the short-term outcome of first episodes and recurrences of clinical depression: a prospective study of life events, difficulties, and social support networks. Journal of Clinical Psychiatry 1997;58(7):298-306. [DOI] [PubMed] [Google Scholar]
Chekroud 2016 {published data only}
- Chekroud AM, Zotti RJ, Shehzad Z, Gueorguieva R, Johnson MK, Trivedi MH, et al. Cross-trial prediction of treatment outcome in depression: a machine learning approach. Lancet Psychiatry 2016;3(3):243-50. [DOI] [PubMed] [Google Scholar]
Cohen 2009 {published data only}
- Cohen RB, Boggio PS, Fregni F. Risk factors for relapse after remission with repetitive transcranial magnetic stimulation for the treatment of depression. Depression and Anxiety 2009;26(7):682-8. [DOI] [PubMed] [Google Scholar]
Colman 2011 {published data only}
- Colman I, Naicker K, Zeng Y, Ataullahjan A, Senthilselvan A, Patten SB. Predictors of long-term prognosis of depression. Canadian Medical Association Journal 2011;183(17):1969-76. [DOI] [PMC free article] [PubMed] [Google Scholar]
Conradi 2008 {published data only}
- Conradi HJ, De Jonge P, Ormel J. Prediction of the three-year course of recurrent depression in primary care patients: different risk factors for different outcomes. Journal of Affective Disorders 2008;105(1-3):267-71. [DOI] [PubMed] [Google Scholar]
Deng 2018 {published data only}
- Deng Y, McQuoid DR, Potter GG, Steffens DC, Albert K, Riddle M, et al. Predictors of recurrence in remitted late-life depression. Depression and Anxiety 2018;35(7):658-67. [DOI] [PMC free article] [PubMed] [Google Scholar]
Dowrick 2011 {published data only}
- Dowrick C, Flach C, Leese M, Chatwin J, Morriss R, Peveler R, et al. Estimating probability of sustained recovery from mild to moderate depression in primary care: evidence from the THREAD study. Psychological Medicine 2011;41(1):141-50. [DOI] [PubMed] [Google Scholar]
Fava 2009 {published data only}
- Fava M, Wiltse C, Walker D, Brecht S, Chen A, Perahia D. Predictors of relapse in a study of duloxetine treatment in patients with major depressive disorder. Journal of Affective Disorders 2009;113(3):263-71. [DOI] [PubMed] [Google Scholar]
Giles 1989 {published data only}
- Giles DE, Jarrett RB, Biggs MM, Guzick DS, Rush AJ. Clinical predictors of recurrence in depression. American Journal of Psychiatry 1989;146(6):764-7. [DOI] [PubMed] [Google Scholar]
Hardeveld 2013a {published data only}
- Hardeveld F, Spijker J, De Graaf R, Hendriks SM, Licht CM, Nolen WA, et al. Recurrence of major depressive disorder across different treatment settings: results from the NESDA study. Journal of Affective Disorders 2013;147(1-3):225-31. [DOI] [PubMed] [Google Scholar]
Hardeveld 2013b {published data only}
- Hardeveld F, Spijker J, De Graaf R, Nolen WA, Beekman AT. Recurrence of major depressive disorder and its predictors in the general population: results from the Netherlands Mental Health Survey and Incidence Study (NEMESIS). Psychological Medicine 2013;43(1):39-48. [DOI] [PubMed] [Google Scholar]
Ishak 2013 {published data only}
- Ishak WW, Greenberg JM, Cohen RM. Predicting relapse in major depressive disorder using patient-reported outcomes of depressive symptom severity, functioning, and quality of life in the Individual Burden of Illness Index for Depression (IBI-D). Journal of Affective Disorders 2013;151(1):59-65. [DOI] [PMC free article] [PubMed] [Google Scholar]
Judd 1998 {published data only}
- Judd LL, Akiskal HS, Maser JD, Zeller PJ, Endicott J, Coryell W, et al. Major depressive disorder: a prospective study of residual subthreshold depressive symptoms as predictor of rapid relapse. Journal of Affective Disorders 1998;50(2-3):97-108. [DOI] [PubMed] [Google Scholar]
Kanai 2003 {published data only}
- Kanai T, Takeuchi H, Furukawa TA, Yoshimura R, Imaizumi T, Kitamura T, et al. Time to recurrence after recovery from major depressive episodes and its predictors. Psychological Medicine 2003;33(5):839-45. [DOI] [PubMed] [Google Scholar]
Katz 2009 {published data only}
- Katz MM, Meyers AL, Prakash A, Gaynor PJ, Houston JP. Early symptom change prediction of remission in depression treatment. Psychopharmacology Bulletin 2009;42(1):94-107. [PubMed] [Google Scholar]
Keller 1983 {published data only}
- Keller MB, Lavori PW, Lewis CE, Klerman GL. Predictors of relapse in major depressive disorder. JAMA 1983;250(24):3299-304. [PubMed] [Google Scholar]
Kessing 2000 {published data only}
- Kessing LV, Andersen EW, Andersen PK. Predictors of recurrence in affective disorder--analyses accounting for individual heterogeneity. Journal of Affective Disorders 2000;57(1-3):139-45. [DOI] [PubMed] [Google Scholar]
Kessing 2004 {published data only}
- Kessing LV. Severity of depressive episodes according to ICD-10: prediction of risk of relapse and suicide. British Journal of Psychiatry 2004;184:153-6. [DOI] [PubMed] [Google Scholar]
Kivela 2000 {published data only}
- Kivela SL, Viramo P, Pahkala K. Factors predicting the relapse of depression in old age. International Journal of Geriatric Psychiatry 2000;15(2):112-9. [DOI] [PubMed] [Google Scholar]
Kuehner 2013 {published data only}
- Kuehner C, Huffziger S. Factors predicting the long-term illness course in a cohort of depressed inpatients. European Archives of Psychiatry and Clinical Neuroscience 2013;263(5):413-23. [DOI] [PubMed] [Google Scholar]
Kumagai 2019 {published data only}
- Kumagai N, Tajika A, Hasegawa A, Kawanishi N, Horikoshi M, Shimodera S, et al. Predicting recurrence of depression using lifelog data: An explanatory feasibility study with a panel VAR approach. BMC Psychiatry 2019;19:Article number 391. [DOI] [PMC free article] [PubMed] [Google Scholar]
Lin 1998 {published data only}
- Lin EH, Katon WJ, VonKorff M, Russo JE, Simon GE, Bush TM, et al. Relapse of depression in primary care. Rate and clinical predictors. Archives of Family Medicine 1998;7(5):443-9. [DOI] [PubMed] [Google Scholar]
Lorimer 2020 {published data only}
- Lorimer B, Delgadillo J, Kellett S, Lawrence J. Dynamic prediction and identification of cases at risk of relapse following completion of low-intensity cognitive behavioural therapy. Psychotherapy Research 2021;31(1):19-32. [DOI: 10.1080/10503307.2020.1733127] [DOI] [PubMed] [Google Scholar]
Mueller 1999 {published data only}
- Mueller TI, Leon AC, Keller MB, Solomon DA, Endicott J, Coryell W, et al. Recurrence after recovery from major depressive disorder during 15 years of observational follow-up. American Journal of Psychiatry 1999;156(7):1000-6. [DOI] [PubMed] [Google Scholar]
Mulder 2009 {published data only}
- Mulder RT, Frampton CM, Luty SE, Joyce PR. Eighteen months of drug treatment for depression: predicting relapse and recovery. Journal of Affective Disorders 2009;114(1-3):263-70. [DOI] [PubMed] [Google Scholar]
O'Leary 2000 {published data only}
- O'Leary D, Costello F, Gormley N, Webb M. Remission onset and relapse in depression. An 18-month prospective study of course for 100 first admission patients. Journal of Affective Disorders 2000;57(1-3):159-71. [DOI] [PubMed] [Google Scholar]
O'Leary 2010 {published data only}
- O'Leary D, Hickey T, Lagendijk M, Webb M. Onset of remission and relapse in depression: testing operational criteria through course description in a second Dublin cohort of first-admission participants. Journal of Affective Disorders 2010;125(1-3):221-6. [DOI] [PubMed] [Google Scholar]
Rucci 2011 {published data only}
- Rucci P, Frank E, Calugi S, Miniati M, Benvenuti A, Wallace M, et al. Incidence and predictors of relapse during continuation treatment of major depression with SSRI, interpersonal psychotherapy, or their combination. Depression and Anxiety 2011;28(11):955-62. [DOI] [PubMed] [Google Scholar]
Ten Doesschate 2010 {published data only}
- Ten Doesschate MC, Bockting CL, Koeter MW, Schene AH, Group Delta Study. Prediction of recurrence in recurrent depression: a 5.5-year prospective study. Journal of Clinical Psychiatry 2010;71(8):984-91. [DOI] [PubMed] [Google Scholar]
Van Bronswijk 2019 {published data only}
- Van Bronswijk SC, Lemmens LH, Keefe JR, Huibers MJ, DeRubeis RJ, Peeters FP. A prognostic index for long-term outcome after successful acute phase cognitive therapy and interpersonal psychotherapy for major depressive disorder. Depression and Anxiety 2019;36(3):252-61. [DOI] [PMC free article] [PubMed] [Google Scholar]
Wade 2017 {published data only}
- Wade BS, Sui J, Hellemann G, Leaver AM, Espinoza RT, Woods RP, et al. Inter and intra-hemispheric structural imaging markers predict depression relapse after electroconvulsive therapy: a multisite study. Translational Psychiatry 2017;7(12):1270. [DOI] [PMC free article] [PubMed] [Google Scholar]
References to studies awaiting assessment
Trivedi 2016 {published data only}
- Trivedi M, Morrison R, Daly E, Singh JB, Fedgchin M, Jamieson C, et al. Biobehavioral prediction of relapse in major depression: a prospective, multicenter, observational study. Neuropsychopharmacology 2016;41(Supplement 1):S517-8. [Google Scholar]
Additional references
Ali 2017
- Ali S, Rhodes L, Moreea O, McMillan D, Gilbody S, Leach C, et al. How durable is the effect of low intensity CBT for depression and anxiety? Remission and relapse in a longitudinal cohort study. Behaviour Research and Therapy 2017;94:1-8. [DOI] [PubMed] [Google Scholar]
Applehof 2006
- Appelhof BC, Huyser J, Verweij M, Brouwer JP, Van Dyck R, Fliers E, et al. Glucocorticoids and relapse of major depression (Dexamethasone/Corticotropin-Releasing Hormone test in relation to relapse of major depression). Biological Psychiatry 2006;56(8):696-701. [DOI] [PubMed] [Google Scholar]
Beshai 2011
- Beshai S, Dobson KS, Bockting CL, Quigley L. Relapse and recurrence prevention in depression: current research and future prospects. Clinical Psychology Review 2011;31(8):1349-60. [DOI] [PubMed] [Google Scholar]
Bockting 2015
- Bockting CL, Hollon SD, Jarrett RB, Kuyken W, Dobson K. A lifetime approach to major depressive disorder: The contributions of psychological interventions in preventing relapse and recurrence. Clinical Psychology Review 2015;41:16e26. [DOI] [PubMed] [Google Scholar]
Brown 2019
- Brown JV, Walton N, Meader N, Todd A, Webster LA, Steele R, et al. Pharmacy-based management for depression in adults. Cochrane Database of Systematic Reviews 2019, Issue 12. Art. No: CD013299. [DOI: 10.1002/14651858.CD013299.pub2] [DOI] [PMC free article] [PubMed] [Google Scholar]
Buckman 2018
- Buckman JE, Underwood A, Clarke K, Saunders R, Hollon SD, Fearon P, et al. Risk factors for relapse and recurrence of depression in adults and how they operate: a four-phase systematic review and meta-synthesis. Clinical Psychology Review 2018;64:13-38. [DOI] [PMC free article] [PubMed] [Google Scholar]
Burcusa 2007
- Burcusa SL, Iacono WG. Risk for recurrence in depression. Clinical Psychology Review 2007;27:959-85. [DOI] [PMC free article] [PubMed] [Google Scholar]
Campbell 2009
- Campbell RJ. Campbell's psychiatric dictionary. 9th Edition. New York: Oxford University Press, 2009. [Google Scholar]
Clarke 2015
- Clarke K, Mayo-Wilson E, Kenny J, Pilling S. Can non-pharmacological interventions prevent relapse in adults who have recovered from depression? A systematic review and meta-analysis of randomised controlled trials. Clinical Psychology Review 2015;39:58–70. [DOI] [PubMed] [Google Scholar]
Collins 2014
- Collins GS, De Groot JA, Dutton S, Omar O, Shanyinde M, Tajar A, et al. External validation of multivariable prediction models: a systematic review of methodological conduct and reporting. BMC Medical Research Methodology 2014;14(1):1-11. [DOI] [PMC free article] [PubMed] [Google Scholar]
Collins 2019
- Collins GS, Moons KG. Reporting of artificial intelligence prediction models. The Lancet 2019;393(10181):1577–9. [DOI] [PubMed] [Google Scholar]
Debray 2017
- Debray TP, Damen JA, Snell KI, Ensor J, Hooft L, Reitsma JB, et al. A guide to systematic review and meta-analysis of prediction model performance. BMJ 2017;356:i6460. [DOI] [PubMed] [Google Scholar]
Debray 2019
- Debray TP, Damen JA, Riley RD, Snell K, Reitsma JB, Hooft L, et al. A framework for meta-analysis of prediction model studies with binary and time-to-event outcomes. Statistical Methods in Medical Research 2019;28(9):2768-86. [DOI: ] [DOI] [PMC free article] [PubMed]
Derogatis 1973
- Derogatis LR, Lipman RS, Covi L. SCL-90: an outpatient psychiatric rating scale: preliminary report. Psychopharmacol Bull 1973;9(1):13-28. [PubMed] [Google Scholar]
Dietvorst 2018
- Dietvorst BJ, Simmons JP, Massey C. Overcoming algorithm aversion: People will use imperfect algorithms if they can (even slightly) modify them. Management Science 2018;64(3):1155–70. [Google Scholar]
Evans 1992
- Evans MD, Hollon SD, DeRubeis RJ, Piasecki JM, Grove WM, Garvey MJ, et al. Differential relapse following cognitive therapy and pharmacotherapy for depression. Archives of General Psychiatry 1992;49(10):802-8. [DOI] [PubMed] [Google Scholar]
Fava 1998
- Fava GA, Rafanelli C, Grandi S, Canestrari R, Morphy MA. Six-year outcome for cognitive behavioral treatment of residual symptoms in major depression. American Journal of Psychiatry 1998;155(10):14-43. [DOI] [PubMed] [Google Scholar]
Foroutan 2020
- Foroutan F, Guyatt G, Zuk V, Vandvik PO, Alba AC, Mustafa R, et al. GRADE Guidelines 28: Use of GRADE for the assessment of evidence about prognostic factors: rating certainty in identification of groups of patients with different absolute risks. Journal of Clinical Epidemiology 2020;121:62-70. [DOI] [PubMed] [Google Scholar]
Frank 1991
- Frank E, Prien RF, Jarrett RB, Keller MB, Kupfer DJ, Lavori PW, et al. Conceptualization and rationale for consensus definitions of terms in major depressive disorder: remission, recovery, relapse, and recurrence. JAMA Psychiatry 1991;48(9):851–5. [DOI] [PubMed] [Google Scholar]
Geddes 2003
- Geddes JR, Carney SM, Davies C, Furukawa TA, Kupfer DJ, Frank E, et al. Relapse prevention with antidepressant drug treatment in depressive disorders: a systematic review. Lancet 2003;361(9358):653-61. [DOI] [PubMed] [Google Scholar]
Hardeveld 2010
- Hardeveld F, Spijker J, De Graaf R, Nolen WA, Beekman AT. Prevalence and predictors of recurrence of major depressive disorder in the adult population. Acta Pyschiatrica Scandinavica 2010;122(3):184–91. [DOI] [PubMed] [Google Scholar]
Hemingway 2013
- Hemingway H, Croft P, Perel P, Hayden JA, Abrams K, Timmis A, et al. Prognosis research strategy (PROGRESS) 1: A framework for researching clinical outcomes. BMJ 2013;346:e5595. [DOI] [PMC free article] [PubMed] [Google Scholar]
Huguet 2013
- Huguet A, Hayden JA, Stinson J, McGrath PJ, Chambers CT, Tougas ME, et al. Judging the quality of evidence in reviews of prognostic factor research: adapting the GRADE framework. Systematic Reviews 2013;2:71. [DOI] [PMC free article] [PubMed] [Google Scholar]
Iorio 2015
- Iorio A, Spencer FA, Falavigna M, Alba C, Lang E, Burnand B, et al. Use of GRADE for assessment of evidence about prognosis: rating confidence in estimates of event rates in broad categories of patients. BMJ 2015;350:h870. [DOI] [PubMed] [Google Scholar]
King 2010
- King M, Walker C, Levy G, Bottomley C, Royston P, Weich S, et al. Development and validation of an international risk prediction algorithm for episodes of major depression in general practice attendees. Archives of General Psychiatry 2010;65(12):1368-77. [DOI] [PubMed] [Google Scholar]
Langan 2018
- Langan D, Simmonds M. A comparison of heterogeneity variance estimators in simulated random ‐ effects meta ‐ analyses. Research Synthesis Methods 2019;10(1):83-98. [DOI] [PubMed] [Google Scholar]
Lenora 2019
- Lenora R, Kumar A, Uphoff E, Meader N, Furtado VA. Interventions for helping people recognise early signs of recurrence in depression [Protocol]. Cochrane Database of Systematic Reviews 2019, Issue 7. Art. No: CD013383. [DOI: 10.1002/14651858.CD013383] [DOI] [Google Scholar]
Lewinsohn 1994
- Lewinsohn PM, Clarke GN, Seeley JR, Rohde P. Major depression in community adolescents: Age at onset, episode duration, and time to recurrence. Journal of the Academy of Child and Adolescent Psychiatry 1994;33(6):809-18. [DOI] [PubMed] [Google Scholar]
Lok 2012
- Lok A, Mocking RJ, Ruhé HG, Visser I, Koeter MW, Assies J, et al. Longitudinal hypothalamic–pituitary–adrenal axis trait and state effects in recurrent depression. Psychoneuroendocrinology 2012;37(7):892-902. [DOI] [PubMed] [Google Scholar]
Lynam 2020
- Lynam AL, Dennis JM, Owen KR, Oram RA, Jones AG, Shields BM, et al. Logistic regression has similar performance to optimised machine learning algorithms in a clinical setting: application to the discrimination between type 1 and type 2 diabetes in young adults. Diagnostic and Prognostic Research 2020;4(1):6. [DOI] [PMC free article] [PubMed] [Google Scholar]
Moons 2012
- Moons KG, Kengne AP, Grobbee DE, Royston P, Vergouwe Y, Altman DG, et al. Risk prediction models: II. External validation, model updating, and impact assessment. Heart 2012;98(9):691-8. [DOI] [PubMed] [Google Scholar]
Moons 2015
- Moons KGM, Altman DG, Reitsma JB, Ioannidis JPA, Macaskill P, Steyerberg EW, Collins GS. Transparent reporting of a multivariable prediction model for individual prognosis or diagnosis (TRIPOD): Explanation and elaboration. Annals of Internal Medicine 2015;162(1):W1–W73. [DOI] [PubMed] [Google Scholar]
Moons 2019
- Moons KGM, Wolff RF, Riley RD, Whiting PF, Westwood M, Collins GS, Mallett, S. PROBAST: A tool to assess risk of bias and applicability of prediction model studies: Explanation and elaboration. Annals of Internal Medicine 2019;170(1):W1–W33. [DOI] [PubMed] [Google Scholar]
Pajouheshnia 2019
- Pajouheshnia R, Groenwold RH, Peelen LM, Reitsma JB, Moons KG. When and how to use data from randomised trials to develop or validate prognostic models. BMJ 2019;365:2154. [DOI] [PubMed] [Google Scholar]
Post 1992
- Post RM. Transduction of psychosocial stress into the neurobiology of recurrent affective disorder. American Journal of Psychiatry 1992;149(8):999–1010. [DOI] [PubMed] [Google Scholar]
Riley 2019a
- Riley RD, Van der Windt DP, Moons K. Prognosis Research in Healthcare: Concepts, Methods, and Impact. 1st edition. Oxford University Press, 2019. [Google Scholar]
Riley 2019b
- Riley RD, Snell KIE, Ensor J, Burke DL, Harrell FE Jr, Moons KG, et al. Minimum sample size for developing a multivariable prediction model: Part II - binary and time-to-event outcomes. Statistics in Medicine 2019;38(7):1276–96. [DOI] [PMC free article] [PubMed] [Google Scholar]
Riley 2020
- Riley RD, Ensor J, Snell KIE, Harrell FE, Martin GP, Reitsma JB, et al. Calculating the sample size required for developing a clinical prediction model. BMJ 2020;368:m441. [DOI: 10.1136/bmj.m441] [DOI] [PubMed] [Google Scholar]
Rubenstein 2007
- Rubenstein LV, Rayburn NR, Keeler EB, Ford DE, Rost KM, Sherbourne CD. Predicting outcomes of primary care patients with major depression: development of a depression prognosis index. Psychiatric Services 2007;58(8):1049-56. [DOI] [PubMed] [Google Scholar]
Rush 2006
- Rush AJ, Kraemer HC, Sackeim HA, Fava M, Trivedi MH, Frank E, et al. Report by the ACNP Task Force on response and remission in major depressive disorder. Neuropsychopharmacology 2006;31(9):1841-53. [DOI] [PubMed] [Google Scholar]
Samek 2019
- Samek W, Montavon G, Vedaldi A, Hansen LK, Muller KR. Explainable AI: Interpreting, Explaining and Visualizing Deep Learning. Lecture Notes in Computer Science. Vol. 11700. Springer, 2019. [Google Scholar]
Snell 2018
- Snell KIE, Ensor J, Debray TP, Moons KG, Riley RD. Meta-analysis of prediction model performance across multiple studies: which scale helps ensure between-study normality for the C-statistic and calibration measures? Statistical Methods in Medical Research 2018;27(11):3505–22. [DOI] [PMC free article] [PubMed] [Google Scholar]
Steyerberg 2013
- Steyerberg EW, Moons KG, Van der Windt DA, Hayden JA. Prognosis Research Strategy (PROGRESS) 3: Prognostic model research. PLoS MED 2013;10(2):e10. [DOI] [PMC free article] [PubMed] [Google Scholar]
Tabachnick 1996
- Tabachnick BG, Fidell LS. Using Multivariate Statistics. New York: Harper Collins College Publishers, 1996. [Google Scholar]
Thase 1992
- Thase ME, Simons AD, McGeary J, Cahalane JF, Hughes C, Harden T, et al. Relapse after cognitive behavior therapy of depression: potential implications for longer courses of treatment. American Journal of Psychiatry 1992;149(8):1046–52. [DOI] [PubMed] [Google Scholar]
Tiffin 2018
- Tiffin PA, Paton LW. Rise of the machines? Machine learning approaches and mental health: opportunities and challenges. British Journal of Psychiatry 2018;213(3):509–10. [DOI] [PubMed] [Google Scholar]
Van Der Ploeg 2014
- Van Der Ploeg T, Austin PC, Steyerberg EW. Modern modelling techniques are data hungry: a simulation study for predicting dichotomous endpoints. BMC Medical Research Methodology 2014;14(1):1-13. [DOI] [PMC free article] [PubMed] [Google Scholar]
Van Smeden 2016
- Van Smeden M, De Groot JA, Moons KG, Collins GS, Altman DG, Eijkemans MJ, et al. No rationale for 1 variable per 10 events criterion for binary logistic regression analysis. BMC Medical Research Methodology 2016;16(1):1-12. [DOI] [PMC free article] [PubMed] [Google Scholar]
Vickers 2016
- Vickers AJ, Van Calster B, Steyerberg EW. Net benefit approaches to the evaluation of prediction models, molecular markers, and diagnostic tests. BMJ (Online) 2016;352:3-7. [DOI] [PMC free article] [PubMed] [Google Scholar]
WHO 2018
- World Health Organization. Depression. Available at www.who.int/news-room/fact-sheets/detail/depression.
Wojnarowski 2019
- Wojnarowski C, Firth N, Finegan M, Delgadillo J. Predictors of depression relapse and recurrence after cognitive behavioural therapy: a systematic review and meta-analysis. Behavioural and Cognitive Psychotherapy 2019;47(5):514-29. [DOI] [PubMed] [Google Scholar]
Wolff 2019
- Wolff RF, Moons KG, Riley RD, Whiting PF, Westwood M, Collins GS, et al. PROBAST: A tool to assess the risk of bias and applicability of prediction model studies. Annals of Internal Medicine 2019;170(1):51. [DOI] [PubMed] [Google Scholar]
References to other published versions of this review
Moriarty 2019
- Moriarty AS, Meader N, Gilbody S, Chew‐Graham CA, Churchill R, Ali S, et al. Prognostic models for predicting relapse or recurrence of depression. Cochrane Database of Systematic Reviews 2019, Issue 12. Art. No: CD013491. [DOI: 10.1002/14651858.CD013491] [DOI] [PMC free article] [PubMed] [Google Scholar]