. 2021 Apr 23;10:e66155. doi: 10.7554/eLife.66155

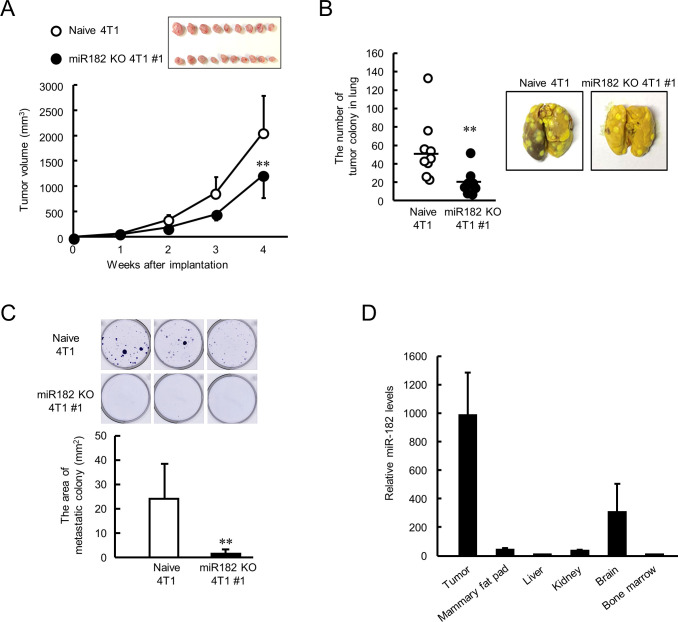
Figure 7. Suppression of malignant properties of 4T1 tumor by knockout of miR-182.

(A) The ability of tumor growth in mice implanted with naive or miR-182 KO 4T1 cells. Values are the mean with SD (n = 9–10 animals). **p<0.01; significant difference compared with naive 4T1 cell-implanted mice at corresponding time points (F7, 63 = 39.494, p<0.001; two-way ANOVA with the Tukey–Kramer test). Top panel shows the photograph of tumors isolated from each 4T1 cell implanted mice 5 weeks after implantation. (B) The number of pulmonary tumor colonies in mice implanted with naive or miR-182 KO 4T1 cells. Left panel shows the quantification of the number of tumor colonies in lungs (n = 9 animals). **p<0.01; significant difference from naive 4T1 group(t16 = 2.993; Student’s t-test). The right panels show representative photographs of pulmonary tumor colonies of naive or miR-182 KO 4T1 cells implanted in mice. Pulmonary tumor colonies were assessed 5 weeks after implantation. (C) The number of metastatic colonies isolated from tumor-bearing mice femora bone marrow. The top panels show the representative photograph of tumor colonies stained by crystalbiolet. The bottom panel shows the quantification of the area of tumor colonies. Values show mean with SD (n = 6 animals). **p<0.01; significant difference from naive 4T1 cells (t10 = 3.354, Student’s t-test). (D) The organ distribution of miR-182 in naive 4T1-bearing mice. Data were normalized by the 18 s rRNA levels. Values are the mean with SD (n = 3 animals). The value of bone marrow is set at 1.0.

Figure 7—source data 1. This spreadsheet contains the source for Figure 7.

Figure 7.

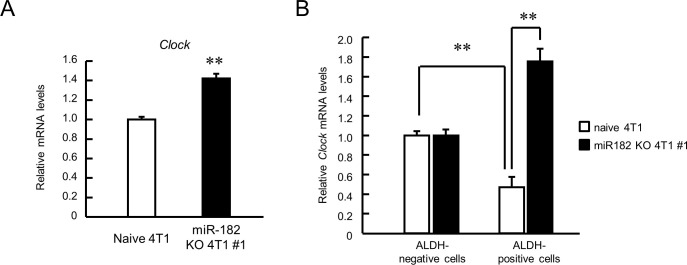
Figure 7—figure supplement 1. The expression of CLOCK in miR-182 KO 4T1 cell #1-bearing mice tumor.

Figure 7—figure supplement 1.

(A) The mRNA expression levels of Clock derived from whole tumor. Values are the mean with SD (n = 3 animals). The value of naive 4T1 group is set at 1.0. **p<0.01; significant difference between two groups (t4 = 14.173, Student’s t-test). (B) The mRNA expression levels of Clock derived from each sorted ALDH-negative cells or ALDH-positive cells. Values are the mean with SD (n = 3 animals). The value of each ALDH-negative cells group is set at 1.0. **p<0.01; significant difference between two groups (F3,11 = 98.647, p<0.01, ANOVA with the Tukey–Kramer post hoc test).
Figure 7—figure supplement 1—source data 1. This spreadsheet contains the source for Figure 7—figure supplement 1.
Figure 7—figure supplement 2. The expression levels of hsa-miR-182 in breast tumor and normal mammary gland derived from patients.
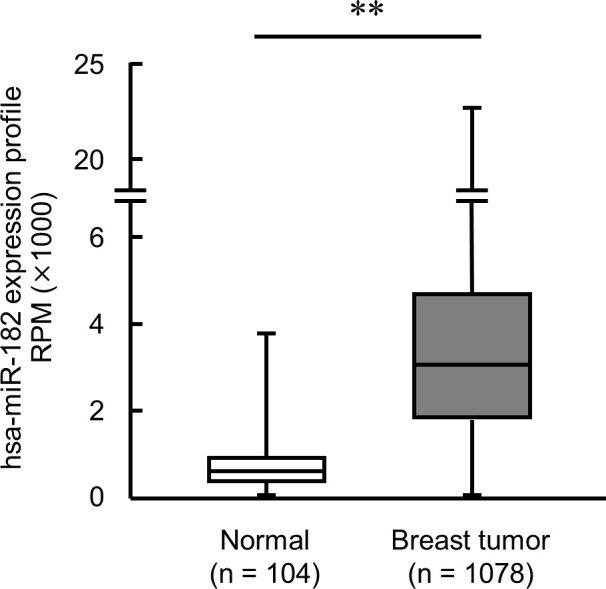
Figure 7—figure supplement 2.

Data were obtained from miR-TV database. **p<0.01; significant difference between two groups (Student’s t-test).
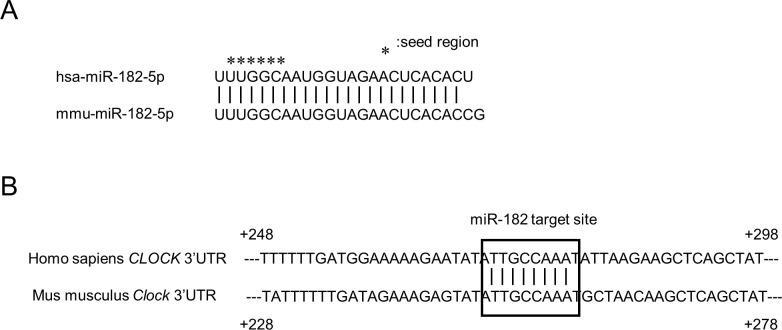
Figure 7—figure supplement 3. Sequence conservation of miR-182.

Figure 7—figure supplement 3.

(A) The alignment of hsa-miR-182–5 p and mmu-miR-182–5 p. * shows seed region of each miRNA. (B) The alignment of human CLOCK 3’UTR and mouse Clock 3’UTR. The nucleotide immediately after the stop codon in exon 23 of each CLOCK gene was defined as +1.
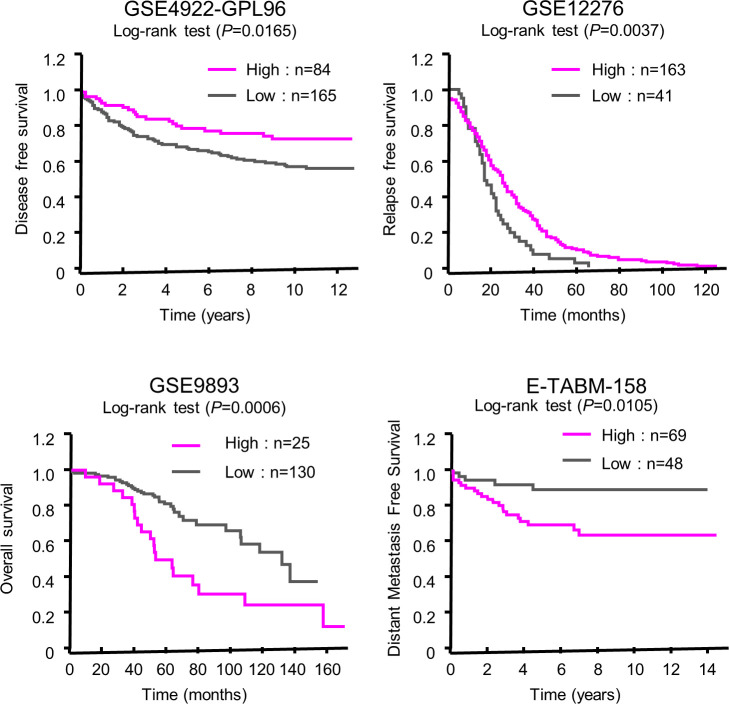
Figure 7—figure supplement 4. Database analysis of clinical relevance of CLOCK expression to patients' outcome.

Figure 7—figure supplement 4.

The data were obtained from the PrognoScan database (http://www.prognoscan.org/). Association of gene expression with patient survival was evaluated by minimum p-value approach. Patients were divided into high- or low-CLOCK expression groups at all possible cutoff points. The differences of any two groups were estimated by the log-rank test.