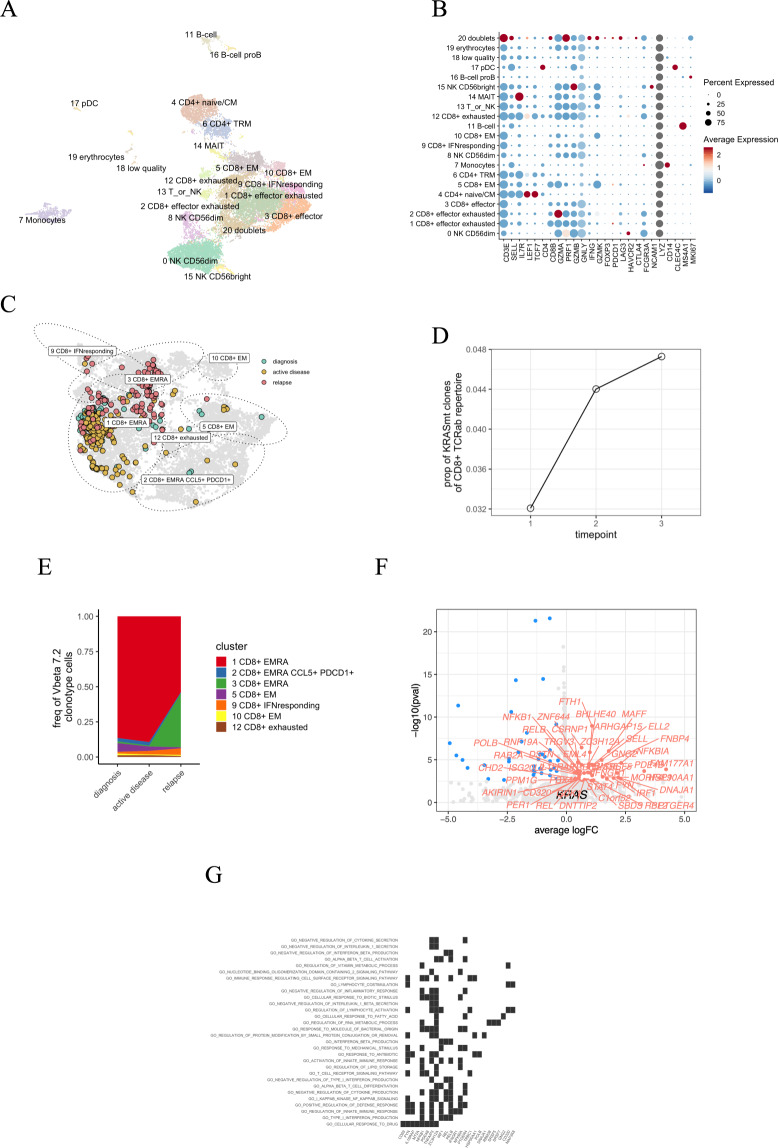
Fig. 7. AA-3 scRNA + TCRab-seq analysis.
A Two-dimensional UMAP projection of the transcriptomes of CD45+ lymphocyte cells pooled from three time points from bone marrow. A total of 22,407 cells are annotated in 21 distinct clusters, 7 of which that can be annotated as CD8+ T cells but only 2 as CD4+ T cells. B Dot plot showing the canonical markers used to annotate the clusters. C Focused two-dimensional UMAP projection of re-embedded CD8+ lymphocyte cells. The encircled dots are the TCRBV04-03 clone colored by different time points, where turquoise is the diagnostic (sample 1), yellow is follow-up (sample 2), and red is from relapse (sample 3). Most of the TCRBV04-03 clonotype cells can be classified as 1 CD8+ TEMRA. D The proportion of TCRBV04-03 clonotype cells from the total CD8+ repertoire from the single-cell TCRab data. E The relative abundances of TCRBV04-03 clone’s phenotype during treatment. F Volcano plot showing differentially expressed genes between clonotype of interest (to the right, significant shown in red) and cells from other clonotypes from the 1 CD8+ TEMRA cluster (to the left, significant shown in blue). G Gene set enrichment analysis (GSEA) results from the differential expression analysis. Shown here are GO categories enriched (FDR qval < 0.05) to the TCRBV04-03 clone.

