

Abstract
The theory of cancer immunoediting, which describes the dynamic interactions between tumors and host immune cells that shape the character of each compartment, is foundational for understanding cancer immunotherapy. Few models exist that facilitate in-depth study of each of the three canonical phases of immunoediting: elimination, equilibrium, and escape. Here, we utilized NPK-C1, a transplantable prostate tumor model that we found recapitulated the three phases of immunoediting spontaneously in immunocompetent animals. Given that a significant portion of NPK-C1 tumors reliably progressed to the escape phase, we were able to delineate cell types and mechanisms differentially prevalent in equilibrium versus escape phases. Using high-dimensional flow cytometry, we found that activated CD4+ effector T cells were enriched in regressing tumors, highlighting a role for CD4+ T cells in antitumor immunity. CD8+ T cells were also important for NPK-C1 control; specifically, central memory-like cytotoxic CD8+ T cells. Regulatory T cells (Tregs), as a whole, were counterintuitively enriched in regressing tumors; however, high-dimensional analysis revealed their significant phenotypic diversity, with a number of Treg subpopulations enriched in progressing tumors. In the myeloid compartment, we found that iNOS+ DC-like cells are enriched in regressing tumors, whereas CD103+ DCs were associated with late-stage tumor progression. In total, these analyses of the NPK-C1 model provide novel insights into the roles of lymphoid and myeloid populations throughout the cancer immunoediting process and highlight a role for multi-dimensional, flow-based analyses to more deeply understand immune cell dynamics in the tumor microenvironment.
Keywords: Immunoediting, Immune profiling, Prostate Cancer, CD4 T Cells, Dendritic Cells, Tregs
Introduction
The theory of cancer immunoediting describes how evolutionary pressures exerted by host immune responses shape the immunogenicity of emergent tumors (1–3). In turn, pro-survival adaptations by tumors shape the composition and character of host immune cells in a complex back-and-forth that evolves in the host over space and time. The outcome of this interplay may ultimately determine whether an evolving neoplasm becomes clinically apparent.
Three distinct phases of cancer immunoediting have been described: elimination, equilibrium, and escape (3). Central to the elimination phase are: CD103+ DCs driven by type I interferons to cross-present tumor antigens (4–6), poly-functional tumor-specific CD8+ T cells elaborating gamma interferon (IFNγ)(7,8), TH1-polarized CD4+ T cells (9,10), and innate inflammatory processes (11). These mechanisms have in part been defined using models driven to express model antigens for immunogenicity, or in response to immunomodulators that invigorate antitumor immunity (1). By contrast, the escape phase is characterized by: T-cell dysfunction manifested in numeric deficiency and/or functional exhaustion (8,12), insufficient antigen presentation due to DC skewing or exclusion, increased regulatory T-cell (Treg) function (13–15), an increased frequency of suppressive macrophages and myeloid-derived suppressor cells (MDSCs)(16), metabolic perturbations in nutrient deprivation and/or hypoxia (17,18), and increased local expression of coinhibitory checkpoint ligands (19). The equilibrium phase, however, has proven much more difficult to study. The most informative model to date has been the 3’methylcholanthrene carcinogenesis model, which generates palpable stable masses that take upwards of 200 days to form progressive tumors (20). This model shows that equilibrium is based on adaptive immunity to restrain tumor growth. However, significant gaps in the knowledge of what occurs at this phase remain, and models to study the equilibrium phase are therefore needed.
To address this knowledge gap, we studied a transplantable murine model of prostate cancer that we found to spontaneously and consistently recapitulate the three phases of immunoediting. This model, NPK-C1, was originally derived from a lung metastasis of NPK mice (Nkx3.1CreERT2/+; Ptenflox/flox; KrasLSL-G12D/+; R26R-LSL-YFP/+) that generate bone-metastatic, castrate-resistant prostate tumors (21,22). To define immune subsets with critical roles throughout the entire course of immunoediting, we utilized longitudinal 30-parameter spectral flow cytometry for phenotyping and performed in vivo depletion studies at early and late phases for functional validation. We defined subsets enriched in tumors that transition from the equilibrium to the escape phase versus those that do not. Finally, we explored unique cellular phenotypes (clusters) consistently associated with functional immunity at both the early and late phases of immunoediting. Together, these studies introduce a unique tumor model and provide a detailed view into the complex dynamics of T-cell and myeloid subpopulations over the course of immune editing in vivo.
Materials and Methods
Mice
Male C57BL/6J, B6 Albino, and J/NU mice (5–6 weeks old) were purchased from the Jackson Laboratory (Bar Harbor, ME). Mice were 6–8 weeks old at time of use. All animals were housed in strict accordance with NIH and American Association of Laboratory Animal Care regulations. All experiments and procedures for this study were approved by the Columbia University Medical Center Institutional Animal Care and Use Committee (IACUC).
Cell lines and biologic reagents
The NPK-C1 cell line (originally LM7304) was provided by Dr. Cory Abate-Shen at Columbia University. NPK-C1 cells were originally derived in 2011–2013 from a lung metastasis of NPK mice (for Nkx3.1CreERT2/+; Ptenflox/flox; KrasLSL-G12D/+; R26R-LSL-YFP/+) that utilize an inducible Cre under control of the Nkx3.1 homeobox gene promoter for temporal and spatial regulation of gene recombination in luminal prostate epithelial cells, leading to highly bone-metastatic, castrate-resistant prostate tumors (21). Prior to in vivo use, the cell line was validated for contamination using the Charles River CLEAR Panel through the Columbia University Institute for Comparative Medicine (ICM). NPK-C1 cells were maintained in complete RPMI medium (Corning; Corning, NY); supplemented with 10% fetal bovine serum (HyClone; Logan, UT), penicillin (100 U/mL), and streptomycin sulfate (100 mg/mL)(Gibco; Gaithersburg, MD). NPK-C1 cells at passage number 10 were thawed for all in vivo experiments, with implantations occurring within 2–3 passages after thawing. NPK-C1 cells were engineered to express luciferase (termed NPK-C1-Luc cells), by lentiviral transduction of a modified pHAGE PGK-GFP-IRES-LUC-W plasmid (Addgene # 46793), in which blue fluorescent-protein (BFP) was inserted in place of GFP by Gibson cloning (New England Biolabs, E2611) in order to allow for flow sorting and selection of BFP-IRES-Luciferase cells. Lentiviral particles were generated in HEK-293 cells (ATCC, Manassas, VA), using second generation packaging vectors (psPAX2 and pMD2.G (Addgene, Cambridge, MA, USA)).
Tumor challenge and depletion experiments
NPK-C1 cells at 70–90% confluence were harvested with 0.05% trypsin (Gibco, Gaithersburg, MD), washed with PBS, counted, and resuspended at 10×106 cells/mL in ice cold PBS. On day 0, 6–8 week old mice were implanted on the right flank with 1×10⁶ NPK-C1 cells. Beginning on day 6 post-implantation, tumor measurements were recorded every 2–3 days by digital caliper. For in vivo depletion experiments, mice received 250 μg/mL anti-CD4 (GK1.5 IgG2b) or anti-CD8 (2.43 IgG2b), alternating 50 μg/mL anti-Ly6G (1A8 IgG2a) and anti-rat IgGκ (MAR18.5 IgG2a), or isotype antibody (LTF-2 IgG2b) by intraperitoneal injection beginning either day 5 or day 17 post-implantation. All antibodies were purchased from Bio X Cell (Lebanon, NH). Please see respective figures for details on timing of implantation and harvest. For re-implantation studies, NPK-C1 or -C2 tumors were harvested and disaggregated as described for flow cytometry preparation. Tumor cell suspensions were cultured for 2 weeks in standard RPMI medium as above, and then were cryopreserved. In vivo-passaged cell lines were thawed and implanted in mice as described above. For cumulative growth curves, the average tumor volume +/− SD for each group was plotted until the first mouse in that treatment group was euthanized. Mice were sacrificed upon reaching either of the following criteria: (i) tumor volume equal to or greater than 1,000 mm3 or (ii) development of tumor ulceration > 5mm in diameter.
Orthotopic tumor challenge and bioluminescent imaging
For orthotopic implantation of NPK-C1 and NPK-C1-Luc cells, J/NU (nude), C57BL/6 or B6-Albino mice were anaesthetized by intraperitoneal injection of ketamine (100mg/kg) and xylazine (16mg/kg)(Patterson Vet Supply, Greely, CO), and an incision was made in the lower abdomen under IACUC approved protocols. Tumor cells were resuspended in PBS and 105 cells were injected in 30 µL into the left anterior prostate using a 30-gauge ½ inch needle on a Hamilton syringe. The incision site in the muscle layer was closed with surgical suture (Ethicon J385H Vicryl absorbable suture, size 5–0) and the skin incision by wound clips. The orthotopic growth of NPK-C1-Luc was monitored twice weekly by bioluminescence imaging using an IVIS Spectrum Optical Imaging System (Perkin Elmer, Waltham, MA). Ten minutes prior to imaging, mice were injected intraperitoneally with 150mg/kg D-luciferin (Perkin Elmer, Waltham, MA). Images were generated and quantified using Living Image Software (Perkin Elmer, Waltham, MA).
Flow cytometry
Following euthanasia, NPK-C1 tumors were measured by digital caliper, harvested, weighed, and diced into 70μm filters (Thermo Fisher; Waltham, MA) in 6-well plates containing 5mL of X-VIVO 15 media (Lonza; Basel, Switzerland) supplemented with 1 mg/mL collagenase H (Sigma; St. Louis, MO) and 160 μg/mL DNAse (Roche; Basel, Switzerland). Tumors were digested in a 37o incubator for 40 minutes. Digested tumors were physically passed through the 70μm filter using syringe plungers and washed with complete RPMI media to obtain single cell suspensions. Cells were counted, washed with PBS, and then stained with the Zombie NIR Fixable Viability Kit at 1:1000 in PBS (BioLegend; San Diego, CA) for 15 minutes. Samples were washed with FACS buffer (consisting of PBS, 3% FBS, 1% pen/strep, 1 mM EDTA, and 10 mM HEPES [Gibco; Gaithersburg, MD]), blocked with 1:50 TruStain Mouse FcX Reagent (BioLegend; San Diego, CA) in FACS buffer on ice for 15 minutes, and then stained with surface antibodies in FACS buffer (150 μL total volume) supplemented with 50 μL Brilliant Stain Buffer (BD; Franklin Lakes, NJ) for 45 minutes on ice in the dark. After washing with FACS buffer, cells were fixed using the FoxP3 Fix/Perm Kit (eBioscience; San Diego, CA) for 30–60 minutes on ice in the dark. Following fixation, samples were stained with intracellular antibodies in 1X FoxP3 kit perm wash for 45 minutes on ice in the dark. Following washing with 1X perm wash and FACS buffer, samples were filtered through 70 μm blue cap tubes (Corning; Corning, NY) and acquired on a 3-laser (RBV) Cytek Aurora spectral flow cytometer (Cytek; Fremont, CA). All antibodies were purchased from BioLegend (San Diego, CA), BD (Franklin Lakes, NJ), or Thermo Fisher (Waltham, MA) as described in Supplementary Table S1. Ultracomp eBeads and ArC Amine Reactive beads (Thermo Fisher; Waltham, MA) were used for single reference controls. All downstream data analysis was performed using FlowJo v10.6 (Treestar, Ashland, OR). Sample gating trees with cell population-defining markers used for conventional flow cytometry data analysis are described in Supplementary Figure S2.
Ex vivo TIL restimulation and intracellular cytokine staining
NPK-C1 tumors were harvested and dissociated to single-cell suspensions as described above. 5–10×106 total cells were resuspended in 50 μL X-VIVO15 medium (Lonza; Basel, Switzerland) and plated in a 96-well round bottom plate with 50 μL of X-VIVO15 medium containing phorbol myristate acetate (PMA) and ionomycin (InvivoGen; San Diego, CA) to final concentrations of 50 ng/mL PMA and 500 ng/mL Ionomycin. After 30 minutes, 100 μL of X-VIVO15 medium containing PMA/ionomycin and Brefeldin A at a final concentration of 5 μg/mL (BioLegend; San Diego, CA) were added. After 3.5 hours (4 hours total stimulation), cells were washed and fixed with the FoxP3 Fix/Perm Kit (eBioscience; San Diego, CA) for 30–60 minutes on ice in the dark. Cells were then stained for surface and intracellular markers as described and acquired on a Cytek Aurora spectral flow cytometer (Cytek; Fremont, CA). All antibodies used are listed in Supplementary Table S1.
Statistical analyses
For longitudinal immune profiling, two independent replicate experiments were performed; each included n = 5–15 mice per group; day 10 = 15 mice, day 15 = 15 mice, day 20 = 15 mice, and day 24 = 25 mice. For in vivo depletion studies, two independent replicate experiments were performed consisting of 5–10 mice per group. Student’s T test or two-way ANOVA with Tueky’s correction were used for individual frequency comparisons, Holm-Sidak correction was used for multiple comparisons of tumor growth curves, and standard linear regression was used for all correlations. To control for multiple linear regression comparisons, Bonferroni and Benjamini-Hochberg corrections were used as shown in each respective figure. These statistics were run using GraphPad Prism version 9 (San Diego, CA).
For high-dimensional visualization and clustering of flow cytometry data, t stochastic neighbor embedding (tSNE) was performed within FlowJo, with 3000 iterations and k=30 for all projections. Clustering was performed on all CD45+ cells using the FlowSOM implementation within FlowJo, and selected metaclusters were isolated for successive tSNE projections and FlowSOM clustering as described in respective figures. For longitudinal cluster frequency comparisons, statistical significance was calculated using 2-way ANOVA with Tukey’s correction for multiple comparisons. To generate phenotyping heat maps, each cluster’s median MFI for all phenotyping markers was exported from FlowJo. Expression normalization was used to scale each MFI to the minimum and maximum cluster MFI for each marker in a given heat map. The following equation was used: Normalized MFI = [(cluster MFI) – MIN(all cluster MFIs)] / [MAX(all cluster MFIs) – MIN(all cluster MFIs)]. For markers with universally high or low MFIs within a given compartment (for CD8: TCR-β, CD8, CD4, KLRG1, CX3CR1, CD86; for CD4: TCR-β, CD8, CD4, CD62L), scaling was performed against the minimum and maximum of all immune clusters. For bootstrapping, 10 mice in a group were sampled at random, and the average frequency of a given cluster was compared to that from 10 random mice chosen from the comparison group (e.g. day 10 group vs. day 15 group). This procedure was repeated 100 times without replacement to generate average fold-change values with an approximated deviation. Bootstrapping and differential fluorescence analysis was performed in R version 3.6.1.
Results
Longitudinal phenotyping captures global dynamics during immunoediting
The NPK-C1 cell line was derived from a lung metastasis of an NPK mouse that utilizes an inducible Cre expressed under control of the Nkx3.1 homeobox gene promoter for temporal and spatial regulation of gene recombination in luminal prostate epithelial cells (21). As a genetically engineered mouse model (GEMM), the NPK model generates castrate-resistant prostate tumors that recapitulate the clinical tendency of prostate cancer to metastasize to bone (22). To study the growth dynamics of NPK-C1 tumors in immune-competent mice, we implanted NPK-C1 cells subcutaneously into C57BL/6J mice, as well as into T cell-deficient athymic J/NU (nude) mice. We observed a clear difference in tumor growth dynamics between strains. Whereas NPK-C1 grew progressively in immune-deficient J/NU mice, tumors spontaneously regressed around day 10 in C57BL/6 mice, consistent with immune-mediated regression (23). However, these tumors were not immediately eliminated; they remained at a size of ~100–200mm3 for at least 10 days, at which point roughly 60% of tumors progressed rapidly, around 30% of tumors remained in prolonged equilibrium but ultimately escaped, and roughly 10% of tumors ultimately underwent rejection (Fig. 1A, Supplementary Fig. S1A–B). These growth kinetics were also observed when NPK-C1 was orthotopically implanted into the anterior prostate (Supplementary Fig. S1C–D). Re-implantation of escaping NPK-C1 tumors into naïve mice yields progressively growing tumors, further suggesting NPK-C1 tumors undergo immune editing in vivo (Supplementary Fig. S1E). Taken together, these data support the notion that the in vivo growth kinetics of NPK-C1 tumors in immunocompetent mice are consistent with the canonical “three E’s” of cancer immunoediting: elimination, equilibrium, and escape (Fig. 1A)(3).
Figure 1. Conventional Immunophenoptying of NPK-C1 Tumors Over Time.
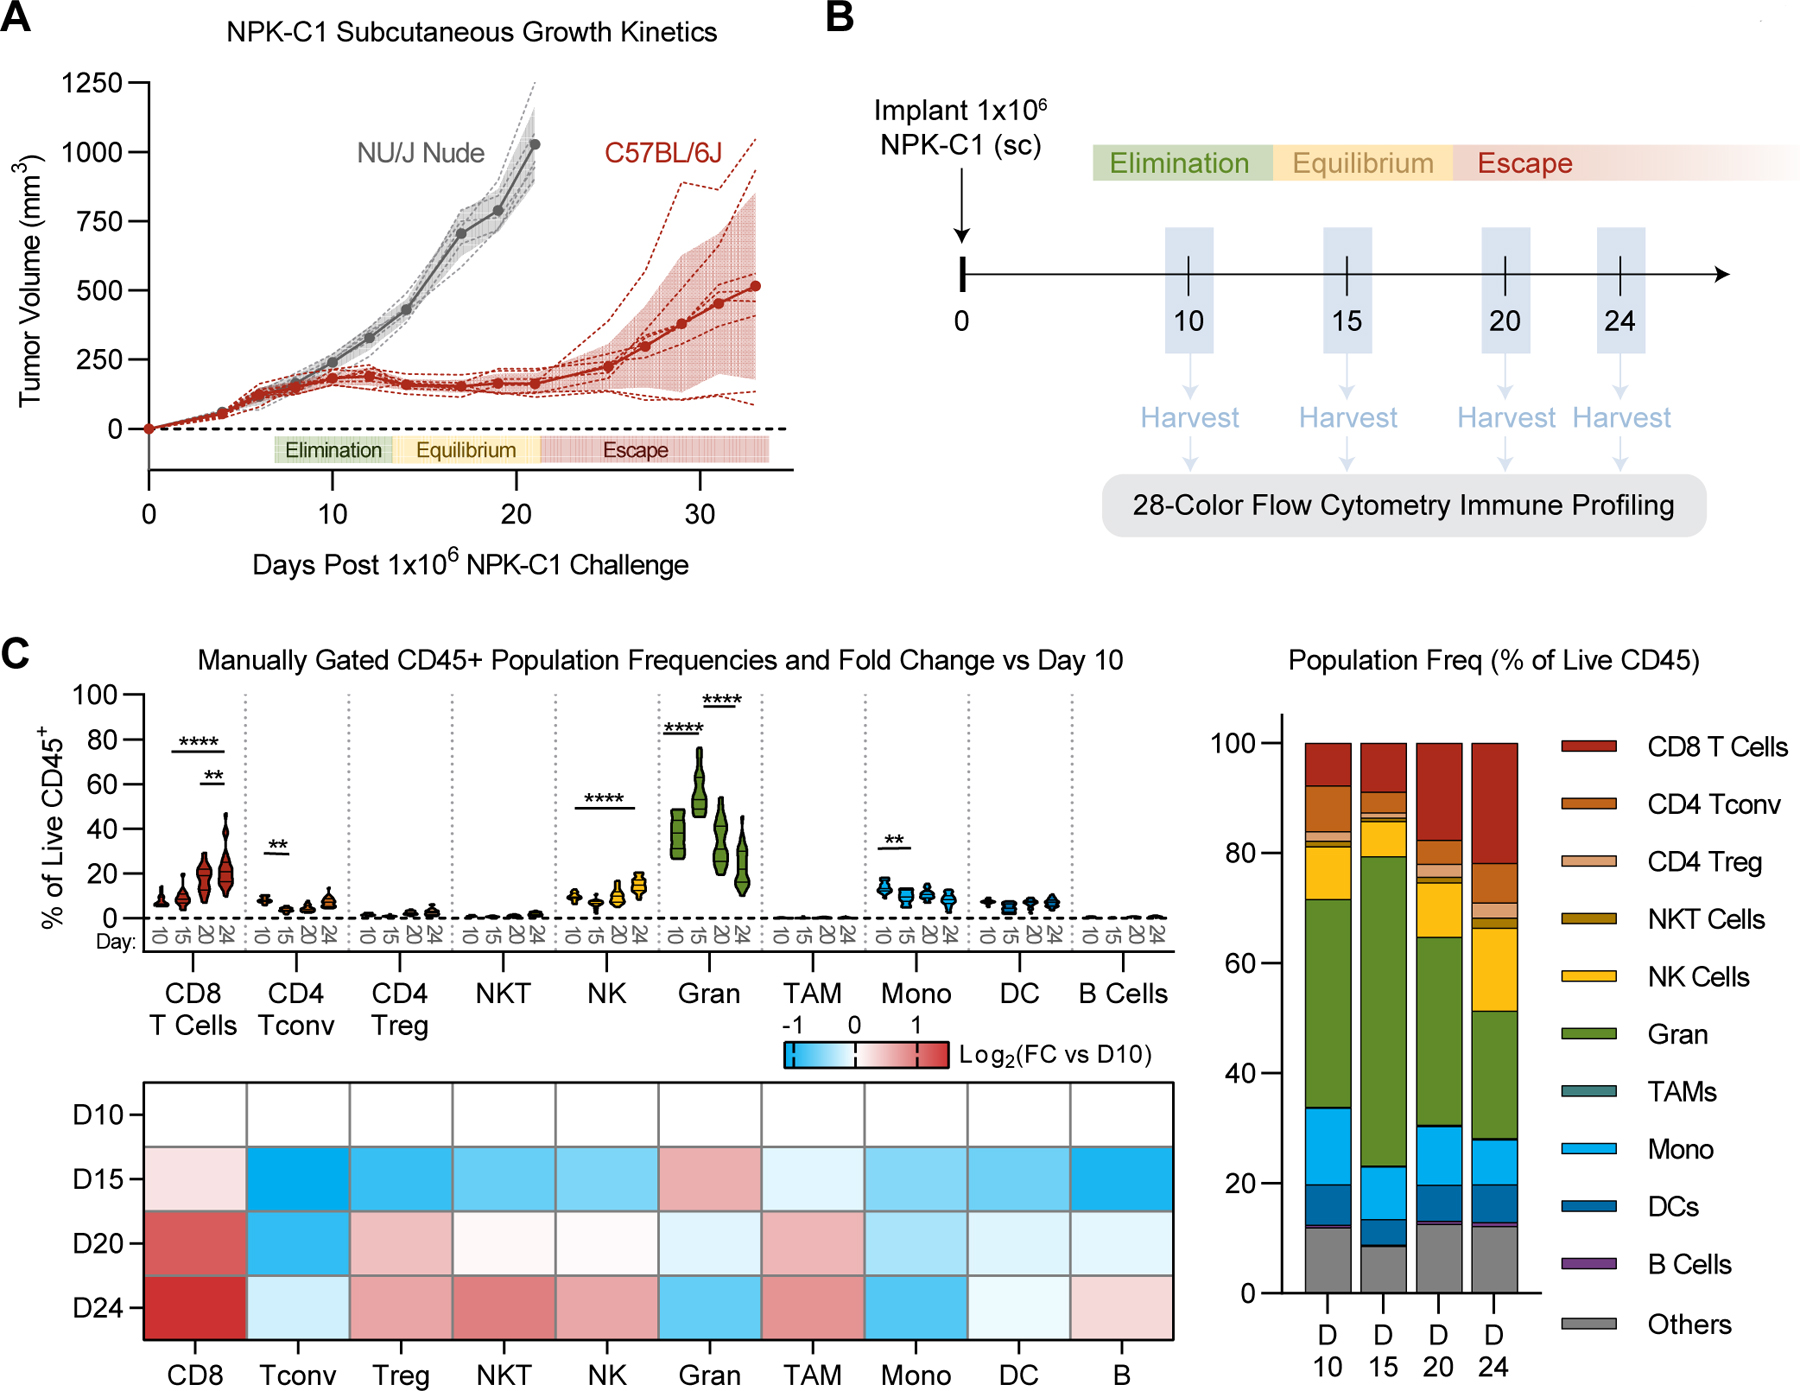
(A) NPK-C1 growth kinetics in C57BL/6J and NU/J mice. n=5–10 mice/group and representative of 3 independent experiments. Shaded color denotes error (SD) for each growth curve. (B) Schema for longitudinal flow cytometry analysis. (C) Frequencies of manually gated immune populations as a percent of live CD45+ cells at the indicated timepoints. In violin plots, horizontal lines denote median and quartile values. Heatmap:Log2 normalized fold change of each immune population relative to its day 10 frequency. FC: fold-change, Gran: granulocytes, TAM: tumor-associated macrophages, Mono: monocytes. See Supplementary Table S1 for reagent details. Statistical significance was calculated using 2-way ANOVA with Tukey’s correction for multiple comparisons. ns=not significant, *p<0.05, **p<0.01, ***p<0.001, ****p<0.0001.
To quantify the immune composition of NPK-C1 tumors across the immunoediting process, we harvested subcutaneously implanted NPK-C1 tumors for flow cytometry at days 10, 15, 20, and 24, representing tumors at elimination, equilibrium, early and late escape phases, respectively (Fig. 1B). To facilitate these studies, we developed a 28-color antibody panel designed for tumor immune phenotyping using the Cytek Aurora spectral flow cytometer (Supplementary Table S1). With this panel, we defined key canonical immune populations of interest in NPK-C1 tumors using standard biaxial gating (Supplementary Fig. S2A). On day 10 (elimination phase), NPK-C1 tumors contained roughly equal frequencies of CD8+ T cells, CD4+ conventional T (Tconv) cells, and NK cells (~10% of CD45 each; Fig. 1C). The myeloid compartment was dominated by granulocytes (~40% of CD45), followed by monocytes (~15% of CD45) and dendritic cells (DCs; ~8% of CD45). As NPK-C1 tumors transitioned to equilibrium phase at day 15, we observed an expansion of the granulocyte compartment (to ~55% of CD45; p<0.0001), with corresponding contractions in the CD4+ Tconv compartment (to ~2% of CD45; p=0.005) and monocyte compartment (to 10% of CD45; p=0.0073). CD8+ T-cell frequencies did not significantly change at this stage. On days 20 and 24, as NPK-C1 tumors progressed to the escape phase, the granulocyte compartment retracted to 20% of CD45 (P<0.0001). At this later point, a significant CD8+ T-cell expansion (up to ~25% of CD45, p<0.0001), together with moderate increases in NK-cell frequencies (to ~15% of CD45; p<0.0001) and a trend toward an increase in CD4+ Tconv cells, was observed. However, no significant changes in overall frequency of CD45+ cells between each phase was seen, although we did observe a greater deviation from the mean at later time points (Supplementary Fig. S2B). Thus, these conventional immunophenotyping studies showed that CD4+ Tconv cells were present at high frequencies during the elimination phase but were lost during transition to equilibrium. This coincided with a temporary expansion of granulocytes, which were numerically replaced in part by CD8+ T cells during the escape phase.
CD4+ and CD8+ T cells restrain tumor progression throughout immunoediting
Based on the above observations, we tested whether CD8+ T cells, CD4+ T cells, and/or granulocytes had functional significance in restraining tumor progression during immunoediting of NPK-C1. For these studies, we performed antibody-mediated in vivo depletion experiments at both early and late stages (Fig. 2A, Fig. 2C). First, we administered depleting anti-CD4 or anti-CD8 on days 5 and 8 post-implantation to determine each cell type’s contribution to elimination. We verified >95% depletion of both populations in spleen and tumor by flow cytometry (Supplementary Fig. S3). We found that depletion of CD8+ T cells or CD4+ T cells de-repressed NPK-C1 growth kinetics, indicating both CD8+ and CD4+ T cells were required to suppress NPK-C1 progression to the escape phase (Fig. 2B). By contrast, depletion of granulocytes using alternating daily injections of anti-Ly6G (clone 1A8) and a secondary depleting antibody (24) showed no significant impact on tumor growth, suggesting that granulocytes were not necessary for elimination of NPK-C1 (Supplementary Fig. S4).
Figure 2. Early or Late Depletion of CD4+ or CD8+ T Cells Promotes Tumor Outgrowth.
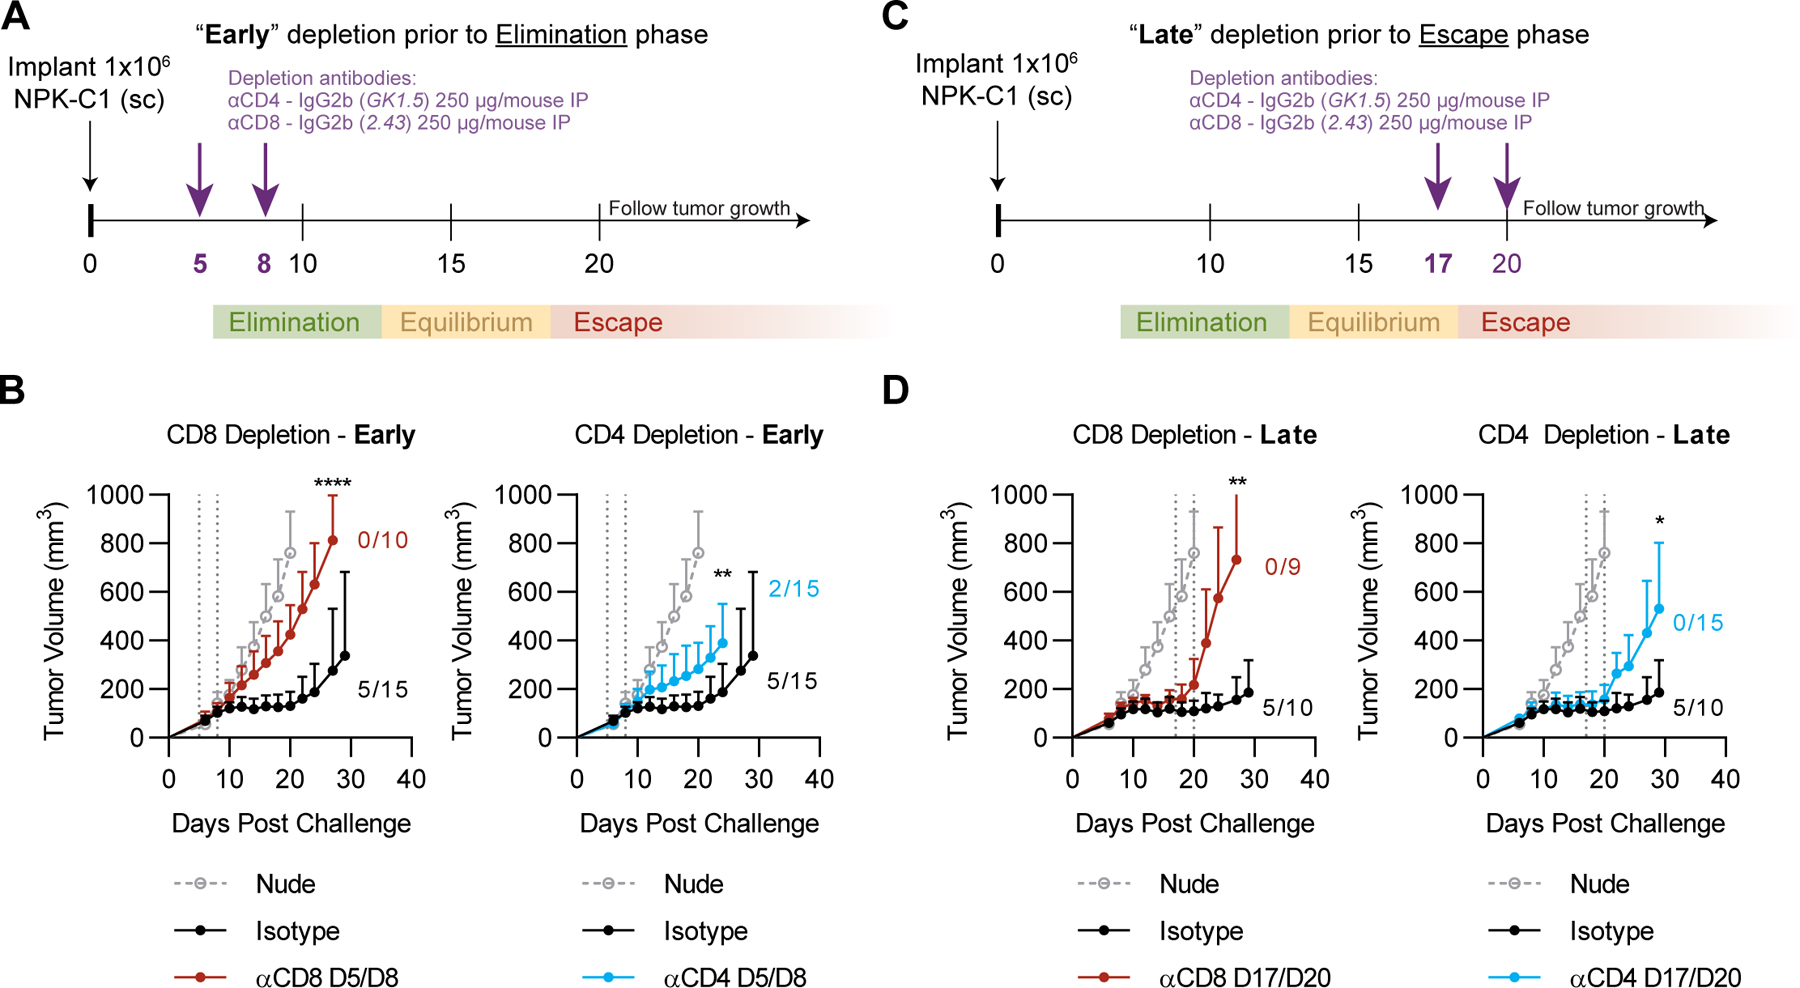
(A) Schema for early in vivo depletion experiment using anti-CD4 or anti-CD8 injected intraperitoneally (IP) at the indicated timepoints. (B) Average tumor growth curves for the early in vivo depletion experiment. (C) Schema for late in vivo depletion experiment. (D) Average tumor growth curves for late in vivo depletion experiment using anti-CD4 or anti-CD8 injected IP at the indicated timepoints. Error bars represent SD from the mean tumor volume. Numbers listed represent frequencies of mice with sustained equilibrium (tumor volume <200mm3 by day 30) per group in all experiments. Statistical significance was calculated using student’s T-test with Holm-Sidak correction for multiple comparisons. ns=not significant, *p<0.05, **p<0.01, ***p<0.001, ****p<0.0001.
To test the requirement for these cells during the equilibrium and early escape phases, we administered depleting antibodies on days 17 and 20. Again, we found that CD8+ or CD4+ T-cell depletion promoted NPK-C1 growth, indicating that both populations are required to restrain tumor progression at the late equilibrium/early elimination phase (Fig. 2D). By contrast, granulocyte depletion beginning on day 17 yielded no clear phenotype, suggesting granulocytes were not involved NPK-C1 control or escape, although we acknowledge the relative difficulty of fully depleting granulocytes with 1A8 (Supplementary Fig. S3–4). Regarding the T-cell compartment, these data support the well-established role of CD8+ T cells as critical effectors of tumor control throughout immunoediting and are consistent with a growing body of literature implicating CD4+ T cells as critical effectors of the antitumor immune response (25).
Bulk CD45+ cell and Treg frequencies are inversely correlated with tumor size
As shown in Figure 1, at approximately day 20, tumor growth in the NPK-C1 model bifurcated between progressing tumors and those that remained in equilibrium. This delayed emergence of progression, which was not observed in immunocompromised mice, afforded a unique opportunity to compare immunological escape to sustained equilibrium in synchronously implanted, untreated tumors. For such analyses, we focused on day 24 samples, where we observed a roughly even split between progressing tumors and those which were stable or regressing, labeled together as “regressors” (Fig. 3A–B). Our initial analyses focused on immune cell populations defined by canonical gating strategies (Supplementary Fig. S2A); in later analyses (Figures 4–6), we performed unsupervised clustering to define novel populations. These experiments showed that regressing tumors on average contained higher frequencies of CD45+ cells compared to progressors (p=0.039)(Fig 3C). We also found a statistically significant direct correlation between tumor size and CD45+ frequency (p=0.0129)(Fig. 3D). However, this correlation was only significant on days 24 and 20, and not at earlier (day 10 or 15) timepoints (Supplementary Fig. S5). Using conventionally defined (canonical) populations, we found that the only immune cell population with significant enrichment in regressors relative to progressors was Tregs (Fig. 3E; p<0.003). Tregs were the only population whose frequency correlated significantly with decreased tumor size on day 24 (Fig. 3F–G; p=0.012). Of note, Tregs here were defined broadly, thus it is possible that subpopulations within the FoxP3+ T-cell subset could show the expected direct correlation with tumor mass. Granulocytes showed a trend toward correlation with larger tumors; however, this did not reach statistical significance after correcting for multiple comparisons (Fig. 3F–G; p=0.089). Functionally, CD8+ and CD4+ T-cell cytokine expression potential was unchanged on average throughout immunoediting phases, as measured by intracellular cytokine staining upon ex vivo restimulation. However, on day 24, we observed significant negative correlations between expression of IFNγ, granzyme B, and/or IL2 and tumor mass (Supplementary Fig. S6). These findings suggest bulk population analyses were insufficient to identify functionally significant immune subsets involved in the equilibrium to escape transition in NPK-C1 tumors.
Figure 3. Correlations Between Conventional Immune Populations And Tumor Regression.
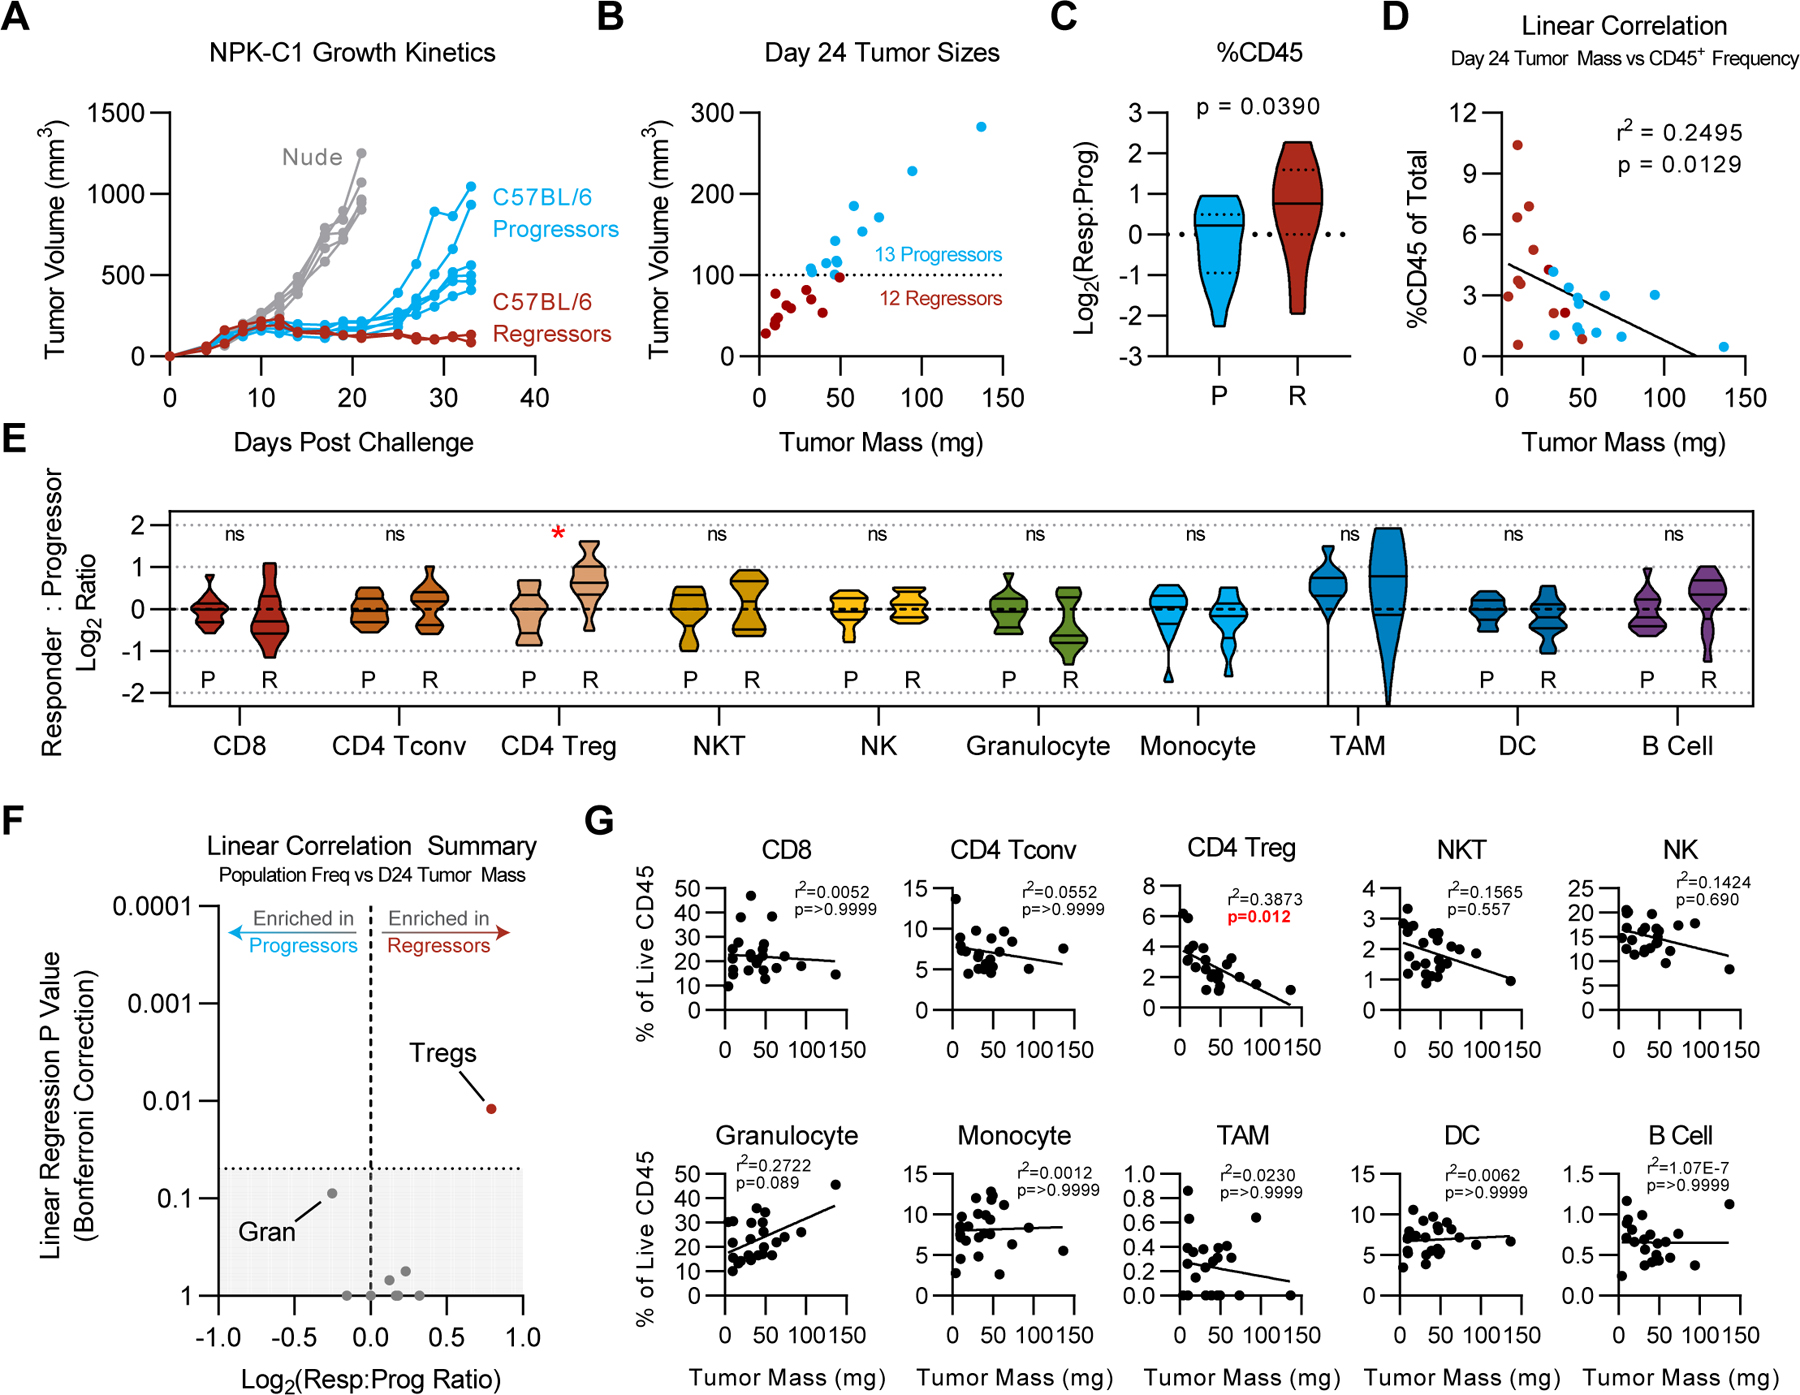
(A) Manual annotations of progressor vs regressor mice in NPK-C1 growth curves shown in Fig. 1A. (B) Tumor size by mass vs. volume on day 24. (C) Log2 ratio of responder %CD45+ vs. average %CD45+ frequency of progressors. (D) Correlation plot of tumor mass vs. %CD45+ for all samples shown in panel B. (E) Log2 ratio of responder %CD45+ relative to the average %CD45+ frequency of progressor mice. Statistical significance was calculated using student’s T-test, with Holm-Sidak correction for multiple comparisons when appropriate. ns = not significant, *p<0.05, **p<0.01, ***p<0.001, ****p<0.0001. (F) Significance of simple linear regressions as shown in G vs. Log2 responders vs. progressor ratio. Gran: granulocytes. Shaded area represents linear regression p values >0.05. (G) Simple linear regressions of each immune population frequency vs. tumor mass, using Bonferroni correction for multiple comparisons.
Central memory-like CD8+ T-cell frequency correlates with regression in NPK-C1
To leverage the high dimensionality of this longitudinal flow dataset, we used dimensionality reduction and minimally supervised clustering algorithms. Specifically, we concatenated all live CD45+ cells from each tumor, then performed t-stochastic neighbor embedding (tSNE) to generate a two-dimensional projection of all CD45+ cells arranged according to their relative similarity in 28-parameter space. For those clustering studies, we utilized the FlowSOM algorithm (26). After identifying common bulk immune populations as metaclusters in an unbiased fashion (Fig. 4A), we next sought to identify phenotypically unique subpopulations within key metaclusters by performing an additional round of unbiased, algorithm-based clustering on each population of interest. Thus, first we isolated the CD8+ T-cell metacluster, then performed tSNE and FlowSOM using markers with variable expression in the CD8+ T-cell compartment. This analysis yielded a CD8+ T-cell tSNE map with 7 subclusters designated Tc1-Tc7 (Fig. 4B). We next used the Mann-Whitney U test to verify that each cluster possessed at least one phenotypic marker that was statistically differentially expressed relative to all other cells (Supplementary Table S2). We implemented this into our analysis to ensure clusters were meaningful and to exclude any potential clustering based primarily on noise in the high-dimensional data. For each cluster, we next enumerated the number of cells within the cluster on a per-tumor basis to calculate the frequency of each cluster as a percentage of CD45+ cells over time in the longitudinal dataset (Fig. 4C). Finally, we calculated the normalized MFI for each marker of interest in each cluster to facilitate interpretation of cell phenotype and inferred functional state (Fig. 4C). We profiled both subcutaneous and orthotopically-implanted NPK-C1 tumors by this approach, and, finding them largely concordant, focused our analyses on our larger subcutaneous tumor dataset (Supplementary Fig. S7). These studies showed that CD8+ T-cell clusters Tc1-Tc4 were relatively numerous in NPK-C1 tumors, whereas Tc5-Tc7 were rare cells. In general, Tc1-Tc4 increased significantly on days 20 and/or 24 and could be differentiated, in part, by expression of PD-1, Tim-3, and Ly6C. Correlating each cluster frequency with tumor mass showed that only two of the CD8+ T-cell clusters correlated significantly (Fig. 4D–E). One cluster, Tc7, was a granzyme B- CD8+ population with moderate PD-1 and Tim-3 expression and low expression of CD44 (Fig. 4C). Although undetectable in tumors <25 mg, Tc7 represented ≥1% of CD45 in tumors with a mass >50 mg (Fig. 4E) and may represent an “exhausted” population. By contrast, Tc5 CD8+ T cells were more common, and their frequency correlated significantly with reduced tumor size. Tc5 expressed CD62L, Ly6C, and granzyme B, while lacking PD-1 (Fig. 4C) and appeared to represent an activated central memory-like CD8+ cluster. Together, these data highlight the significant heterogeneity within CD8+ T cells that infiltrate NPK-C1 tumors and suggest that central memory-like CD8+ T cells are associated with productive antitumor immunity that suppresses tumor escape, whereas progressive tumors are enriched with granzyme Bneg potentially exhausted CD8+ T cells.
Figure 4. Correlations Between Unsupervised CD8+ T-cell Clusters and Tumor Regression.
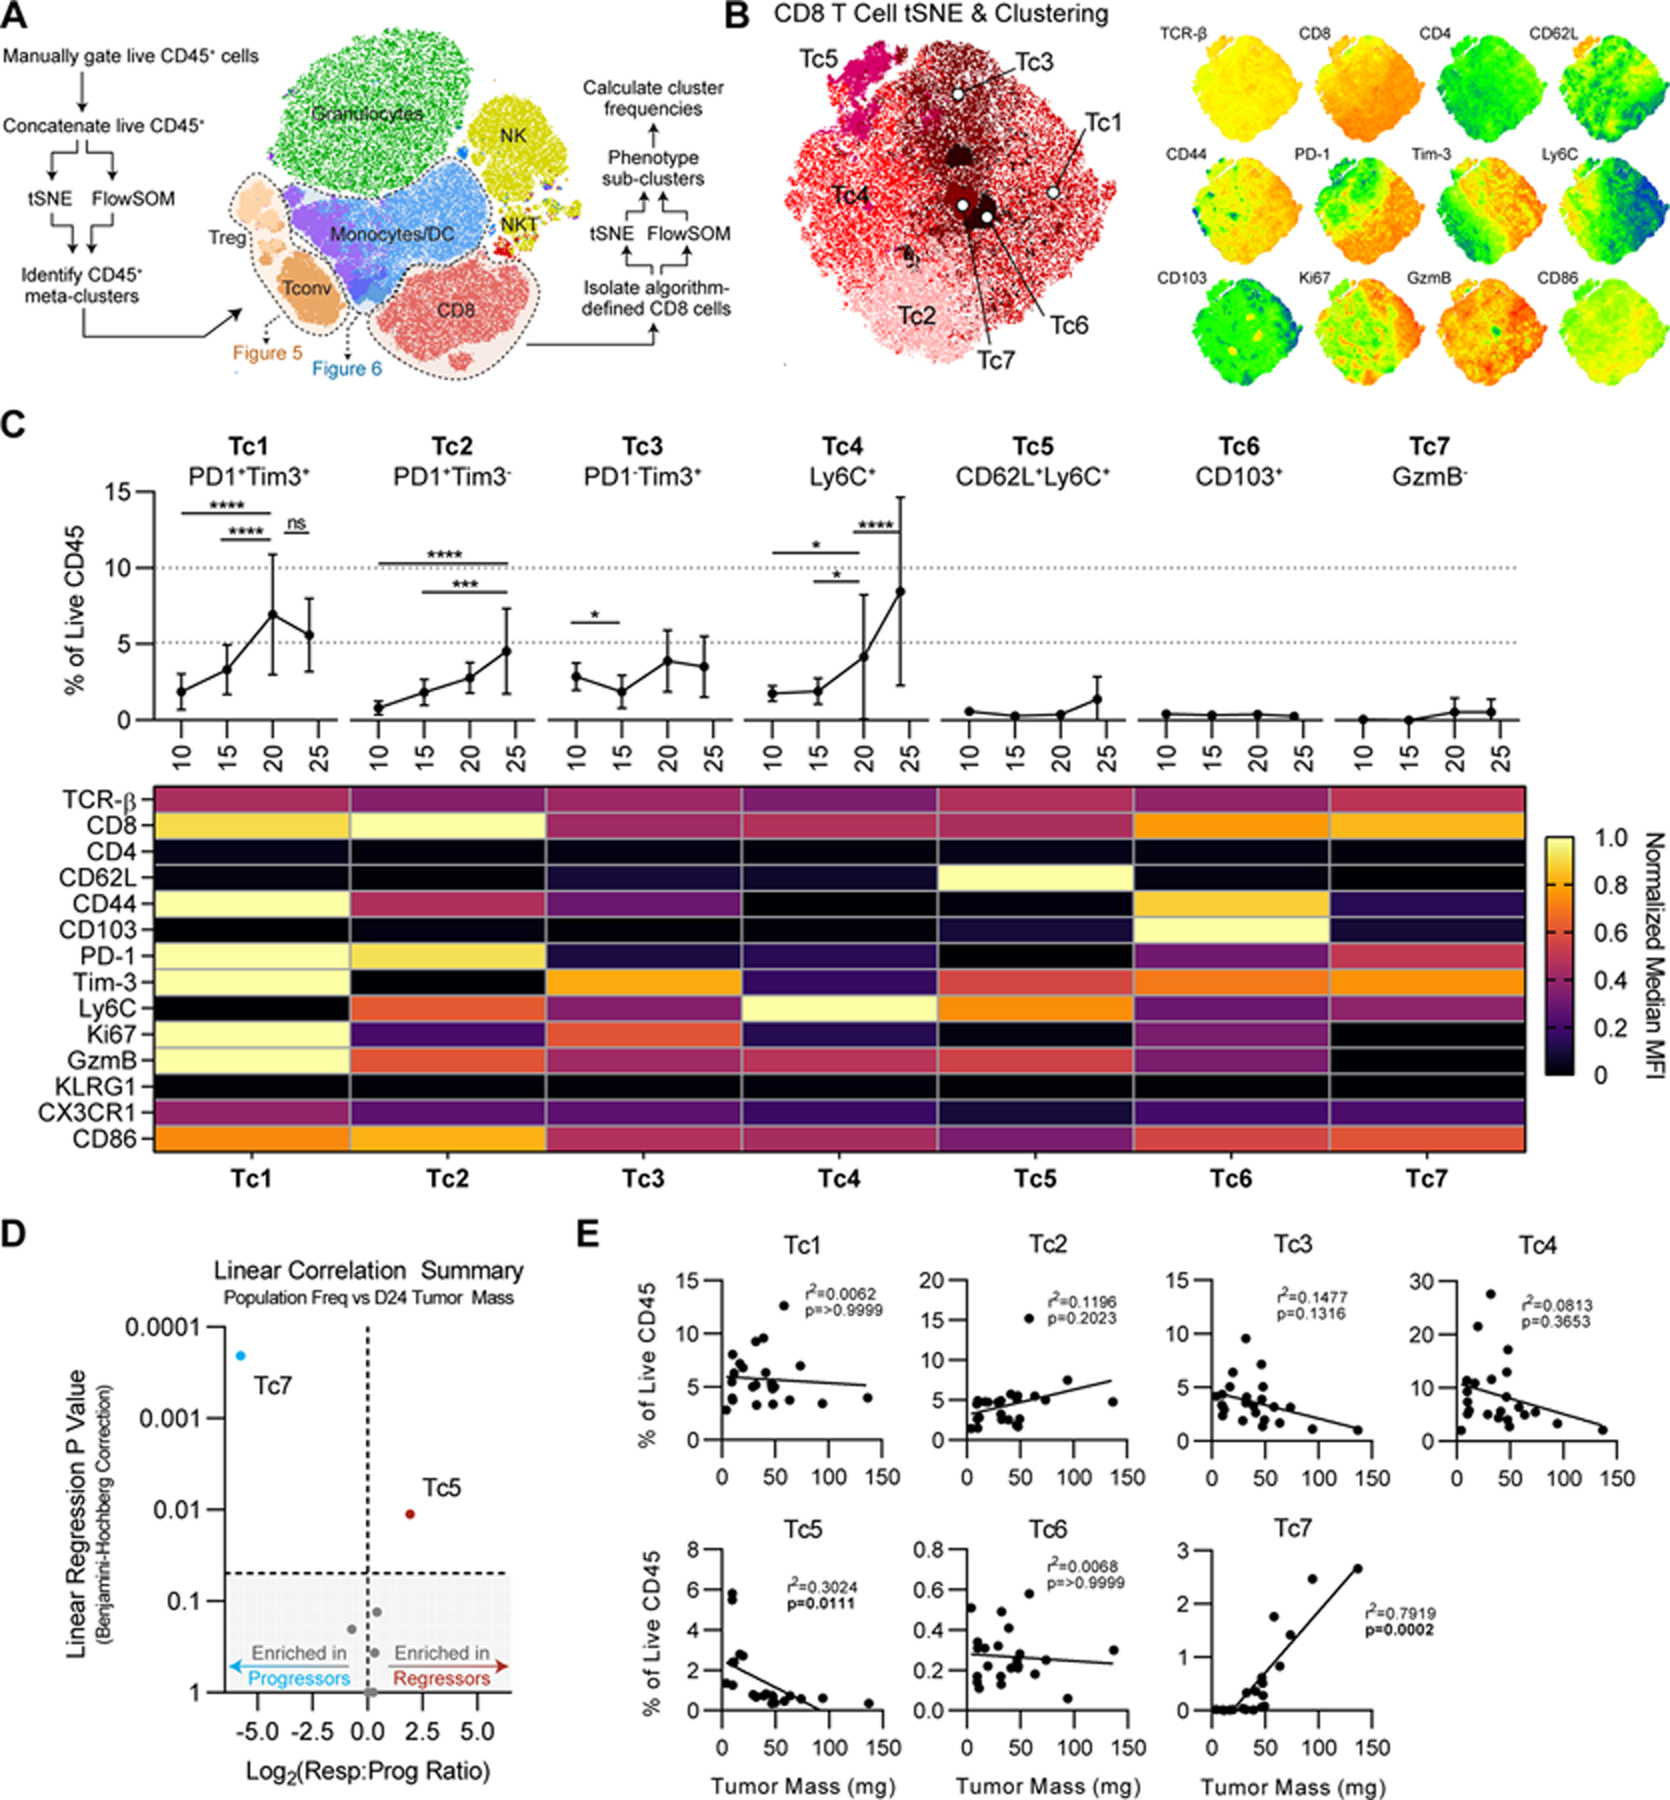
(A) Schema of high-dimensional analysis pipeline. (B) tSNE projection of CD8+ T cells from experiments shown in Fig. 3. For tSNE, iterations=3000 and k=30. Right: relevant relative phenotypic marker expression overlaid onto tSNE map. (C) Frequencies and scaled phenotypes of each CD8 cluster represented in a heatmap based on median MFI. Error bars indicate SD. Statistical significance was calculated using 2-way ANOVA with Tukey’s correction for multiple comparisons. ns=not significant, *p<0.05, **p<0.01, ***p<0.001, ****p<0.0001. (D) Significance of simple linear regression vs. Log2 responders vs. progressor ratio for each cluster. Shaded area represents linear regression p values >0.05. (E) Simple linear regressions of each CD8 cluster frequency vs. tumor mass, using Benjamini-Hochberg correction for multiple comparisons.
High-dimensional analysis unmasks Treg phenotypic diversity at escape phase
Given our previous observations that CD4+ T cells were critical throughout the immunoediting process (Fig. 3E–F), we applied the analysis above to the CD4+ T-cell population. As shown in Fig. 4A, FlowSOM clustering of the entire CD45+ compartment showed two CD4+ T-cell metaclusters, grossly corresponding to CD4+ Tconv cells and Tregs. To further resolve these compartments, we performed tSNE and FlowSOM analysis of each metacluster independently, using the analytical techniques described for Figure 4. These analyses revealed 7 unique subclusters within the CD4+ Tconv compartment, labeled Tn1-Tn7. Expression data (Fig. 5B) suggested that Tn1 and Tn2 were FoxP3+Helios+ cells that clustered with CD4+ Tconv cells, although we cannot rule out activation-induced expression of these markers (Fig. 5B). Each CD4+ Tconv cluster was present at a relatively high frequency at day 10, at reduced frequencies at days 15 and 20, with partial recovery by day 24 (Fig. 5B). Clusters Tn3-Tn7 were predominantly differentiated by expression of PD-1, Tim-3, and Ly6C, and Tn4 was the sole CD4+ Tconv subpopulation that correlated significantly with reduced tumor mass on day 24. Although Tn2 also correlated with smaller tumors, it phenotypically resembled a Treg phenotype (discussed below). Among CD4+ clusters, Tn4 cells showed the highest expression of PD-1, Tim-3, and CD44 (Fig. 5C), suggesting that this population may include the activated CD4+ T cells presumed to be involved in preventing escape (Fig. 2), although their lack of granzyme B expression is likely inconsistent with direct cytotoxic activity.
Figure 5. Correlations Between Unsupervised CD4+ T-cell Clusters and Tumor Regression.
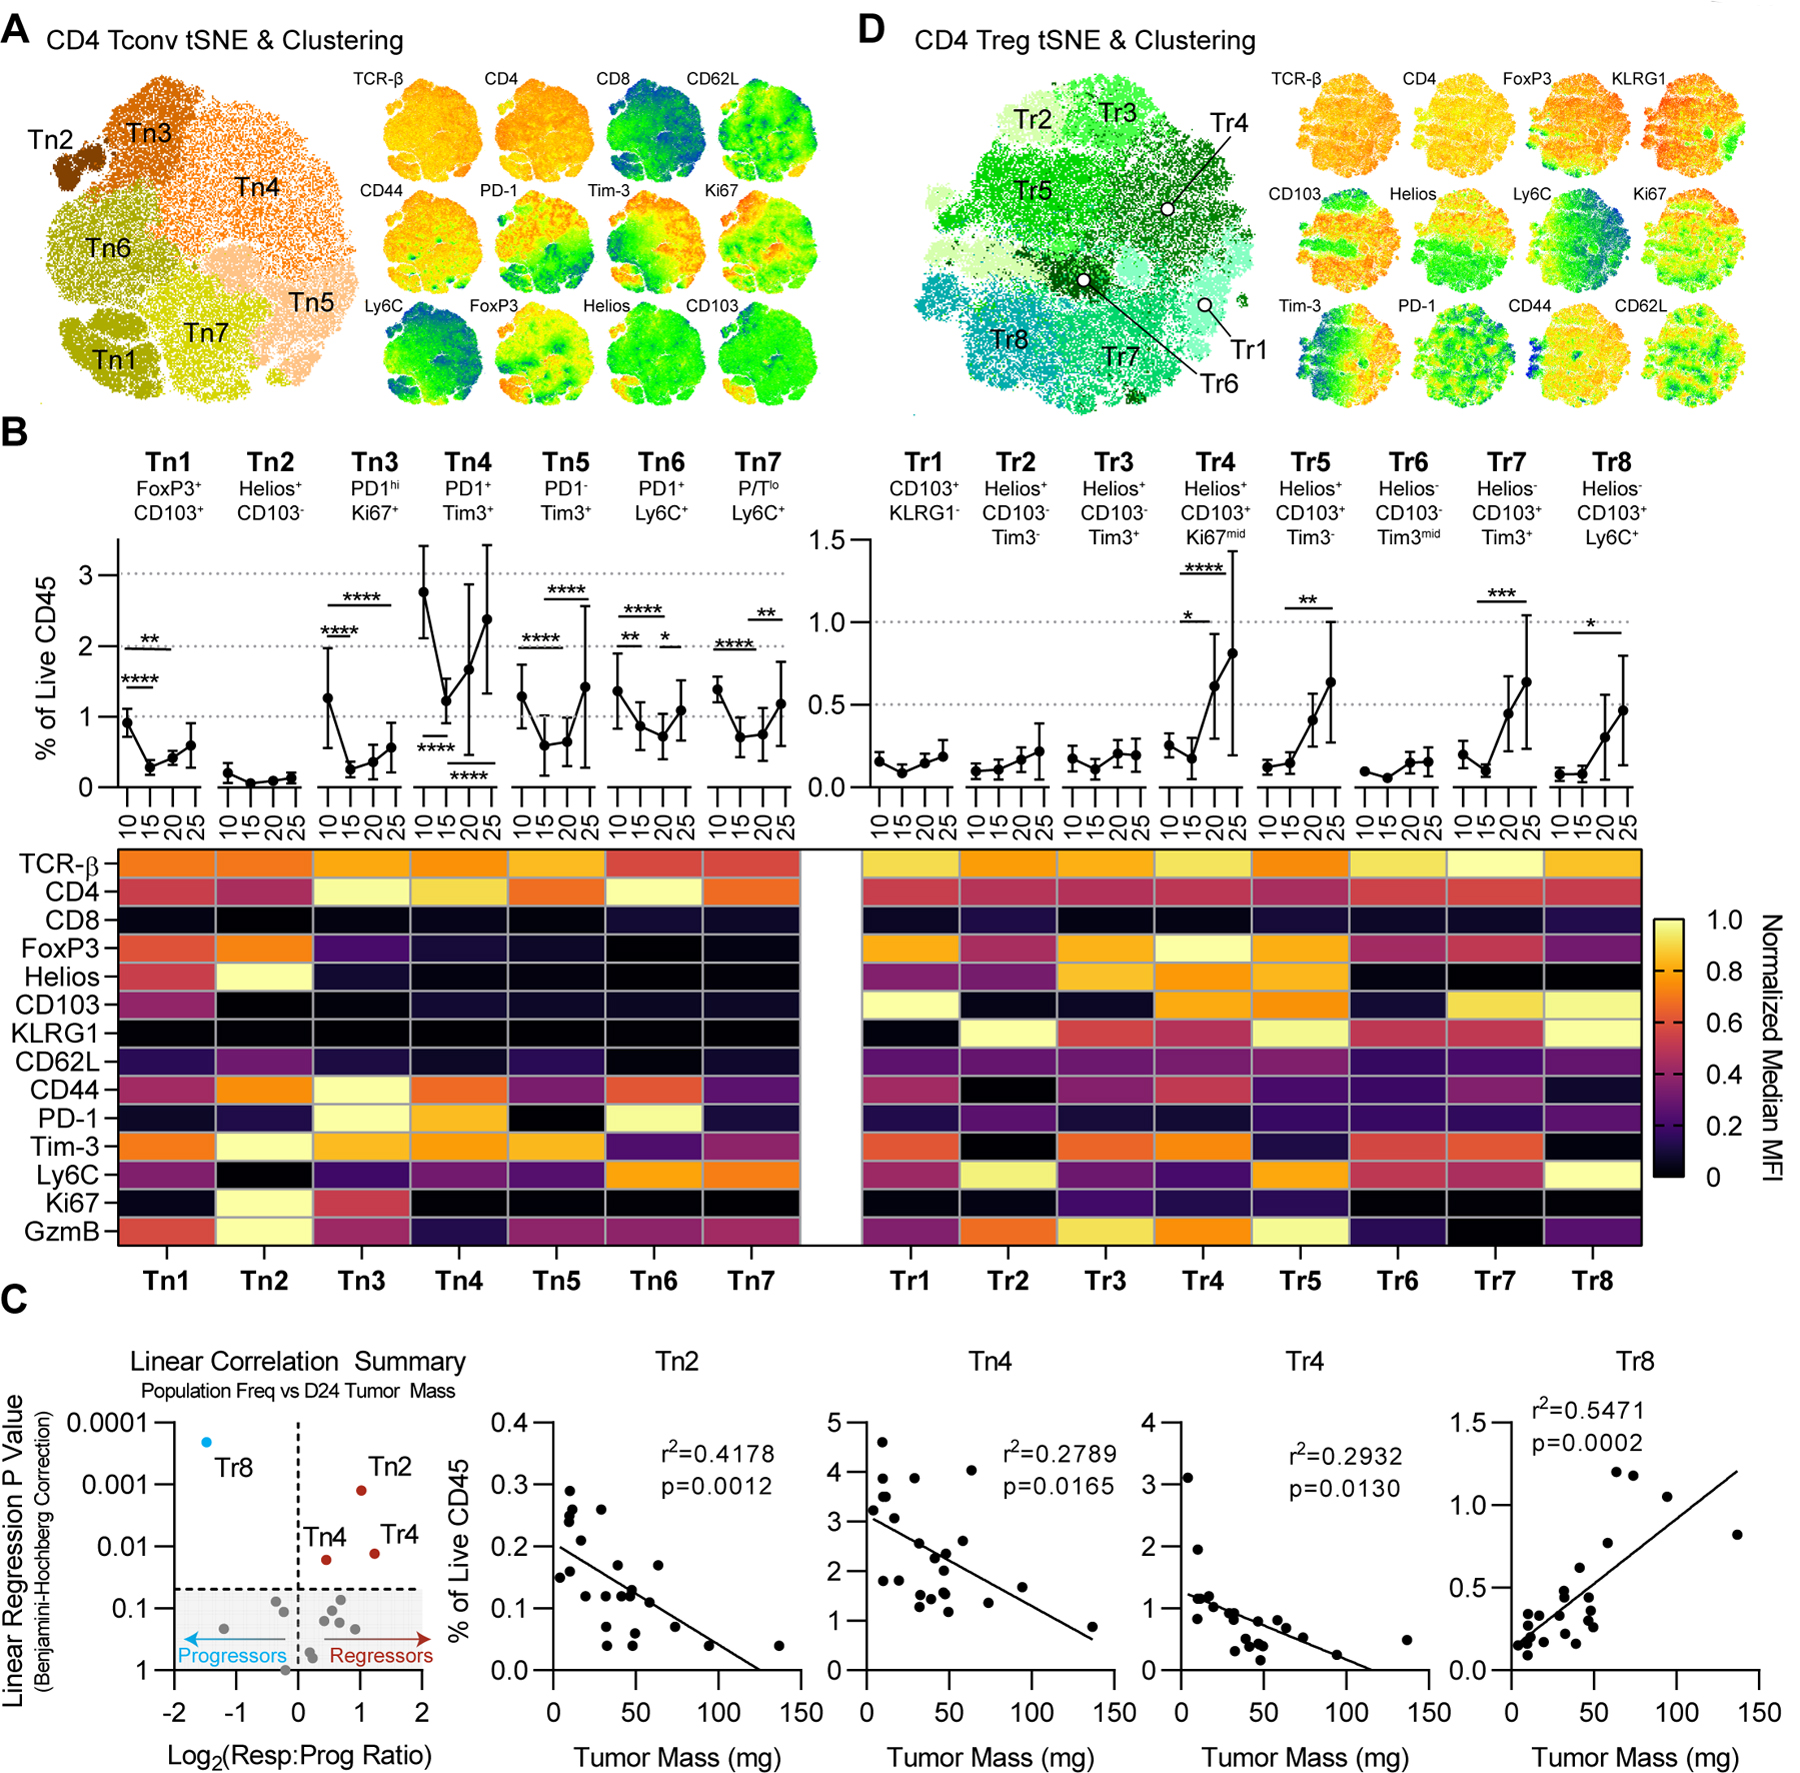
(A) tSNE projection of CD4+ Tconv cells from Fig. 4A. For tSNE, iterations=3000 and k=30. Right: relevant relative phenotypic marker expression overlaid onto the tSNE map. (B) Frequencies and scaled phenotypes of CD4+ Tconv clusters represented in a heatmap based on median MFI. Error bars indicate SD. Statistical significance was calculated using 2-way ANOVA with Tukey’s correction for multiple comparisons. ns=not significant, *p<0.05, **p<0.01, ***p<0.001, ****p<0.0001. (C) Significance of simple linear regression vs. Log2 responders vs. progressor ratio for each cluster, using Benjamini-Hochberg correction for multiple comparisons. Shaded area represents linear regression p values >0.05. Right: statistically significant simple linear regressions of CD4+ cluster frequencies vs. tumor mass. (D) tSNE projection of CD4+ Tregs and relative marker expression as in panel A.
Similar analyses of the FoxP3+ (presumptive Treg) population showed phenotypic diversity, and we identified 10 discrete clusters, Tr1–8 (and Tn1–2) that varied significantly in their expression of Helios, CD103, KLRG1, Tim-3, and Ly6C (Fig. 5D). As above, we validated the discreteness of these clusters by Mann Whitney U Test to exclude noise-based or artificial over-clustering. The majority of these clusters were exceedingly rare (<0.25% of CD45) at days 10 and 15 in NPK-C1 tumors; however approximately half of these expanded through days 20 and 24 to reach 0.5%−1% of CD45 (Fig. 5D). Two putative Treg clusters, Tn2 and Tr4, were significantly correlated with reduced tumor mass on day 24. Both Tn2 and Tr4 expressed Helios, CD44, and Tim-3, had relatively elevated Ki67 expression, but differed in their expression of KLRG1 and CD103 (Fig. 5C–D). The divergence between the putative Treg populations was notable, where Tr8 correlated with larger tumor mass (escape) and Tr4 and Tn2 correlated with smaller tumors. Tr8 expressed KLRG1 and CD103, markers which we (27) and others previously associated with suppressive capacity, whereas Tn2 expressed granzyme B, possibly consistent with cytotoxic capacity. Taken together, these data showed heterogeneity in tumor-infiltrating CD4+ Tconv cells and Treg populations, a finding not well appreciated when immune cell populations are analyzed according to pre-specified phenotypes.
Discrete myeloid phenotypes associate with NPK-C1 progression vs. regression
Applying the FlowSOM algorithm to the non-T cell CD45+ compartment yielded 4 clusters that comprised a single myeloid metacluster in tSNE space (Fig. 4A, Fig. 6A). We thus concatenated these clusters together for downstream analyses, using an additional round of tSNE dimensionality reduction and FlowSOM clustering as described above. Again, clusters were statistically validated by Mann Whitney U test to avoid noise-based over-clustering. These high-dimensional analyses yielded 9 unique myeloid subclusters M1-M9 (Fig. 6B). M1-M4 represented monocyte populations, which ranged in frequency from 2–10% of CD45 on average (Fig. 6C). M6-M9 resembled DC-like cells having moderate to high CD11c and low CD11b expression and were generally rare (<2% of CD45) with the exception of M8. M5 expressed both CD11b and CD11c and thus was difficult to define (Fig. 6C). Most of these did not significantly vary over time, although M4 showed an atypical up-down-up-down behavior and M2 was significantly reduced after day 10 (Fig. 6C). Focusing first on clusters significantly correlated with smaller NPK-C1 tumors, we found M1 (a proliferating monocyte population), M6 (an iNOS+ DC-like population), and M8 (a classical CD11c+MHC-IIhi DC population). The enrichment of proliferating monocytes in regressing tumors (M1) corresponded with an enrichment of non-proliferative monocytes in progressing NPK-C1 tumors (M2; Fig. 6D–E). Thus, in the context of NPK-C1, local monocyte proliferation vs. quiescence on day 24 separated regressing from progressing tumors. Focusing further on clusters enriched in progressing NPK-C1 tumors, we found two MHC-IIlo DC-like populations in M7 and M5, and CD103+ DCs in M9. Given the established importance of Batf3-lineage CD103+ DCs in driving antitumor immunity, this association was unexpected. These data suggest that myeloid phenotypes are complex and that the particular populations associated with disease progression or regression may have context-dependent roles over the course of immunoediting.
Figure 6. Correlations Between Unsupervised Myeloid Clusters and Tumor Regression.
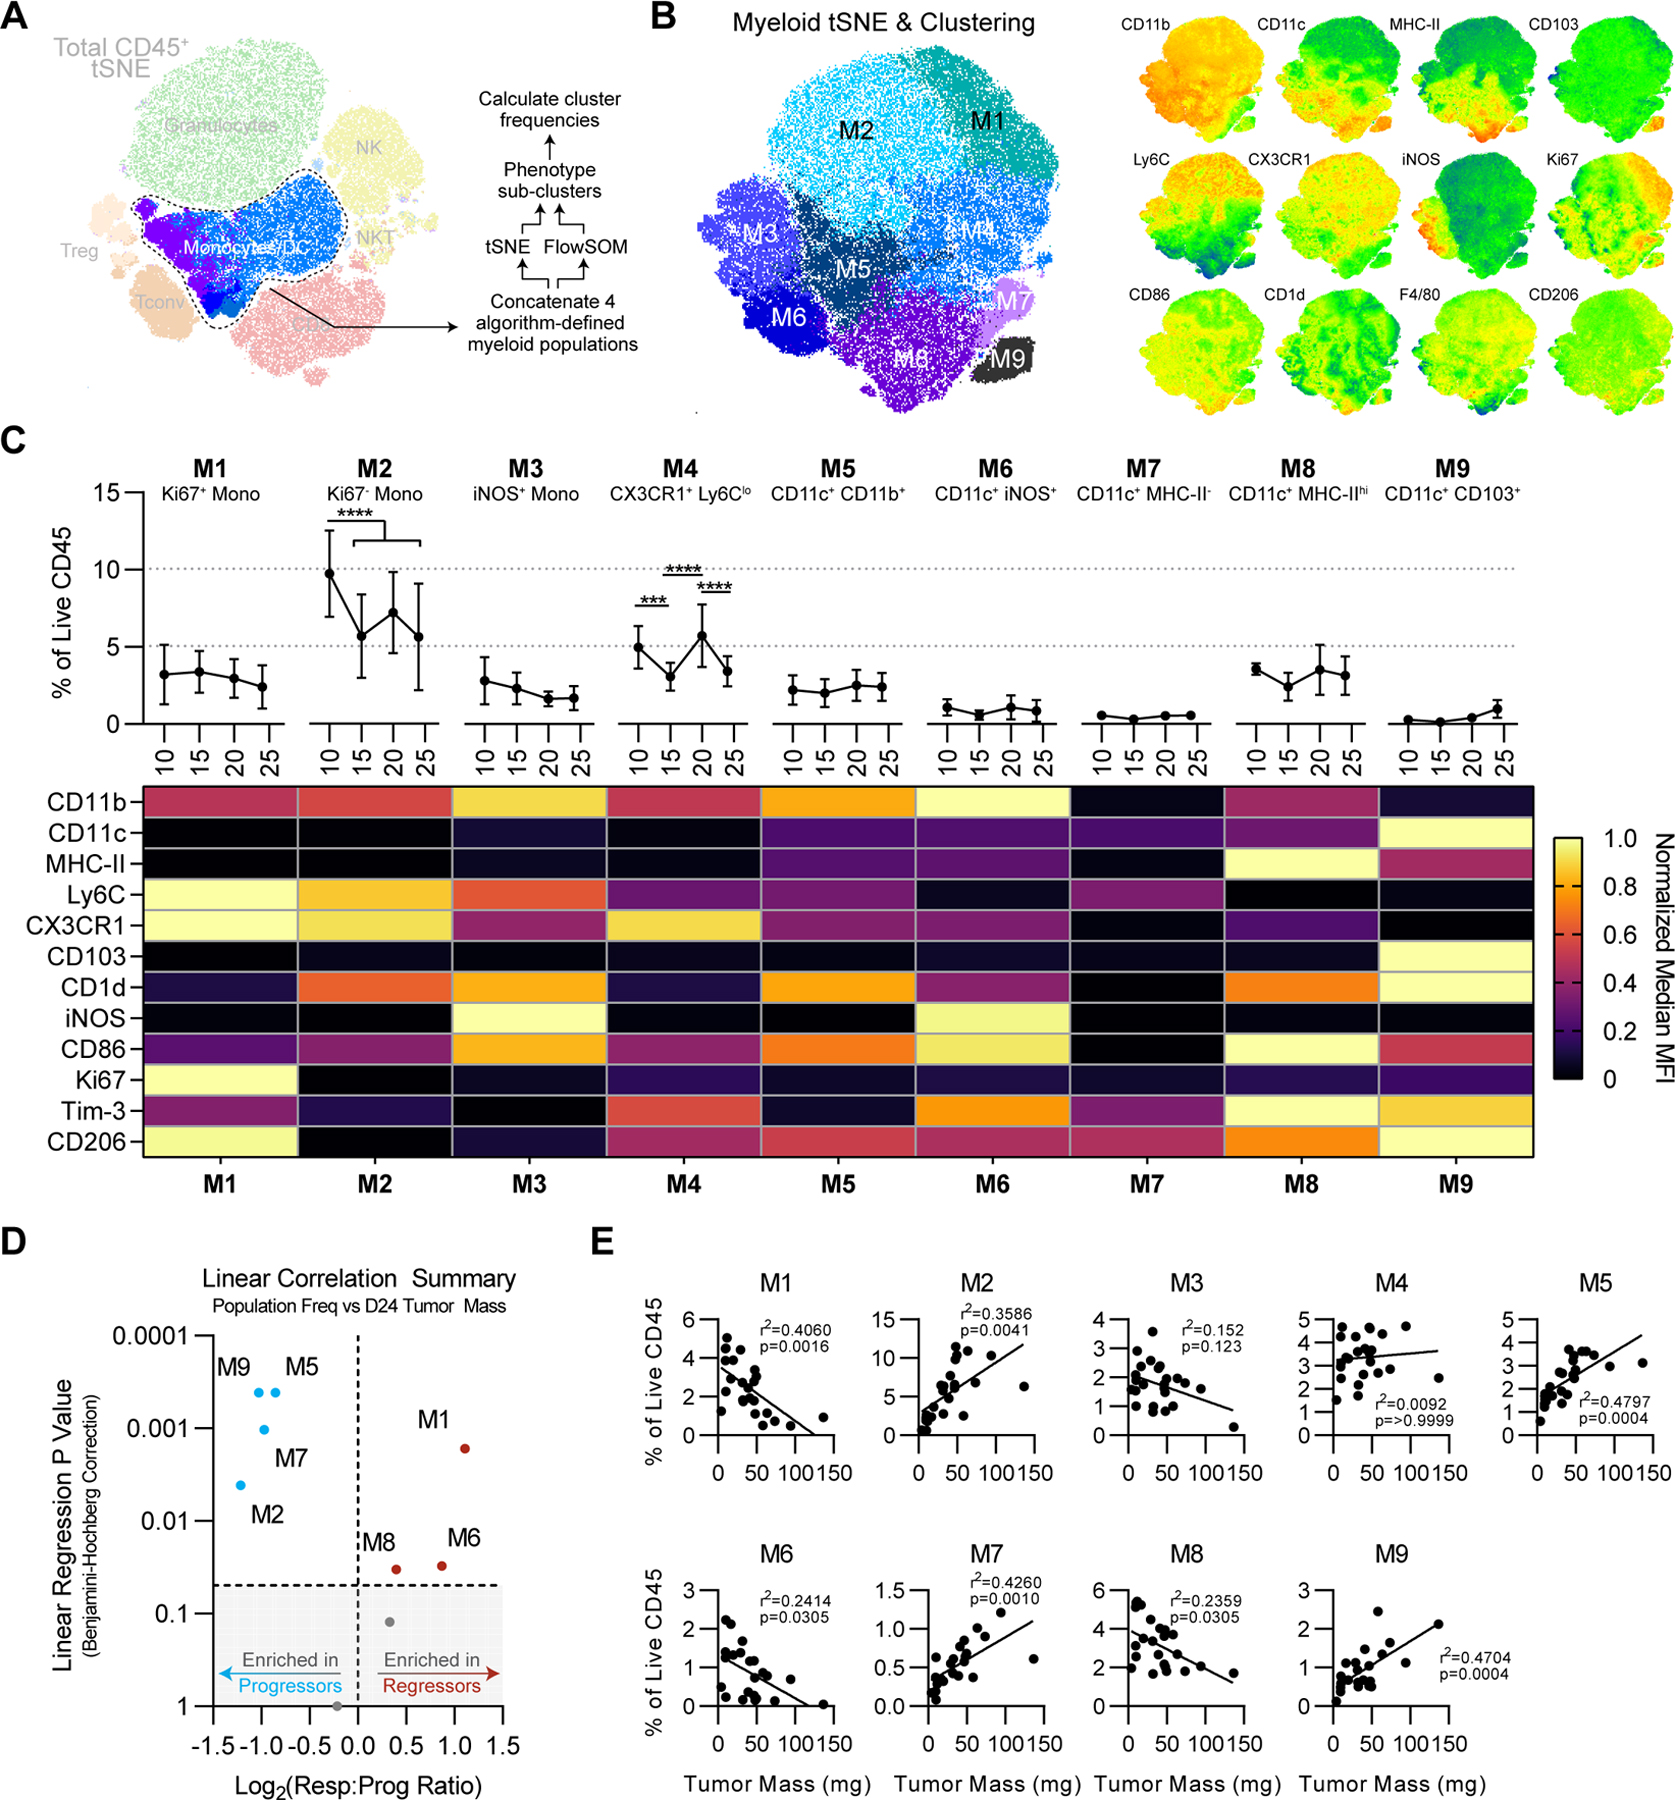
(A) Schema of myeloid high-dimensional analysis pipeline. (B) tSNE projection of myeloid cells from Fig. 4A. For tSNE, iterations=3000 and k=30. Right: relevant relative phenotypic marker expression overlaid onto tSNE map. (C) Frequencies and scaled phenotypes of each myeloid cluster represented in a heatmap based on median MFI. Error bars indicate SD. Statistical significance was calculated using 2-way ANOVA with Tukey’s correction for multiple comparisons. ns=not significant, *p<0.05, **p<0.01, ***p<0.001, ****p<0.0001. (D) Significance of simple linear regression vs. Log2 responder vs. progressor ratio for each cluster, using Benjamini-Hochberg correction for multiple comparisons. Shaded area represents linear regression p values >0.05. (E) Simple linear regressions of each myeloid cluster frequency vs. tumor mass.
Discrete Immune Cell Subsets are Present at Early Versus Late Transition Points
Immunoediting involves two main inflection points: the elimination-equilibrium transition and the equilibrium-escape transition. To determine whether compositional changes occurring at the primary elimination-equilibrium transition were similar or different to those occurring at the secondary equilibrium-escape transition, we used a bootstrapping procedure to generate average fold-change values for all computationally defined subclusters between elimination (day 10) tumors and equilibrium (day 15) tumors (Fig. 7A), as well as between day 24 regressor and progressor tumors (Fig. 7B). We observed a number of clusters to be enriched in opposite directions in the early comparison vs. the late comparison. For example, Tc7 (granzyme B- putative exhausted CD8) existed at higher frequency in “eliminating” day 10 tumors relative to “equilibrating” day 15 tumors, yet Tc7 was reduced in “controlled” day 24 tumors relative to “escaping” day 24 tumors (Fig. 7B). These data implied that either (i) the role of Tc7 was dichotomous in these two conditions or (ii) changes that occurred as a tumor transitioned from elimination to equilibrium were unique from what happened during the switch from equilibrium to escape.
Figure 7. Variations in Unsupervised Immune Cell Populations in Regressing versus Responding Tumors.
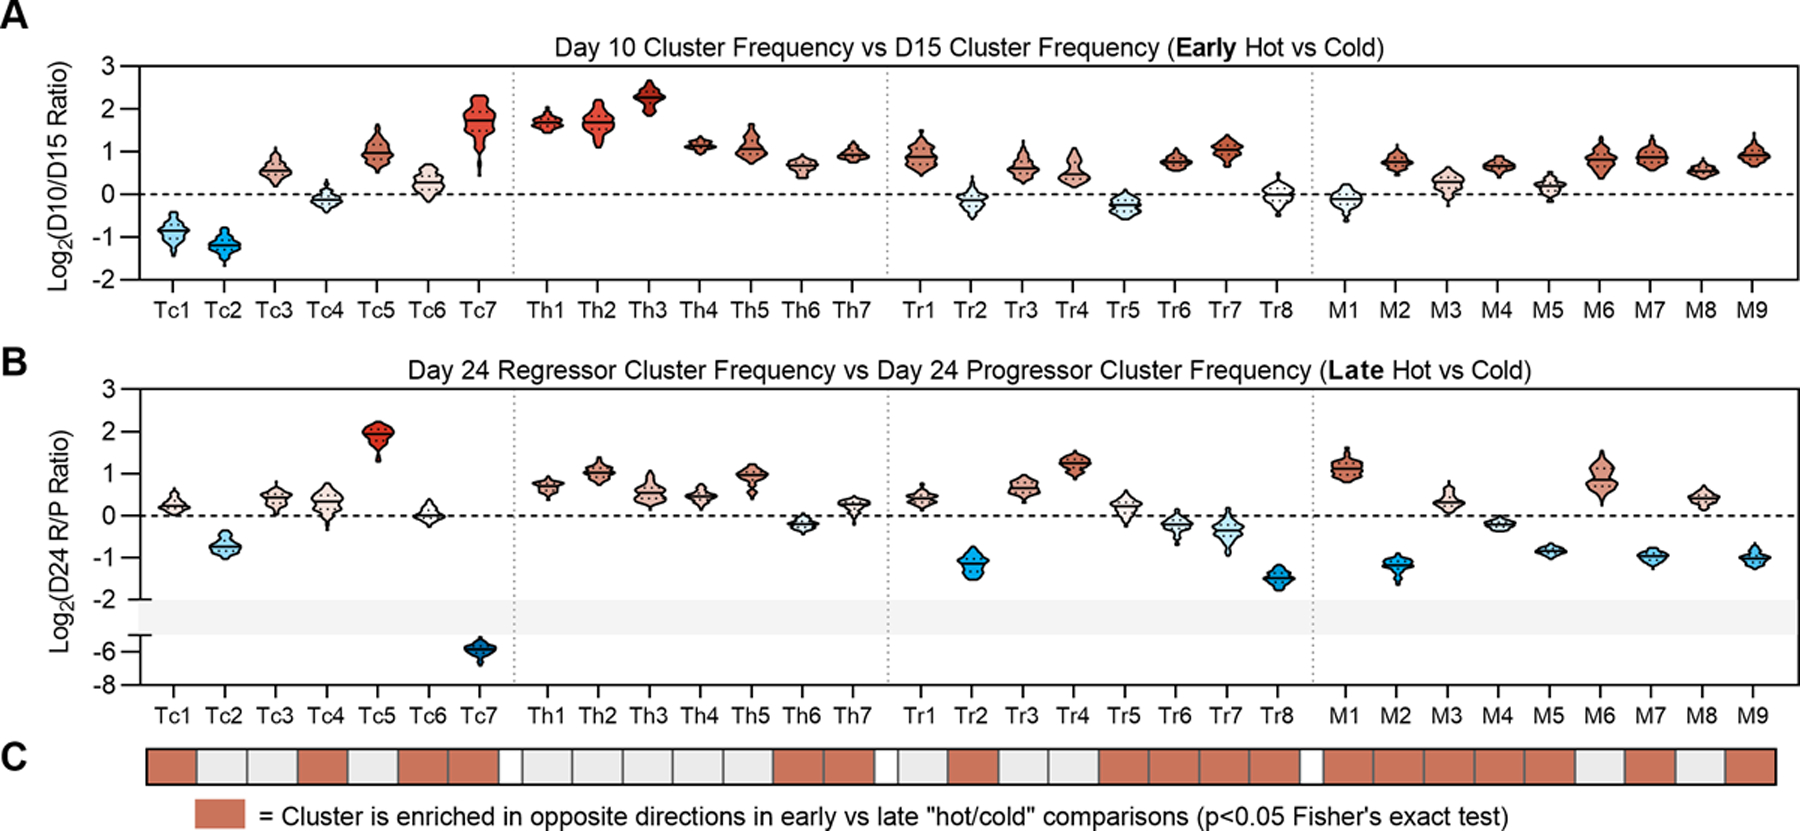
(A) Log2-normalized fold-change of each immune cluster between day 10 tumors vs. day 15 tumors. (B) Log2-normalized fold-change of each immune cluster between day 24 regressors vs. day 24 progressors. For violin plots in panels A and B, solid lines denote median values and dotted lines denote quartiles. (C) Clusters exhibiting enrichment in opposing directions comparing “day 10 vs day 15” and “day 24 regressor vs progressor” plots in panels A and B. Red denotes p<0.05 by Fisher’s Exact test.
To define clusters exhibiting statistically significant enrichment in opposite directions between these two comparisons, we dichotomized each fold-change value depending on whether it was greater than or less than 1, then used Fisher’s exact test to identify significant differences (Fig. 7C). Overall, we found CD4+ Tconv-cell enrichment patterns to be largely consistent in early vs. late comparisons; in other words, CD4+ Tconv clusters tended to be enriched in the tumor microenvironment (TME) where a productive response was occurring, regardless of the inflection point (Fig. 7C). By contrast, we observed broad divergence of myeloid clusters. The only myeloid clusters enriched in inflamed tumors at both inflection points were M6 (CD11c+iNOS+) and M8 (CD11c+MHC-IIhiCD103-) DC-like cells. Proliferating monocytes, although enriched in regressing day 24 tumors, were contrarily enriched in the elimination-equilibrium transition. The opposite was true for non-proliferative monocytes, suggesting that the association between monocyte proliferation and NPK response was only valid in later stages of tumor outgrowth. Finally, we also found the CD103+ DC cluster M9 to be similarly divergent in early vs late comparisons (Fig. 7A–C). Together, these data highlight the dynamic nature of the TME, in that immune cell populations associated with a favorable phenotype at one timepoint may show an opposite association at another. These data also suggest canonically defined phenotypes are likely insufficient to capture the immune cell diversity in the TME.
Discussion
In this study, we performed high parameter longitudinal immune profiling and cellular depletion assays to define the cellular determinants of immunoediting in NPK-C1, a transplantable murine model of prostate cancer that spontaneously models the distinct stages of immunoediting: elimination, equilibrium, and escape. This is, to our knowledge, one of the few transplantable models that consistently exhibits such behavior in C57BL/6 mice, with a tumor volume and time-scale that allows for facile longitudinal immunophenotyping at each stage. Although the paucity of alternative models restricted our study to this single cell line, our observation that NPK-C1 exhibited immune-mediated editing at both subcutaneous and orthotopic sites with relatively minor differences in immune contexture lends credence to the relevance of this model. Overall, these studies revealed four key insights: (i) CD4+ T cells are required for productive antitumor immunity during elimination phase and play active roles in restraining tumor growth during equilibrium phase; (ii) Tregs exhibit diverse phenotypes in the TME and can be associated with favorable or unfavorable response depending on phenotype; (iii) Myeloid phenotypes are complex and context-dependent, as CD103+ DCs appear to be associated with progression to escape phase in this model; and (iv) To understand complex immune biology within the TME, datasets with increasing dimensionality in both marker number and timepoints may be critical, along with unbiased high-dimensional analysis techniques.
Our data substantiate a growing body of literature emphasizing the role of CD4+ T cells in antitumor immunity (25). Our study is reminiscent in approach to that used by Wei et al, who used CyTOF profiling to find an ICOS+ TH1 effector CD4+ T-cell subset enriched in mice with MC38 and B16 tumors treated with CTLA-4 blockade (28). Alspach et al identified class II-restricted neoantigens in MCA sarcomas and showed neoantigen-reactive CD4+ T cells are required at the tumor site for spontaneous and therapeutically augmented antitumor immunity (9). A report by Oh et al used single-cell sequencing from a cohort of human bladder cancer specimens to identify cytotoxic CD4+ T cells within the TME and found this cytotoxic CD4 gene signature predicts response to anti-PD-L1 in a validation cohort (10). In relation to these studies, our dataset is limited in its ability to phenotype CD4+ T cells in that we could not specifically delineate cells recognizing tumor antigen. However, our model uniquely allowed us to demonstrate that CD4+ Tconv activation was associated with productive antitumor immunity throughout each stage of immunoediting. Although we did not observe substantial granzyme B positivity in the CD4+ Tconv compartment in NPK-C1, future studies are required to detail how cytokine secretion and/or cytotoxicity contribute to the antitumor activities of CD4+ Tconv cells.
Treg frequency as a prognostic biomarker in cancer is controversial. Although Treg infiltration is associated with poor outcomes in a majority of cancers, in colorectal and some other cancers, Tregs associate with favorable response (29). Our data mirror these seemingly contradictory findings. We also found that Tregs were phenotypically diverse, as we identified 10 distinct Treg phenotypes in NPK-C1 tumors using FoxP3, Helios, KLRG1, CD103, Tim-3, and Ly6C markers alone. Although we have previously shown Helios and CD103 expression associate with suppressive tumor Tregs (27), these data suggest heterogeneity amongst Tregs bearing these markers; Tr4 expressed Helios and CD103 and correlated with tumor regression, whereas Tr8 expressed CD103 and correlated with tumor progression in this model. Little is known about what drives these specific phenotypes and to what extent there are functional differences in Tregs at this level of granularity. Although these data clearly require further investigation, an important implication of this result is that high-dimensional approaches will be of increasing importance in defining Treg phenotypes with consistent prognostic or predictive ability in cancer, particularly in human studies.
Our data corroborate the widely acknowledged understanding that myeloid cell behavior is complex and context-dependent in the TME. Myeloid cells can play active roles in immunoediting, both in antagonizing or promoting tumor escape (11,16). Regarding tumor antagonistic function, O’Sullivan et al. showed IFNγ-stimulated M1 macrophages expressing iNOS and MHC-II mediate immunoediting in RAG2−/−γc−/− mice (11). Using single-cell RNA-sequencing and CyTOF of checkpoint blockade treated MCA sarcomas, Gubin et al. elegantly established a direct association between tumor regression and iNOS+ M1-like macrophage polarization, whereas tumor progression was associated with CD206+ M2-like skewing (30). Although our data included few macrophages, we observed the iNOS+ phenotype in DC-like cells enriched in regressor tumors, confirming the use of iNOS as a marker defining myeloid populations associated with productive antitumor immunity in mice. We observed in progressor tumors a higher frequency of CD103+ DCs, which are generally thought to be required for productive antitumor immunity (4,31–33). This finding was unexpected, given the role of CD103+ DCs in tumor antigen cross-presentation to prime CD8+ T-cell responses (31,33). We note, though, that CD103+ DCs were enriched in elimination phase tumors relative to equilibrium phase tumors, as expected. These data may possibly be explained two ways: (i) a high frequency of CD103+ DCs in the TME following initial elimination and equilibrium phases indicates failed DC migration to draining lymph nodes, which results in insufficient tumor-specific CD8 priming (32,34); or (ii) CD103+ DCs can undergo immunosuppressive polarization in the TME, analogous to the mature regulatory DC phenotype described by Maier et al (35). Further investigation into the transcriptional profile of these cells, as well as their cross-presenting functional capacity, is required to understand the curious enrichment of CD103+ DCs in the TME upon progression to escape in our model.
In summary, our study introduces the utility of the prostate tumor model NPK-C1 for studying mechanisms of immunoediting in C57BL/6 mice. Using high-dimensional longitudinal immune profiling and in vivo depletion experiments, we found that central memory-like CD8+ T cells, activated CD4+ effectors, proliferative Helios+ Tregs, and iNOS+ myeloid cells associated with immunity involved in tumor escape, whereas exhausted CD8+ T cells, Helios-CD103+KLRG1+ Tregs, and CD103+ DCs were enriched in progressing tumors. We also found compositional changes that were unique between each immunoediting inflection point, highlighting the constantly evolving nature of tumor-immune interactions over time. These observations illustrate the importance of relevant models and high-dimensional phenotyping in understanding the complex immune biology underlying cancer immunoediting.
Supplementary Material
Synopsis:
A new murine model for studying cancer immunoediting is presented. Longitudinal spectral flow cytometry, dimensionality reduction analyses, and in vivo depletion experiments are used to detail specific T-cell and myeloid phenotypes involved in each immunoediting phase.
Acknowledgments
This research was funded in part through the NIH/NCI Cancer Center Support Grant P30CA013696 (CGD), the Prostate Cancer Foundation (CGD), the Movember Challenge Award (CGD) the NIH R01 CA183929–05 and R01 CA173481 (CAS), the NIH R35 CA197745 (AC), the NIH U01 CA217858 (AC), and the NIH S10 OD012351 and S10 OD021764 (AC). JMA is currently supported by the Dean’s Precision Medicine Research Fellowship from the Irving Institute for Clinical and Translational Research at Columbia University Irving Medical Center (UL1TR001873). We would also like to acknowledge Dr. Siu-hong Ho and Dr. PJ Stewart-Hutchinson at Cytek Biosciences for assistance and training on spectral flow cytometry. We would also like to thank the CCTI at CUIMC for departmental support.
Funding:
This research was funded in part through the NIH/NCI Cancer Center Support Grant P30CA013696 (CAS), the Prostate Cancer Foundation PG010715 (CGD), the Movember Challenge Award (CGD), the NIH R01 CA183929–05 and R01 CA173481 (CAS), the NIH R35 CA197745 (AC), the NIH U01 CA217858 (AC), the NIH S10 OD012351 and S10 OD021764 (AC). JMA is currently supported by the Dean’s Precision Medicine Research Fellowship from the Irving Institute for Clinical and Translational Research at Columbia University Irving Medical Center (UL1TR001873).
Footnotes
Conflicts of Interest: CGD is a co-inventor on patents licensed from Johns Hopkins University to Bristol Myers Squibb, and has served as a paid consultant to Agenus, AZ Medimmune, BMS, Pfizer, Roche, Sanofi Aventis, Genentech, Merck, and Janssen, and has previously received sponsored research funding to his institution from the Bristol-Myers Squibb International Immuno-Oncology Network. Dr. Califano is founder, equity holder, and consultant of DarwinHealth Inc., a company that has licensed some of the algorithms used in this manuscript from Columbia University. Columbia University is also an equity holder in DarwinHealth Inc. US patent numbers 10,777,299 and 10,790,040 have been awarded related to this work, assigned to Columbia University. The remaining authors declare no relevant conflicts.
References
- 1.Mittal D, Gubin MM, Schreiber RD, Smyth MJ. New insights into cancer immunoediting and its three component phases--elimination, equilibrium and escape. Curr Opin Immunol 2014;27:16–25 doi 10.1016/j.coi.2014.01.004. [DOI] [PMC free article] [PubMed] [Google Scholar]
- 2.Schreiber RD, Old LJ, Smyth MJ. Cancer immunoediting: integrating immunity’s roles in cancer suppression and promotion. Science 2011;331(6024):1565–70 doi 10.1126/science.1203486. [DOI] [PubMed] [Google Scholar]
- 3.Dunn GP, Old LJ, Schreiber RD. The three Es of cancer immunoediting. Annu Rev Immunol 2004;22:329–60 doi 10.1146/annurev.immunol.22.012703.104803. [DOI] [PubMed] [Google Scholar]
- 4.Diamond MS, Kinder M, Matsushita H, Mashayekhi M, Dunn GP, Archambault JM, et al. Type I interferon is selectively required by dendritic cells for immune rejection of tumors. J Exp Med 2011;208(10):1989–2003 doi 10.1084/jem.20101158. [DOI] [PMC free article] [PubMed] [Google Scholar]
- 5.Fuertes MB, Kacha AK, Kline J, Woo SR, Kranz DM, Murphy KM, et al. Host type I IFN signals are required for antitumor CD8+ T cell responses through CD8{alpha}+ dendritic cells. J Exp Med 2011;208(10):2005–16 doi 10.1084/jem.20101159. [DOI] [PMC free article] [PubMed] [Google Scholar]
- 6.Dunn GP, Bruce AT, Sheehan KC, Shankaran V, Uppaluri R, Bui JD, et al. A critical function for type I interferons in cancer immunoediting. Nat Immunol 2005;6(7):722–9 doi 10.1038/ni1213. [DOI] [PubMed] [Google Scholar]
- 7.Matsushita H, Vesely MD, Koboldt DC, Rickert CG, Uppaluri R, Magrini VJ, et al. Cancer exome analysis reveals a T-cell-dependent mechanism of cancer immunoediting. Nature 2012;482(7385):400–4 doi 10.1038/nature10755. [DOI] [PMC free article] [PubMed] [Google Scholar]
- 8.Takeda K, Nakayama M, Hayakawa Y, Kojima Y, Ikeda H, Imai N, et al. IFN-γ is required for cytotoxic T cell-dependent cancer genome immunoediting. Nature communications 2017;8:14607 doi 10.1038/ncomms14607. [DOI] [PMC free article] [PubMed] [Google Scholar]
- 9.Alspach E, Lussier DM, Miceli AP, Kizhvatov I, DuPage M, Luoma AM, et al. MHC-II neoantigens shape tumour immunity and response to immunotherapy. Nature 2019;574(7780):696–701 doi 10.1038/s41586-019-1671-8. [DOI] [PMC free article] [PubMed] [Google Scholar]
- 10.Oh DY, Kwek SS, Raju SS, Li T, McCarthy E, Chow E, et al. Intratumoral CD4(+) T Cells Mediate Anti-tumor Cytotoxicity in Human Bladder Cancer. Cell 2020;181(7):1612–25.e13 doi 10.1016/j.cell.2020.05.017. [DOI] [PMC free article] [PubMed] [Google Scholar]
- 11.O’Sullivan T, Saddawi-Konefka R, Vermi W, Koebel CM, Arthur C, White JM, et al. Cancer immunoediting by the innate immune system in the absence of adaptive immunity. J Exp Med 2012;209(10):1869–82 doi 10.1084/jem.20112738. [DOI] [PMC free article] [PubMed] [Google Scholar]
- 12.Thommen DS, Schumacher TN. T Cell Dysfunction in Cancer. Cancer Cell 2018;33(4):547–62 doi 10.1016/j.ccell.2018.03.012. [DOI] [PMC free article] [PubMed] [Google Scholar]
- 13.Wculek SK, Cueto FJ, Mujal AM, Melero I, Krummel MF, Sancho D. Dendritic cells in cancer immunology and immunotherapy. Nature Reviews Immunology 2020;20(1):7–24 doi 10.1038/s41577-019-0210-z. [DOI] [PubMed] [Google Scholar]
- 14.Chen X, Du Y, Hu Q, Huang Z. Tumor-derived CD4+CD25+regulatory T cells inhibit dendritic cells function by CTLA-4. Pathology, research and practice 2017;213(3):245–9 doi 10.1016/j.prp.2016.12.008. [DOI] [PubMed] [Google Scholar]
- 15.Chao JL, Savage PA. Unlocking the Complexities of Tumor-Associated Regulatory T Cells. J Immunol 2018;200(2):415–21 doi 10.4049/jimmunol.1701188. [DOI] [PMC free article] [PubMed] [Google Scholar]
- 16.Gabrilovich DI, Ostrand-Rosenberg S, Bronte V. Coordinated regulation of myeloid cells by tumours. Nature Reviews Immunology 2012;12(4):253–68 doi 10.1038/nri3175. [DOI] [PMC free article] [PubMed] [Google Scholar]
- 17.Lyssiotis CA, Kimmelman AC. Metabolic Interactions in the Tumor Microenvironment. Trends in Cell Biology 2017;27(11):863–75 doi 10.1016/j.tcb.2017.06.003. [DOI] [PMC free article] [PubMed] [Google Scholar]
- 18.Jayaprakash P, Ai M, Liu A, Budhani P, Bartkowiak T, Sheng J, et al. Targeted hypoxia reduction restores T cell infiltration and sensitizes prostate cancer to immunotherapy. The Journal of Clinical Investigation 2018;128(11):5137–49 doi 10.1172/JCI96268. [DOI] [PMC free article] [PubMed] [Google Scholar]
- 19.Turnis ME, Andrews LP, Vignali DA. Inhibitory receptors as targets for cancer immunotherapy. European journal of immunology 2015;45(7):1892–905 doi 10.1002/eji.201344413. [DOI] [PMC free article] [PubMed] [Google Scholar]
- 20.Koebel CM, Vermi W, Swann JB, Zerafa N, Rodig SJ, Old LJ, et al. Adaptive immunity maintains occult cancer in an equilibrium state. Nature 2007;450(7171):903–7 doi 10.1038/nature06309. [DOI] [PubMed] [Google Scholar]
- 21.Aytes A, Mitrofanova A, Kinkade CW, Lefebvre C, Lei M, Phelan V, et al. ETV4 promotes metastasis in response to activation of PI3-kinase and Ras signaling in a mouse model of advanced prostate cancer. Proc Natl Acad Sci U S A 2013;110(37):E3506–15 doi 10.1073/pnas.1303558110. [DOI] [PMC free article] [PubMed] [Google Scholar]
- 22.Arriaga JM, Panja S, Alshalalfa M, Zhao J, Zou M, Giacobbe A, et al. A MYC and RAS co-activation signature in localized prostate cancer drives bone metastasis and castration resistance. Nature Cancer 2020;1(11):1082–96 doi 10.1038/s43018-020-00125-0. [DOI] [PMC free article] [PubMed] [Google Scholar]
- 23.Evans RA, Diamond MS, Rech AJ, Chao T, Richardson MW, Lin JH, et al. Lack of immunoediting in murine pancreatic cancer reversed with neoantigen. JCI insight 2016;1(14) doi 10.1172/jci.insight.88328. [DOI] [PMC free article] [PubMed] [Google Scholar]
- 24.Faget J, Boivin G, Ancey P-B, Gkasti A, Mussard J, Engblom C, et al. Efficient and specific Ly6G+ cell depletion: A change in the current practices toward more relevant functional analyses of neutrophils. bioRxiv 2018:498881 doi 10.1101/498881. [DOI]
- 25.Borst J, Ahrends T, Bąbała N, Melief CJM, Kastenmüller W. CD4+ T cell help in cancer immunology and immunotherapy. Nature Reviews Immunology 2018;18(10):635–47 doi 10.1038/s41577-018-0044-0. [DOI] [PubMed] [Google Scholar]
- 26.Van Gassen S, Callebaut B, Van Helden MJ, Lambrecht BN, Demeester P, Dhaene T, et al. FlowSOM: Using self-organizing maps for visualization and interpretation of cytometry data. Cytometry Part A : the journal of the International Society for Analytical Cytology 2015;87(7):636–45 doi 10.1002/cyto.a.22625. [DOI] [PubMed] [Google Scholar]
- 27.Zabransky DJ, Nirschl CJ, Durham NM, Park BV, Ceccato CM, Bruno TC, et al. Phenotypic and functional properties of Helios+ regulatory T cells. PloS one 2012;7(3):e34547 doi 10.1371/journal.pone.0034547. [DOI] [PMC free article] [PubMed] [Google Scholar]
- 28.Wei SC, Levine JH, Cogdill AP, Zhao Y, Anang NAS, Andrews MC, et al. Distinct Cellular Mechanisms Underlie Anti-CTLA-4 and Anti-PD-1 Checkpoint Blockade. Cell 2017;170(6):1120–33.e17 doi 10.1016/j.cell.2017.07.024. [DOI] [PMC free article] [PubMed] [Google Scholar]
- 29.Shang B, Liu Y, Jiang SJ, Liu Y. Prognostic value of tumor-infiltrating FoxP3+ regulatory T cells in cancers: a systematic review and meta-analysis. Scientific reports 2015;5:15179 doi 10.1038/srep15179. [DOI] [PMC free article] [PubMed] [Google Scholar]
- 30.Gubin MM, Esaulova E, Ward JP, Malkova ON, Runci D, Wong P, et al. High-Dimensional Analysis Delineates Myeloid and Lymphoid Compartment Remodeling during Successful Immune-Checkpoint Cancer Therapy. Cell 2018;175(4):1014–30.e19 doi 10.1016/j.cell.2018.09.030. [DOI] [PMC free article] [PubMed] [Google Scholar]
- 31.Spranger S, Dai D, Horton B, Gajewski TF. Tumor-Residing Batf3 Dendritic Cells Are Required for Effector T Cell Trafficking and Adoptive T Cell Therapy. Cancer cell 2017;31(5):711–23.e4 doi 10.1016/j.ccell.2017.04.003. [DOI] [PMC free article] [PubMed] [Google Scholar]
- 32.Salmon H, Idoyaga J, Rahman A, Leboeuf M, Remark R, Jordan S, et al. Expansion and Activation of CD103(+) Dendritic Cell Progenitors at the Tumor Site Enhances Tumor Responses to Therapeutic PD-L1 and BRAF Inhibition. Immunity 2016;44(4):924–38 doi 10.1016/j.immuni.2016.03.012. [DOI] [PMC free article] [PubMed] [Google Scholar]
- 33.Hildner K, Edelson BT, Purtha WE, Diamond M, Matsushita H, Kohyama M, et al. Batf3 Deficiency Reveals a Critical Role for CD8α+ Dendritic Cells in Cytotoxic T Cell Immunity. Science 2008;322(5904):1097–100 doi 10.1126/science.1164206. [DOI] [PMC free article] [PubMed] [Google Scholar]
- 34.Roberts EW, Broz ML, Binnewies M, Headley MB, Nelson AE, Wolf DM, et al. Critical Role for CD103(+)/CD141(+) Dendritic Cells Bearing CCR7 for Tumor Antigen Trafficking and Priming of T Cell Immunity in Melanoma. Cancer cell 2016;30(2):324–36 doi 10.1016/j.ccell.2016.06.003. [DOI] [PMC free article] [PubMed] [Google Scholar]
- 35.Maier B, Leader AM, Chen ST, Tung N, Chang C, LeBerichel J, et al. A conserved dendritic-cell regulatory program limits antitumour immunity. Nature 2020;580(7802):257–62 doi 10.1038/s41586-020-2134-y. [DOI] [PMC free article] [PubMed] [Google Scholar]
Associated Data
This section collects any data citations, data availability statements, or supplementary materials included in this article.