Abstract
White adipose tissue (WAT) is an essential regulator of energy storage and systemic metabolic homeostasis. Regulatory networks consisting of immune and structural cells are necessary to maintain WAT metabolism, which can become impaired during obesity in mammals. Using single-cell transcriptomics and flow cytometry, we unveil a large-scale comprehensive cellular census of the stromal vascular fraction (SVF) of healthy lean and obese human WAT. We report novel subsets and developmental trajectories of adipose-resident innate lymphoid cells (ILCs), dendritic cells (DCs) and monocyte-derived macrophage populations that accumulate in obese WAT. Analysis of cell-cell ligand receptor interactions and obesity-enriched signaling pathways revealed a switch from immunoregulatory mechanisms in lean WAT to inflammatory networks in obese WAT. These results provide a detailed and unbiased cellular landscape of homeostatic and inflammatory circuits in healthy human WAT.
White adipose tissue (WAT) is the primary metabolic organ utilized for energy storage in mammals. During dietary nutrient excess, adipocytes store energy in the form of triacylglycerides to fuel peripheral organ metabolism during states of caloric restriction through fatty acid release1. Chronic caloric excess results in the expansion of the WAT through adipocyte hyperplasia and hypertrophy, resulting in increased body mass and obesity1. Due to limits on adipocyte fat storage and cell size, adipocytes can undergo chronic stress responses and apoptosis during obesity, leading to WAT inflammation that contributes to a systemic low-grade inflammatory state associated with cardiovascular disease and Type 2 diabetes (T2D)1,2. However, the cell types and mechanisms responsible for initiating human WAT inflammation during obesity remain poorly understood.
In mice, diet-induced or genetic obesity-associated increases in the cytokines tumor necrosis factor (TNF) and IL-6 in addition to miRNA-containing exosomes produced by proinflammatory macrophages can subsequently reduce systemic insulin sensitivity over time3. Furthermore, recruitment and activation of type 1 immune cells such as CD8+ T cells, TH1 cells, NK cells and type 1 innate lymphoid cells (ILC1) contribute to the accumulation of proinflammatory macrophages in the adipose tissue in an IFN-γ-dependent manner4. However, current clinical strategies to target individual proinflammatory cytokines or pathways induced by WAT macrophages in obese patients (i.e. anti-TNF) are either ineffective or only moderately improve insulin sensitivity in obese T2D patients, suggesting that multiple overlapping pathways likely maintain WAT inflammation in humans5. Given that the prevalence of obesity is expected to increase to nearly 50% of the US population by 20306, there is a pressing need to understand the complete cellular composition and cell type specific inflammatory network of the healthy human WAT in order to dissect the mechanisms that may lead to systemic chronic low-grade inflammation and obesity-associated metabolic dysfunction.
Recent studies employing single cell RNA-seq (scRNAseq) or single nuclei RNA-seq have provided broad characterization of the composition of the stromal vascular fraction (SVF) and adipocytes of human WAT7–9. While these studies have discovered abundant adipocyte, stromal and macrophage populations with unique roles in WAT homeostasis, their scale was too limited to represent the full extent of immune cell heterogeneity present in the tissue. Thus, whether previously annotated WAT immune populations represented bona fide cell lineages, activation or developmental states, or a complex mixture of unidentified cell types remained unknown. Therefore, we sought to generate a large scale, high-dimensional analysis of sorted immune cells derived from healthy lean and obese patient WAT to more precisely define the changes in immune composition and signaling networks that are associated with human obesity at single cell resolution.
Our analysis of approximately 110,000 human cells present in the SVF of human WAT revealed 28 distinct cell types, including 8 previously uncharacterized immune populations. These consisted of unique subsets of adipose-resident natural killer (NK) cells, innate lymphoid cells (ILCs), macrophages and dendritic cells (DCs). Using independent cohorts of healthy patient samples, we demonstrated that distinct subsets of stromal cells, T cells, DCs, macrophages and ILCs accumulate in obese WAT by flow cytometry. Finally, analysis of single cell ligand-receptor pairs and upstream regulators revealed distinct obesity-associated inflammatory interactomes and signalomes enriched in WAT-resident immune cells. Our high-dimensional single cell WAT atlas provides insight into the potential functions, regulation and interactions of known and novel human WAT cell types.
Results
Single cell sequencing reveals a diverse WAT immune system.
To understand the unbiased cellular composition of the SVF of healthy human WAT, we isolated single cell suspensions of deep subcutaneous abdominal adipose tissue from 3 lean and 3 obese patients. Patients were considered “healthy” if they had no history of cardiovascular or liver disease, diabetes, or immunological disorder. (Supplementary Table 1). Single cell suspensions were sorted into CD45+ (hematopoietic) and CD45− (non-hematopoietic) cells for each patient sample, and then profiled using 10x Genomics Chromium droplet scRNA-seq (Fig. 1a). The resulting quality-controlled human WAT SVF single cell atlas included 82,577 cells that were clustered based on differential expression of marker genes and visualized using a uniform manifold approximation and projection (UMAP) plot (Fig. 1b, Extended Data Fig. 1a, Supplementary Table 2). Cluster annotation and identification was corroborated using overlapping marker genes from the Human Cell Atlas and previous scRNA-seq datasets profiling human immune lineages and parenchymal cells10–14. Clustering analysis revealed 19 distinct clusters: adipocyte precursor cells (APC), preadipocytes (pAD), smooth muscle cells (SMC), endothelial cells (Endo), conventional type 1 DCs (cDC1), perivascular macrophages (PVM), non-classical monocytes (ncMo), B cells, naïve CD4+ T cells, naïve CD8+ T cells, cytotoxic CD8+ T cells, CD8+ γδ T cells, regulatory T cells (Treg), mucosal-associated invariant T cells (MAIT), mature natural killer (mNK) cells, and 4 previously uncharacterized clusters of myeloid-like cells, conventional type 2B DC-like cells (cDC2B), NK-like cells, and non-NK ILCs (Extended Data Fig. 1a,b,Extended Data Fig. 2a–c).
Figure 1. Single cell sequencing reveals the cellular heterogeneity of the stromal vascular fraction of human WAT.
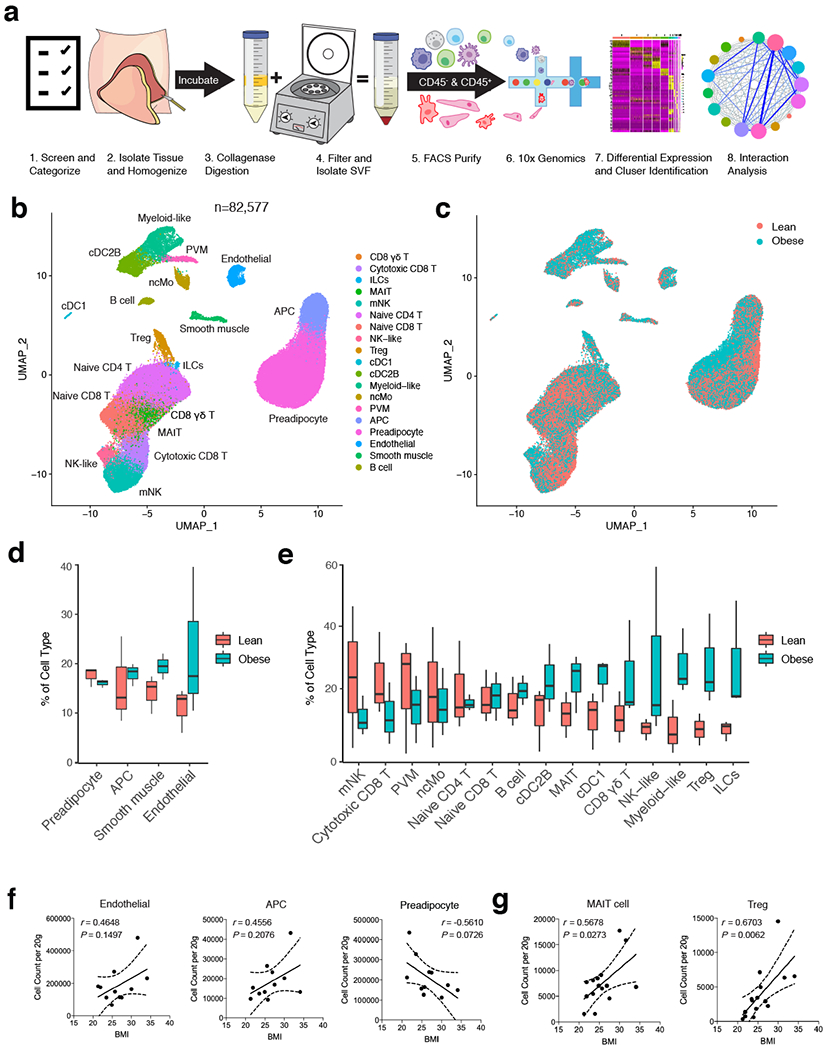
(a) Schematic of the experimental pipeline. Human adipose tissue was isolated from healthy patients (patient information in Supplementary Table 1), dissociated into single cell suspensions, sorted into CD45+ and CD45− cells, and analyzed using 10x Genomics Chromium droplet single cell RNA sequencing. Cells were clustered via differential gene expression and ligand-receptor analysis was performed to assess interaction among cell types. (b,c) UMAP plot of 82,577 human adipose cells isolated from the SVF of 3 lean and 3 obese patients. (b) Annotations are derived from cluster-specific analysis (Extended Data Fig. 1) (c) UMAP indicating the patient sample classification as lean (red) or obese (blue). (d,e) Boxplots showing the proportion of non-immune (d) and immune (e) cells derived from n=3 lean (red) and n=3 obese (blue) patients for each cell type. Centre, median; box limits, upper and lower quartiles; whiskers, 1.5× interquartile range (IQR). (f,g) Density correlation analysis of accumulating non-immune (f) and T cell (g) subsets with patient BMI. Line of best fit and 95% confidence intervals are shown for each plot. Each point represents an individual patient. Linear regression and two-tailed Pearson Correlation analysis with 95% confidence intervals were conducted. p < 0.05 was considered significant.
Identified clusters contained cells from both lean and obese WAT samples, suggesting that each identified cell type was associated with a common cell lineage rather than derived from a single patient sample (Fig. 1c). Analysis of the frequency of lean and obese patient cells in each cluster revealed an increased proportion of endothelial cells and adipose-resident dendritic cells, unconventional T cells, ILCs, myeloid-like and NK-like cells in obese WAT samples. In contrast, frequency analysis suggested a decreased or unchanged proportion of preadipocytes, circulating CD8+ and CD4+ T cell subsets, B cells, and other myeloid populations (Fig. 1d,e). To interrogate these changes, we first used an independent cohort of 4 lean, 4 overweight, and 3 obese individuals to validate all identified structural cell and conventional and innate-like T cell populations by flow cytometry (Extended Data Fig. 1c, Extended Data Fig. 2d, Supplementary Table 3). Using an additional cohort of 4 lean patients, we confirmed KLRB1 (CD161) expression on a defined population of MAIT cells and detected the presence of CD4+CD8− and CD4−CD8− γδ T cells in addition to a rare population of Vα24-α18-positive invariant natural killer T cells (iNKT) cells that could not be resolved by our 36,601 non-B cell lymphoid lineage scRNA-seq dataset (Extended Data Fig. 2e,f, Supplementary Table 3). Flow cytometry further supported our scRNAseq analysis, demonstrating that WAT endothelial and APCs, as well as γδ T, MAIT, CD4+T cells, and Treg cells positively correlated with increasing patient BMI. In contrast, SMCs, pADs, and CD8+ T cells had a negative correlation. Interstitial progenitor cells had no correlation with patient BMI (Fig. 1f,g, Extended Data Fig. 1d, Extended Data Fig. 2g). While these results suggested that human obesity is associated with an accumulation of diverse non-immune and lymphoid cell lineages consistent with tissue-resident phenotypes, how WAT-resident ILC and myeloid populations changed during obesity remained unclear. Several of the obese-enriched cell clusters (NK-like, myeloid-like, ILCs, cDC2B-like) likely represented heterogeneous populations of transcriptionally similar cell types or novel cell subsets that have not been described previously, suggesting that analysis of a larger sample size from sorted subsets was necessary to confirm cell lineage identification.
Unique WAT-resident ILC subsets accumulate in obese patients.
Previous studies from mice and humans suggest that ILCs consist of a heterogeneous family that can be classified into three distinct groups based on the expression of transcription factors, cell surface markers, and effector cytokines15. Our CD45+ sorted scRNA-seq dataset suggested that CD200R1 expression could distinguish ILCs from mNKs, similar to previous studies performed in mice and human PBMCs16,17. To examine whether further cellular heterogeneity existed in human WAT ILCs, we pooled single cell suspensions from the WAT of either 7 lean or 5 obese patients and sorted CD45+Lin−CD7+CD200R1+ or CD45+Lin−CD7+CD200R1− populations that were subsequently analyzed using scRNA-seq (Extended Data Fig. 3a, Supplementary Table 4). Assessment of 14,849 pooled cells from both sorted populations revealed 7 distinct clusters based on differential expression of marker genes (Fig. 2a, Extended Data Fig. 3b, Supplementary Table 5). Similar to the CD45+ sorted scRNAseq dataset, mNK cells comprised a distinct cluster marked by expression of FCGR3A, FGFBP2, KLRF1, and EOMES (Fig. 2b, Extended Data Fig. 3b,c). However, we also identified the presence of two additional distinct NK subsets derived from CD45+Lin−CD7+CD200R1− cells that expressed lower levels of FCGR3A and KLRF1 and displayed similar cluster marker expression with the previously identified NK-like cluster: one cluster of NK-like cells discerned by expression of IL7R, SELL, and CD2 similar to previously described CD56bright immature NK (iNK) cells in human peripheral tissues18, and a population of NK-like cells distinguished by expression of CXCR6, KLRC1, and GZMK consistent with tissue resident NK (trNK) cells described in the human liver19,20 (Fig. 2b, Extended Data Fig. 3b,c). 4 clusters did not express the NK lineage associated genes IRF8, EOMES, KLRF1, NCAM1, or PRF1. Instead these clusters could be distinguished from NK lineage cells based on CD200R1 and IL7R co-expression and were derived from sorted CD45+Lin−CD7+CD200R1+ cells, but not CD45+Lin−CD7+CD200R1− cells, indicating that these clusters represented ILCs (Fig 2a–c, Extended Data Fig. 3b–d). WAT ILC clusters were defined based on differential expression of markers genes: GATA3, IL1RL1 consistent with ILC2 described in mice and humans21–23; ZNF683, TBX21 consistent with ILC1 described in mice16,24; CCR6, IL1R1, IL23R consistent with ILC3 described in mice and humans23,25,26; and SELL, IL1R1 consistent with circulating ILC precursor (ILCP) cells found in human blood27,28 (Fig. 2b,c, Extended Data Fig. 3b,c). These results confirmed that CD200R1 could be used as a bona fide surface marker to distinguish ILCs from NK lineage cells in human WAT. Analysis of the frequency of lean and obese patient cells in each cluster suggested an accumulation of trNK and ILC3 in obese WAT, with a decrease in mNK and ILCP-like cells and little change in other identified subsets (Extended Data Fig. 3e).
Figure 2. Single cell analysis unveils unique human WAT-resident ILC subsets.
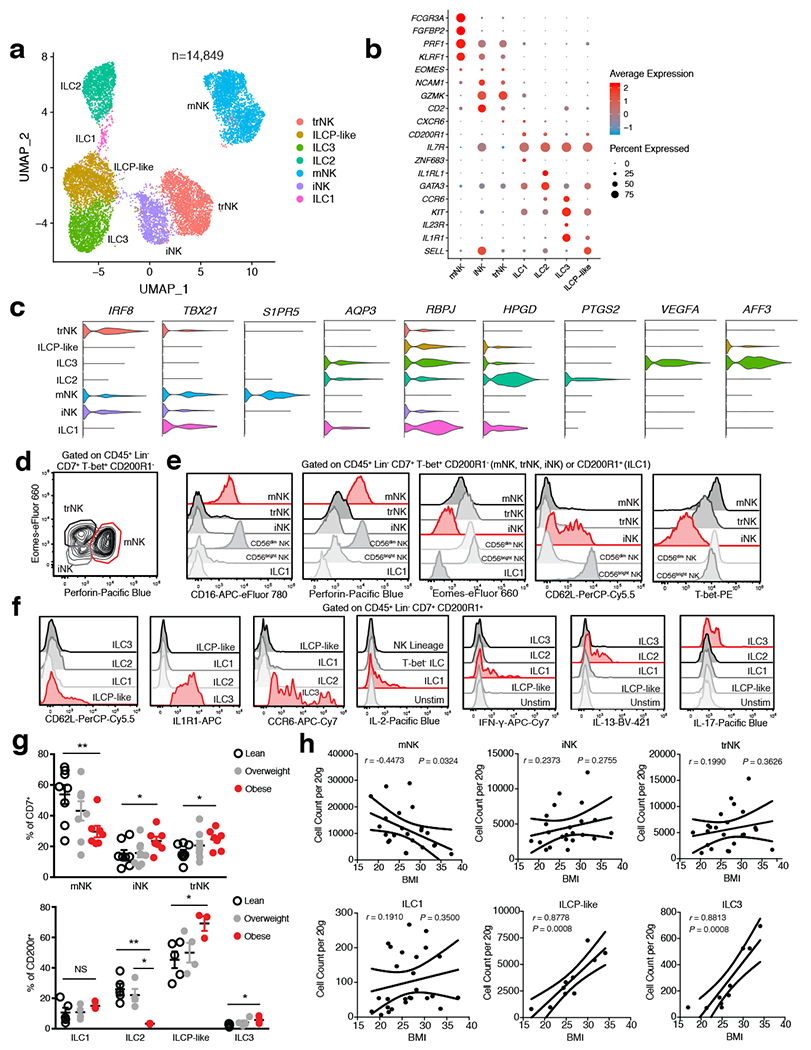
(a) UMAP plot of 14,849 human WAT CD45+Lin−CD7+CD200R1+ ILCs or CD45+Lin−CD7+CD200R1− NK cells isolated from the SVF of an independent cohort of 7 lean and 5 obese patients. Cluster analysis yields 7 distinct clusters comprising of ILCs and NK cells. (b) Dot plot showing selected top differentially expressed genes for the populations depicted. Color saturation indicates the strength of expression in positive cells, while dot size reflects the percentage of each cell cluster expressing the gene. (c) Violin plots showing RNA expression levels of selected cluster markers for indicated cell clusters. (d) Representative gating strategy for scRNAseq-defined human WAT NK cell populations (CD45+Lin−(CD3+TCRαβ+CD19+CD34+CD14+CD5+TCRγδ+)CD7+TBET+CD200R1−): mature NK (mNK): EOMES+PERFORIN+, tissue resident NK (trNK): EOMEShiPERFORINint, immature NK (iNK): EOMESloPERFORINint. (e) Representative histograms of CD16, Perforin, Eomes, CD62L, and T-bet expression on human WAT NK, ILC1 and CD56dim and CD56bright NK PBMC populations. (f) Representative histograms of CD62L, IL1R1, CCR6, IL-2, IFN-γ, IL-13, and IL-17 expression on human WAT ILC populations. Unstim refers to CD45+Lin−CD7+CD200R1+ cells cultured without PMA and Ionomycin. (g) Relative frequencies of innate lymphoid cell populations as a percentage of Lin−CD7+ cells (above; n=8 lean, n=8 overweight, and n=7 obese patients) or Lin−CD7+CD200R1+ cells (below; n=5 lean, n=4 overweight, and n=3 obese patients) isolated from the human WAT SVF. mNK: p=0.0065, iNK: p=0.0467, trNK: p=0.0138, ILC2 lean vs. obese: p=0.0032, ILC2 overweight vs. obese: p=0.0113, ILCP-like: p=0.0255, ILC3: p=0.0341. (h) Density correlation analysis of the depicted ILC types with patient BMI. Line of best fit and 95% confidence intervals are shown for each plot. (d-f) Data is representative of 3 individual patient samples. Each point represents an individual patient. Samples were compared using two-tailed Student’s t test with Welch’s correction, assuming unequal SD, and data are presented as individual points with the mean ± SEM (*p<0.05, **p<0.01). Linear regression and two-tailed Pearson Correlation analysis with 95% confidence intervals were conducted. p < 0.05 was considered significant.
To functionally validate the existence of identified NK cell and ILC clusters, we utilized WAT samples from two additional cohorts of 26 (10 lean, 9 overweight, 7 obese) and 12 (5 lean, 4 overweight, 3 obese) patients, respectively (Supplementary Table 3). Flow cytometry experiments corroborated the results from our scRNA-seq analysis, supporting the identification of 3 distinct IFN-γ-producing NK cell populations based on PERFORIN, CD62L, CD16, TBET, and EOMES expression: TBEThiEOMESintPERFORINhiCD16+ mNK; TBETintEOMEShiPERFORINintCD16− trNK; TBETloEOMESloPERFORINintCD16−CD62L+/− iNK (Fig. 2d,e, Extended Data Fig. 4a,c). Comparison of WAT NK cell subsets with human PBMC-derived CD56dim and CD56bright NK cells suggested that while WAT mNK cells phenotypically overlap with CD56dim NK cells, WAT iNK and trNK were phenotypically distinct from CD56bright NK cells and likely represent unique subsets of the NK cell lineage found in the WAT (Fig. 2e). Furthermore, mature CD200R1+ ILC populations did not express PERFORIN or EOMES, and could be discerned based on the expression of several surface markers and signature cytokines following stimulation: TBET, IFN-γ, and IL-2 expression defined ILC1; CRTH2 and IL-13 expression defined ILC2; NKp44, IL1R1, CCR6, RORChi and IL-17A expression defined ILC3 (Fig 2e,f, Extended Data Fig. 4b,d,e). CD62L, the lack of other mature ILC markers, and the absence of cytokine production defined the ILCP-like population, similar to results obtained with CD200R1+CD62L+ ILCPs derived from human PBMCs (Fig. 2f, Extended Data Fig. 4d–f). To confirm whether specific subsets of WAT ILCs accumulate during obesity, we examined the frequency and density of each identified NK and ILC population from WAT samples of lean, overweight, and obese patients. WAT mNK cells displayed decreased frequency and density in obese compared to lean patients, and negatively correlated with patient BMI (Fig. 2g,h, Extended Data Fig. 4h). iNK and trNK cells increased in frequency, but not density, and did not significantly correlate with patient BMI, suggesting that iNK and trNK cells do not accumulate during obesity, but represent a larger proportion of NK cell subsets in obese WAT due to depletion of mNK cells (Fig. 2g,h, Extended Data Fig. 4h). Analysis of adipose-resident ILC populations revealed similar frequencies and densities of ILC1s in lean and obese patients (Fig. 2g,h, Extended Data Fig. 4i). ILC2s decreased in frequency and in density in obese patients, consistent with previous reports in humans and mice21, but did not significantly negatively correlate with increasing patient BMI due to similar densities of WAT ILC2s in overweight and lean patients (Fig. 2g, Extended Data Fig. 4g,i). ILC3s and ILCP-like cells increased in frequency and density in obese WAT, and positively correlated with patient BMI, suggesting that WAT-resident ILC3s preferentially accumulate in obese patients compared to other mature ILC subsets (Fig. 2g,h, Extended Data Fig. 4i).
While circulating CD62L+ ILCPs have been found to give rise to all mature ILCs in humans28, UMAP visualization of sorted ILC subsets suggested that the identified WAT ILCP-like population was more transcriptionally similar to ILC1s and ILC3s than to ILC2s, suggesting that ILCP-like cells might rather represent a committed precursor to ILC1s and ILC3s. To test this hypothesis, we utilized RNA Velocity Analysis29 to determine the transcriptional fate of the ILCP-like population in silico (Fig. 3a). Projection of the velocity field arrows onto the UMAP plot extrapolated future states of ILCP-like cells to both mature ILC1 and ILC3 populations (Fig. 3a). Furthermore, CytoTRACE analysis30 suggested that ILCP-like cells represented less differentiated cells and that progression towards either the ILC1 or ILC3 cell states increased the differentiation score (Fig. 3b). Manually averaged principal curves were assigned based on RNA velocity and CytoTRACE analysis, suggesting a clear developmental trajectory from ILCP-like cells to ILC1 and ILC3, but not ILC2 populations (Fig. 3c). Monocle pseudotime analysis further corroborated the ILCP-like to ILC1 and ILC3 transition, and assessment of the frequency of lean and obese patient cells in each cell cluster revealed a shift in frequency from ILCP-like and ILC1s in lean samples to ILC3 in obese samples (Fig. 3d,e). Analysis of differentially expressed genes (DEGs) between the ILC1 and ILC3 fates from ILCP-like cells showed a clear bifurcation, further suggesting a developmental switch to the ILC3 fate during obesity (Extended Data Fig. 5). Ingenuity pathway analysis (IPA) implicated both IL-23 and STAT3 signaling as important mediators of the transition to the ILC3 fate, whereas IFN-α coupled with ID2 and STAT5B signaling regulated the transition to the ILC1 fate (Fig. 3f,g, Supplementary Table 6,7). These results suggest that a previously unidentified shared ILC1-ILC3 precursor exists in the human WAT, and that the accumulation of WAT-resident ILC3 during obesity may be due to increased ILC3 differentiation from ILCP-like cells.
Figure 3. RNA velocity and CytoTRACE analysis identifies a shared ILC precursor to mature adipose ILC1 and ILC3.
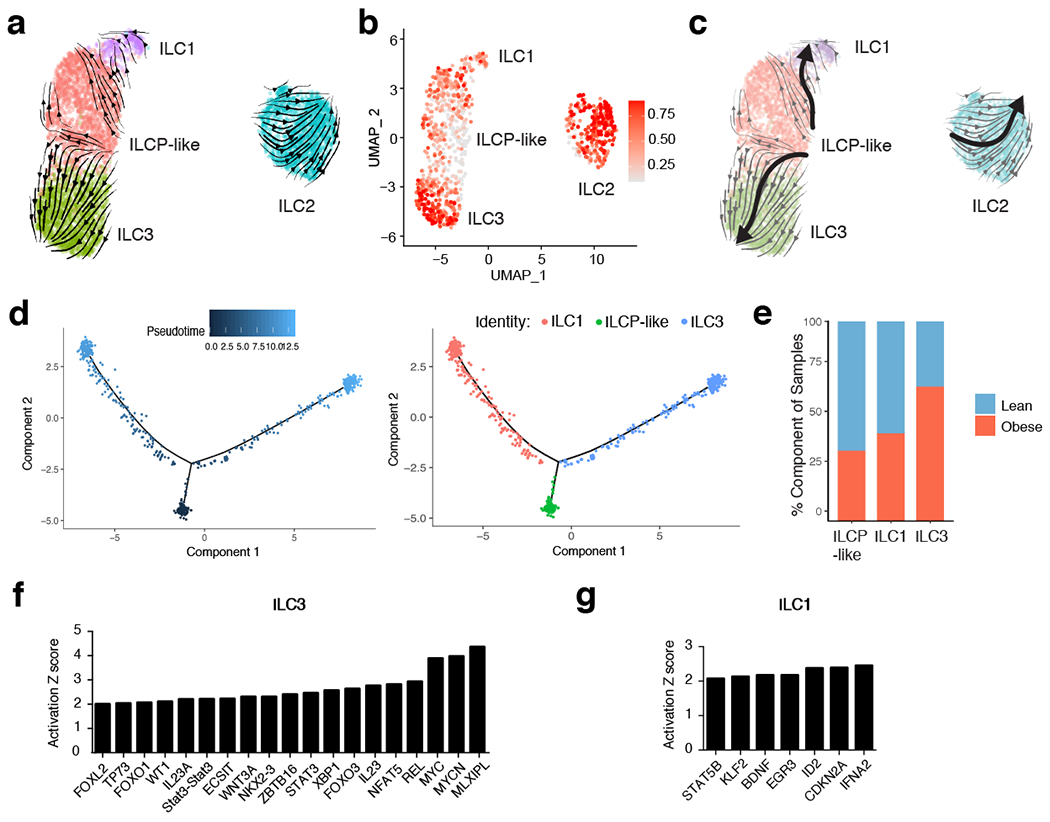
(a) RNA Velocity analysis of WAT ILC clusters with velocity field projected onto the UMAP plot of human adipose ILCs subclustered from Figure 2. Arrows show the local average velocity evaluated on a regular grid and indicate the extrapolated future states of cells. (b) CytoTRACE scatter plot of WAT ILC clusters. Color indicates the level of differentiation from low (grey) to high (red). (c) UMAP plot of WAT ILC clusters with velocity arrows and corresponding principal curve shown in bold. Principal curve indicates the manually averaged differentiation directionality projected by RNA Velocity and CytoTRACE analysis. (d) Monocle analysis of the ILCP-like, ILC1, and ILC3 populations indicating pseudotime directionality (left) and cell type (right); ILC1 (red), ILCP-like (green), ILC3 (blue). (e) Bar plots showing the proportion of the indicated ILC clusters derived from pooled 7 lean or 5 obese patients. (f,g) IPA Analysis of putative upstream regulators of the ILCP-like to ILC3 transition (f) or the ILCP-like to ILC1 transition (g).
Distinct DC and macrophage subsets accumulate in obese WAT.
To examine whether further cellular heterogeneity existed in human WAT myeloid cells, we pooled single cell suspensions either from the WAT of 7 lean or 5 obese patients and sorted CD45+Lin−CD11b+CD14+ and CD45+Lin−CD11bintCD14intHLA-DR+CD11c+ populations that were subsequently analyzed using scRNA-seq (Extended Data Fig. 6a, Supplementary Table 4). Assessment of pooled cells from both sorted populations resolved 12,824 healthy human WAT DCs, macrophages, monocytes, and neutrophils that clustered into ten distinct populations based on differential expression of marker genes (Fig. 4a,b, Extended Data Fig. 6b–d, Supplementary Table 8). Our analysis identified three populations of monocytes: non-classical monocytes (ncMo) based on expression of FCGR3A and HES4, Mo-1 by expression of FCER1A, and Mo-2 via increased expression of CSF3R, FCAR, and SELL in comparison to Mo-1 (Fig. 4b, Extended Data Fig. 6b–d). Using cluster annotation and cell cluster identification data from the Human Cell Atlas and other previously published datasets10–12,31, we created module scores to assess the identity of the Mo-1 and Mo-2 populations (Supplementary Table 9). Analysis of gene expression data and module score results suggested that Mo-1 and Mo-2 both displayed enrichment for the classical monocyte gene module, suggesting the presence of two cell states of classical monocytes (Extended Data Fig. 6e). scRNAseq analysis also identified a population of human WAT neutrophils based on expression of THBS1 and S100A12 which displayed enrichment for the neutrophil gene module compared to other myeloid cell clusters (Fig. 4b, Extended Data Fig. 6b,c,f). We confirmed the presence of 2 previously identified macrophage subsets present within the human WAT: TREM2, CD9, and LPL expressing lipid-associated macrophages (LAM)8, LYVE1, SELENOP, and C1Q expressing perivascular macrophages (PVM)32, and an uncharacterized inflammatory macrophage (IM) population with high expression of CCL3L1, TNF, and CXCL3 (Fig 4b, Extended Data Fig. 6b,c). Furthermore, analysis of the frequency of lean and obese patient cells in each cluster revealed an accumulation of IM, LAM, Mo-1, and Mo-2 cells with a decrease in PVMs, neutrophils, and ncMos in obese patient samples (Extended Data Fig. 6g). To confirm the presence of scRNA-seq-identified cell lineages, we utilized WAT from an additional patient cohort (7 lean, 7 overweight, 7 obese) (Supplementary Table 3). Analysis of macrophage populations corroborated the results from our scRNA-seq data by supporting the identification of three different CD11B+CD14+CD15−CD64+CD68+ macrophage subsets (Fig. 4c, Extended Data Fig. 7a,b). WAT macrophage subsets were defined based on differential expression of MRC1 (CD206) and CD11c, with expression of CD9 distinguishing CD206+CD11c+ LAMs, and CD206+CD11c− distinguishing WAT PVMs as described previously8,32,33 (Fig. 4c,d). To confirm that CD206−CD11c+ WAT macrophages represented IMs, we harvested WAT from an additional cohort of individuals (4 lean, 2 overweight, 4 obese) and profiled endogenous IL-1β and TNF production by flow cytometry (Supplementary Table 3). While PVMs showed little endogenous production of TNF or IL-1β, both LAMs and IMs showed increased IL-1β production and a trend toward higher TNF production in obese compared to lean patients, suggesting that IM and LAM populations are subsets of proinflammatory macrophages in obese WAT (Fig. 4e, Extended Data Fig. 7c).
Figure 4. Single cell analysis identifies unique cell lineages within human WAT myeloid populations.
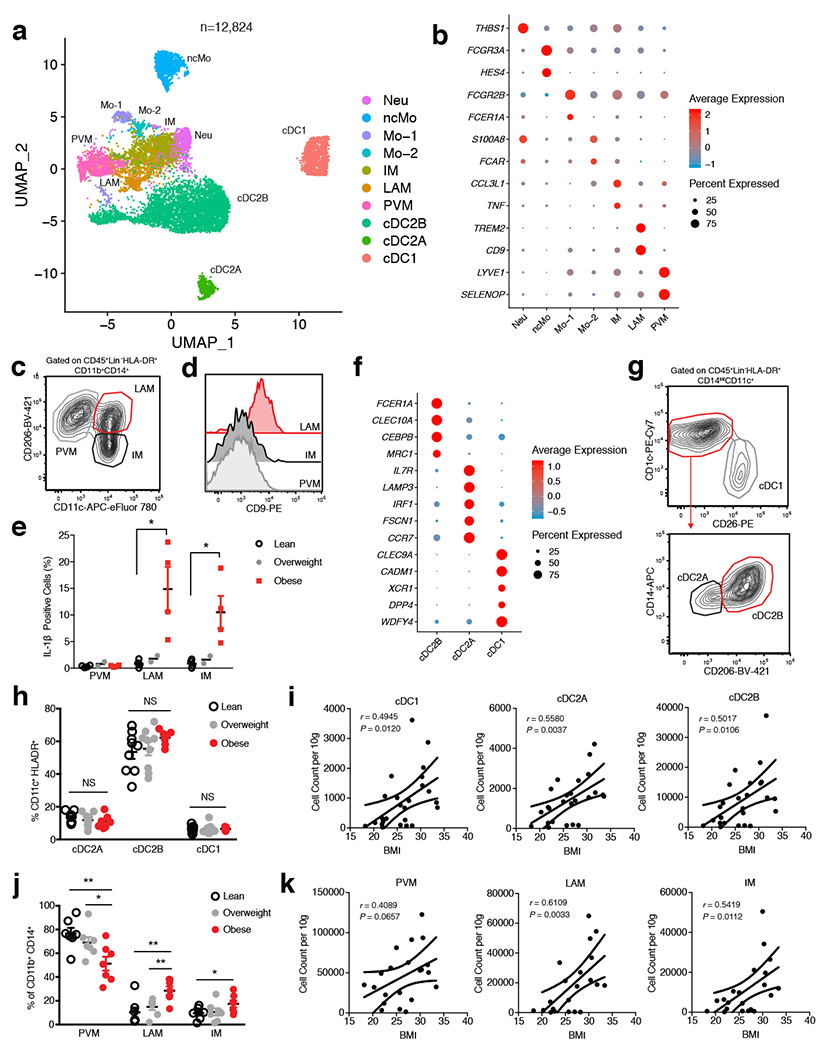
(a) UMAP plot of 12,824 pooled human adipose myeloid cells isolated from the SVF of 7 lean and 5 obese patients. Cluster analysis yields 10 distinct clusters comprising of DCs, macrophages, monocytes and neutrophils. (b) Dot plot showing selected top differentially expressed genes for the neutrophil, monocyte, and macrophage populations depicted. (c) Representative gating strategy for scRNAseq-defined human WAT macrophage populations (CD45+Lin−(CD3+TCRαβ+CD19+CD34+CD5+CD7+CD1c+)HLA-DR+CD11b+CD14+): Perivascular macrophage (PVM): CD206+CD11c−, Lipid-associated macrophage (LAM): CD206+CD11c+, Inflammatory macrophage (IM): CD206−CD11c+. (d) Representative flow cytometry histogram of CD9 expression on human WAT macrophage populations. (e) Flow cytometry analysis of endogenous IL-1β production by human WAT macrophage subsets from an additional n=4 lean, n=2 overweight, and n=4 obese patients. LAM: p=0.0158, IM: p=0.0204. Each point represents an individual patient. (f) Dot plot showing selected top differentially expressed genes for indicated DC subsets. (g) Representative gating strategy for scRNAseq-defined human WAT dendritic cell populations (CD45+Lin−(CD3+TCRαβ+CD19+CD34+CD7+CD16+CD88+CD89+)HLA-DR+CD14intCD11c+): conventional type 1 dendritic cell (cDC1): CD1c−CD26+, conventional type 2 dendritic cell A (cDC2A): CD1c+CD26−CD206−CD14int, conventional type 2 dendritic cell B (cDC2B): CD1c+CD26−CD206+CD14hi. (h) Relative frequencies of DC subsets as a percentage of Lin−CD11c+HLA-DR+ cells isolated from the SVF of WAT from n=9 lean, n=9 overweight, and n=7 obese patients. (i) Density correlation analysis of the depicted DC subsets with patient BMI. Line of best fit and 95% confidence intervals are shown for each plot. (j) Relative frequencies of macrophage populations as a percentage of Lin−CD11b+CD14+ cells isolated from the SVF of WAT from n= 7 lean, n=7 overweight, and n=7 obese patients. PVM lean vs. obese: p=0.0054, PVM overwieight vs. obese: p=0.0362, LAM lean vs. obese: p=0.0052, LAM overweight vs. obese: p=0.0088, IM: p=0.0404. (k) Density correlation analysis of the indicated macrophages with patient BMI. Line of best fit and 95% confidence intervals are shown for each plot. Each point represents an individual patient. (c,d,g) Data is representative of 3 individual patient samples. Samples were compared using two-tailed Student’s t test with Welch’s correction, assuming unequal SD, and data are presented as individual points with the mean ± SEM (*p<0.05, **p<0.01). Linear regression and two-tailed Pearson Correlation analysis with 95% confidence intervals were conducted. p < 0.05 was considered significant.
In contrast to our CD45+ sorted scRNA-seq dataset, DC-sorted scRNAseq analysis identified three distinct WAT DC populations: classical type 1 dendritic cells (cDC1) defined by expression of IRF8, DPP4, CADM1, and XCR1, classical type 2 dendritic cells subset A (cDC2A), via expression of CD1C, IRF4, IL7R and LAMP3, and cDC2B, by increased expression of CD1C, IRF4, FCER1A and CLEC10A, consistent with phenotypes of DC subsets recently reported in human blood34 (Fig. 4f, Extended Data Fig. 6b,c, Supplementary Table 4). Validation of DC subsets within the human WAT tissue was performed using an additional patient cohort (9 lean, 9 overweight, 7 obese) and confirmed the presence of three distinct populations (Fig. 4g, Extended Data Fig. 7a, Supplementary Table 3). WAT cDC1s were distinguished by expression of DPP4 (CD26) CD26+CD1C−, while cDC2s could be differentiated into two subsets by expression of CD206, CD14, FCER1A, and CLEC10A: cDC2B (CD26−CD1C+CD206+CD14hiFCER1A+CLEC10A+); cDC2A (CD26−CD1C+CD206-CD14intFCER1A−CLEC10A−) (Fig. 4g, Extended Data Fig. 7d). While DC subset frequencies did not change, their densities increased in obese compared to lean patients, positively correlating with increasing patient BMI (Fig. 4h,i, Extended Data Fig. 7e). Furthermore, IMs and LAMs were not present in high frequencies or densities in lean WAT, but drastically accumulated in obese WAT and positively correlated with increasing patient BMI (Fig. 4j,k, Extended Data Fig. 7f,g). Altogether, these data suggest that cDC1, cDC2B, cDC2A, LAM, and IM populations accumulate in obese human WAT (Fig.4h–k, Extended Data Fig. 7e,g).
Classical monocytes differentiate into PVM and IM in WAT.
Studies in mice have shown that recruitment of CCR2-dependent monocytes is required for adipose tissue inflammation, proinflammatory macrophage accumulation, and insulin resistance35,36. While these studies suggest that circulating monocytes give rise to the majority of inflammatory macrophages in obese mice, previous work has also proposed that WAT-resident macrophages are polarized to a metabolically activated proinflammatory phenotype37,38. However, the ontogeny and upstream regulators of inflammatory macrophages in human WAT are not well understood. To test whether scRNA-seq identified monocyte or macrophage subsets were precursors to WAT IMs and LAMs, we used RNA velocity analysis (Fig. 5a). UMAP visualization of manually subclustered monocyte and macrophage subsets suggested that the Mo-1 population was most transcriptionally related to both the Mo-2 and PVM populations, whereas Mo-2 appeared to be more transcriptionally similar to IM. Projection of the velocity field arrows onto the UMAP plot showed a strong directional flow of the Mo-1 cluster to both PVM and IM fates, suggesting that human WAT macrophages are derived from the Mo-1 cell state in silico (Fig. 5a). CytoTRACE analysis indicated that both PVM and a subset of Mo-1 were the least differentiated cell states, while LAM, Mo-2 and IM represented more highly differentiated cell types (Fig. 5b). Manually averaged principal curves incorporating both RNA velocity vectors and CytoTRACE differentiation scores suggested distinct developmental trajectories from Mo-1 to PVM and IM, with Mo-2 representing an additional transition state between Mo-1 and IMs in obese cells, as well as differentiation from PVM to LAM (Fig. 5c). Monocle pseudotime analysis further supported the bifurcation of PVM and IM fates from Mo-1 (Fig. 5d). Analysis of the frequency of lean and obese patient cells in each cell cluster displayed a preference of Mo-1 transitioning to IM rather than to PVM in obese cells, suggesting a developmental shift from monocyte-derived PVMs in lean patients to polarization of Mo-1 to IMs in obese WAT (Fig. 5e). Analysis of the DEGs between PVM and IM fates showed a clear bifurcation in gene expression programs (Extended Data Fig. 8). We then assessed the potential upstream regulators of the DEGs between Mo-1 to PVM and IM as well as PVM to LAM using IPA (Fig. 5f–h, Supplementary Table 10–13). This implicated proinflammatory cytokines (TNF, IFN-γ, IL-1β, IL-6, OSM, and MIF) and signaling pathways (JUN-FOS) as significant mediators of the transition of Mo-1 to IM, whereas anti-inflammatory cytokines (IL-1RA, IL-13, and IL-37) and transcription factors (NANOG, MAFB, MEF2C, and GATA4) were suggested to regulate the transition to PVM (Fig. 5f,g). IPA suggested that the proinflammatory cytokines TNF, IFN-γ, IL-1β, and IL-12A and signaling pathways involving JUN-FOS mediated the transition from PVM to LAM (Fig. 5h). Our analysis also suggested hypoxic signaling pathways (HIF-1α, ARNT, EPASE1) as regulators of the PVM to LAM transition. Thus, these results suggest an obese WAT microenvironment-induced shift in monocyte-derived macrophage development towards proinflammatory subsets influenced by specific pro-inflammatory cytokines and hypoxia.
Figure 5. RNA velocity analysis uncovers a distinct monocyte state upstream of adipose inflammatory macrophages in obese individuals.
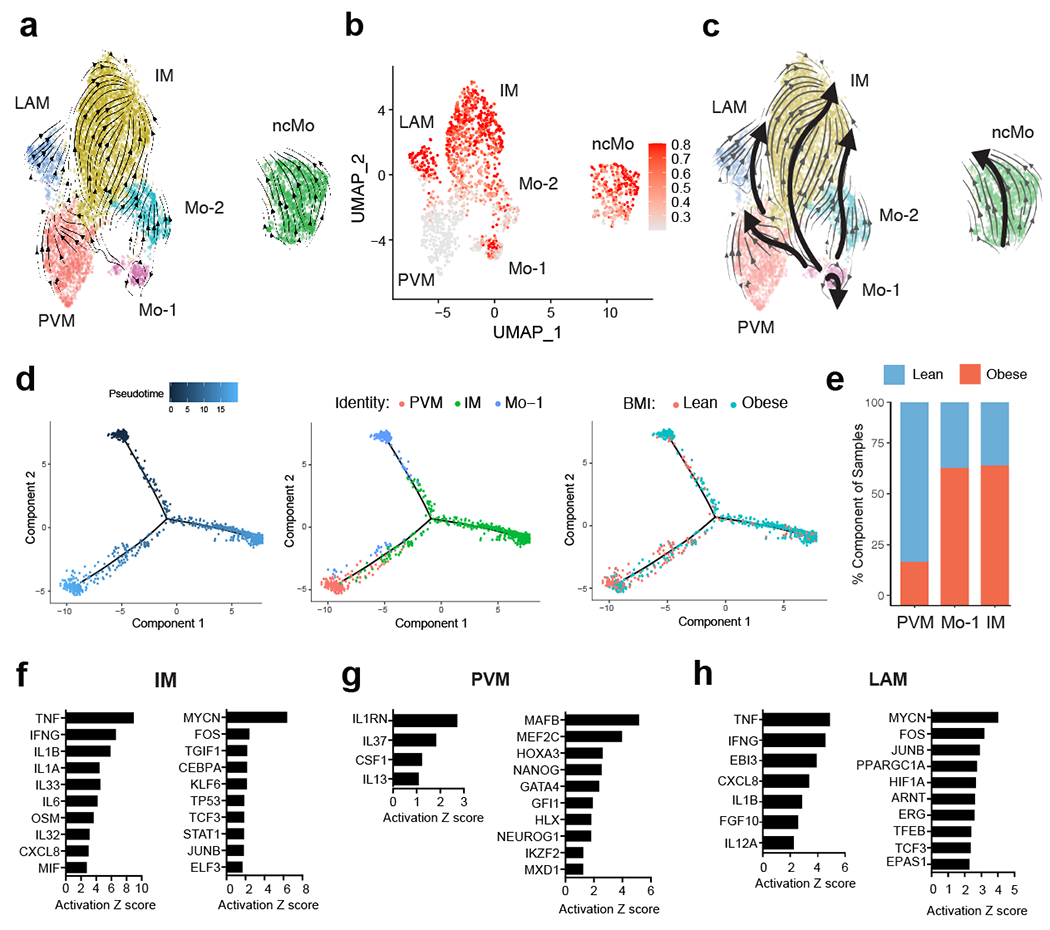
(a) RNA Velocity analysis of WAT monocyte and macrophage clusters with velocity field projected onto the UMAP plot of human adipose myeloid cells subclustered from Figure 4. Arrows show the local average velocity evaluated on a regular grid and indicate the extrapolated future states of cells. (b) CytoTRACE scatter plot of WAT monocyte and macrophage clusters. Color indicates the level of differentiation from low (grey) to high (red). (c) UMAP plot of WAT monocyte and macrophage clusters with velocity arrows and corresponding principal curve shown in bold. Principal curve indicates the manually averaged differentiation directionality projected by RNA Velocity and CytoTRACE analysis. (d) Monocle analysis of the Mo-1, PVM, and IM populations indicating pseudotime directionality (left), cell type (middle); PVM (red), Mo-1 (blue), IM (red), and patient source classification as lean or obese (right); lean (red), obese (blue). (e) Bar plots showing the proportion of the indicated myeloid populations derived from 7 lean and 5 obese patients. (f-h) IPA of putative upstream regulators (left) and transcription factors (right) implicated in the Mo-1 to IM transition (f) in the Mo-1 to PVM transition (g), or in the PVM to LAM transition (h).
Ligand-receptor analysis reveals WAT interactomes.
Given the observed changes in immune composition of obese compared to lean human WAT, we next analyzed how WAT cellular communication networks changed during obesity. To do this, we performed ligand-receptor analysis on all lean WAT cells acquired using CellPhoneDB39 to generate a lean WAT homeostatic interactome (Supplementary Table 14). CellPhoneDB ligand-receptor analysis revealed thousands of structural cell-to-immune as well as immune-to-immune interactions (Fig. 6a). Connectome web analysis of putative WAT-resident populations revealed structural cells, dendritic cells, ILC subsets, and PVMs as central communication hubs in the healthy lean WAT (Fig. 6b). Analysis of highly expressed interactions uncovered various uncharacterized and validated signaling pathways implicated in adipose tissue homeostasis and immunoregulation in mice (Fig. 6c). Analysis of the lean interactome suggested that cDC2A may serve an immunoregulatory role via production of GAS6, JAG1, PDGFβ, and AREG, interacting with APC, pAD, endothelial cells, and SMC. These cells could contribute to the maintenance of the WAT via interactions involving NECTIN2 and ICOSLG with Treg populations40,41 and CD200-CD200R with ILCs42. Furthermore, cDC2A uniquely expressed the chemokines CCL17, CCL22, and CCL19, and the cytokine IL-15, which interacted with ILCs, NK cells, and APC, suggesting additional roles for cDC2A in the recruitment and maintenance of innate lymphocytes and progenitor cell types in the lean WAT. pAD expressed IL-15RA, suggesting a synergistic mechanism with cDC2A-derived IL-15 to regulate WAT lymphocyte populations. In contrast, PVMs likely play an important role in WAT homeostasis through interactions with structural cells involving VEGFA, TGFβ, and PDGFC. Amongst ILCs, ILC3 may play similar homeostatic roles to ILC2 via ICOS and TNFRSF25 signaling43,44, and trNK may function in maintaining dendritic cell populations in the lean adipose tissue via CSF2-CSF2R signaling. Together, these results implicate diverse structural and immune cell crosstalk in the maintenance of human WAT homeostasis and suggest that protective anti-inflammatory mechanisms may be active within healthy lean WAT.
Figure 6. CellphoneDB analysis reveals the lean human WAT interactome.
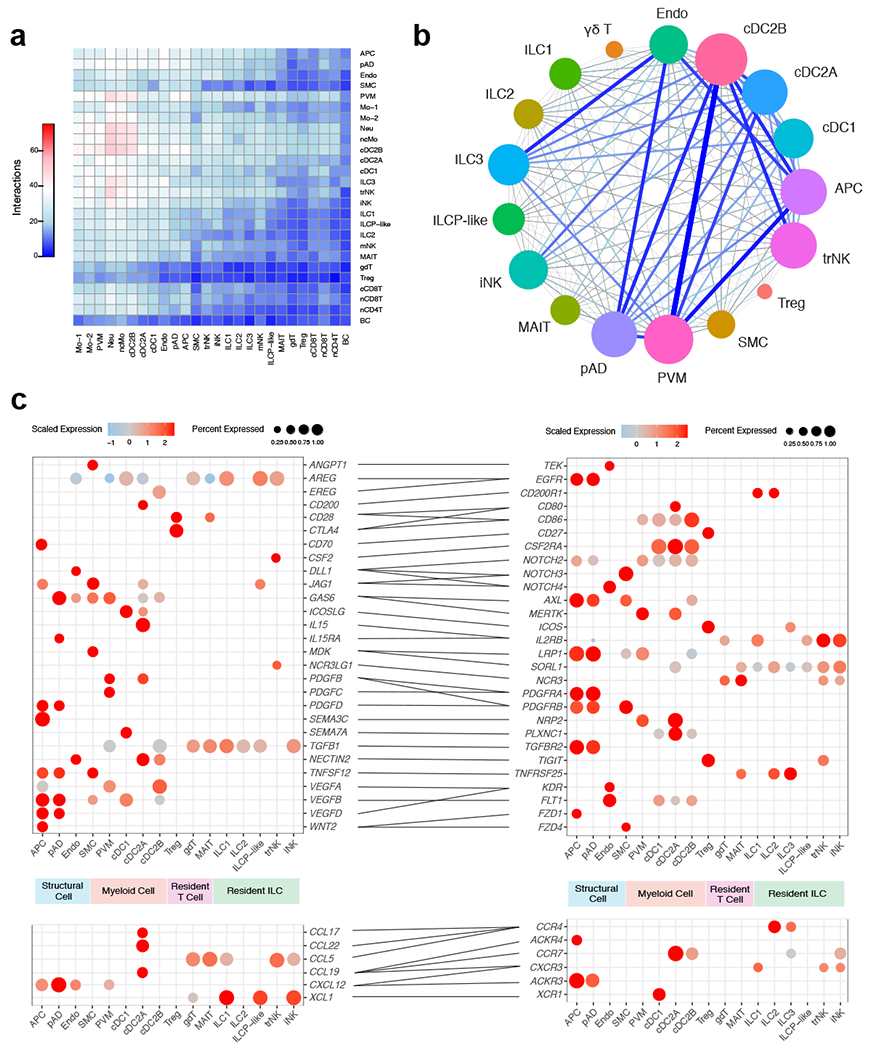
(a) Interaction heatmap plotting the total number of lean WAT-derived cell receptor (y-axis) and ligand (y-axis) interactions for the specified cell types. Color represents the number of interactions between cell types; higher number of interactions (red), lower number of interactions (blue). (b) Connectome web analysis of lean interacting putative tissue-resident cell types, based on expression of the ligand in at least 25% of the cell population. Vertex (colored cell node) size is proportional to the number of interactions to and from that cell, while the thickness of the connecting lines is proportional to the number of interactions between two nodes. (c) Dot plots showing expression of ligands (left) and receptors (right) in human tissue-resident WAT cells; only ligands and receptors from cell types with detected expression (>25%) are shown. Implicated chemokines can be found in the lower panel. Color saturation indicates the strength of expression in positive cells, while dot size reflects the percentage of each cell cluster expressing the gene.
To assess the changes that occur to the cellular communication network during obesity, we similarly performed CellPhoneDB ligand-receptor analysis on all obese WAT cells. Analysis of the cell-cell interactions indicated an increased number of overall ligand-receptor pairings in the obese compared to lean cells, especially ligand-receptor interactions involving recruited circulating myeloid and macrophage subsets (Fig. 7a). Connectome web analysis revealed an enrichment of PVM, IM, cDC2B and LAM communication hubs within the obese WAT (Fig. 7b,c). Analysis of the obese interactome suggested that IM and LAM likely contribute to adipose tissue inflammation during obesity via TNF, IL-1β, IL-18, CXCL8, PDGFβ, and TNFSF13B-mediated regulation of stromal cells, dendritic cells, and circulating myeloid subsets. Interestingly, our analysis suggested that PVM populations in obesity act as major producers of chemokines (CCL3, CCL3L1, CCL4, and CCL2) involved in the recruitment of myeloid cells. Previous studies have demonstrated that CCL2-CCR2 mediated recruitment of monocytes significantly contributes to adipose tissue inflammation and systemic insulin resistance in mouse models of obesity 36, suggesting that PVM may indirectly contribute to inflammation in humans in a similar manner. cDC2B expressed MIF, IL-18, IL-1β, and TNFSF9, interacting with ILCs, NK cells, and myeloid cells, suggesting that dendritic cell populations may exacerbate adipose tissue inflammation and tissue fibrosis in a similar manner to proinflammatory macrophages. trNK significantly paired with WAT dendritic cell populations via LIGHT (TNFSF14-TNFRSF14) interactions45. Because LIGHT signaling has also been shown to enhance adipose tissue macrophage-mediated inflammation46, these results may suggest a role for trNK in human obesity-associated inflammation. Similarly, obese ILC3 appear to be mediators of adipose tissue inflammation via TNFSF13B and MIF, acting upon macrophage, dendritic cell, and monocyte subsets. Together, these data suggest significant shifts within the WAT interactome during obesity, and implicate new cell types in the potentiation of human WAT inflammation during obesity (Extended Data Fig. 9a).
Figure 7. CellphoneDB analysis predicts a dramatic remodeling of the human WAT interactome during obesity.
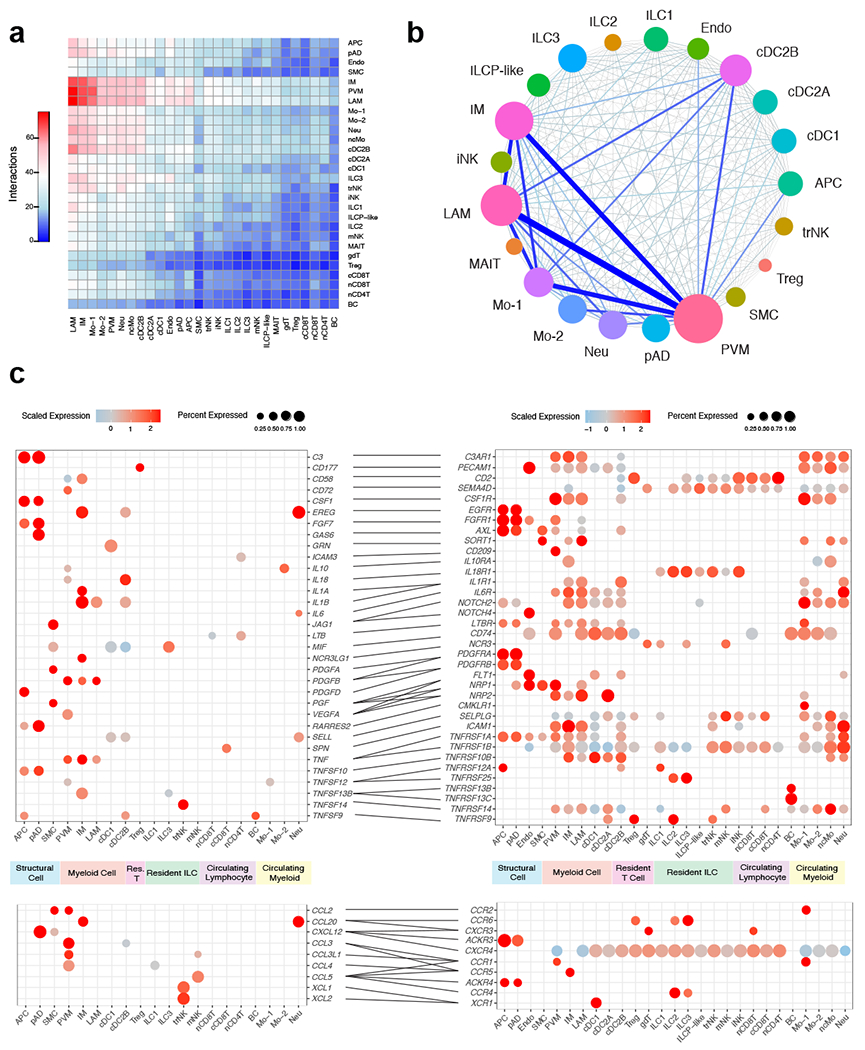
(a) Interaction heatmap plotting the total number of lean WAT-derived cell receptor (y-axis) and ligand (y-axis) interactions for the specified cell types. Color represents the number of interactions between cell types; higher number of interactions (red), lower number of interactions (blue). (b) Connectome web analysis of obese highly interacting cell types, based on expression of the ligand in at least 25% of the cell population. Vertex (colored cell node) size is proportional to the number of interactions to and from that cell, while the thickness of the connecting lines is proportional to the number of interactions between two nodes. (c) Dot plots showing expression of ligands (left) and receptors (right) in human WAT cells; only ligands and receptors from cell types with detected expression (>25%) are shown. Implicated chemokines can be found in the lower panel. Color saturation indicates the strength of expression in positive cells, while dot size reflects the percentage of each cell cluster expressing the gene.
IPA uncovers a distinct obese-enriched WAT signalome.
In order to understand whether predicted interacting cell types influence transcriptional changes during obesity, we performed IPA on the DEGs between all lean and obese WAT cell populations (Supplementary Table 15,16). Our analysis uncovered approximately 110 genes implicated as putative shared upstream regulators in three or more cell types. Analysis of highly expressed upstream regulators suggested that many of the inflammatory signals identified using CellPhoneDB served as transcriptional regulators of gene expression during obesity (Fig. 8a). A number of common upstream regulators identified by our analysis (TNF, IL-1β, IL-18, IL-6, IGF1, IFN-γ, CXCL8, and OSM) were also found to be associated with human systemic insulin resistance previously, (Fig. 8a, Supplementary Data Table 17). Furthermore, our analysis suggested that many previously uncharacterized WAT-resident immune cells including IM, cDC2A, cDC2B, ILC3, and trNK highly expressed the upstream ligands of many of these key pathways in obesity. Our analysis also found several secreted upstream regulators which have not yet been associated with human insulin resistance but have been suggested to play a role in the development of metabolic dysfunction in mice (CSF2, LIF, BMP4, EDN1, CXCL12, and TNFSF13B) (Supplementary Data Table 17). Analysis of non-secreted upstream regulators suggested that several transcription factors (HIF1-α, CREB, MYC, CEBPB, FOXO1, and STAT4) implicated in obesity-associated inflammation and metabolic dysfunction in mice (Supplementary Data Table 17), may also be important in regulating adipose tissue inflammation in human cells (Fig. 8b). Together, gene set enrichment analysis of the common upstream regulators suggested a number of significant pathways that were transcriptionally regulated in obese WAT cells (Fig. 8c, Supplementary Table 18). Implicated signaling mechanisms involved several JAK-STAT signaling pathways including IL-1, IL-6, IL-12, IL-17, IFN-γ signaling, TNF signaling, and hypoxia. Furthermore, many of these pathways were induced in novel human WAT cell types, as shown by gene set enrichement analysis of obese trNK, ILC3, cDC2B, and IM (Extended Data Fig. 9b–e). Combined, these data suggest that a complex mixture of inflammatory pathways produced by macrophages, dendritic cells, ILCs, NK cells, and structural cells regulate inflammatory signaling pathways in the human WAT during obesity (Extended Data Fig. 10).
Figure 8. Analysis of putative upstream regulators uncovers a distinct obese human WAT-enriched signalome.
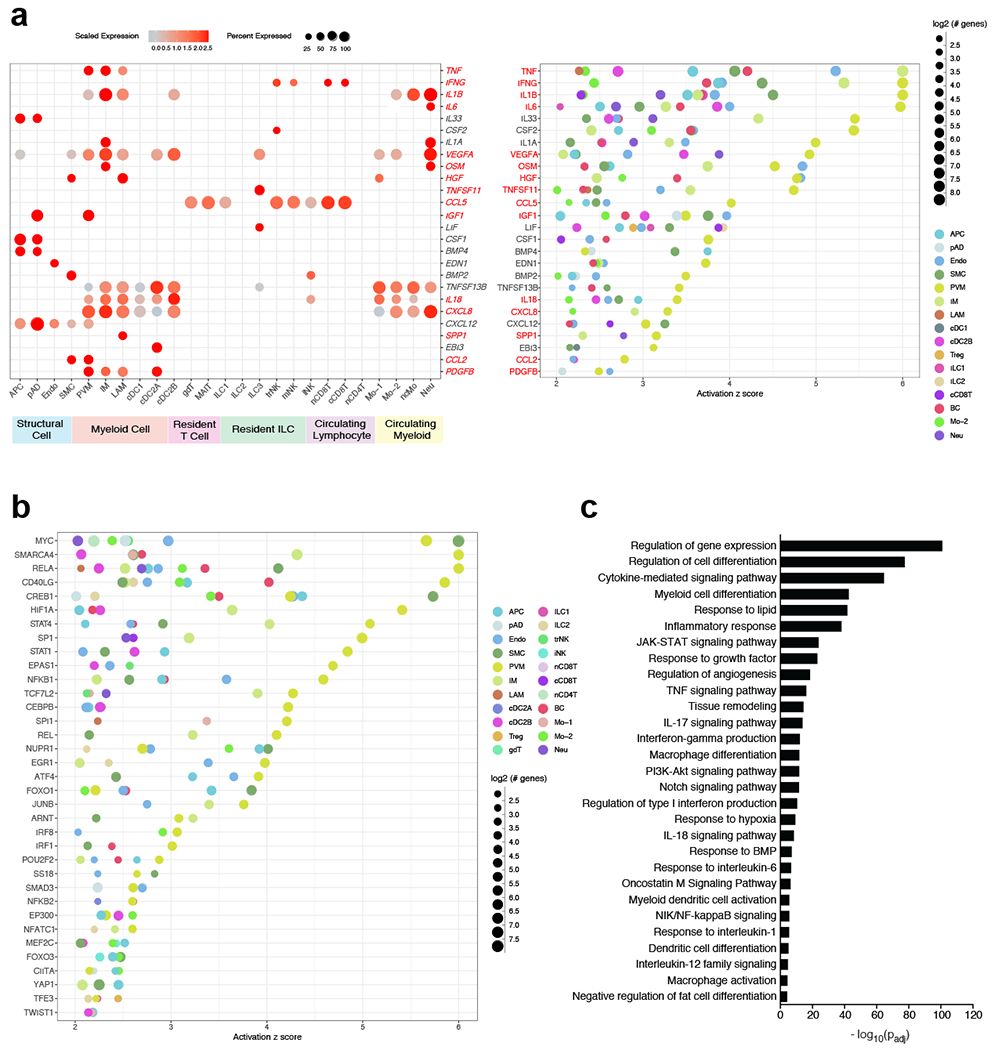
(a,b) IPA of obese immune and non-immune populations showing common putative upstream regulators. Terms were considered common if implicated in three or more cell types from a lineage. Terms were considered statistically significant if the activation z-score > 2. (a) Dot plots showing expression of common secreted upstream regulators from obese cells (left) and the putative regulated cell types (right) as suggested by IPA; left: color saturation indicates the strength of expression in positive cells, while dot size reflects the percentage of each cell cluster expressing the gene; right: color indicates the implicated cell type, while dot size reflects the number of genes downstream of the suggested secreted upstream regulator. Only ligands from cell types with detected expression (>25%) are shown. Red-highlighted upstream regulators denote those that have been associated with human insulin resistance (see Supplementary Data Table 17). (b) Dot plot showing common non-secreted signaling upstream regulators. Color indicates the implicated cell type, while dot size reflects the number of genes downstream of the suggested signaling upstream regulator (c) GOSt analysis of differentially regulated signaling pathways in obesity. Terms were considered statistically significantly enriched if −log10(Padj)<0.05.
Discussion
We performed scRNA-seq on a total of 110,250 cells from multiple sorted atlases including CD45− cells, CD45+ cells, macrophages, dendritic cells, NK cells, and ILCs. This led to the validation of 13 out of 13 previously identified populations as well as the identification an additional 15 distinct cell clusters including previously uncharacterized populations of WAT ILCs, dendritic cells, NK cells, and proinflammatory macrophages. Using flow cytometry, we then validated the presence of each of these populations within the human lean and obese WAT using an independent cohort of patients. Finally, we utilized single cell ligand-receptor analysis to profile both the lean and obese human WAT interactomes in addition to a cell type-specific obesity-enriched signalome.
Our study identifies a number of unique ILC populations (iNK, trNK, ILC1, ILC3, ILCP-like) that have not been described in human WAT previously. We find that the healthy human WAT contains a distinct population of trNK that can be differentiated from both WAT mNK and iNK populations and shares a similar phenotype with trNK cells described in human liver transplant studies20. Our data suggests that trNK as well as ILC1 express IFN-γ, which is implicated in the regulation of obesity-associated transcriptional changes of many cell types, notably as a critical regulator of IM differentiation. Accordingly, previous studies in DIO mice have suggested that WAT-resident ILC1 and NK populations produce IFN-γ early during high fat diet administration24, and that IFN-γ is important for the regulation of adipose tissue inflammation47. As such, trNK and ILC1 cells may play a similar role in the potentiation of human WAT inflammation during obesity, although future studies will be needed to support this conclusion. Our data also suggests that trNK are involved in the recruitment of cDC1 via XCL1/2-XCR1 signaling during obesity, similar to mechanisms recently observed within the tumor microenvironment48. The full extent of ILC-dendritic cell communication in the WAT, and the implications of these interactions merits attention by future mechanistic studies in mice.
We also identify a subset of human WAT ICL3 which accumulate during obesity. In the lean state, our data suggests that ILC3 may play a homeostatic role, similar to ILC2. However, in the obese state, our data suggests that ILC3 are mediators of adipose tissue inflammation via expression of LIF, TNFSF13B, and MIF. Furthermore, although we were unable to determine the source of IL-17 signaling as suggested by gene set enrichment analysis, our data suggests that adipose ILC3 may contribute to the proinflammatory effects of this cytokine during obesity. As such, our data suggests that resident ILC3s likely play important roles in human WAT biology that were not recognized previously. However, ILC3s are not present in lean or obese mouse WAT24, highlighting key differences between mouse and human WAT ILC composition and suggesting that certain aspects of ILC-mediated inflammation during obesity may not be evolutionarily conserved in mammals.
Our scRNA-seq dataset also identified three unique subpopulations of WAT DCs that accumulate in obese patients. While the specific roles of cDC1, cDC2A, and cDC2B subsets in mammalian obesity are unknown, studies in mice have implicated WNT signaling and dendritic cells in driving tolerogenic programs in lean WAT49. Whether this process becomes dysregulated during obesity is unclear. Analysis of the lean interactome suggests that cDC2A serve an immunoregulatory role, similar to dendritic cell populations found in tumors50. During obesity, however, our data suggests that cDC2B may contribute to tissue inflammation via expression of MIF, IL-18, IL-1β, and TNFSF9. As such, future studies are necessary to elucidate the roles of these different dendritic cells within the adipose tissue. Similarly, previous studies in DIO mice have suggested both protective and proinflammatory roles of CD9+ LAMs through TREM2 function or cytokine production respectively8,33. Our results suggest that human WAT LAMs, alongside IMs, actively produce IL-1β and TNF in obese patients. Both populations likely additionally contribute to adipose tissue inflammation via expression of IL-18, CXCL8, and PDGFβ. Furthermore, while analysis of endogenous cytokine production suggests that PVMs are not actively producing IL-1β or TNF in obese patients, ligand-receptor analysis suggests that these macrophages may contribute to adipose tissue inflammation via increased chemokine production and recruitment of monocytes into the WAT. These data suggest that there are likely more complex mechanisms underlying the contribution of WAT dendritic cells and macrophages to adipose tissue inflammation and insulin resistance than previously understood.
In summary, our study provides a comprehensive atlas of immune and structural cell populations within the healthy human WAT, offering insight into cell type specific transcriptional changes and communication networks that underpin obesity-associated WAT inflammation. Our dataset not only increases our understanding of the interactions that occur between cell types in human WAT, but also identifies potential therapeutic targets that may aid in reducing systemic low-grade inflammation in obese patients.
Methods
Human Samples
Human deep subcutaneous white adipose tissue samples were obtained from donors undergoing cosmetic abdominoplasty procedures via Barret Plastic Surgery, Los Angeles. Donor characteristics are summarized in Supplemental Tables 1,3, and 4. Human samples were defined healthy status based on no prior history of cardiovascular disease, liver disease, diabetes or immunological disorders and divided into three categories based on body mass index (BMI): lean: BMI < 25; overweight: 25 < BMI < 30; obese: BMI > 30. The human samples used in this study do not qualify as “human subjects” research, confirmed by the UCLA IRB. As such, obtaining informed consent was not necessary. Human samples were de-identified and were not obtained for the specific purpose of these studies.
Adipose Tissue Harvest and Cell Dissociation
Patient deep subcutaneous adipose tissue was freshly harvested from abdominoplasty samples within an hour of their respective operations. Adipose tissue samples were kept on ice until processing. Adipose tissues were first washed 3 times with 1x PBS before physical homogenization in Adipose Harvest Media ((AHM) 1x HBSS + CaCl + MgCl, 5% Heat-inactivated fetal bovine serum (FBS), 1% L-glutamine, 1% Penicillin-Streptomycin, 50 μ g/mL DNAse1) using a blender (900 Watts, Ninja BL450 Series). Homogenized tissue was then distributed into 14mL round bottom tubes and supplemented with Collagenase Type II digestion media (AHM + 2mg/mL Collagenase Type II (Worthington Biochem)) before shaking incubation at 37°C for one hour. Post incubation, digested samples were filtered using 100μm cell strainers (Corning) and then centrifuged to isolate the stromal vascular fraction (SVF) pellets. After aspiration of the supernatants, the pellets were lysed using ACK lysis buffer, pooled into one tube, and then filtered again through 100μm nitex mesh. The combined SVF pellet was then split and either resuspended in a mixture of 9:1 FBS to DMSO solution and frozen at −80°C or stained using fluorescently labeled antibodies and then analyzed via flow cytometry.
Fluorescence-Activated Cell Sorting
Selected samples for single cell RNA-sequencing analysis were thawed and then pooled based on BMI to ensure high cell count recovery for each subpopulation and BMI classification (Lean: n=10, Obese: n=8). Samples were then sorted on the BD FACSAriaIII before submission for 10x Library preparation. Cells were sorted from lean and obese WAT samples as follows: non-immune cells (CD45−), immune cells (CD45+, Macrophages (CD45+Lin−(CD3+TCRαβ+CD19+CD34+CD5+CD7+)CD11b+CD14+), conventional dendritic cells (CD45+Lin−(CD3+TCRαβ+CD19+CD34+CD7+)CD11b−CD14intHLA-DR+CD11c+), NK cells (CD45+Lin−(CD3+TCRαβ+CD19+CD34+CD14+CD5+TCRγδ+)CD7+CD200R1−), and ILCs (CD45+Lin−(CD3+TCRαβ+CD19+CD34+CD14+CD5+TCRγδ+)CD7+CD200R1+).
10x Library Preparation, Sequencing, and Alignment
Single cell RNA-sequencing libraries were generated with the Chromium Single Cell 3′ v3 assay (10X Genomics). Libraries were sequenced using the NovaSeq 6000 S2 platform (Illumina) to a depth of approximately 300 million reads per library with 2x50 read length. Raw reads were aligned to human genome (hg38) and cells were called using cellranger count (v3.0.2). Individual samples were aggregated to generate the merged digital expression matrix using cellranger aggr (v3.0.2).
Cell clustering and cell type annotation
The R package Seurat51 (v3.1.2) was used to cluster the cells in the merged matrix. Cells with less than 500 transcripts detected or more than 25% mitochondrial gene expression were first filtered out as low-quality cells. The gene counts for each cell were divided by the total gene counts for the cell and multiplied by a scale factor 10,000, then natural-log transformation was applied to the counts. The FindVariableFeatures function was used to select variable genes with default parameters. The ScaleData function was used to scale and center the counts in the dataset. Principal component analysis (PCA) was performed on the variable genes, and 20 principal components were used for cell clustering (resolution = 0.5) and Uniform Manifold Approximation and Projection (UMAP) dimensional reduction. The cluster markers were found using the FindAllMarkers function, and cell types were manually annotated based on the cluster markers10–14,31,52–54. Module scores were calculated using the AddModuleScore function with default parameters and used to validate certain cell type annotations10–12,31,55. To calculate the sample composition based on cell type, the number of cells for each cell type from each sample were counted. The counts were then divided by the total number of cells for each sample and scaled to 100 percent for each cell type.
Cell type sub-clustering
Sub-clustering was performed on all cell types. The same functions described above were used to obtain the sub-clusters. Sub-clusters that were defined exclusively by mitochondrial gene expression, indicating low quality, were removed from further analysis. To calculate the composition of lean and obese cells for the sub-clusters, the number of lean and obese cells for each sub-cluster were counted. The number of lean (or obese) cells in each cluster was then divided by the total number of lean (or obese) cells to calculate the percentages of each cell state. Subclusters were filtered based on >10% frequency for each cell lineage and assigned as a lean or obese-enriched state if the subcluster contained >5% representation of lean compared to obese cells and vice versa. Cell states with equal representation of lean and obese cells were excluded from lean and obese-specific cell state analysis. For each cell type, differential expression analysis was carried out on the lean cells from the lean state and obese cells from the obese state. Then ingenuity pathway analysis (IPA) was applied to the DEGs to determine the potential upstream regulators driving the differential expression. The upstream regulators that were activated in obese (activation z score >= 2) in at least three cell types were plotted. The normalized expression matrix for ILC and myeloid subtypes were extracted and uploaded to the CytoTRACE webtool (https://cytotrace.stanford.edu/), and the output CytoTRACE score for each cell was then plotted on the UMAP.
Pseudo-time trajectory construction
Pseudo-time trajectories for ILCs and myeloid cells were constructed using the R package Monocle53 (v2.10.1). The raw counts for cells in the intended cell types were extracted and normalized by the estimateSizeFactors and estimateDispersions functions with the default parameters. Genes with average expression larger than 0.5 and detected in more than 10 cells were retained for further analysis. Variable genes were determined by the differentialGeneTest function with a model against the cell type identities. The top 2,000 variable genes with the lowest adjusted p value were used to order the cells. The orders were determined by the orderCells function, and the trajectory was constructed by the reduceDimension function with default parameters. Differential expression between pseudo-time states was carried out using the Seurat function FindMarkers. The DEGs with the lowest adjusted p value were used to plot the heatmap showing the bifurcation expression patterns. The heatmap was generated using function plot_genes_branched_heatmap. Ingenuity Pathway Analysis was used to determine the upstream regulators for the DEGs.
RNA velocity analysis
To estimate the RNA velocities of single cells, velocyto29 was used to distinguish unspliced and spliced mRNAs in each sample. The python package scVelo58 was then used to recover the directed dynamic information by leveraging RNA splicing information. Specifically, the data was first normalized using the filter_and_normalize function. The first- and second-order moments were computed for velocity estimation using the moments function. The velocity vectors were obtained using the velocity function. The velocities were projected into a lower-dimensional embedding using the velocity_graph function. Finally, the velocities were visualized in the UMAP embedding using the velocity_embedding_stream function. All scVelo functions were used with default parameters.
Cell-cell ligand receptor interaction analysis
CellphoneDB (v2.0.0) was applied for ligand receptor analysis. The raw counts and cell type annotation for each cell were imputed into cellphoneDB to determine the potential ligand receptor pairs. Pairs with p value >0.05 were filtered out from further analysis. Four runs were performed on four groups of cells: all lean cells, lean cells in lean-enriched states, all obese cells, and obese cells in obese-enriched states. The results on all lean cells were plotted as the base level interaction among the cell types. The number of interactions between each pair of cell types were plotted using the results with all lean cells and all obese cells. To determine the differential interactions between lean and obese specific states, differentially expressed genes (DEGs) were determined between the lean and obese cells for each cell type and an adjusted p value at 0.05 was applied to filter the DEGs. A ligand-receptor pair with higher average expression in lean (or obese) and the ligand being significantly highly expressed in lean (or obese) was considered a lean (or obese) specific pair. Selected obese specific pairs were plotted.
g:GOSt Analysis
Cluster markers from obese-enriched states were input into the functional enrichment analysis query and then analyzed using g:GOSt functional profiling55.
Flow Cytometry
Cells were analyzed for cell-surface markers using fluorophore-conjugated antibodies (BioLegend, eBioscience, R&D Systems, Miltenyi Biotec). Cell surface staining was performed in 1X PBS and intracellular staining was performed using the eBioscience Foxp3/Transcription Factor or BD Cytofix/Cytoperm kits. Flow cytometry was performed using the Attune NxT Acoustic Focusing cytometer and data were analyzed using the Attune NxT Software v3.1.2, with quantification performed using FlowJo v9.9.6 (BD). Cell surface and intracellular staining was performed using the following fluorophore-conjugated antibodies: CD3 (UCHT1), TCRαβ (IP26), CD26 (2A6), CD56 (TULY56), CD1c (L161), CD19 (SJ25-C1), CD34 (581), CD14 (TuK4), CD7 (124-1D1), CD45 (HI30), T-bet (4B10), CD5 (UCHT2), TCRγδ (B1), Perforin (B-D48), CD200R1 (OX-108), EOMES (WD1928), CD11c (BU15), HLA-DR (L243), CD206 (15-2), IL-13 (JES10-5A2), CD9 (HI9a), IFN-γ (B27), CD88 (S5/1), IL1-R1 (FAB269A), CD16 (CB16), FCER1A (AER-37 (CRA-1)), CD294 (BM16), CD62L (DREG-56), CD89 (A59), CD301 (H037G3), CD196 (G034E3), IL-17A (BL168), TNF-α (Mab11), IL-1β (CRM56), CD336 (2.29), CD11b (M1/70), TCR Vα7.2 (3C10), CD8α (RPA-T8), CD161 (HP-3G10), FOXP3 (206D), CD15 (HI98), CD4 (RPA-T4), CD68 (Y1/82A), CD64 (10.1), TCR Vα24-Jα18 (6B11), RORC (AFKJS-9), CD31 (WM59), CD29 (TS2/16), ICAM-1 (HA58). All antibodies used in this study were validated with human PBMCs prior to use on human WAT SVF samples.
Human Macrophage Endogenous Cytokine Production
Human adipose SVF cells were cultured for 5 hours in CR-10 media containing, Brefeldin A (1:1000; BioLegend) and Monensin (2uM; BioLegend) and then analyzed for intracellular cytokine production via flow cytometry. Cells were cultured in media alone as a negative control.
Ex vivo stimulation of human ILCs
Human adipose SVF cells were cultured for 5 hours in CR-10 media containing, Brefeldin A (1:1000; BioLegend) and Monensin (2uM; BioLegend) with or without PMA (Sigma) and Ionomycin (Sigma). For quantification of IL-17A staining, SVF cells were cultured overnight in CR-10 and then subsequently stimulated in the presence of PMA, Ionomycin, Brefeldin A and Monensin for 5 hours.
Quantification, Statistical Analysis, and Reproducibility
For graphs, data are shown as mean ± SEM, and unless otherwise indicated, statistical differences were evaluated using a Student’s t test with Welch’s correction to a assume a non-normal variance in our data distribution. For cell type density analysis, linear regression was performed alongside two-tailed Pearson Correlation analysis with 95% confidence intervals. p < 0.05 was considered significant. scRNAseq of sorted CD45+ and CD45− cells was performed initially. This was followed by scRNAseq of sorted Macrophage, DC, ILC, and NK cell populations. Flow cytometric analysis of each patient was performed independently. Graphs were produced and statistical analyses were performed using GraphPad Prism.
Extended Data
Extended Data Fig. 1. Lineage-associated gene signatures of CD45+ and CD45− SVF cells from healthy human WAT.
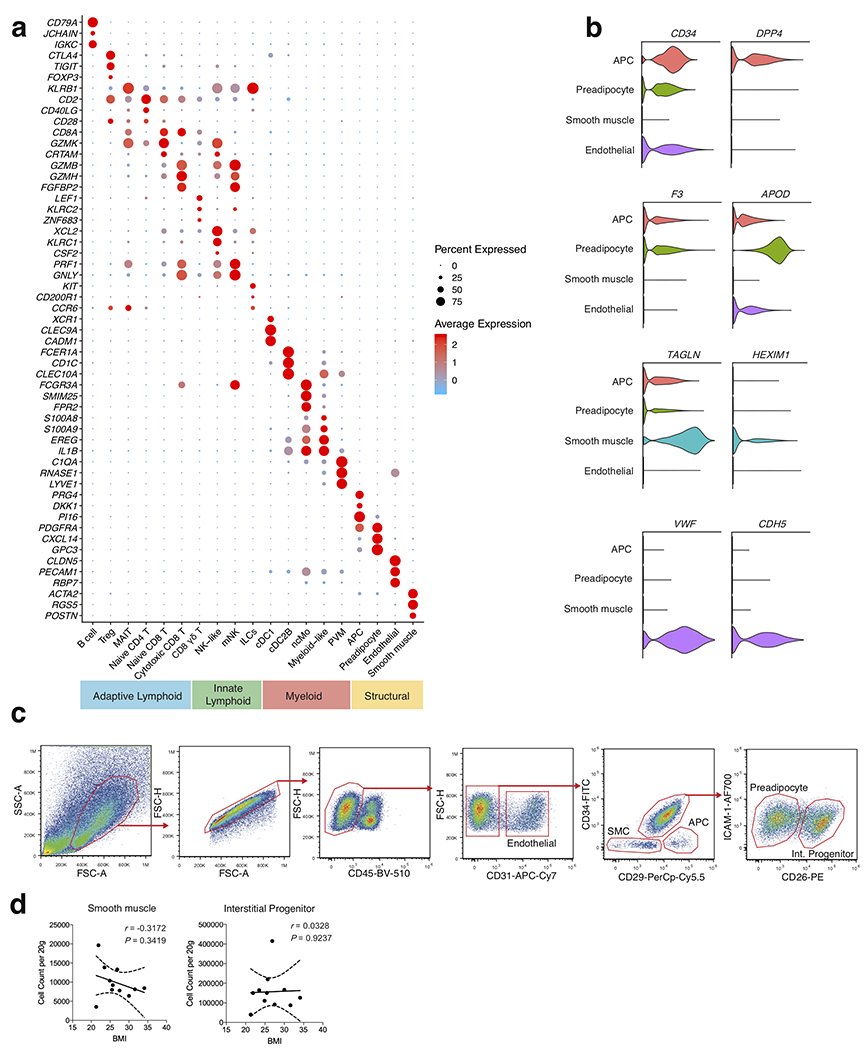
(a) Dot plot showing selected top differentially expressed marker genes for each cluster, supporting assignment of clusters to compartments shown in Figure 1b. Color saturation indicates the strength of expression in positive cells, while dot size reflects the percentage of each cell cluster expressing the gene. (b) Violin plots showing expression levels of additional cluster markers for the indicated structural cell populations. (c) Representative gating strategy for scRNAseq-defined human WAT non-immune cell populations (CD45−): Endothelial cell: CD31+, Smooth muscle cell (SMC): CD31−CD34−CD29−, Adipocyte precursor cell (APC): CD31−CD34−CD29+, Preadipocyte: CD31−CD34+CD29intICAM-1+CD26−, Interstitial progenitor cell: CD31−CD34+CD29intICAM-1+CD26+. (d) Density correlation analysis of the indicated non-immune subsets with patient BMI. Line of best fit and 95% confidence intervals are shown for each plot. Each point represents an individual patient. Linear regression and two-tailed Pearson Correlation analysis with 95% confidence intervals were conducted. p < 0.05 was considered significant.
Extended Data Fig. 2. Single cell analysis reveals heterogeneous adaptive lymphocyte populations in healthy human WAT.
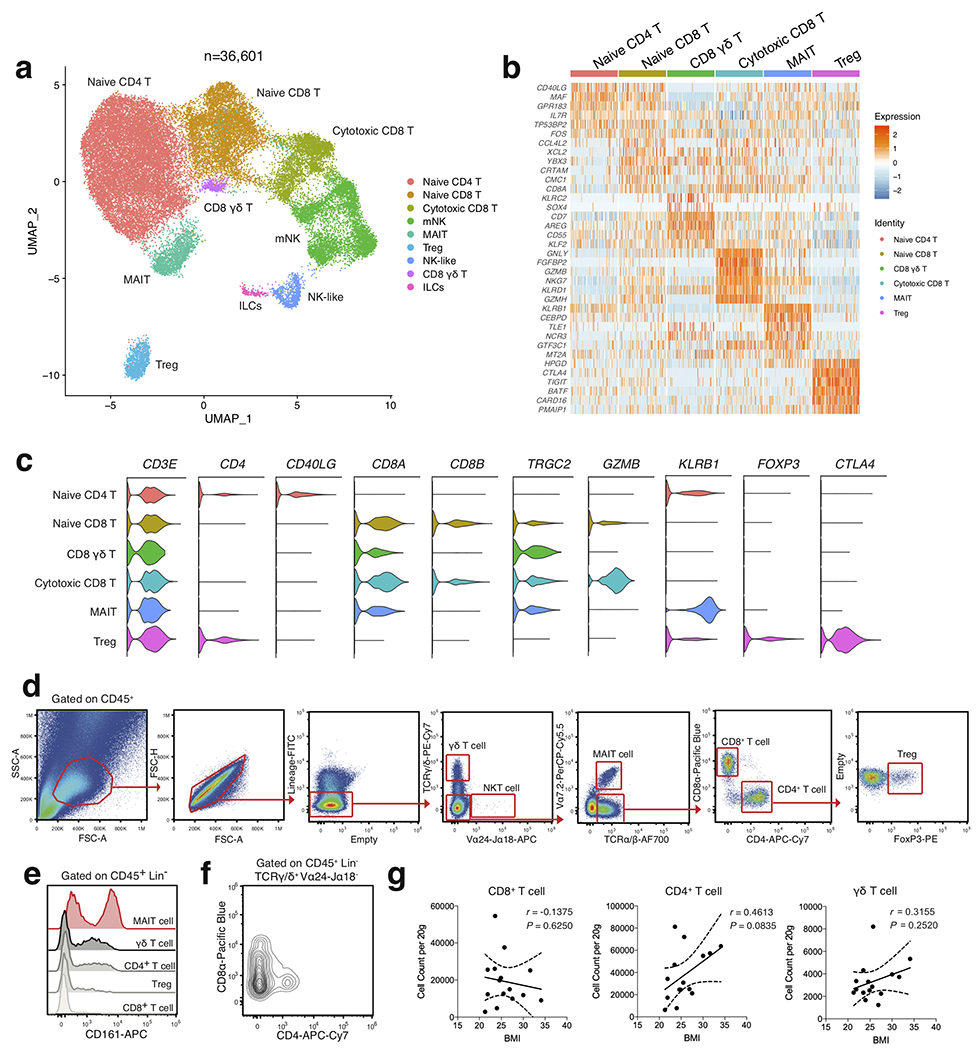
(a) UMAP plot of 36,601 subclustered human adipose effector lymphocytes from Figure 1. Cluster analysis yields 9 distinct clusters comprising of T cell subsets, ILCs and NK cells. (b) Unbiased heatmap of gene expression of the top 6 unique cluster marker genes for each T cell cluster. Cluster identities are shown above the heatmap. Color saturation indicates the strength of expression. (c) Violin plots showing RNA expression of additional cluster markers for the indicated T cell populations. (d) Representative gating strategy for scRNAseq-defined human WAT T cell populations (CD45+Lin−(CD34+CD19+CD14+): γδT cell (γδ T): TCRγδ+Vα24-Jα18−Vα7.2−, NKT cell (NKT): TCRγδ−Vα24-Jα18+Vα7.2−, MAIT cell (MAIT): TCRγδ−Vα24-Jα18−Vα7.2+TCRαβ+, CD8+ T cell (CD8 T): TCRγδ−Vα24-Jα18−Vα7.2−TCRαβ+CD8α+CD4−, CD4+ T cell (CD4 T): TCRγδ−Vα24-Jα18−Vα7.2−TCRαβ+CD8α−CD4+, Regulatory T cell (Treg): TCRγδ−Vα24-Jα18−Vα7.2−TCRαβ+CD8α−CD4+FoxP3+. (e) Representative histogram of KLRB1 (CD161) expression on human WAT T cell subsets. (f) Representative flow cytometry plot of CD8α and CD4 expression on human WAT γδ T cells. (e,f). Data is representative of 4 individual patient samples. (g) Density correlation analysis of the indicated T cell subsets with patient BMI. Line of best fit and 95% confidence intervals are shown for each plot. Each point represents an individual patient. Linear regression and two-tailed Pearson Correlation analysis with 95% confidence intervals were conducted. p < 0.05 was considered significant.
Extended Data Fig. 3. Single cell analysis identifies unique human WAT-resident ILCs.
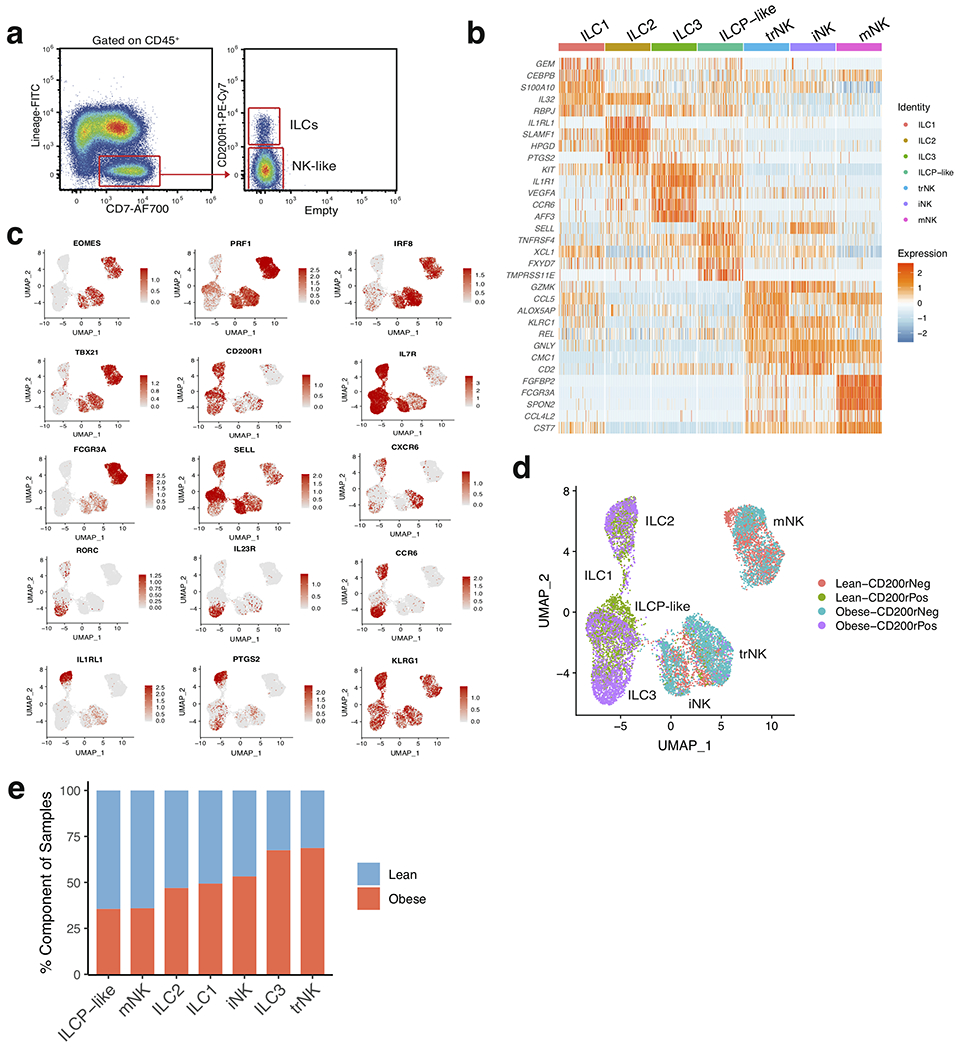
(a) Representative sorting strategy for Lin−CD7+ cell populations based on expression of CD200R1; used in Figure 2. (b) Unsupervised heatmap of the top 5 differentially expressed cluster marker genes for each indicated innate lymphoid cell cluster. Cluster identities are shown above the heatmap. Color saturation indicates the strength of expression. (c) Selected UMAP feature plots showing RNA expression of additional cluster markers, based on the UMAP shown in Figure 2a. (d) UMAP of sorted innate lymphoid cell populations denoted by the source of the sorted sample (CD200R1+ vs CD200R1−) and patient source classification as lean (red, green) or obese (blue, purple); based on the UMAP shown in Figure 2a. (e) Bar plots showing the proportion of innate lymphoid cells derived from 7 lean (blue) and 5 obese (red) patients.
Extended Data Fig. 4. Flow cytometry analysis of scRNAseq-identified human WAT ILCs.
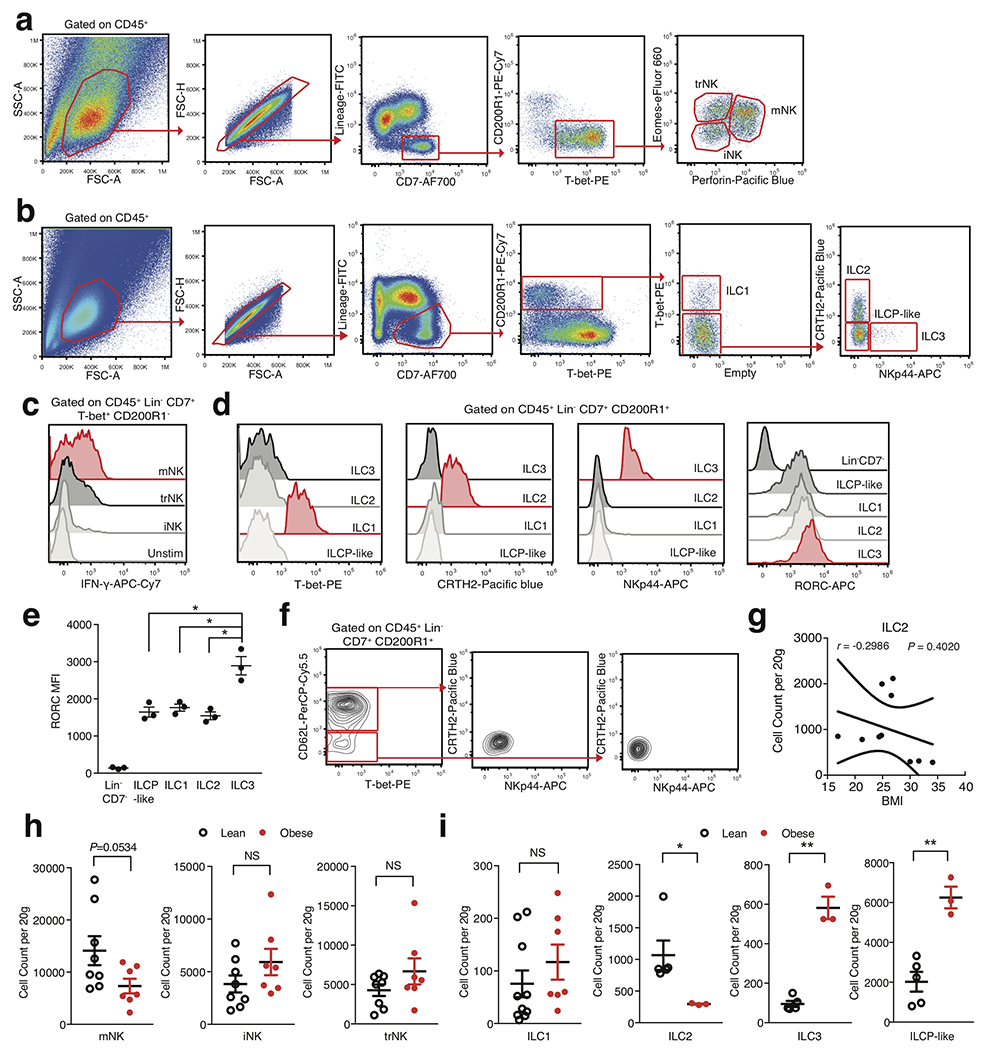
(a,b) Representative gating strategies for the scRNAseq-defined human WAT (a) NK cell and (b) ILC populations identified in Figure 2. Human WAT ILC populations are defined as CD45+Lin−(CD3+TCRαβ+CD19+CD34+CD14+CD5+TCRγδ+EOMES+)CD7+CD200R1+); ILC1: TBET+, ILC2: TBET−CRTH2+NKp44−, ILC3: TBET−CRTH2−NKp44+, ILCP-like: TBET−CRTH2−NKp44−CD62L+/−. (c) Representative histogram of IFN-γ by human WAT NK cell subsets. Unstim refers to CD200R1− cells cultured without PMA and Ionomycin. (d) Representative histograms of T-bet, CRTH2, NKp44, and RORC expression on human WAT ILC subsets. (e) Analysis of RORC MFI values from human WAT ILC subsets. Each point represents an individual patient (n=3). ILCP-like: p=0.0198, ILC1: p=0.0313, ILC2: p=0.0194. (f) Representative flow cytometry plots of CD7+CD200R1+ cells isolated from human PBMC. (g) Density correlation analysis of ILC2 with patient BMI. Each point represents an individual patient. Line of best fit and 95% confidence intervals are shown for the plot. (h,i) Density of indicated ILCs by BMI classification. Each point represents an individual patient; (h) n=8 lean and n=7 obese patients. (i) ILC1: n=10 lean and n=7 obese patients; ILC2, ILC3, ILCP-like: n=5 lean and n=3 obese patients. ILC2: p=0.0293, ILC3: p=0.0094, ILCP-like: p=0.022. (c,d,f) Data is representative of 3 individual patient samples. Samples were compared using two-tailed Student’s t test with Welch’s correction, assuming unequal SD, and data are presented as individual points with the mean ± SEM (*p<0.05, **p<0.01). Linear regression and two-tailed Pearson Correlation analysis with 95% confidence intervals were conducted. p < 0.05 was considered significant.
Extended Data Fig. 5. Analysis of ILC1 and ILC3 fate DEGs suggests a clear developmental bifurcation.
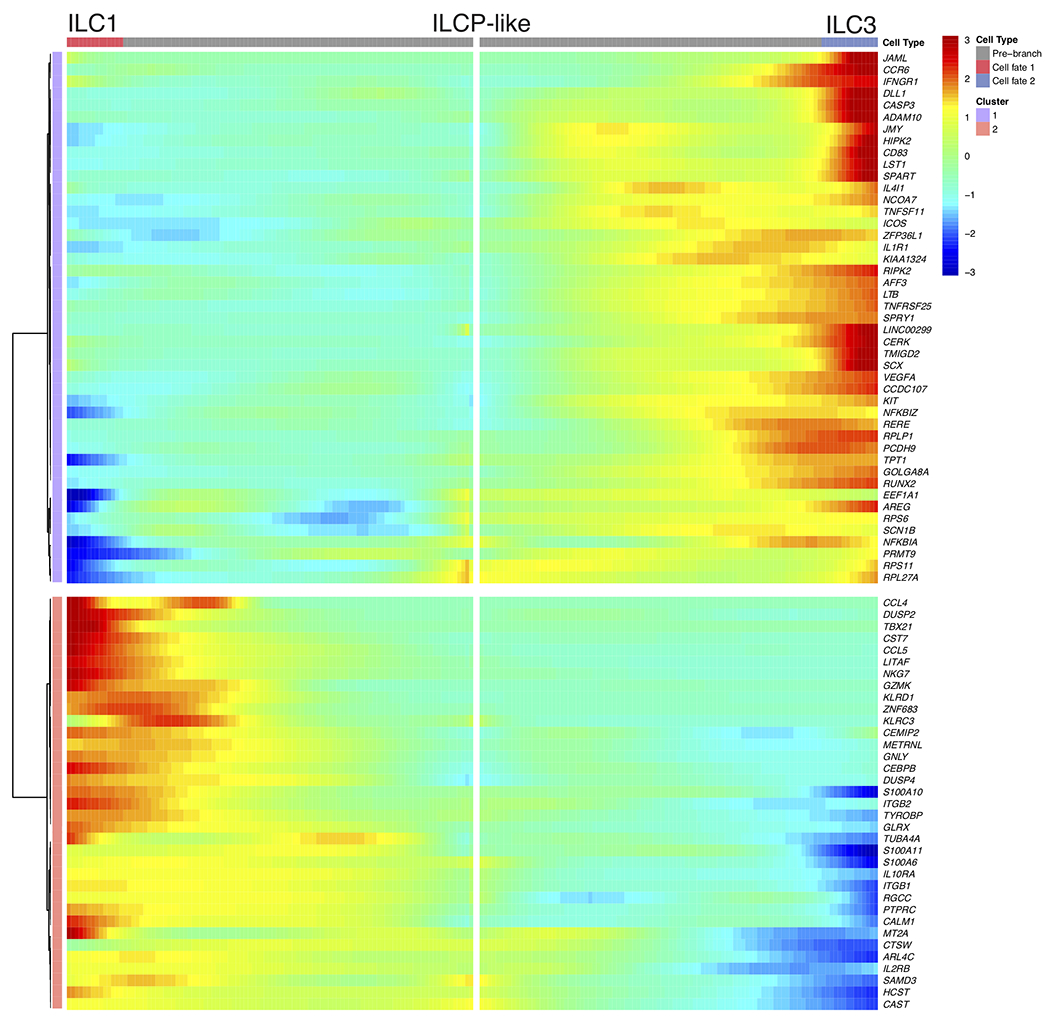
Bifurcation heatmap of enriched genes for ILC1 (left), ILCP-like (middle) and ILC3 (right). Color indicates increased (red) or decreased (blue) expression.
Extended Data Fig. 6. Single cell analysis identifies unique myeloid populations within healthy human WAT.
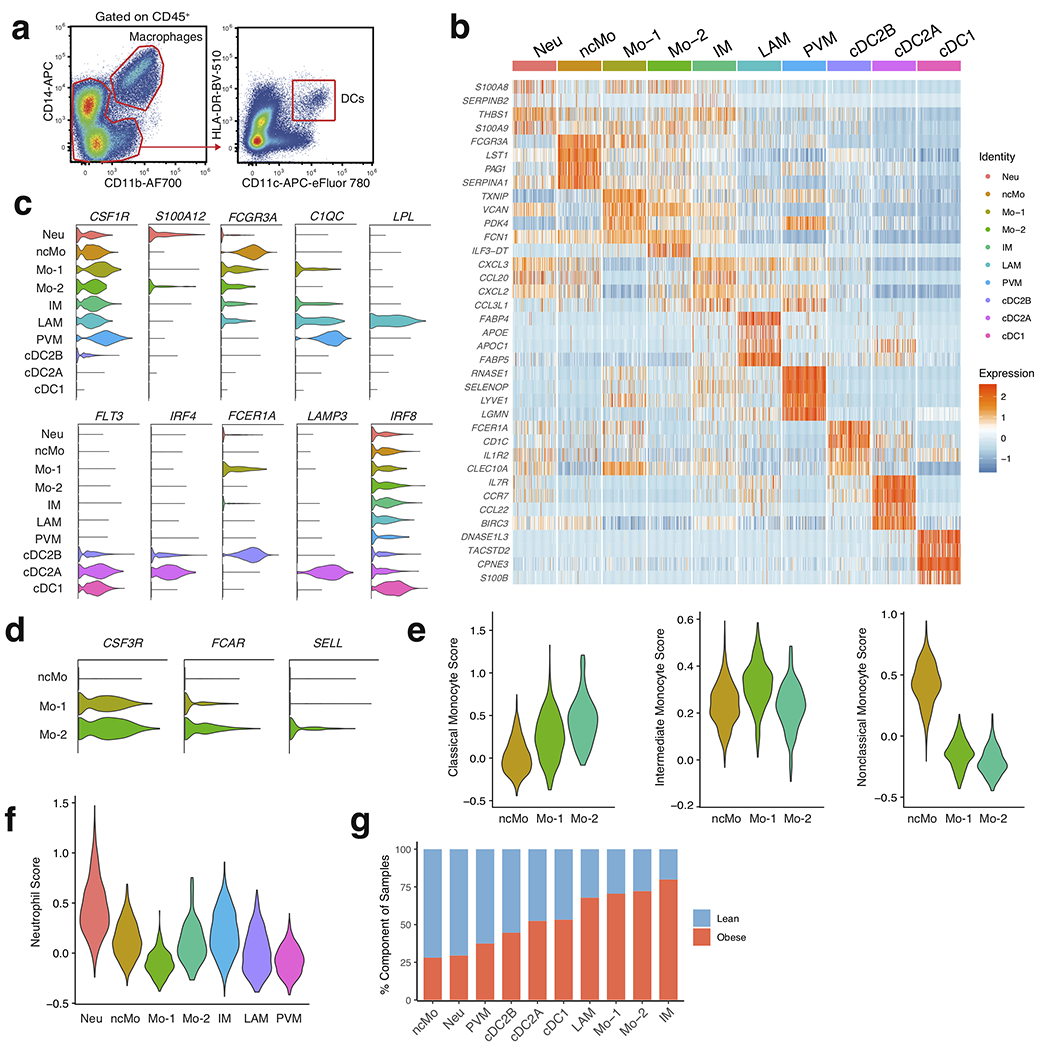
(a) Representative sorting strategies for CD11b+CD14+ macrophage and HLA-DR+CD11c+ dendritic cell populations indicated in Figure 4. (b) Heatmap shows the top 4 differentially expressed cluster marker genes for each indicated myeloid cell cluster. Cluster identities are shown above the heatmap. Color saturation indicates the strength of expression. (c,d) Violin plots showing RNA expression levels of cluster markers for (c) myeloid (d) and monocyte populations. (e) Classical, Intermediate, and Nonclassical Monocyte gene module score analysis for the indicated monocyte populations based on comparison of signature genes for each cell type from previously defined datasets to DEGs within each cluster. (f) Neutrophil gene module score analysis for the indicated myeloid populations based on comparison of signature genes for each cell type from previously defined datasets to DEGs within each cluster. (g) Bar plots showing the proportion of myeloid cells derived from 7 lean (blue) and 5 obese (red) patients.
Extended Data Fig. 7. Flow cytometry analysis of scRNAseq-identified human WAT macrophage and dendritic cell populations.
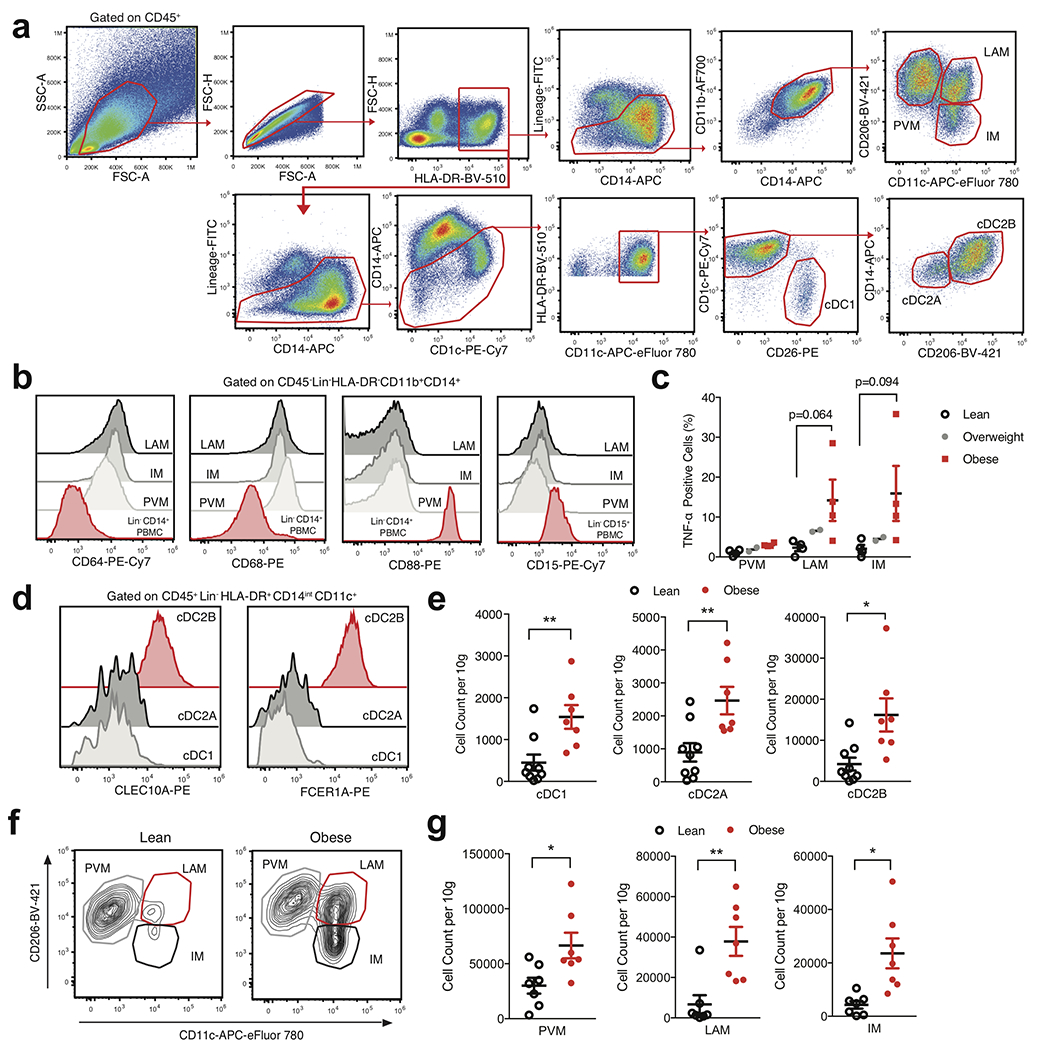
(a) Representative gating strategy for scRNAseq-defined human WAT macrophage and DC populations identified in Figure 4. (b) Representative histograms of CD64, CD68, CD88, and CD15 expression on human WAT macrophage cell subsets, CD14+ monocytes and CD15+ neutrophils isolated from human PBMC. (c) Flow cytometry analysis of endogenous TNF-α production by human WAT macrophage subsets from n=4 lean, n=2 overweight, and n=4 obese patients. Each point represents an individual patient. (d) Representative flow cytometry histograms of CLEC10A and FCER1A expression on human WAT DC subsets. (e) Density of the indicated DC populations by BMI classification, n=9 lean and n=7 obese patients. Each point represents an individual patient (f) Representative flow cytometry plots of human WAT macrophage populations from lean (left) and obese (right) patients. (g) Density of the indicated macrophage populations by BMI classification, n=7 lean and n=7 obese patients. Each point represents an individual patient. (b,d) Data is representative of 3 individual patient samples. Samples were compared using two-tailed Student’s t test with Welch’s correction, assuming unequal SD, and data are presented as individual points with the mean ± SEM (*p<0.05, **p<0.01).
Extended Data Fig. 8. Analysis of the DEGs between PVM and IM fates shows a clear bifurcation in gene expression programs.
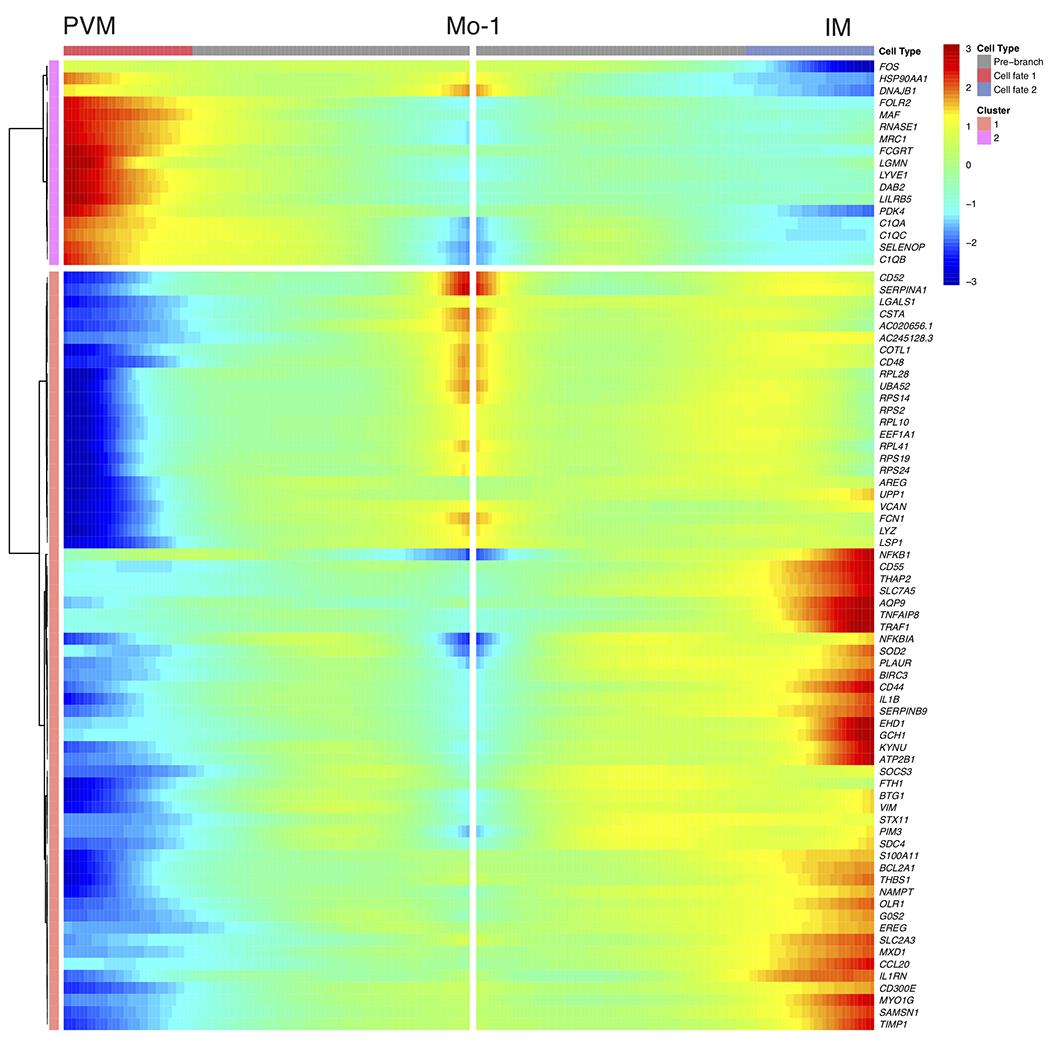
Bifurcation heatmap of enriched genes for PVM (left), Mo-1 (middle) and IM (right). Color indicates increased (red) or decreased (blue) expression.
Extended Data Fig. 9. Novel human WAT cell types contribute to obesity-associated inflammatory networks.
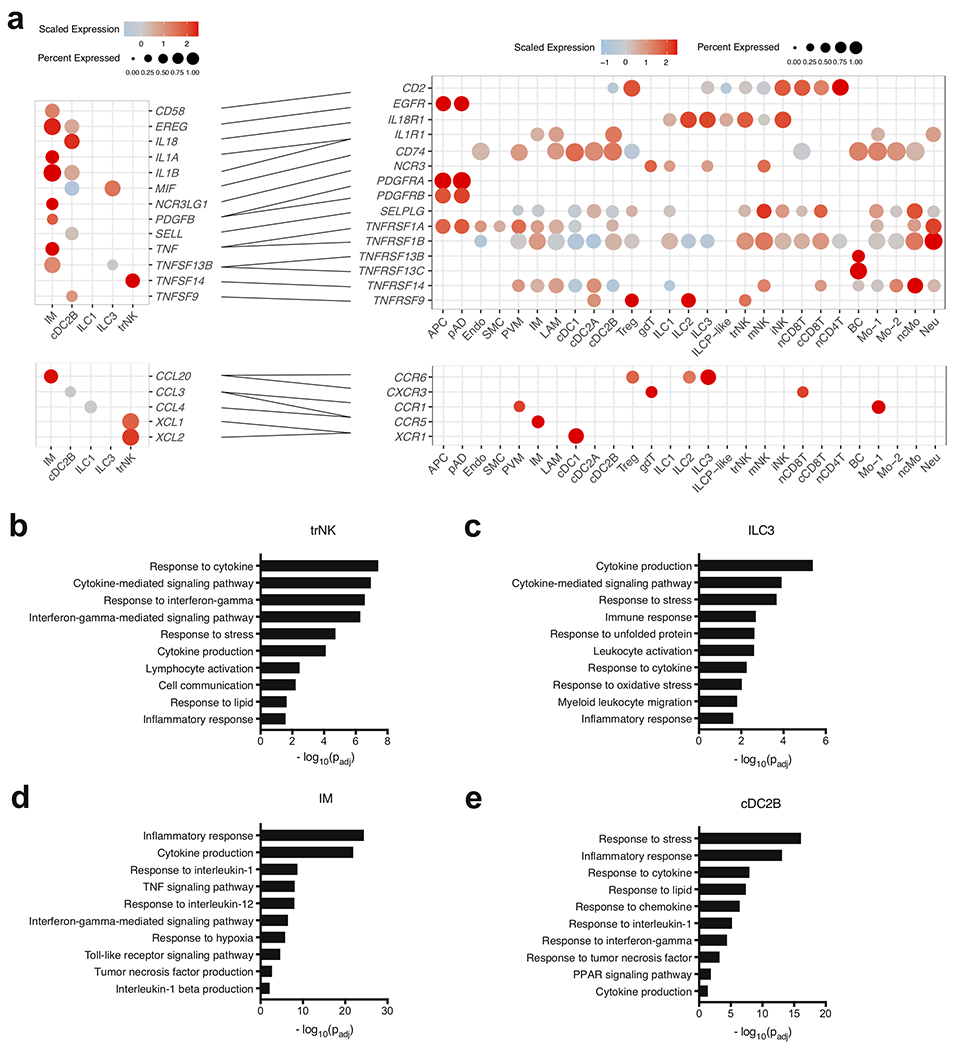
(a) Dot plots showing expression of ligands (left) and receptors (right) in novel human WAT cells; only ligands and receptors from cell types with detected expression (>25%) are shown. Implicated chemokines can be found in the lower panel. Color saturation indicates the strength of expression in positive cells, while dot size reflects the percentage of each cell cluster expressing the gene. (b-e) GOSt analysis of obese-enriched differentially expressed genes for the indicated novel human WAT cell types. (b) GOSt analysis of trNK. (c) GOSt analysis of ILC3. (d) GOSt analysis of IM. (e) GOSt analysis of cDC2B. Terms were considered statistically significantly enriched if −log10(Padj)<0.05.
Extended Data Fig. 10. Proposed model of cell-cell interactions in healthy lean and obese human WAT.
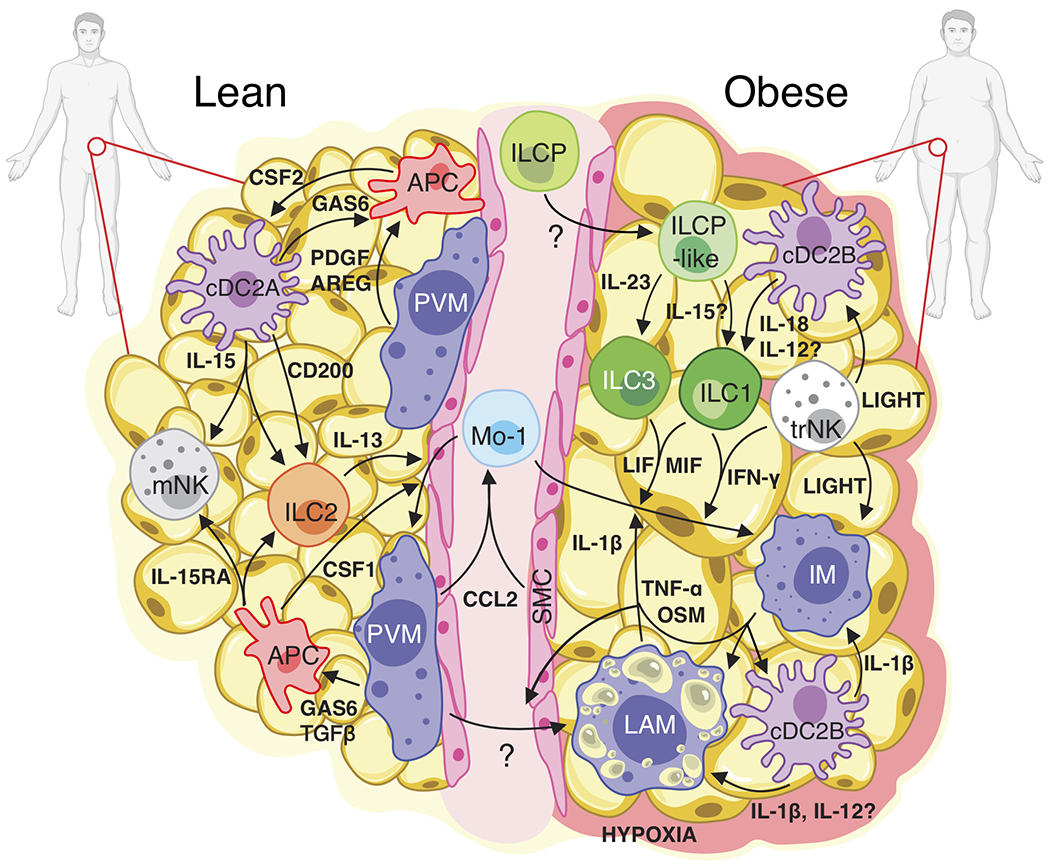
In lean WAT, IL-15 expression from cDC2A coupled with IL-15RA expression from APCs may support the viability of IL-15RB-expressing ILCs and NK cell populations. CSF1 (M-CSF) expression from APCs and IL-13 from ILC2s likely drives the Mo-1 transition to PVMs, while CSF2 from APCs may support dendritic cell homeostasis. cDC2A-derived CD200 could suppress ILC activation at steady-state. TGFβ1, PDGF, AREG, and GAS6 signaling from dendritic cells and PVM to APCs may promote tissue homeostasis. During obesity, IL-23 from an unknown source could drive the differentiation and accumulation of WAT ILC3s from ILCP-like cells. cDC2B-derived IL-18 and potentially IL-12 might stimulate the production of IFNγ by trNK and ILC1 subsets and contribute to the development of LAM from PVM. Increased CCL2 production from hypoxia-sensing PVM and SMC could recruit circulating Mo-1 into the WAT where MIF, LIF, and IFN-γ signaling from ILCs and NKs, as well as IL-1β, OSM and TNF-α signaling from IM, LAM, and cDC2B could polarize Mo-1 to the IM fate. trNK production of TNFSF14 (LIGHT) may further promote inflammation of cDC2B and IM. Together, these interactions suggest a cell type specific positive feedback loop whereby accumulation and polarization of WAT-resident lymphoid and myeloid cell types potentiate inflammation during human obesity.
Supplementary Material
Acknowledgements
We thank members of the Freud, O’Sullivan, Pellegrini, and Su labs for helpful discussion. We thank D. Barret for discarded surgical subcutaneous adipose tissue samples. We thank R. Modlin for assistance with IPA analysis. A.D.H was supported by the Ruth L. Kirschstein National Research Service Award AI007323. T.E.O. was supported by the NIH (P30DK063491, AI145997). F.M. was supported by Whitcome Fellowship at UCLA.
Footnotes
Competing Interests Statement
The authors do not have any competing interests to declare.
Reporting Summary
Further information on research design is available in the NatureResearchReportingSummary linked to this article.
References
- 1.Christ A, Lauterbach M & Latz E Western Diet and the Immune System: An Inflammatory Connection. Immunity 51, 794–811 (2019). [DOI] [PubMed] [Google Scholar]
- 2.Roden M & Shulman GI The integrative biology of type 2 diabetes. Nature 576, 51–60 (2019). [DOI] [PubMed] [Google Scholar]
- 3.Lee YS, Wollam J & Olefsky JM An Integrated View of Immunometabolism. Cell 172, 22–40 (2018). [DOI] [PMC free article] [PubMed] [Google Scholar]
- 4.Lackey DE & Olefsky JM Regulation of metabolism by the innate immune system. Nat Rev Endocrinol 12, 15–28 (2016). [DOI] [PubMed] [Google Scholar]
- 5.Pollack RM, Donath MY, LeRoith D & Leibowitz G Anti-inflammatory Agents in the Treatment of Diabetes and Its Vascular Complications. Dia Care 39, S244–S252 (2016). [DOI] [PubMed] [Google Scholar]
- 6.Ward ZJ et al. Projected U.S. State-Level Prevalence of Adult Obesity and Severe Obesity. N Engl J Med 381, 2440–2450 (2019). [DOI] [PubMed] [Google Scholar]
- 7.Vijay J et al. Single-cell analysis of human adipose tissue identifies depot- and disease-specific cell types. Nat Metab 2, 97–109 (2020). [DOI] [PMC free article] [PubMed] [Google Scholar]
- 8.Jaitin DA et al. Lipid-Associated Macrophages Control Metabolic Homeostasis in a Trem2-Dependent Manner. Cell 178, 686–698.e14 (2019). [DOI] [PMC free article] [PubMed] [Google Scholar]
- 9.Sun W et al. snRNA-seq reveals a subpopulation of adipocytes that regulates thermogenesis. Nature (2020) doi: 10.1038/s41586-020-2856-x. [DOI] [PubMed] [Google Scholar]
- 10.Dutertre C-A et al. Single-Cell Analysis of Human Mononuclear Phagocytes Reveals Subset-Defining Markers and Identifies Circulating Inflammatory Dendritic Cells. Immunity 51, 573–589.e8 (2019). [DOI] [PubMed] [Google Scholar]
- 11.Raredon MSB et al. Single-cell connectomic analysis of adult mammalian lungs. Sci. Adv 5, eaaw3851 (2019). [DOI] [PMC free article] [PubMed] [Google Scholar]
- 12.Stewart BJ et al. Spatiotemporal immune zonation of the human kidney. Science 365, 1461–1466 (2019). [DOI] [PMC free article] [PubMed] [Google Scholar]
- 13.Merrick D et al. Identification of a mesenchymal progenitor cell hierarchy in adipose tissue. Science 364, eaav2501 (2019). [DOI] [PMC free article] [PubMed] [Google Scholar]
- 14.Vieira Braga FA et al. A cellular census of human lungs identifies novel cell states in health and in asthma. Nat Med 25, 1153–1163 (2019). [DOI] [PubMed] [Google Scholar]
- 15.Vivier E et al. Innate Lymphoid Cells: 10 Years On. Cell 174, 1054–1066 (2018). [DOI] [PubMed] [Google Scholar]
- 16.Weizman O-E et al. ILC1 Confer Early Host Protection at Initial Sites of Viral Infection. Cell 171, 795–808.e12 (2017). [DOI] [PMC free article] [PubMed] [Google Scholar]
- 17.Nagasawa M et al. KLRG1 and NKp46 discriminate subpopulations of human CD117+CRTH2− ILCs biased toward ILC2 or ILC3. Journal of Experimental Medicine 216, 1762–1776 (2019). [DOI] [PMC free article] [PubMed] [Google Scholar]
- 18.Dogra P et al. Tissue Determinants of Human NK Cell Development, Function, and Residence. Cell 180, 749–763.e13 (2020). [DOI] [PMC free article] [PubMed] [Google Scholar]
- 19.Zhao J et al. Single-cell RNA sequencing reveals the heterogeneity of liver-resident immune cells in human. Cell Discov 6, 22 (2020). [DOI] [PMC free article] [PubMed] [Google Scholar]
- 20.Cuff AO et al. Eomes hi NK Cells in Human Liver Are Long-Lived and Do Not Recirculate but Can Be Replenished from the Circulation. J.I 197, 4283–4291 (2016). [DOI] [PMC free article] [PubMed] [Google Scholar]
- 21.Brestoff JR et al. Group 2 innate lymphoid cells promote beiging of white adipose tissue and limit obesity. Nature 519, 242–246 (2015). [DOI] [PMC free article] [PubMed] [Google Scholar]
- 22.Mjösberg JM et al. Human IL-25- and IL-33-responsive type 2 innate lymphoid cells are defined by expression of CRTH2 and CD161. Nat Immunol 12, 1055–1062 (2011). [DOI] [PubMed] [Google Scholar]
- 23.Simoni Y et al. Human Innate Lymphoid Cell Subsets Possess Tissue-Type Based Heterogeneity in Phenotype and Frequency. Immunity 46, 148–161 (2017). [DOI] [PMC free article] [PubMed] [Google Scholar]
- 24.O’Sullivan TE et al. Adipose-Resident Group 1 Innate Lymphoid Cells Promote Obesity-Associated Insulin Resistance. Immunity 45, 428–441 (2016). [DOI] [PMC free article] [PubMed] [Google Scholar]
- 25.Bar-Ephraim YE et al. Cross-Tissue Transcriptomic Analysis of Human Secondary Lymphoid Organ-Residing ILC3s Reveals a Quiescent State in the Absence of Inflammation. Cell Reports 21, 823–833 (2017). [DOI] [PubMed] [Google Scholar]
- 26.Villanova F et al. Characterization of Innate Lymphoid Cells in Human Skin and Blood Demonstrates Increase of NKp44+ ILC3 in Psoriasis. Journal of Investigative Dermatology 134, 984–991 (2014). [DOI] [PMC free article] [PubMed] [Google Scholar]
- 27.Lim AI et al. Systemic Human ILC Precursors Provide a Substrate for Tissue ILC Differentiation. Cell 168, 1086–1100.e10 (2017). [DOI] [PubMed] [Google Scholar]
- 28.Bar-Ephraim YE et al. CD62L Is a Functional and Phenotypic Marker for Circulating Innate Lymphoid Cell Precursors. J.I 202, 171–182 (2019). [DOI] [PubMed] [Google Scholar]
- 29.La Manno G et al. RNA velocity of single cells. Nature 560, 494–498 (2018). [DOI] [PMC free article] [PubMed] [Google Scholar]
- 30.Gulati GS et al. Single-cell transcriptional diversity is a hallmark of developmental potential. 8 (2020). [DOI] [PMC free article] [PubMed] [Google Scholar]
- 31.Villani A-C et al. Single-cell RNA-seq reveals new types of human blood dendritic cells, monocytes, and progenitors. Science 356, eaah4573 (2017). [DOI] [PMC free article] [PubMed] [Google Scholar]
- 32.Chakarov S et al. Two distinct interstitial macrophage populations coexist across tissues in specific subtissular niches. Science 363, eaau0964 (2019). [DOI] [PubMed] [Google Scholar]
- 33.Hill DA et al. Distinct macrophage populations direct inflammatory versus physiological changes in adipose tissue. Proceedings of the National Academy of Sciences 115, E5096–E5105 (2018). [DOI] [PMC free article] [PubMed] [Google Scholar]
- 34.Brown CC et al. Transcriptional Basis of Mouse and Human Dendritic Cell Heterogeneity. Cell 179, 846–863.e24 (2019). [DOI] [PMC free article] [PubMed] [Google Scholar]
- 35.Kim J et al. Silencing CCR2 in Macrophages Alleviates Adipose Tissue Inflammation and the Associated Metabolic Syndrome in Dietary Obese Mice. Molecular Therapy - Nucleic Acids 5, e280 (2016). [DOI] [PMC free article] [PubMed] [Google Scholar]
- 36.Weisberg SP et al. CCR2 modulates inflammatory and metabolic effects of high-fat feeding. J. Clin. Invest 116, 115–124 (2006). [DOI] [PMC free article] [PubMed] [Google Scholar]
- 37.Hotamisligil GS Inflammation, metaflammation and immunometabolic disorders. Nature 542, 177–185 (2017). [DOI] [PubMed] [Google Scholar]
- 38.Hume DA The Many Alternative Faces of Macrophage Activation. Front. Immunol 6, (2015). [DOI] [PMC free article] [PubMed] [Google Scholar]
- 39.Efremova M, Vento-Tormo M, Teichmann SA & Vento-Tormo R CellPhoneDB: inferring cell–cell communication from combined expression of multi-subunit ligand–receptor complexes. Nat Protoc 15, 1484–1506 (2020). [DOI] [PubMed] [Google Scholar]
- 40.Mittelsteadt KL & Campbell DJ ICOS signaling in visceral adipose tissue regulatory T cell homeostasis and function. J. Immunol 202, 128.4 (2019). [Google Scholar]
- 41.Joller N et al. Treg Cells Expressing the Coinhibitory Molecule TIGIT Selectively Inhibit Proinflammatory Th1 and Th17 Cell Responses. Immunity 40, 569–581 (2014). [DOI] [PMC free article] [PubMed] [Google Scholar]
- 42.Snelgrove RJ et al. A critical function for CD200 in lung immune homeostasis and the severity of influenza infection. Nat Immunol 9, 1074–1083 (2008). [DOI] [PubMed] [Google Scholar]
- 43.Shafiei-Jahani P et al. DR3 stimulation of adipose resident ILC2s ameliorates type 2 diabetes mellitus. Nat Commun 11, 4718 (2020). [DOI] [PMC free article] [PubMed] [Google Scholar]
- 44.Maazi H et al. ICOS:ICOS-Ligand Interaction Is Required for Type 2 Innate Lymphoid Cell Function, Homeostasis, and Induction of Airway Hyperreactivity. Immunity 42, 538–551 (2015). [DOI] [PMC free article] [PubMed] [Google Scholar]
- 45.Holmes TD et al. Licensed human natural killer cells aid dendritic cell maturation via TNFSF14/LIGHT. Proc Natl Acad Sci USA 111, E5688–E5696 (2014). [DOI] [PMC free article] [PubMed] [Google Scholar]
- 46.Kim H-M, Jeong C-S, Choi H-S, Kawada T & Yu R LIGHT/TNFSF14 enhances adipose tissue inflammatory responses through its interaction with HVEM. FEBS Letters 585, 579–584 (2011). [DOI] [PubMed] [Google Scholar]
- 47.O’Rourke RW et al. Systemic inflammation and insulin sensitivity in obese IFN-γ knockout mice. Metabolism 61, 1152–1161 (2012). [DOI] [PMC free article] [PubMed] [Google Scholar]
- 48.Böttcher JP et al. NK Cells Stimulate Recruitment of cDC1 into the Tumor Microenvironment Promoting Cancer Immune Control. Cell 172, 1022–1037.e14 (2018). [DOI] [PMC free article] [PubMed] [Google Scholar]
- 49.Macdougall CE et al. Visceral Adipose Tissue Immune Homeostasis Is Regulated by the Crosstalk between Adipocytes and Dendritic Cell Subsets. Cell Metabolism 27, 588–601.e4 (2018). [DOI] [PMC free article] [PubMed] [Google Scholar]
- 50.Maier B et al. A conserved dendritic-cell regulatory program limits antitumour immunity. Nature 580, 257–262 (2020). [DOI] [PMC free article] [PubMed] [Google Scholar]
Additional Methods References:
- 51.Butler A, Hoffman P, Smibert P, Papalexi E & Satija R Integrating single-cell transcriptomic data across different conditions, technologies, and species. Nat Biotechnol 36, 411–420 (2018). [DOI] [PMC free article] [PubMed] [Google Scholar]
- 52.Koay H-F et al. A divergent transcriptional landscape underpins the development and functional branching of MAIT cells. Sci. Immunol 4, eaay6039 (2019). [DOI] [PMC free article] [PubMed] [Google Scholar]
- 53.Szabo PA et al. Single-cell transcriptomics of human T cells reveals tissue and activation signatures in health and disease. Nat Commun 10, 4706 (2019). [DOI] [PMC free article] [PubMed] [Google Scholar]
- 54.Zheng GXY et al. Massively parallel digital transcriptional profiling of single cells. Nat Commun 8, 14049 (2017). [DOI] [PMC free article] [PubMed] [Google Scholar]
- 55.Wong KL et al. Gene expression profiling reveals the defining features of the classical, intermediate, and nonclassical human monocyte subsets. Blood 118, e16–e31 (2011). [DOI] [PubMed] [Google Scholar]
- 56.Trapnell C et al. The dynamics and regulators of cell fate decisions are revealed by pseudotemporal ordering of single cells. Nat Biotechnol 32, 381–386 (2014). [DOI] [PMC free article] [PubMed] [Google Scholar]
- 57.Bergen V, Lange M, Peidli S, Wolf FA & Theis FJ Generalizing RNA velocity to transient cell states through dynamical modeling. Nat Biotechnol (2020) doi: 10.1038/s41587-020-0591-3. [DOI] [PubMed] [Google Scholar]
- 58.Raudvere U et al. g:Profiler: a web server for functional enrichment analysis and conversions of gene lists (2019 update). Nucleic Acids Research 47, W191–W198 (2019). [DOI] [PMC free article] [PubMed] [Google Scholar]
Associated Data
This section collects any data citations, data availability statements, or supplementary materials included in this article.


