

Abstract
Despite its increased application in pancreatic ductal adenocarcinoma (PDAC), complete response to neoadjuvant therapy (NAT) is rare. Given the critical role of host immunity in regulating cancer, we sought to correlate baseline inflammatory profiles to significant response to NAT. PDAC patients receiving NAT were classified as responders (R) or non-responders (NR) by CA19–9 response, pathological tumor size, and lymph node status in the resected specimen. Baseline (treatment-naive) plasma was analyzed to determine levels of 27 inflammatory mediators. Logistic regression was used to correlate individual mediators with response. Network Analysis (NA) and Pearson correlation maps were derived to determine baseline inflammatory mediator profiles. 40 patients (20R and 20NR) met study criteria. The R showed significantly higher OS (59.4 vs 21.25 months, p=0.002) and DFS (50.97 vs. 10.60 months, p=0.005), compared to NR. sIL-2Rα was a significant predictor of no response to NAT (p=0.045). Analysis of inflammatory profiles using the Pearson heat map analysis followed by network analysis depicted increased inflammatory network complexity in NR compared to R (1.69 vs 1), signifying a more robust baseline inflammatory status of NR. A panel of inflammatory mediators identified by logistic regression and Fischer score analysis was used to create a potential decision tree to predict NAT response. We demonstrate that baseline inflammatory profiles are associated with response to NAT in PDAC, and that an upregulated inflammatory status is associated with a poor response to NAT. Further analysis into the role of inflammatory mediators as predictors of chemotherapy response is warranted.
Keywords: pancreatic cancer, neoadjuvant therapy, cytokines, inflammation, pathological response
INTRODUCTION
Pancreatic ductal adenocarcinoma (PDAC) is an aggressive malignancy with a dismal prognosis. Despite surgical resection, recurrence is nearly universal with a 5-year survival rate under 10%.[1] Since even grossly localized disease maybe associated with micro-metastasis at diagnosis, an increasing number of patients receive neoadjuvant therapy (NAT). NAT may lead to tumor downstaging, higher rates of margin-negative resection (R0), sterilization of regional lymph node basins and enables treatment of occult systemic disease.[2]
Despite its increased use, several metanalyses have failed to demonstrate a survival benefit to NAT.[3] While a complete response or near-complete response to NAT is associated with improved survival, it is only observed in under 20% of patients treated.[4] Surrogates for chemo-response during NAT include CA19–9 reduction, tumor size reduction, R0 resection, N0 disease, pathologic complete or near-complete tumor response and circulating nucleic acid reduction.[3,5,6]. These surrogates are temporally dependent and lack the ability to predict response at diagnosis, prior to initiation of treatment. The identification of chemo-responsive patients ‘a priori’ therefore remains a challenge, and biomarkers of response are desperately needed to help guide precision-based treatment.
Inflammation has been implicated in the pathogenesis, progression, and metastasis of most adult malignancies, including PDAC.[7,8] PDAC induces a highly robust local and systemic inflammatory response.[9,10] The tumor microenvironment (TME) displays proliferation of pancreatic stellate cells (PSC) and fibroblasts, and infiltration of myeloid-derived suppressor cells (MDSCs) and tumor-associated macrophages (TAMs).[11] These innate inflammatory cells suppress the activation of effector lymphocytes, inhibit tumor specific immunosurveillance and promote tumor growth and metastasis.[12] In addition, only limited numbers of dendritic cells (DCs) are found in the TME.[13] The peritumoral desmoplastic reaction impedes angiogenesis, reducing chemotherapeutic drug delivery to the tumor, leading to chemo-resistance.[14] Thus, inflammatory mediators are suggested targets to improve chemosensitivity and response to therapy in PDAC. [15,16]
The role of inflammatory mediators as predictors of response to NAT in PDAC has not been established. Our aim was to corelate the baseline inflammatory profiles of patients with PDAC with significant response to NAT. We hypothesized that a panel of baseline inflammatory mediators may predict response to NAT in patients with PDAC, prior to initiation of treatment.
MATERIALS AND METHODS
Study design and patient selection
This study was an IRB-approved retrospective analysis of PDAC patients treated with NAT followed by resection between 2010 and 2019 at the University of Pittsburgh Medical Center (UPMC), a high volume pancreatic surgery center. Patients included in the study were: 1- biopsy-proven PDACs treated with NAT followed by surgical resection, 2- classified as responders (R) or non-responders (NR) to NAT by tumor marker and histopathologic response to NAT, and 3- had available baseline (treatment-naive) plasma for inflammatory mediator analysis from the PAGER (Pancreatic Adenocarcinoma Gene Environment Risk) bio-specimen bank maintained at UPMC.
Responders (R) were defined as having CA19–9 reduction following NAT and either complete pathological response in the resected specimen (evidenced by absence of viable tumor) or near-complete pathological response (evidenced by tumor (T) size ≤ 1 cm and N0 disease). Non responders (NR) were defined by no CA19–9 reduction during NAT and all of the following pathological criteria in the resected specimen: T size >1 cm and positive lymph node disease (N+). All non-responders also showed no pathological treatment response by the College of American pathologists (CAP) or Evans grading system, as per the pathologist’s report. [17,18]. Patients not fulfilling the inclusion criteria of either group were excluded to minimize patient-to-patient variability in a more diverse cohort.
Patients who failed to reach surgical resection after NAT, were not considered for this analysis, as pathology was used for defining the two groups, which would not be available for patients who could not undergo resection.
Data collection and definitions
Baseline variables collected from the electronic medical record (EMR) at the time of diagnosis included demographics and blood chemistry values (including the systemic inflammatory index (SII: [absolute neutrophils/absolute lymphocytes]x platelets) [19] and CA19–9 levels). Resected specimen data included: tumor size (T-stage), grade, lymph node (LN) involvement, LN ratio (LNR), presence of lympho-vascular (LVI), and perineural invasion (PNI). Overall survival (OS) was calculated from the date of surgery to the date of death. Disease-free survival (DFS) was calculated from the date of surgery to the date of recurrence or death. In both, survival times for patients who did not experience the event were measured from the date of surgery to the date of last follow-up (right-censored).
Plasma storage and analysis
Whole blood samples were collected in EDTA tubes at the time of diagnosis and transported at 4°C prior to plasma centrifugation isolation (include 1000 RCF × 10 minutes) and freezing at −80°C. Plasma samples were analyzed using Luminex™ for 26 cytokines and chemokines (Eotaxin, GM-CSF, IFNα2, IFNγ, IL-10, IL-12p40, IL-12p70, IL-13, IL-15, IL-17A, IL-1RA, IL-1β, IL-2, IL-4, IL-5, IL-6, IL-7, IL-8, IP-10, MCP-1, MIP-1α, MIP-1β, TNFα, sIL-2Rα, MIG and IL-18) and ELISA (for HMGB1). The Luminex™ MAGPIX analyzer, using Xponent software (Luminex, Austin, TX) and Human Cytokine/Chemokine MILLIPLEX™ Panel kits HCYTOMAG-60K-23, HCYP3MAG-63K-01 (MIG), and HSCRMAG-32K-01 (sIL-2Rα), (Millipore Corporation, Billerica, MA) were used to measure all inflammatory mediators, except HMGB1, which was measured with the TECAN ELISA kit, catalog # ST51011 (Morrisville, NC 27560), using Molecular Devices, SpectraMax 190 spectrophotometer (San Jose CA, 95134). The Luminex™ and HMGB1 kits were used according to their manufacturer’s instructions.
Statistical analysis
All data were de-identified prior to analysis. Exploratory analysis was performed to identify patient and tumor characteristics associated with response to chemotherapy. Quantitative variables were compared using the Wilcoxon rank-sum test and categorical variables were compared using the likelihood ratio chi-square test. Statistical analysis was performed using Stata SE 16.0 (StataCorp, Texas, USA); p-values <0.05 were considered significant.
Three separate analyses were performed to interrogate the association between baseline cytokine profile and response to NAT. First, logistic regression and multivariate analysis identified the association of individual mediators with response. Based on standard statistical practices and analysis of moderate number of cytokines in a small cohort of patients, p-value less than 0.05 was considered significant. Second, Fisher score analysis was performed to select mediators which could differentiate between R and NR patients, according to their score under the Fisher criterion.[20] Third, Pearson correlation heatmaps and Network Analysis (NA) were used to differentiate between baseline inflammatory profiles of Rs and NRs.[21,22] For each group, Pearson correlation maps depict a holistic view of interactions among the inflammatory mediators, while NA depicts the connections among the inflammatory mediators at a particular stringency (strength of interaction). The networks were drawn at 0.95 stringency to reduce the likelihood of depicting spurious correlations in a small sample size. Connections among the inflammatory mediators in the NA were defined as numbers of trajectories of inflammatory markers that move in parallel (black edges [lines]) or in anti-parallel (red edges) fashion at a particular stringency. Network complexity was calculated using the formula [= (N1 + N2 + … + Nn)/(n-1)], where N represents the number of connections for each mediator and n is the total number of mediators analyzed.[23] NA was carried out using the MATLAB® software (Natick, MA) and Pearson correlations were calculated using the free web-based tool suite MetaboAnalyst (https://www.metaboanalyst.ca).
Using logistic regression and Fisher score analysis, a panel of inflammatory cytokines was identified to create a decision tree predicting response to NAT. Plasma inflammatory mediator levels were dichotomized to identify cut-offs that differentiated NRs and Rs with the highest accuracy. Mediators were sequentially arranged to create a decision tree that could predict response to NAT. Due to the limited sample size, rarity of complete response to NAT and unavailability of a similar biobank of plasma samples, a validation cohort was not possible.
RESULTS
Characteristics and outcomes of the overall cohort
A total of 40 patients met study criteria: 20 R and 20 NR. The average age was 63.2 years and 60% were females. There were no significant differences in the demographic and disease-related variables between the groups, including baseline CA19–9 levels, clinical tumor size, and EUS stage at diagnosis (Table 1). All patients in the study were treated with neoadjuvant therapy (gemcitabine (58%) or 5-Fluorouracil based (30%) chemotherapy, with 12% receiving both drug regimes and 23% receiving neoadjuvant RT). The estimated mean OS and DFS were significantly higher in R compared to NRs (OS: 59.4 months 95% CI: 42.77, 76.02 vs 21.25 months 95% CI: 11.78,30.72, p=0.002) and (DFS: 50.97 months 95%CI: 33.16, 68.78 vs. 10.60 months 95%CI: 7.62, 13.57, p=0.005).
Table 1:
Patient demographics and treatment variables.
| Variables | Overall | Responders (n=20) |
Non-Responders (n=20) |
P-value | |
|---|---|---|---|---|---|
| Demographics | |||||
| Age | 63.2 (9.8) | 62.2 (9.4) | 64.1 (10.3) | 0.48 | |
| Sex (Female) | 24 (60%) | 12 (60%) | 12 (60%) | 1.00 | |
| BMI** | 26.69 (6.84) | 27.97 (4.98) | 25.54 (8.69) | 0.10 | |
| CCI Unadjusted | 2.5 (0.9) | 2.4 (0.7) | 2.7 (1.1) | 0.33 | |
| CCI Adjusted | 4.3 (1.5) | 4.0 (1.3) | 4.7 (1.7) | 0.19 | |
| Diabetes | 11 (28%) | 8 (40%) | 3 (15%) | 0.07 | |
| Cardiovascular Disease | 19 (48%) | 9 (45%) | 10 (50%) | 0.75 | |
| Hemoglobin | 13.3 (1.3) | 13.5 (1.3) | 13.1 (1.2) | 0.28 | |
| Absolute Neutrophil ** | 5.1(2.4) | 5.2 (1.7) | 4.7 (3.1) | 0.93 | |
| Absolute Lymphocyte ** | 1.5 (0.9) | 1.6 (0.9) | 1.5 (0.9) | 0.97 | |
| Absolute Monocytes | 0.6 (0.2) | 0.5 (0.2) | 0.7 (0.3) | 0.06 | |
| Platelets ** | 230 (87) | 230 (70) | 239 (87) | 0.53 | |
| Systemic inflammatory index (SII)** | 619.23 (530.58) | 626.22 (480.97) | 574.22 (715.19) | 0.57 | |
| Baseline CA19–9** | 112 (608.3) | 198 (1149) | 78 (484.6) | 0.64 | |
| Tumor size on CT (cm) ** | 2.95 (2.0) | 2.5 (2.7) | 3 (0.9) | 0.67 | |
| Neoadjuvant therapy | |||||
| Regimen | Gem-based | 23 (58%) | 7 (35%) | 16 (80%) | 0.01 |
| 5-FU based | 12 (30%) | 9 (45%) | 3 (15%) | ||
| Both | 5 (12%) | 4 (20%) | 1 (5%) | ||
| Radiation | 9 (23%) | 8 (40%) | 1(5%) | <0.01 | |
|
Pathologic / survival data |
|||||
| Tumor size | 1.8 (1.6) | 0.4 (0.4) | 3.2 (1.2) | < 0.01 | |
| Margin status | 16 (40) | 2 (10) | 14 (70) | < 0.01 | |
| Lymphovascular invasion | 22 (58) | 4 (21) | 18 (95) | < 0.01 | |
| Perineural invasion | 22 (59) | 4 (21) | 18 (100) | < 0.01 | |
| Adjuvant therapy receipt | 28 (72) | 14 (74) | 14 (70) | 0.80 | |
| Disease free survival, months*** | 31.89 (19.48–44.31) | 50.97 (33.16–68.78) | 10.6 (7.62–13.57) | 0.005 | |
| Overall survival, months*** | 41.1 (28.55–53.65) | 59.40 (42.77–76.02) | 21.25 (11.78–30.72) | 0.002 | |
Abbreviations: CCI, Charlson Comorbidity Index; BMI, Body Mass Index; CA19–9, Carbohydrate antigen 19–9; CT, computed tomography; T-size, Tumor-size; SII, Systemic inflammatory index; EUS, Endoscopic ultrasound; Gem, Gemcitabine; 5FU, 5 fluorouracil.
All values presented as Mean (SD) for continuous variables or N(%) for binary variables.
Values represented as median(IQR)
Survival values presented are the estimated restricted mean and 95% CI.
Predictors of response to NAT by logistic regression
Using logistic regression, several mediators displayed trends towards predicting response including: IL-6 [OR (Odds Ratio) = 1.157; p=0.083], sIL-2Rα (OR= 0.998; p=0.099), IL-8 (OR= 0.989; p=0.106), IL-13 (OR1.031; p=0.157), IL-12p40 (OR1.005; p=0.159) and IL-1RA (OR1.002; p=0.177) (Supplemental Table 1). On multivariate analysis, after adjusting for NAT duration, sIL-2Rα was the only significant predictor of response to NAT (OR= 0.997, 95%CI= 0.994–1; p=0.045).
Inflammatory mediator interactions in responders and non-responders to NAT
To analyze the baseline inflammatory profiles and assess the degree of inflammatory activation, Pearson correlation maps were derived for each group. These maps depict positive (red) or negative (blue) correlation among individual inflammatory mediators along with the strength of interaction. Pearson correlation maps demonstrated higher baseline inflammatory profile in NR vs. R, as depicted by more positive correlations and higher strength of interactions among the inflammatory mediators (Figure 1).
Figure 1A and 1B:
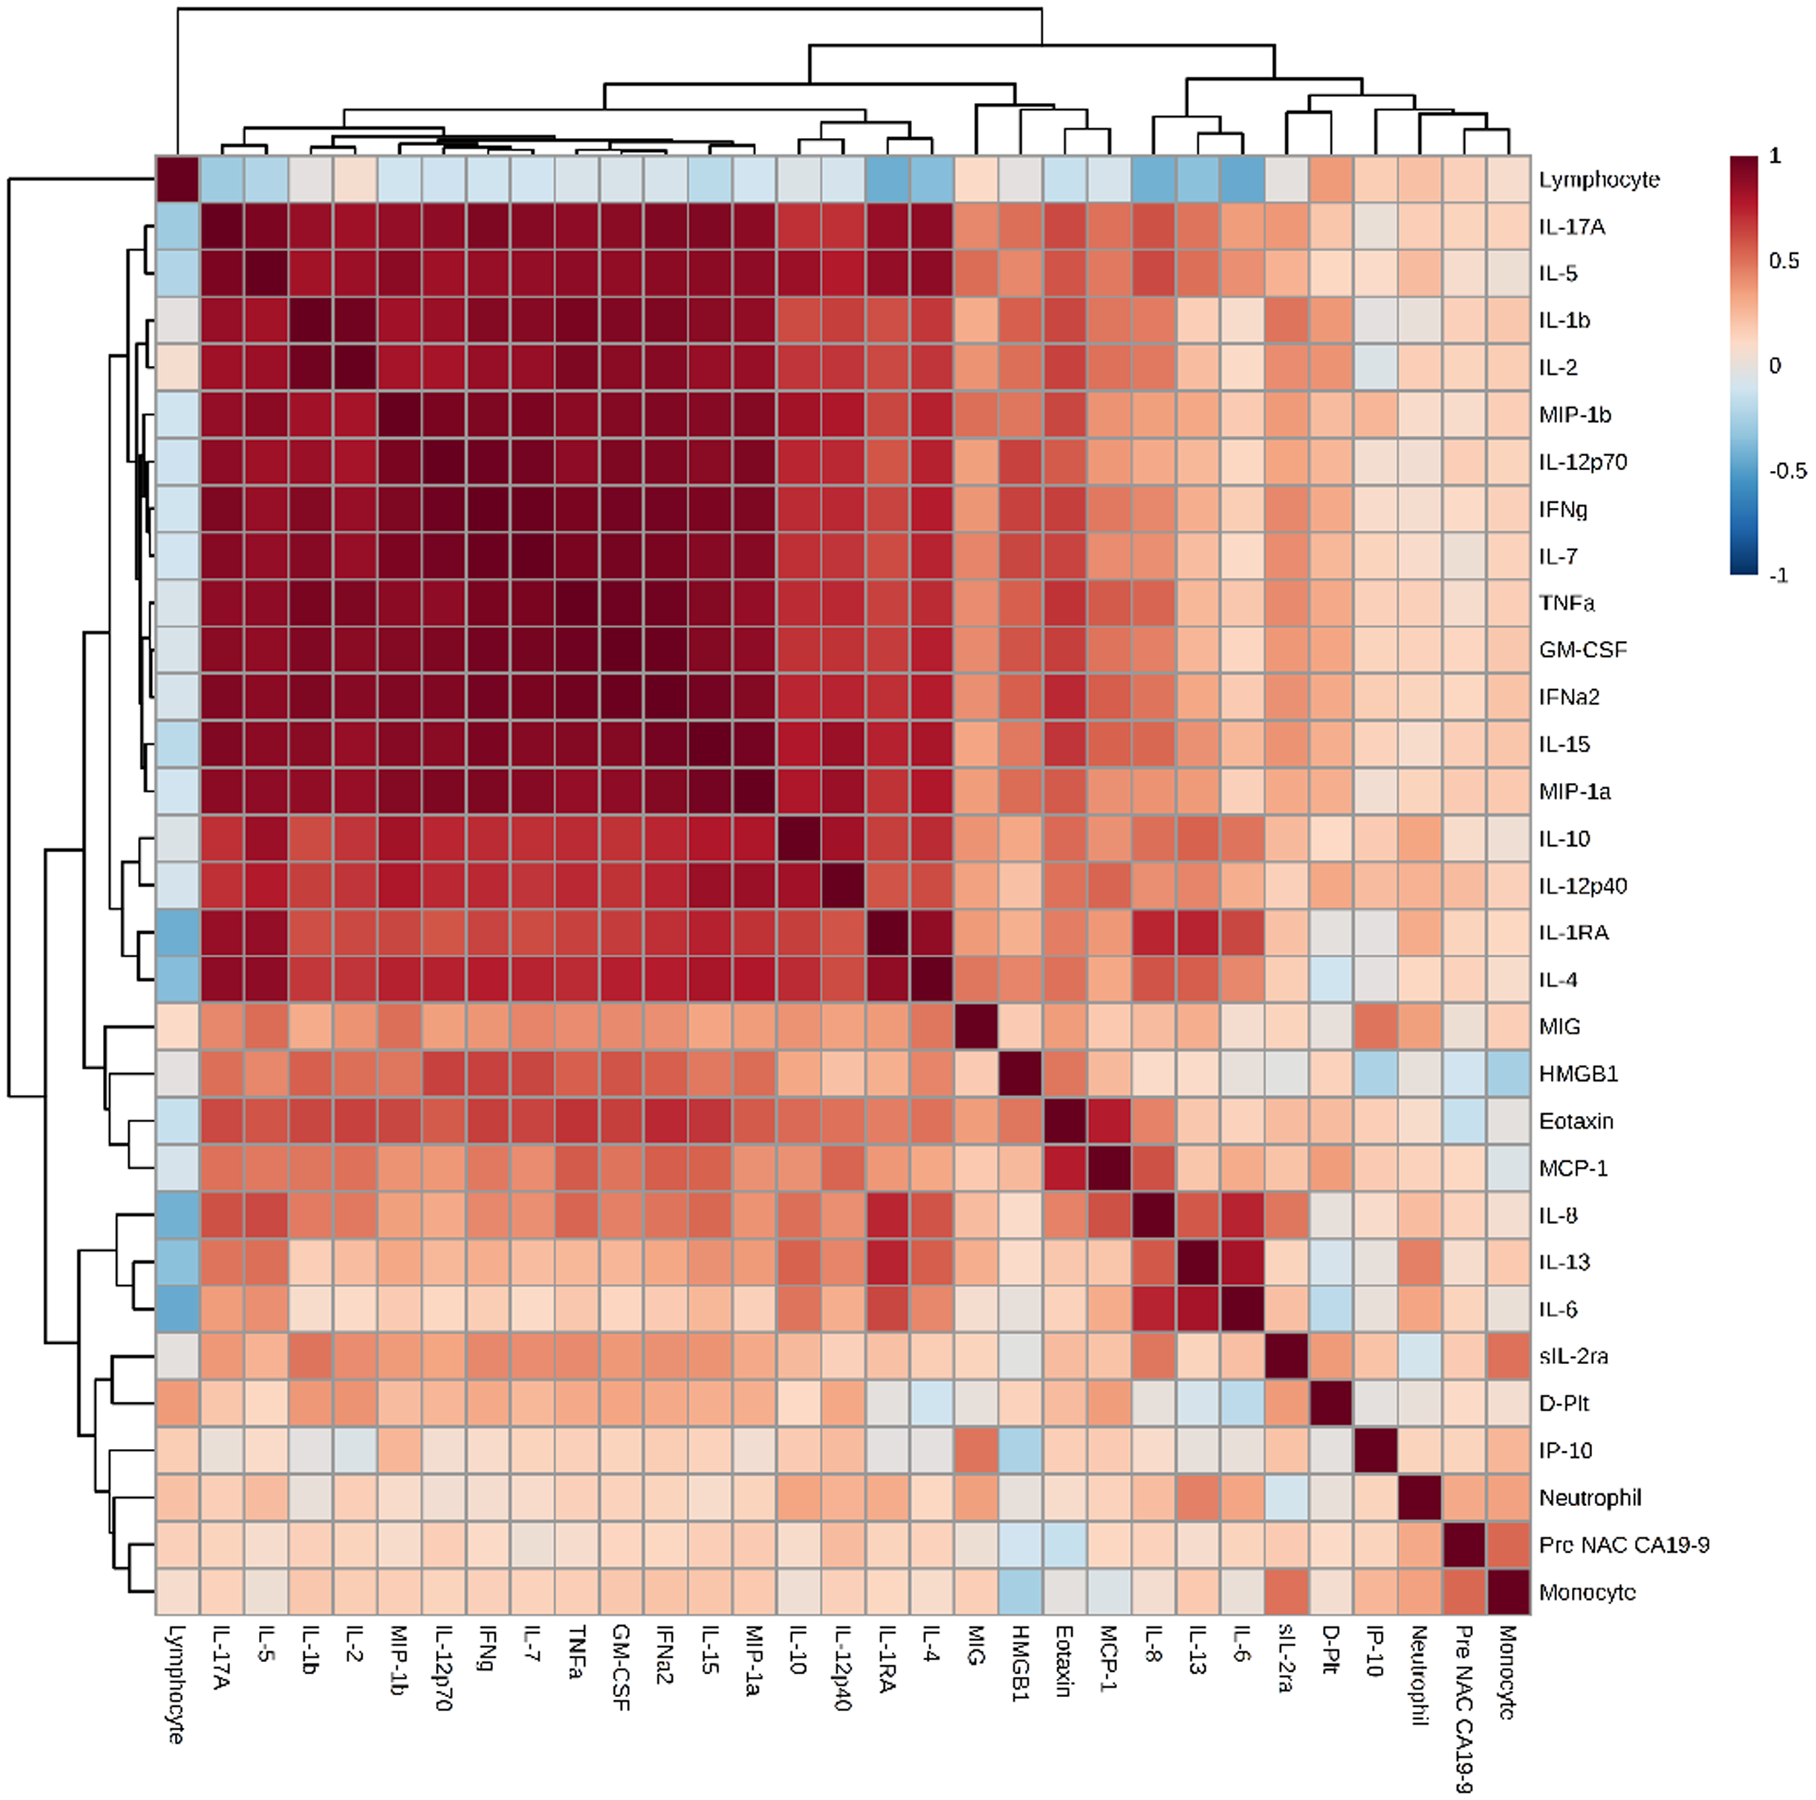
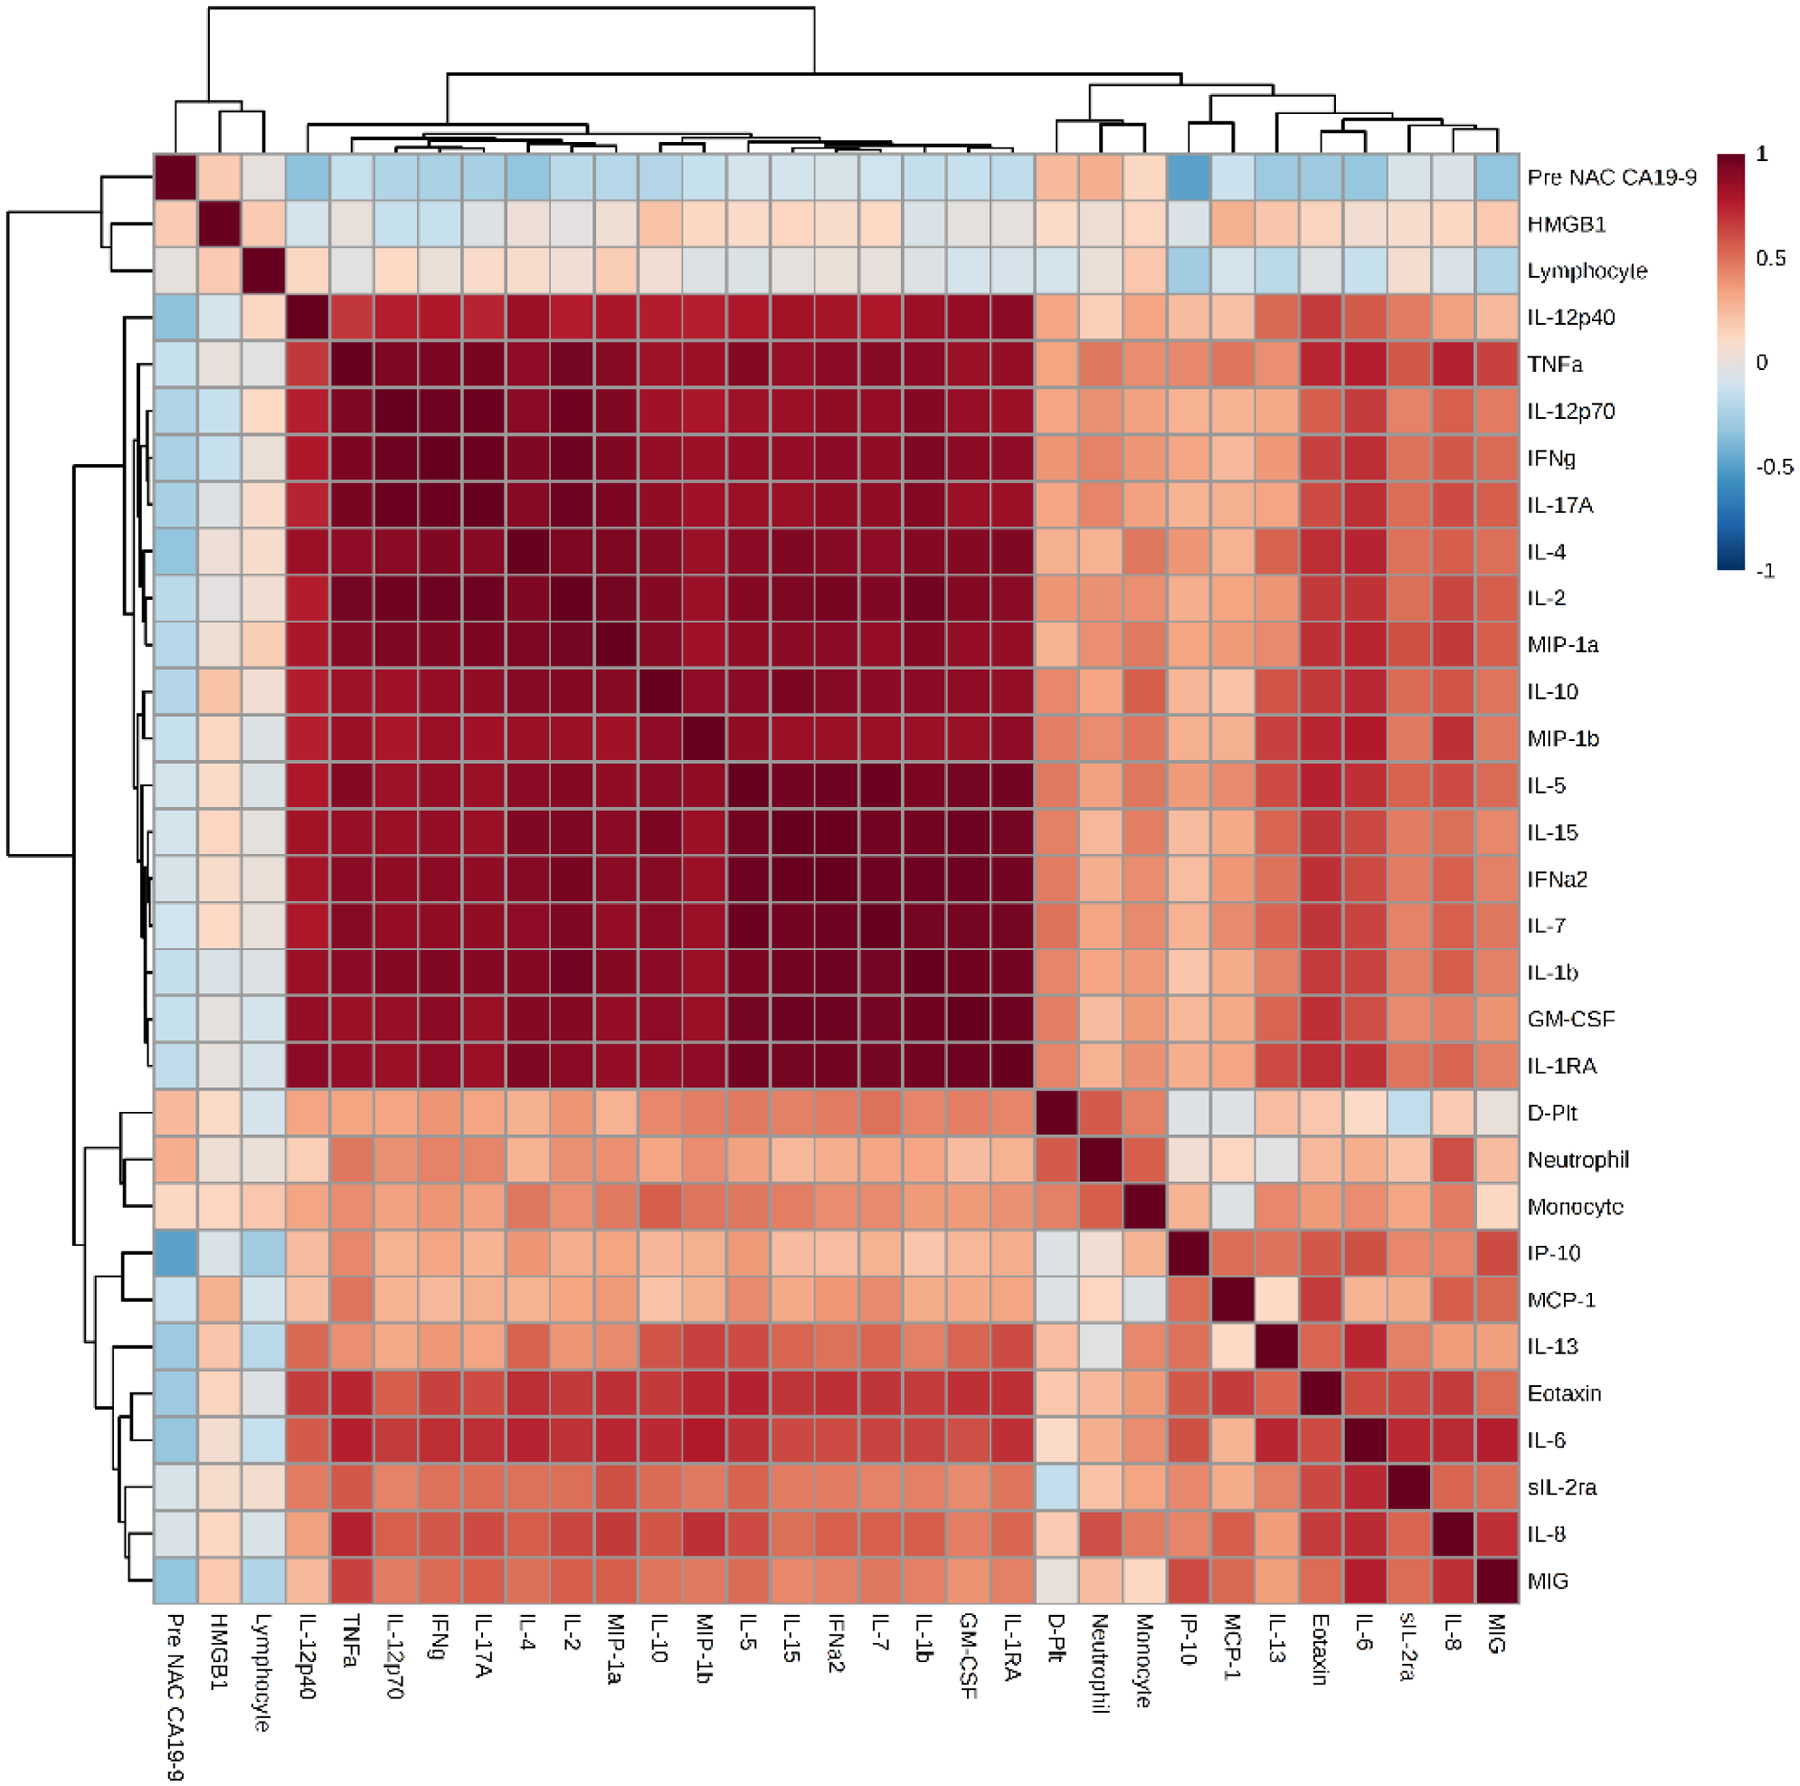
Pearson correlation maps for responders (1A) and non-responders: (1B). An overall depiction of the interactions and the strength of interactions between the various inflammatory markers in the 2 groups- The non-responders show stronger interactions than the responders.
Network analysis (NA) was used to define coordinated inflammation programs by analyzing the connections among inflammatory mediators in each group. Based on this analysis, NR demonstrated higher network complexity as compared to R at all levels of stringency (Figure 2).
Figure 2:
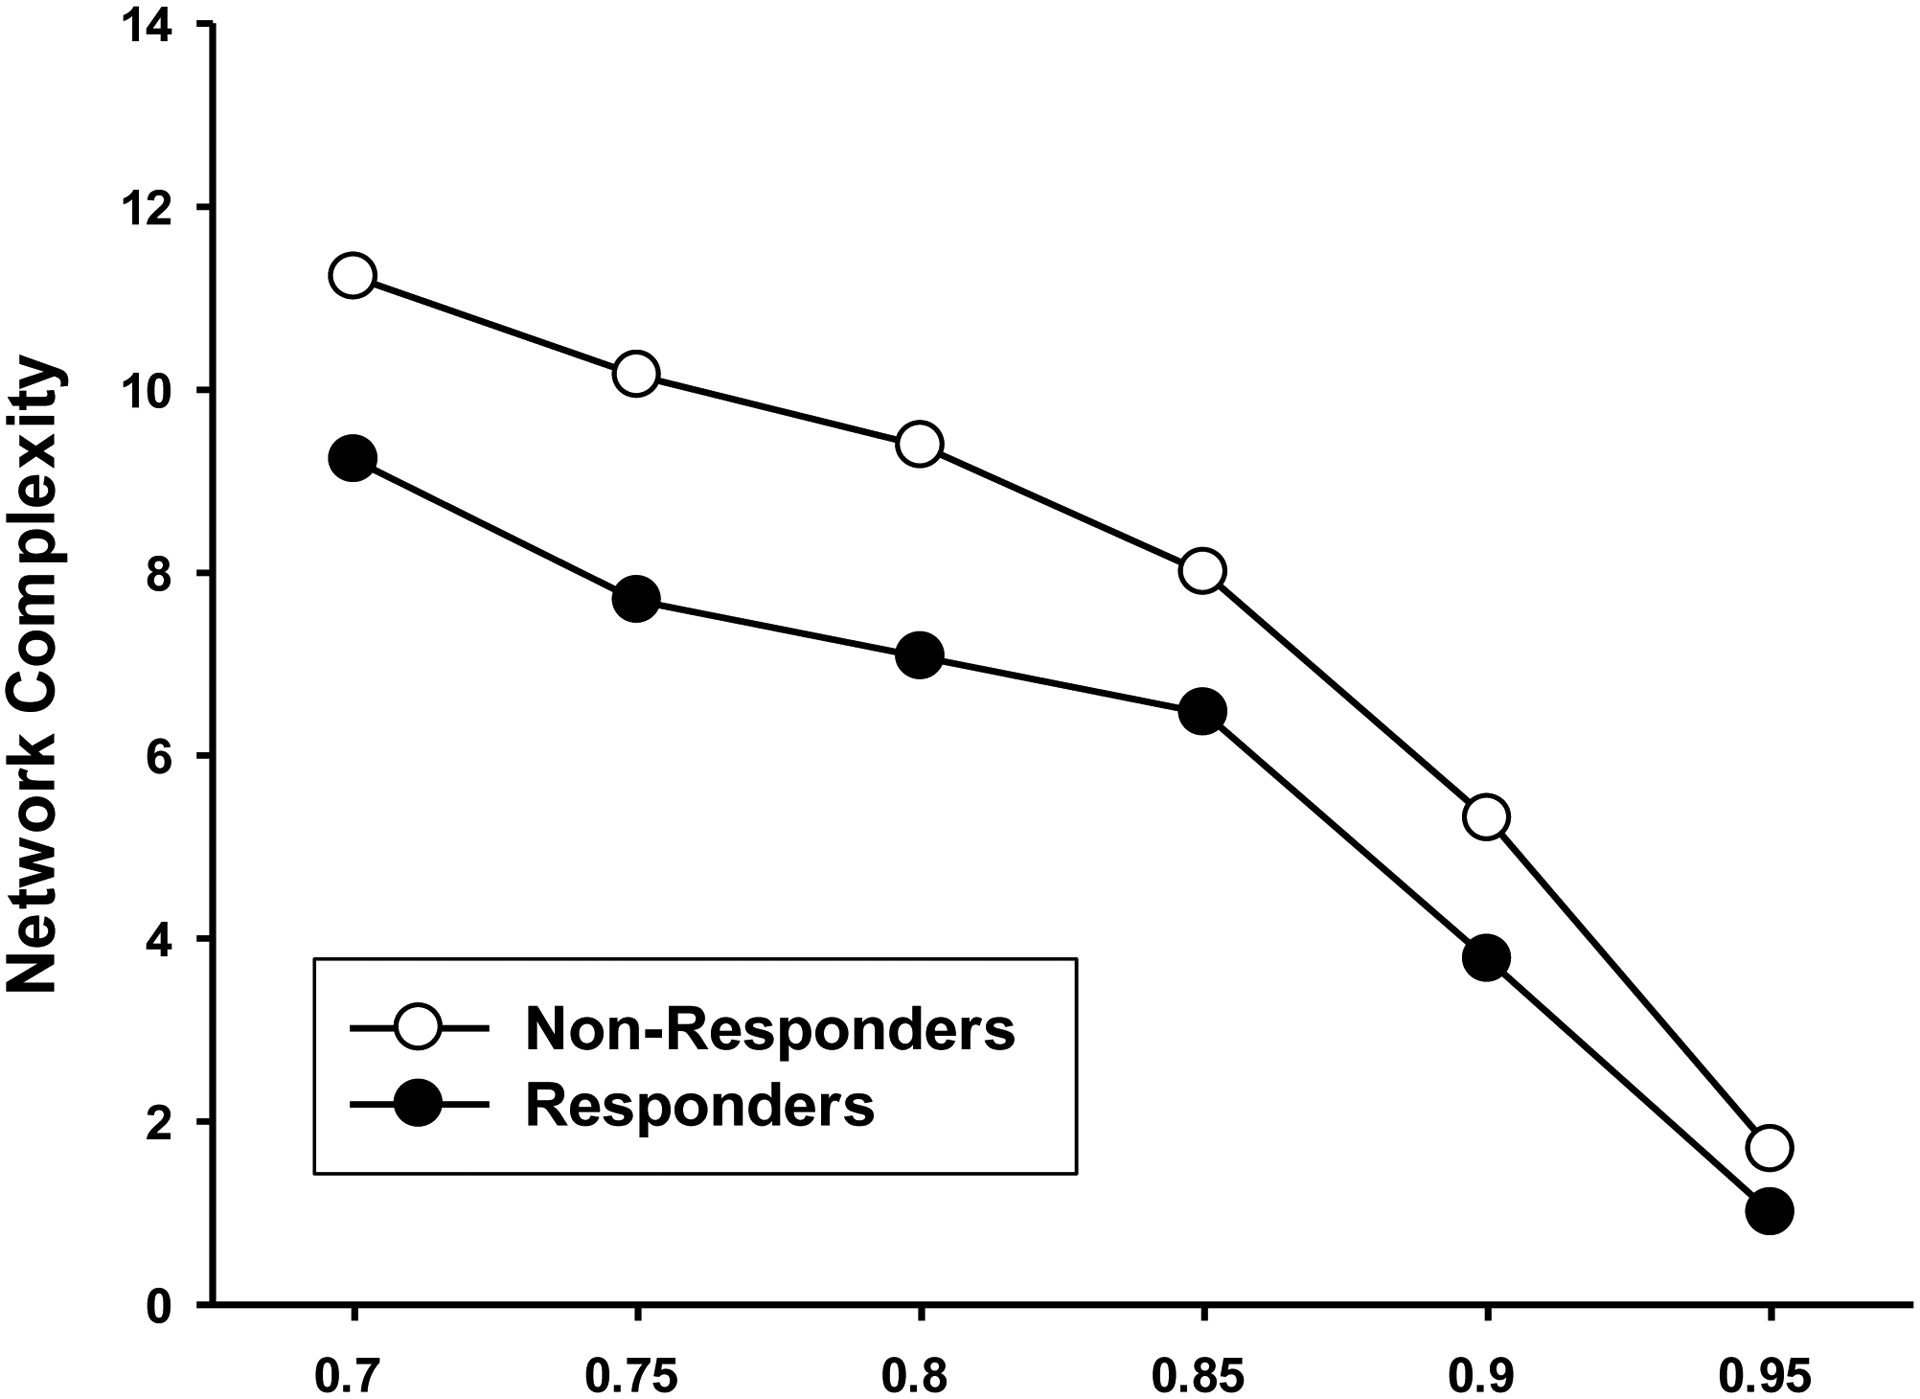
Network complexity at different levels of stringency for responders and non-responders. Plotting the network complexities of the two groups at various levels of stringency (strength of interactions between cytokines) showed higher complexity in the non-responders compared to the responders.
At 0.95 stringency, NR patients demonstrated a higher number of network connections (22 vs 13) and a higher network complexity compared to R (1.69 vs 1.00), supporting the notion of more robust baseline inflammatory programs for NR compared to R (Figure 3). Specifically, the NR cohort displayed a higher number of network connections for IL-1β, IL-1RA, IL-2, IL-4, IL-5, IL-10, IL-15, IL-17A, IL-12p70, and MIP-1α (Figure 3), in contrast to the R cohort which displayed a higher number of network connections among IL-7, IFNγ, GM-CSF, and TNFα.
Figure 3A and 3B:
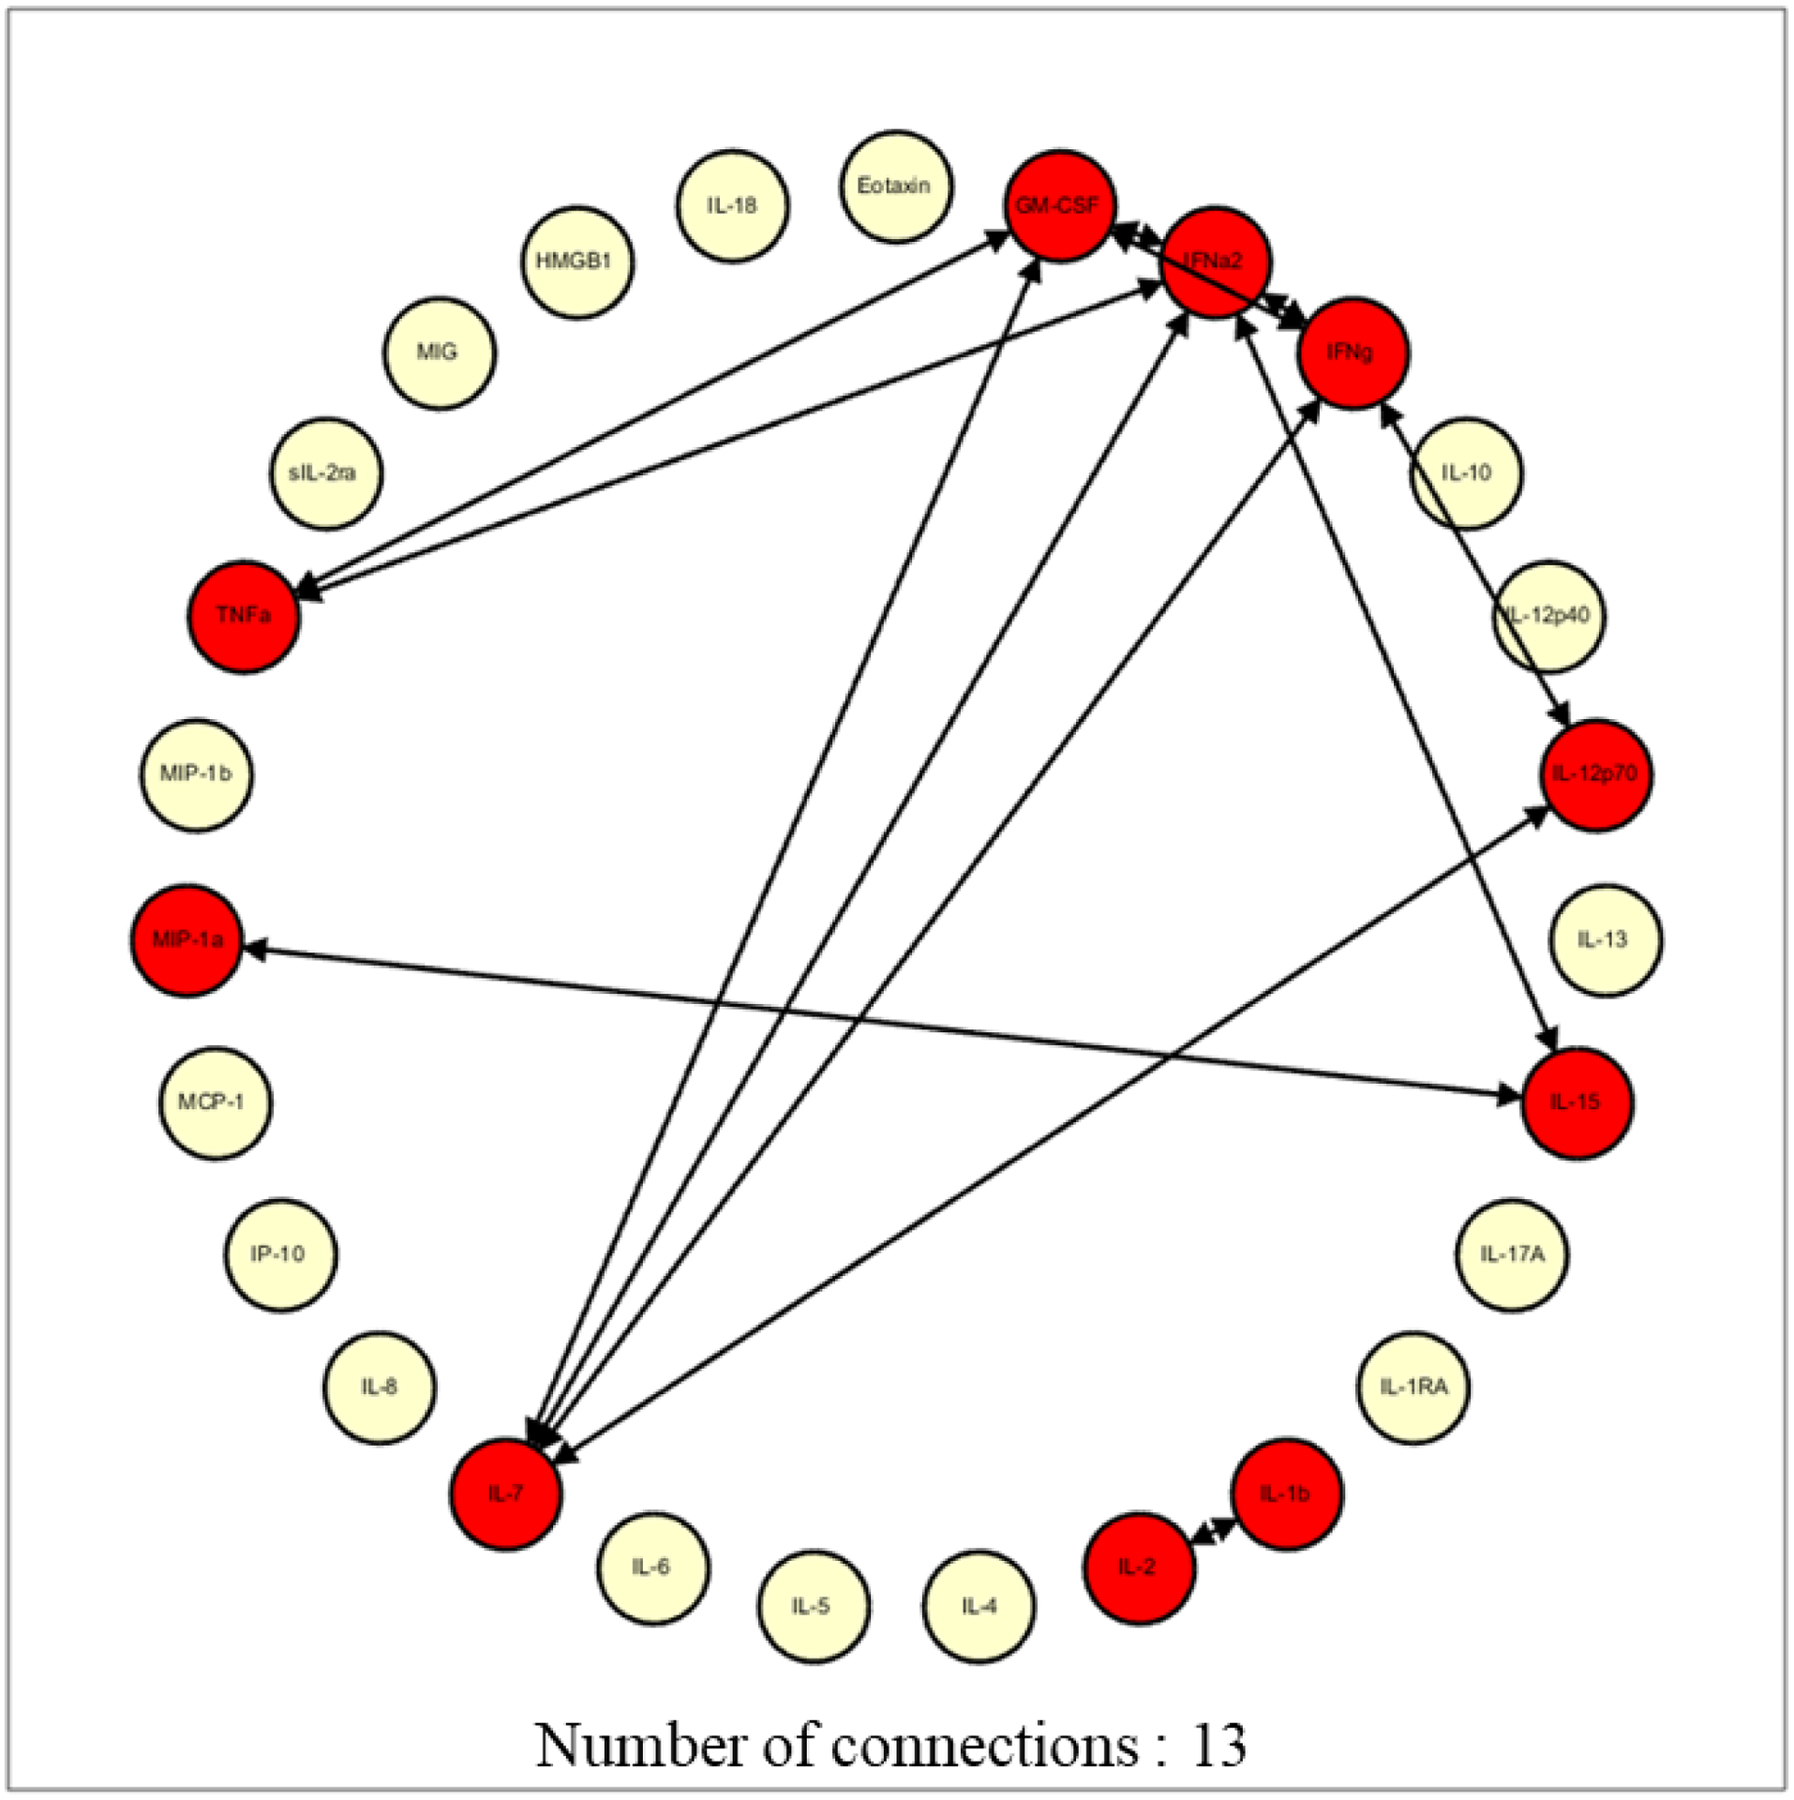
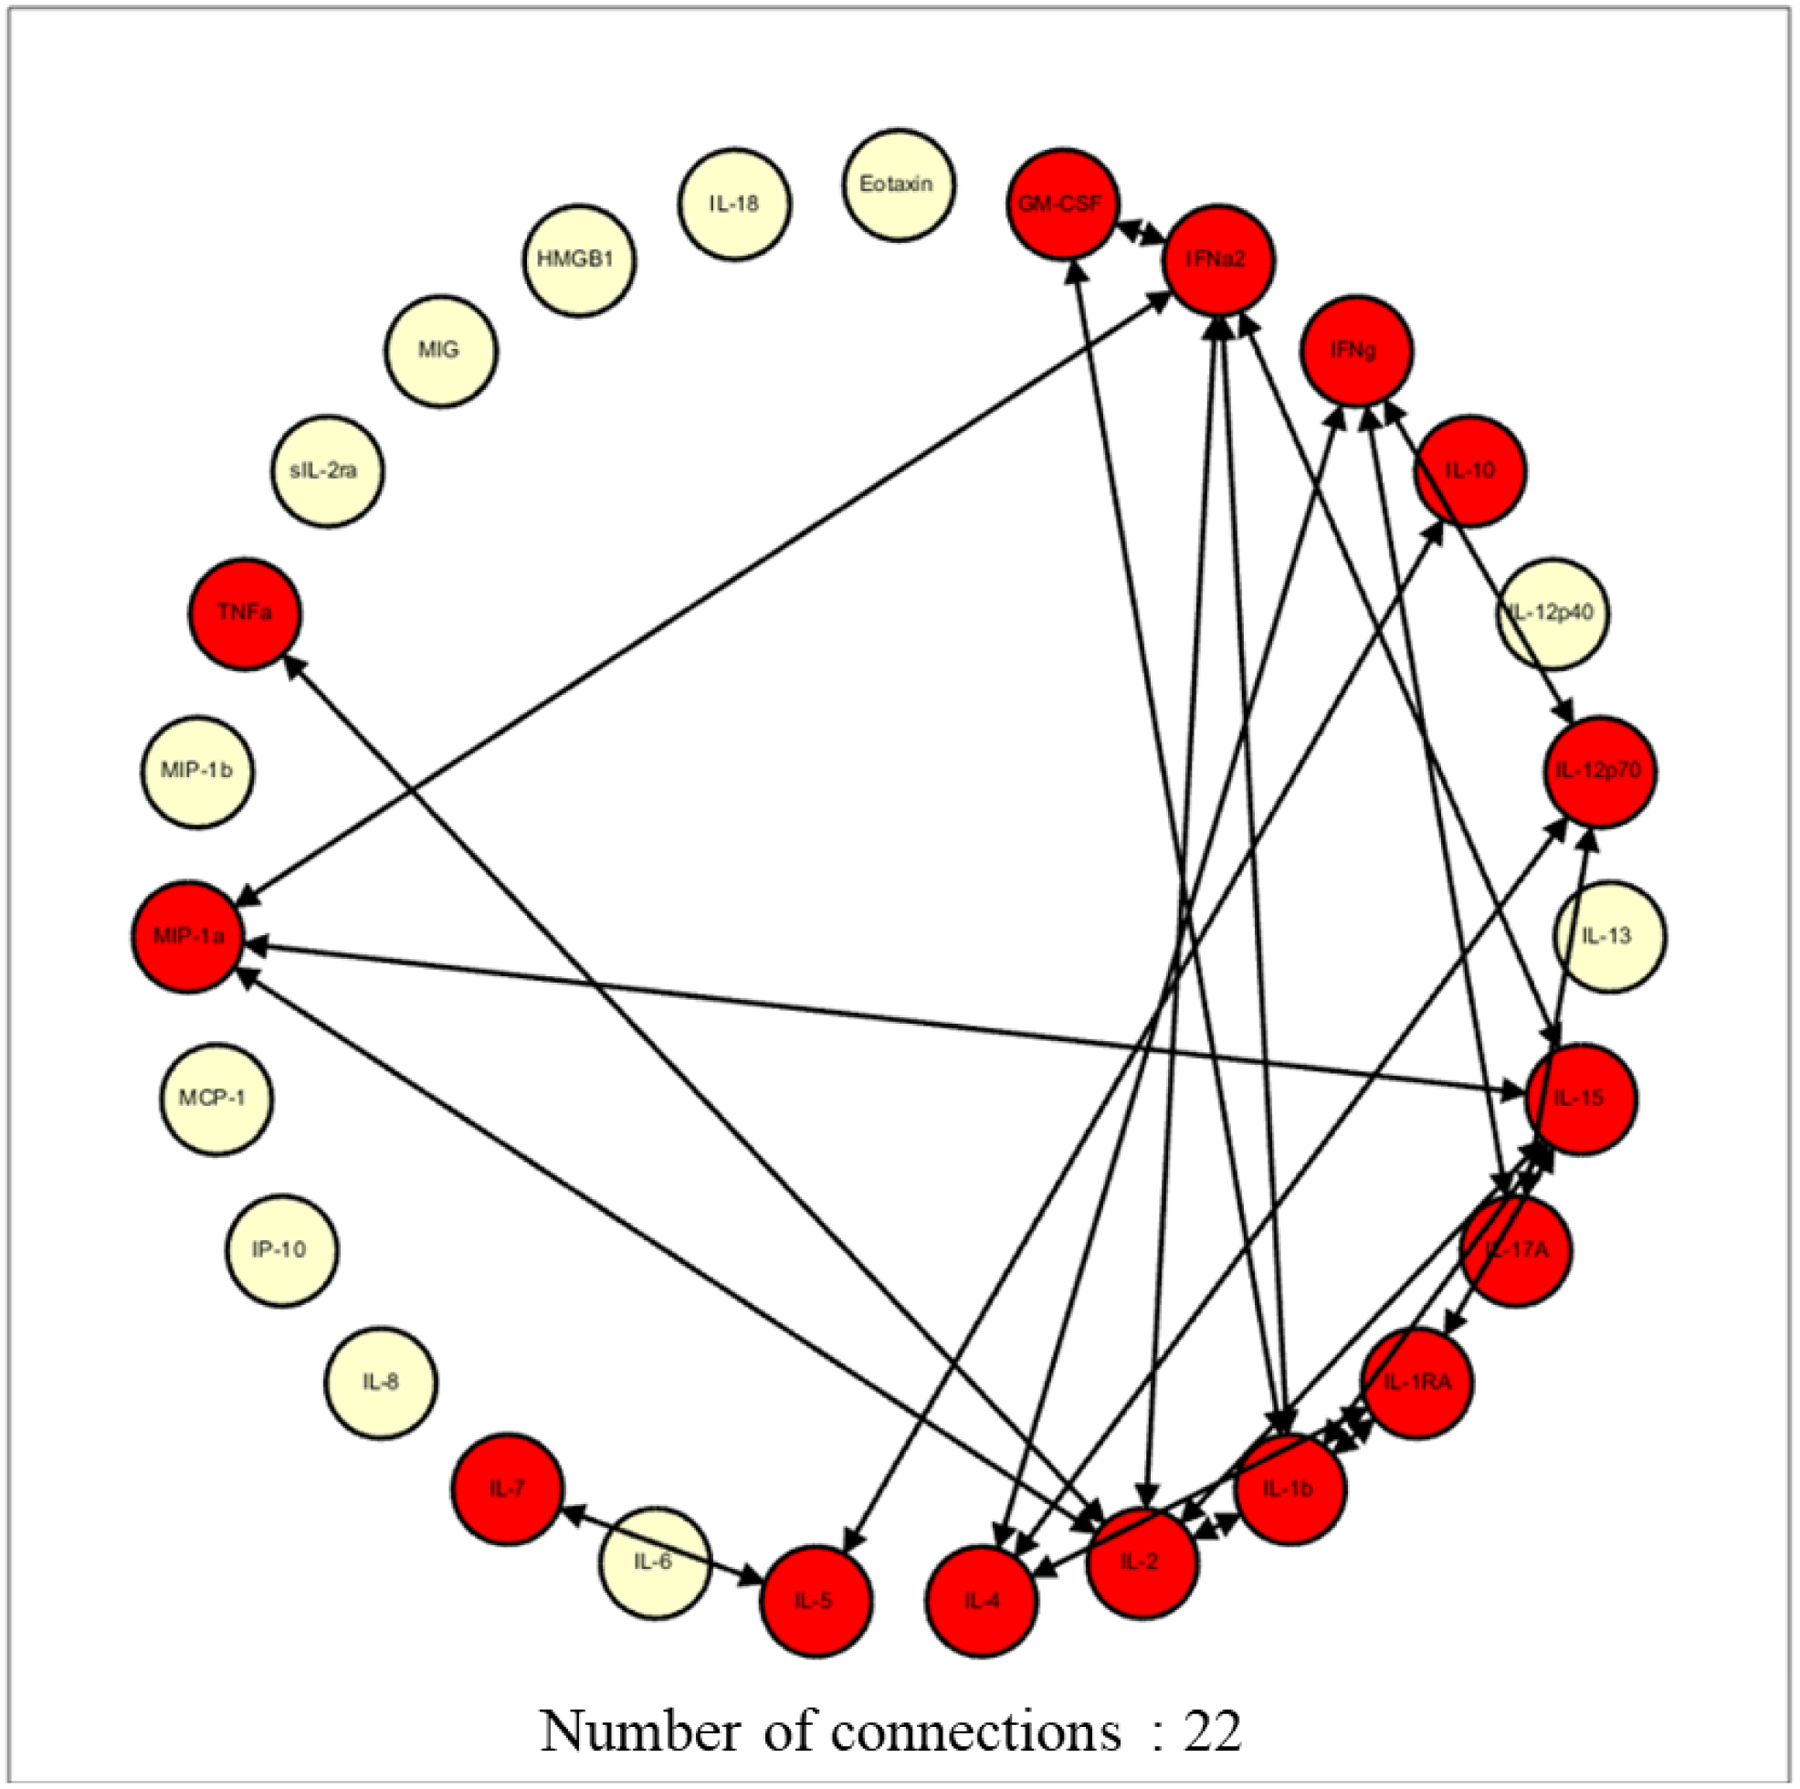
Network complexity at 0.95 stringency for responders (3A) and non-responders (3B). Drawing up the network analysis at the 0.95 stringency (strength of interaction) depicted a higher network complexity in the non-responders, signifying higher baseline inflammation
A Fisher score analysis identified IL-6, IL-12p40, IL-1RA, sIL-2Rα, and IL-13 as the inflammatory mediators which could differentiate between R and NR (Figure 4). Notably, there was significant overlap between the mediators identified using logistic regression and the Fisher score analysis.
Figure 4:
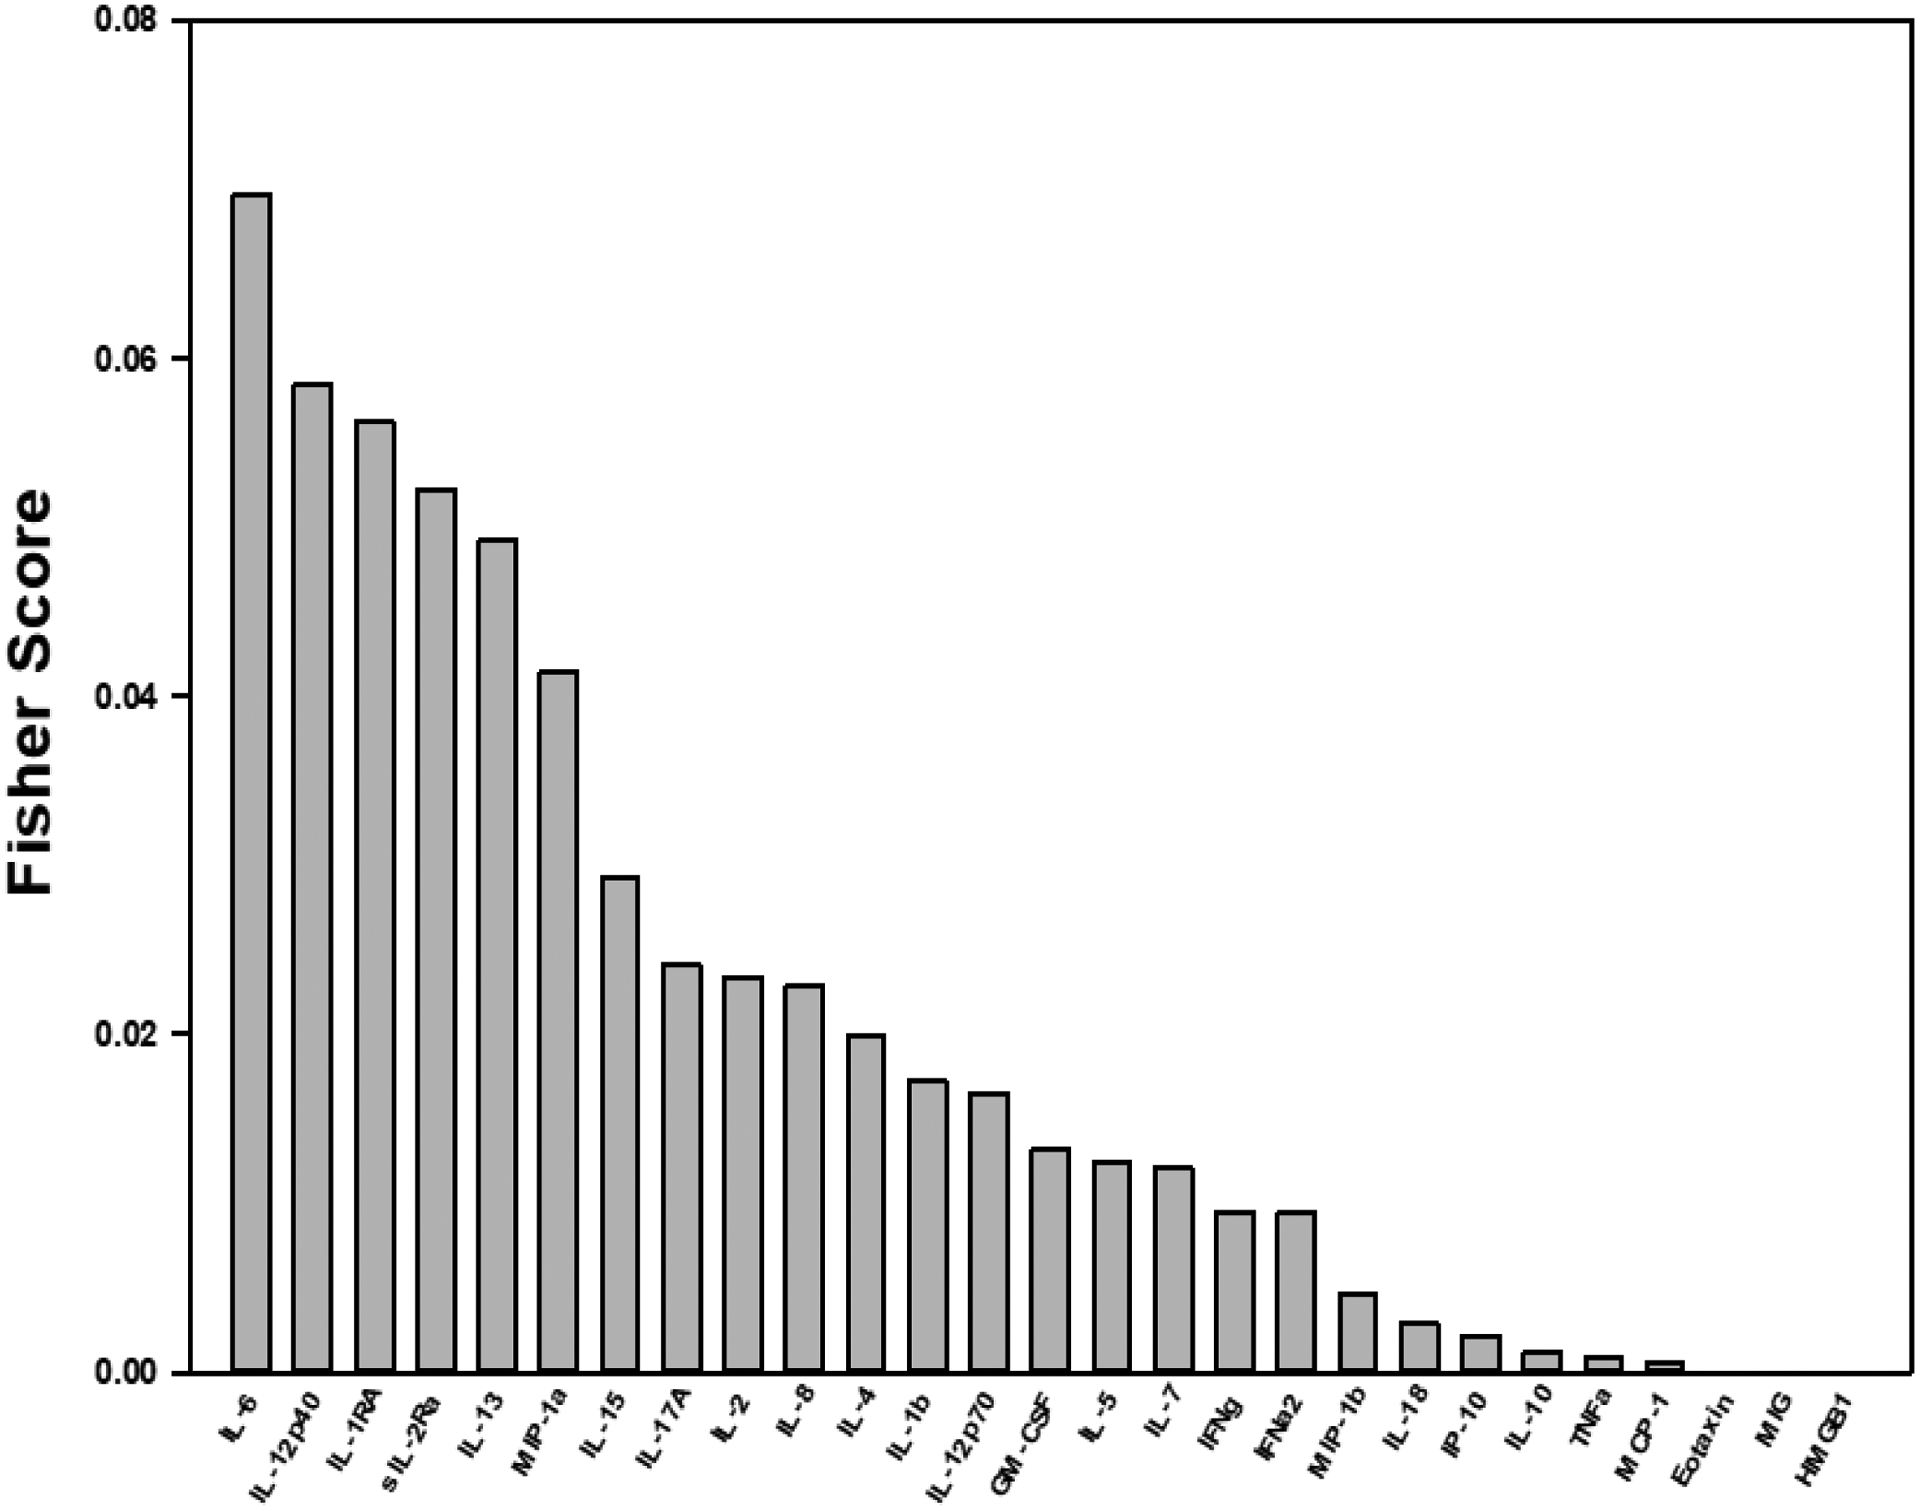
Fisher score analysis of cytokines depicting cytokines with the highest probability of differentiating between non-responders and the responders to NAT
Decision tree analysis to predict response to NAT
Based on the Fisher score and logistic regression analyses, a panel of inflammatory mediators was used to create a decision tree to predict response to NAT (Figure 5). The decision tree grouped sIL-2Rα, IL-12p40, IL-6, and IL-8 in sequential order to predict response to NAT. Using this decision tree, R were identified as patients with a low sIL-2Rα (<718pg/ml) followed by sequential high IL-12p40 (>178pg/ml), high IL-6 (>6.125pg/ml), or low IL-8 (< 5.205pg/ml). This decision tree predicted response to NAT with an accuracy of 92.5%, a sensitivity of 100%, and a specificity of 85%.
Figure 5:
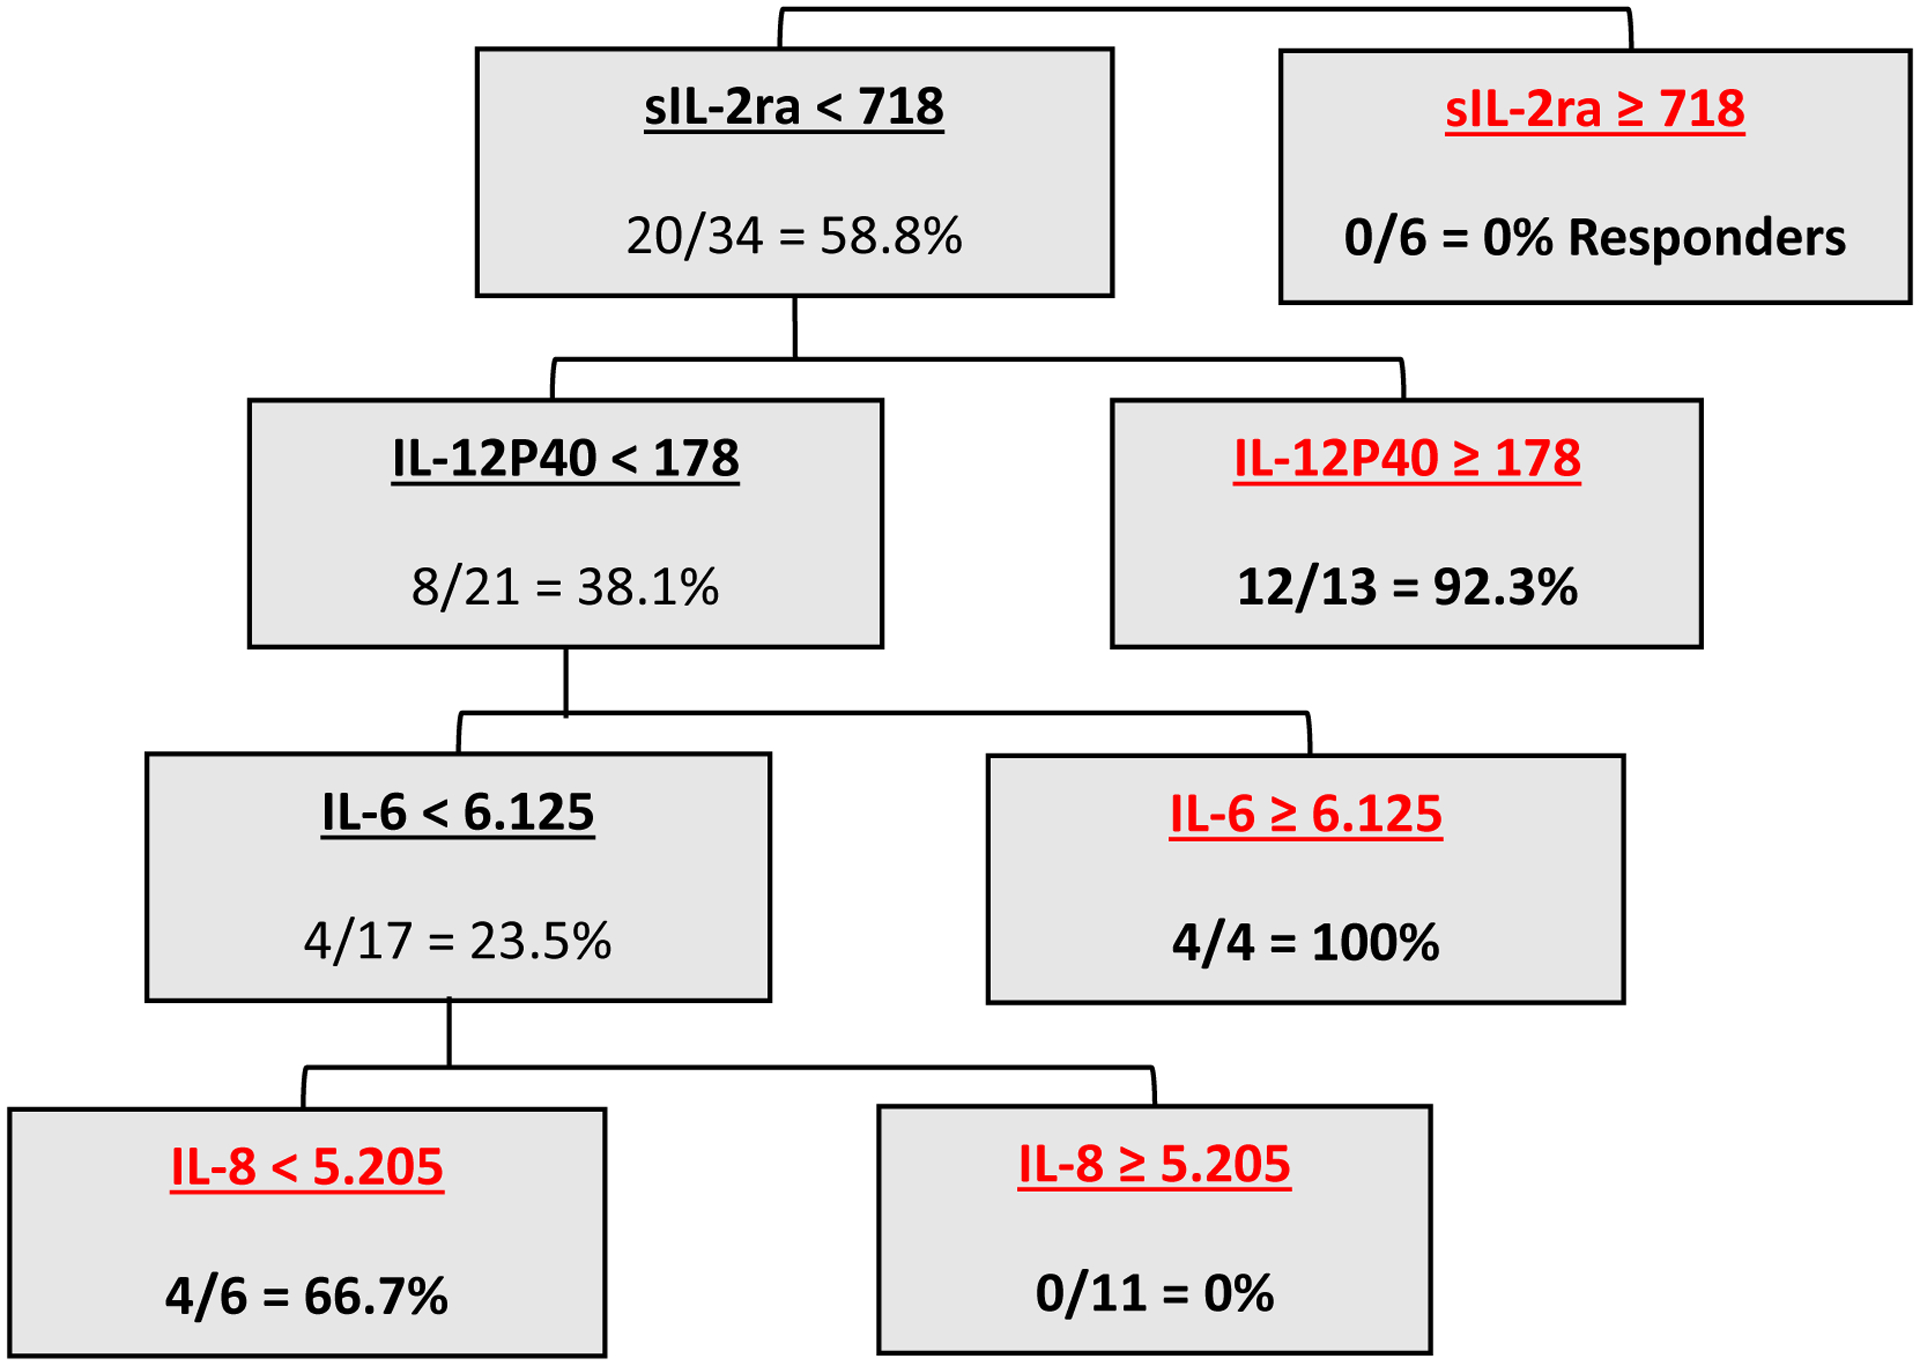
Decision tree analysis using baseline cytokine levels to predict response to NAT.
DISCUSSION
Since PDAC is a systemic disease at diagnosis, it is critical to identify patients with the potential to respond to NAT. Inflammation plays an important role in carcinogenesis, tumor progression, and metastasis. However, inflammatory parameters have not been used to stratify PDAC patients based on their likely responses to NAT. In the present study, correlation analyses of baseline inflammatory profiles demonstrated stark differences between responders and non-responders to NAT, with higher baseline inflammatory network complexity suggestive of an overall elevated inflammatory response in the non-responder group.
NAT is being increasingly utilized for PDAC. Although complete or near complete response to NAT is associated with improved survival, it remains a rare occurrence (3–6% for complete and <20% for near complete response). [4] This may be related to the limited availability of effective regimens, but is also a reflection of the heterogeneity of local and systemic response to NAT. Even with the advent of more effective regimens such as FOLFIRNOX and gemcitabine with nab-paclitaxel in recent years, predicting response to NAT at baseline remains a challenge and biomarkers of response are needed to guide precision-based treatment.
PDAC induces an intense inflammatory response, and higher systemic inflammatory indices are associated with poor prognosis.[10] Additionally, inflammation may blunt the effects of chemotherapy on PDAC. [14,16] PDAC induces local inflammation by cytokine-mediated proliferation of PSCs and fibroblasts. This desmoplastic reaction impedes drug delivery.[11] Thus, a panel of baseline inflammatory mediators may hold promise as predictors of chemotherapy response.
Our study suggests the activation of multiple inflammatory pathways, and increased correlation of inflammatory mediators including IL-1β, IL-1RA, IL-2, IL-4, IL-5, IL-15, IL-10, IL-17A, IL-12p70, and MIP-1α in non-responders to NAT. These observations can be explained by the previously characterized repertoire of those mediators. IL-1β is mainly released by tumor associated macrophages (TAMs) in the TME and plays a role in tumor progression by endothelial cell activation, stimulation of MDSCs and TAMs. [24] IL-1β also activates Th-17 cells, promoting IL-17A production, which aids in tumor progression. [25] Both Th-17 and IL-17A induce the release of pro-inflammatory cytokines and drive the development of MDSCs, dampening tumor-specific immunity, leading to cancer progression. [26] Notably, inhibition of IL-17A improves survival and reduces metastasis in PDAC.[27]
Our analyses support the well-established interaction between IL-1β and IL-1RA. IL-1RA inhibits metastasis by inhibiting angiogenesis.[28] Although speculative, the anti-angiogenic effect of IL-1RA might impede drug delivery to the tumor. However, chimeric, and recombinant IL-1RA improve responses to chemotherapy.[29] In addition, blockade of the IL-1 pathway (other than receptor blockage) can also reduce chemoresistance.[30] Whether any differences lie between the naturally occurring IL-1RA and the recombinant antagonists is unclear.
Non-responders also exhibited higher connections of mediators with IL-2, IL-4, and IL-15, a group of gamma cytokines that share the common IL-2 receptor gamma chain.[31] IL-2 was initially described as a T-cell growth factor and has now been shown to affect B-cell differentiation.[32] High-dose IL-2 is approved to treat melanoma and renal cell carcinoma. However, IL-2 also increases the activity of regulatory T-cells (T-regs) which inhibit the adaptive immune response to cancer.[33] Thus, IL-2 and IL-15 activity could induce higher regulatory T-cell activity (T-reg) and lower the activity of effector T-cells (T-eff) in non-responders.
In contrast, responders to NAT exhibit higher connections among IL-7, IFNγ, TNFα and GM-CSF. IL-7 is a highly potent cytokine promoting CD8+ cell response, inhibiting T-reg cell activity, and enhancing the anti-tumor function of IFNγ.[34,35] IL-7-coupled chimeric antigen receptor T-cell (CAR-T) blunts the immunosuppressive TME and improves outcomes in PDAC.[36] IFNγ, produced by CD8+ T-eff cells delays tumor progression, promotes T-reg cell fragility, and promotes response to therapy.[37] Collectively, increased CD8+ and IFNγ activity is associated with stromal modulation, which may improve drug delivery to cancer cells.[38] TNFα is a pro-inflammatory cytokine released by TAMs. It has a dual effect on PDACs; lower doses promote PDGF (platelet derived growth factor) production and fibrogenesis around tumor cells, causing tumor progression, while high doses show cytotoxic effects on tumor cells.[39] GM-CSF on the other hand greatly enhances the production of TNFα. The association of GM-CSF with TNFα in the R group may suggest a high level of TNFα in the TME, producing a predominantly cytotoxic effect.[40]
Most inflammatory mediators play a dual role in cancer prognosis, being dependent on other inflammatory mediators to determine their predominant function. Thus, rather than a single mediator, an array of inflammatory mediators forming a panel might serve as a better predictor of response to NAT in PDAC. Based on results from logistic regression and Fisher score analysis, we created a decision tree to predict response to NAT using sequential analysis of four inflammatory mediators and their baseline levels: sIL-2Rα, IL-12p40, IL-6 and IL-8. In this decision tree analysis, higher levels of sIL-2Rα (≥718 ng/ml) were a feature of NR patients only. sIL-2Rα is a subunit of the IL-2 receptor which binds IL-2 and enhances production of T-regs, which are responsible for tumor progression.[41] IL-12p40, the next sequential cytokine, was associated with response when elevated. IL-12p40 is a subunit of two heterodimeric cytokines: IL-12 and IL-23. IL-12 inhibits various cancers, while inhibition of IL-23 is suggested to have dose-dependent anti-tumoral activity.[42] In line with our results, 92% of responders had elevated IL-12p40. The next sequential cytokine, IL-6, predicted response when elevated. Interestingly, previous studies suggest IL-6 secretion by peri-tumoral fibroblasts and higher levels to be associated with tumor progression and poor prognosis.[43] However, it is also suggested that IL-6 may induce T-eff cells, inhibiting tumor progression.[44] The final cytokine analyzed, IL-8, is associated with poor prognosis in PDAC and confers resistance to gemcitabine chemotherapy.[45] Concordant with previous work, our decision tree depicts a higher level of IL-8 in non-responders.
Despite these results, our study has several limitations, most important of which is the lack of a validation cohort. The rare occurrence of complete/ near-complete response in PDAC, coupled to a limited sample size and lack of availability of a similar biobank did not allow a validation cohort. A prospective multi-institutional study utilizing a large array of inflammatory mediators assessed longitudinally in the neoadjuvant setting is currently under way to validate these findings. Additionally, in order to detect significant differences in the inflammatory profiles between NR and R, we excluded partial responders, thus our current findings may not be applicable to patients with a modest response to NAT. The panel of cytokines tested was not exhaustive; it is possible that other unmeasured cytokines may be contributing to the chemo-response effect observed. However, the panel we chose to examine is representative of most inflammatory pathways identified. Finally, the impact of tumor infilterating lymphocytes on response to NAT may also be warranted in future propective study, which was not possible in th current study as the previous FNA samples were insufficient for this analysis.
This analysis suggests that the upregulated systemic and local inflammatory response, commonly seen with pancreatic adenocarcinoma may be associated with its poor response to neoadjuvant therapy. Due to their complex, interdependent actions, baseline inflammatory mediators arranged in a panel may be able to predict the response to NAT, prior to initiation of treatment. Further insight into the role of inflammatory mediators and inflammatory cells, in predicting and modifying chemotherapy response in pancreatic cancer is warranted.
Supplementary Material
Supplementary Table 1: Plasma cytokine levels in responders and non-responders. Logistic regression analysis shown with each cytokine as a sole predictor of response to NAT.
Acknowledgements:
The authors acknowledge the Emma Clyde Hodge Memorial Fund for their generous support of this work.
Funding:
This study was funded by the Emma Clyde Hodge Memorial Fund, and the National Cancer Institute, under Grant numbers U01 CA200466 and U01 CA152653
Footnotes
Conflicts of Interest: Yoram Vodovotz; co-founder and stakeholder in Immunetrics. Inc
REFERENCES
- 1.Howlader N, Noone AM, Krapcho M, et al. (eds). SEER Cancer Statistics Review, 1975–2016, National Cancer Institute. Bethesda, MD, https://seer.cancer.gov/csr/1975_2016/, based on November 2018 SEER data submission, posted to the SEER web site, April 2019. [Google Scholar]
- 2.Schorn S, Demir IE, Reyes CM et al. The impact of neoadjuvant therapy on the histopathological features of pancreatic ductal adenocarcinoma - A systematic review and meta-analysis. Cancer Treat Rev. 2017. April;55:96–106. doi: 10.1016/j.ctrv.2017.03.003. [DOI] [PubMed] [Google Scholar]
- 3.Zhan HX, Xu JW, Wu D et al. Neoadjuvant therapy in pancreatic cancer: a systematic review and meta-analysis of prospective studies. Cancer Med. 2017. June;6(6):1201–1219. doi: 10.1002/cam4.1071 [DOI] [PMC free article] [PubMed] [Google Scholar]
- 4.Macedo FI, Ryon E, Maithel SK et al. Survival Outcomes Associated With Clinical and Pathological Response Following Neoadjuvant FOLFIRINOX or Gemcitabine/Nab-Paclitaxel Chemotherapy in Resected Pancreatic Cancer. Ann Surg. 2019. September;270(3):400–413. doi: 10.1097/SLA.0000000000003468. [DOI] [PMC free article] [PubMed] [Google Scholar]
- 5.Bernard V, Kim DU, San Lucas FA et al. Circulating Nucleic Acids Are Associated With Outcomes of Patients With Pancreatic Cancer. Gastroenterology. 2019. January;156(1):108–118.e4. doi: 10.1053/j.gastro.2018.09.022. [DOI] [PMC free article] [PubMed] [Google Scholar]
- 6.Al Abbas AI, Zenati M, Reiser CJ et al. Serum CA19–9 Response to Neoadjuvant Therapy Predicts Tumor Size Reduction and Survival in Pancreatic Adenocarcinoma. Ann Surg Oncol. 2020. January 2. doi: 10.1245/s10434-019-08156-3. [DOI] [PMC free article] [PubMed] [Google Scholar]
- 7.Swidnicka-Siergiejko AK, Gomez-Chou SB, SCruz-Monserrate et al. Chronic inflammation initiates multiple forms of K-Ras-independent mouse pancreatic cancer in the absence of TP53. Oncogene. 2017. June 1;36(22):3149–3158. doi: 10.1038/onc.2016.461. [DOI] [PMC free article] [PubMed] [Google Scholar]
- 8.Ahn KS, Hwang JY, Han HS, Kim ST, Hwang I, Chun YO. The impact of acute inflammation on progression and metastasis in pancreatic cancer animal model. Surg Oncol. 2018. March;27(1):61–69. doi: 10.1016/j.suronc.2017.11.008. [DOI] [PubMed] [Google Scholar]
- 9.Mantovani A, Allavena P, Sica A, Balkwill F. Cancer-related inflammation. Nature. 2008. July 24;454(7203):436–44. doi: 10.1038/nature07205. [DOI] [PubMed] [Google Scholar]
- 10.Murthy P, Zenati MS, Al Abbas AI et al. Prognostic Value of the Systemic Immune-Inflammation Index (SII) After Neoadjuvant Therapy for Patients with Resected Pancreatic Cancer. Ann Surg Oncol. 2019. December 2. doi: 10.1245/s10434-019-08094-0. [DOI] [PMC free article] [PubMed] [Google Scholar]
- 11.Nielsen MF, Mortensen MB, Detlefsen S. Key players in pancreatic cancer-stroma interaction: Cancer-associated fibroblasts, endothelial and inflammatory cells. World J Gastroenterol. 2016. March 7;22(9):2678–700. doi: 10.3748/wjg.v22.i9.2678. [DOI] [PMC free article] [PubMed] [Google Scholar]
- 12.Hamada S, Masamune A, Shimosegawa T. Inflammation and pancreatic cancer: disease promoter and new therapeutic target. J Gastroenterol. 2014. April;49(4):605–17. doi: 10.1007/s00535-013-0915-x. [DOI] [PubMed] [Google Scholar]
- 13.Dallal RM, Christakos P, Lee K, Egawa S, Son YI, Lotze MT. Paucity of dendritic cells in pancreatic cancer. Surgery. 2002. February;131(2):135–8. [DOI] [PubMed] [Google Scholar]
- 14.Olson P, Hanahan D. Cancer. Breaching the cancer fortress. Science. 2009. June 12;324(5933):1400–1. doi: 10.1126/science.1175940. [DOI] [PubMed] [Google Scholar]
- 15.Usul Afsar Ç, Karabulut M, Karabulut S et al. Circulating interleukin-18 (IL-18) is a predictor of response to gemcitabine based chemotherapy in patients with pancreatic adenocarcinoma. J Infect Chemother. 2017. April;23(4):196–200. doi: 10.1016/j.jiac.2016.12.003. [DOI] [PubMed] [Google Scholar]
- 16.Shi Y, Gao W, Lytle NK et al. Targeting LIF-mediated paracrine interaction for pancreatic cancer therapy and monitoring. Nature. 2019. May;569(7754):131–135. doi: 10.1038/s41586-019-1130-6. [DOI] [PMC free article] [PubMed] [Google Scholar]
- 17.Kakar S, Shi C, Adsay V et al. Protocol for the Examination of Specimens From Patients With Carcinoma of the Pancreas, [Internet], version Pancreas Exocrine 4.0.0.1. CAP, 2017. https://documents.cap.org/protocols/cp-gihepatobiliary-pancreas-exocrine17protocol4001.pdf. [Google Scholar]
- 18.Evans DB, Rich TA, Byrd DR et al. Preoperative chemoradiation and pancreaticoduodenectomy for adenocarcinoma of the pancreas. Arch Surg. 1992. November;127(11):1335–9. [DOI] [PubMed] [Google Scholar]
- 19.Hu B, Yang XR, Xu Y et al. Systemic immune-inflammation index predicts prognosis of patients after curative resection for hepatocellular carcinoma. Clin Cancer Res. 2014. December 1;20(23):6212–22. doi: 10.1158/1078-0432.CCR-14-0442. [DOI] [PubMed] [Google Scholar]
- 20.Li J, Cheng K, Wang S, Morstatter F, Trevino RP, Tang J, Liu H, Feature Selection. ACM Computing Surveys 50, 1–45 (2017). [Google Scholar]
- 21.Vodovotz Y, Simmons RL, Gandhi CR et al. “Thinking” vs. “Talking”: Differential Autocrine Inflammatory Networks in Isolated Primary Hepatic Stellate Cells and Hepatocytes under Hypoxic Stress. Front Physiol. 2017. December 22;8:1104. doi: 10.3389/fphys.2017.01104. [DOI] [PMC free article] [PubMed] [Google Scholar]
- 22.Sachdev U, Vodovotz L, Bitner J et al. Suppressed networks of inflammatory mediators characterize chronic venous insufficiency. J Vasc Surg Venous Lymphat Disord. 2018. May;6(3):358–366. doi: 10.1016/j.jvsv.2017.11.009. [DOI] [PubMed] [Google Scholar]
- 23.Zamora R, Vodovotz Y, Mi Q et al. Data-Driven Modeling for Precision Medicine in Pediatric Acute Liver Failure. Mol Med. 2017. January;22:821–829. doi: 10.2119/molmed.2016.00183. [DOI] [PMC free article] [PubMed] [Google Scholar]
- 24.Mantovani A, Marchesi F, Malesci A, Laghi L, Allavena P. Tumour-associated macrophages as treatment targets in oncology. Nat Rev Clin Oncol. 2017. July;14(7):399–416. doi: 10.1038/nrclinonc.2016.217. [DOI] [PMC free article] [PubMed] [Google Scholar]
- 25.Mantovani A, Barajon I, Garlanda C. IL-1 and IL-1 regulatory pathways in cancer progression and therapy. Immunol Rev. 2018. January;281(1):57–61. doi: 10.1111/imr.12614. [DOI] [PMC free article] [PubMed] [Google Scholar]
- 26.Yazawa T, Shibata M, Gonda K et al. Increased IL-17 production correlates with immunosuppression involving myeloid-derived suppressor cells and nutritional impairment in patients with various gastrointestinal cancers. Mol Clin Oncol. 2013. July;1(4):675–679. [DOI] [PMC free article] [PubMed] [Google Scholar]
- 27.Wu HH, Hwang-Verslues WW, Lee WH et al. Targeting IL-17B-IL-17RB signaling with an anti-IL-17RB antibody blocks pancreatic cancer metastasis by silencing multiple chemokines. J Exp Med. 2015. March 9;212(3):333–49. doi: 10.1084/jem.20141702. [DOI] [PMC free article] [PubMed] [Google Scholar]
- 28.Gong Z, Ma J, Su H et al. Interleukin-1 receptor antagonist inhibits angiogenesis in gastric cancer. Int J Clin Oncol. 2018. August;23(4):659–670. doi: 10.1007/s10147-018-1242-2. [DOI] [PMC free article] [PubMed] [Google Scholar]
- 29.Zhuang Z, Ju HQ, Aguilar M et al. IL1 Receptor Antagonist Inhibits Pancreatic Cancer Growth by Abrogating NF-κB Activation. Clin Cancer Res. 2016. March 15;22(6):1432–44. doi: 10.1158/1078-0432.CCR-14-3382. [DOI] [PMC free article] [PubMed] [Google Scholar]
- 30.Zhang D, Li L, Jiang H et al. Tumor-Stroma IL1β-IRAK4 Feedforward Circuitry Drives Tumor Fibrosis, Chemoresistance, and Poor Prognosis in Pancreatic Cancer. Cancer Res. 2018. April 1;78(7):1700–1712. doi: 10.1158/0008-5472.CAN-17-1366. [DOI] [PMC free article] [PubMed] [Google Scholar]
- 31.Liao W, Lin JX, Leonard WJ. IL-2 family cytokines: new insights into the complex roles of IL-2 as a broad regulator of T helper cell differentiation. Curr Opin Immunol. 2011. October;23(5):598–604. doi: 10.1016/j.coi.2011.08.003. [DOI] [PMC free article] [PubMed] [Google Scholar]
- 32.Berglund LJ, Avery DT, Ma CS et al. IL-21 signalling via STAT3 primes human naive B cells to respond to IL-2 to enhance their differentiation into plasmablasts. Blood. 2013. December 5;122(24):3940–50. doi: 10.1182/blood-2013-06-506865. [DOI] [PMC free article] [PubMed] [Google Scholar]
- 33.Vang KB, Yang J, Mahmud SA, Burchill MA, Vegoe AL, Farrar MA. IL-2, −7, and −15, but not thymic stromal lymphopoeitin, redundantly govern CD4+Foxp3+ regulatory T cell development. J Immunol. 2008. September 1;181(5):3285–90. [DOI] [PMC free article] [PubMed] [Google Scholar]
- 34.Heninger AK, Theil A, Wilhelm C et al. IL-7 abrogates suppressive activity of human CD4+CD25+FOXP3+ regulatory T cells and allows expansion of alloreactive and autoreactive T cells. J Immunol. 2012. December 15;189(12):5649–58. doi: 10.4049/jimmunol.1201286. [DOI] [PubMed] [Google Scholar]
- 35.Shi LZ, Fu T, Guan B et al. Interdependent IL-7 and IFN-γ signalling in T-cell controls tumour eradication by combined α-CTLA-4+α-PD-1 therapy. Nat Commun. 2016. August 8;7:12335. doi: 10.1038/ncomms12335. [DOI] [PMC free article] [PubMed] [Google Scholar]
- 36.Mohammed S, Sukumaran S, Bajgain P et al. Improving Chimeric Antigen Receptor-Modified T Cell Function by Reversing the Immunosuppressive Tumor Microenvironment of Pancreatic Cancer. Mol Ther. 2017. January 4;25(1):249–258. doi: 10.1016/j.ymthe.2016.10.016. [DOI] [PMC free article] [PubMed] [Google Scholar]
- 37.Zhang M, Ding G, Zhou L et al. Interferon Gamma Inhibits CXCL8-Induced Proliferation and Migration of Pancreatic Cancer BxPC-3 Cell Line via a RhoGDI2/Rac1/NF-κB Signaling Pathway. J Interferon Cytokine Res. 2018. September;38(9):413–422. doi: 10.1089/jir.2018.0070. [DOI] [PubMed] [Google Scholar]
- 38.Zhao J, Xiao Z, Li T et al. Stromal Modulation Reverses Primary Resistance to Immune Checkpoint Blockade in Pancreatic Cancer. ACS Nano. 2018. October 23;12(10):9881–9893. doi: 10.1021/acsnano.8b02481. [DOI] [PMC free article] [PubMed] [Google Scholar]
- 39.Farajzadeh Valilou S, Keshavarz-Fathi M, Silvestris N, Argentiero A, Rezaei N. The role of inflammatory cytokines and tumor associated macrophages (TAMs) in microenvironment of pancreatic cancer. Cytokine Growth Factor Rev. 2018. February;39:46–61. doi: 10.1016/j.cytogfr.2018.01.007. [DOI] [PubMed] [Google Scholar]
- 40.Helm O, Held-Feindt J, Grage-Griebenow E et al. Tumor-associated macrophages exhibit pro- and anti-inflammatory properties by which they impact on pancreatic tumorigenesis. Int J Cancer. 2014. August 15;135(4):843–61. doi: 10.1002/ijc.28736. [DOI] [PubMed] [Google Scholar]
- 41.Price-Troska T, Yang ZZ, Diller D et al. Inhibiting IL-2 signaling and the regulatory T-cell pathway using computationally designed peptides. Invest New Drugs. 2019. February;37(1):9–16. doi: 10.1007/s10637-018-0606-9. [DOI] [PubMed] [Google Scholar]
- 42.Croxford AL, Kulig P, Becher B. IL-12-and IL-23 in health and disease. Cytokine Growth Factor Rev. 2014. August;25(4):415–21. doi: 10.1016/j.cytogfr.2014.07.017. [DOI] [PubMed] [Google Scholar]
- 43.Pop VV, Seicean A, Lupan I, Samasca G, Burz CC. IL-6 roles - Molecular pathway and clinical implication in pancreatic cancer - A systemic review. Immunol Lett. 2017. January;181:45–50. doi: 10.1016/j.imlet.2016.11.010. [DOI] [PubMed] [Google Scholar]
- 44.St Paul M, Saibil SD, Lien SC et al. IL6 Induces an IL22+ CD8+ T-cell Subset with Potent Antitumor Function. Cancer Immunol Res. 2020. March;8(3):321–333. doi: 10.1158/2326-6066.CIR-19-0521. [DOI] [PubMed] [Google Scholar]
- 45.Imafuji H, Matsuo Y, Ueda G et al. Acquisition of gemcitabine resistance enhances angiogenesis via upregulation of IL8 production in pancreatic cancer. Oncol Rep. 2019. June;41(6):3508–3516. doi: 10.3892/or.2019.7105. [DOI] [PubMed] [Google Scholar]
Associated Data
This section collects any data citations, data availability statements, or supplementary materials included in this article.
Supplementary Materials
Supplementary Table 1: Plasma cytokine levels in responders and non-responders. Logistic regression analysis shown with each cytokine as a sole predictor of response to NAT.