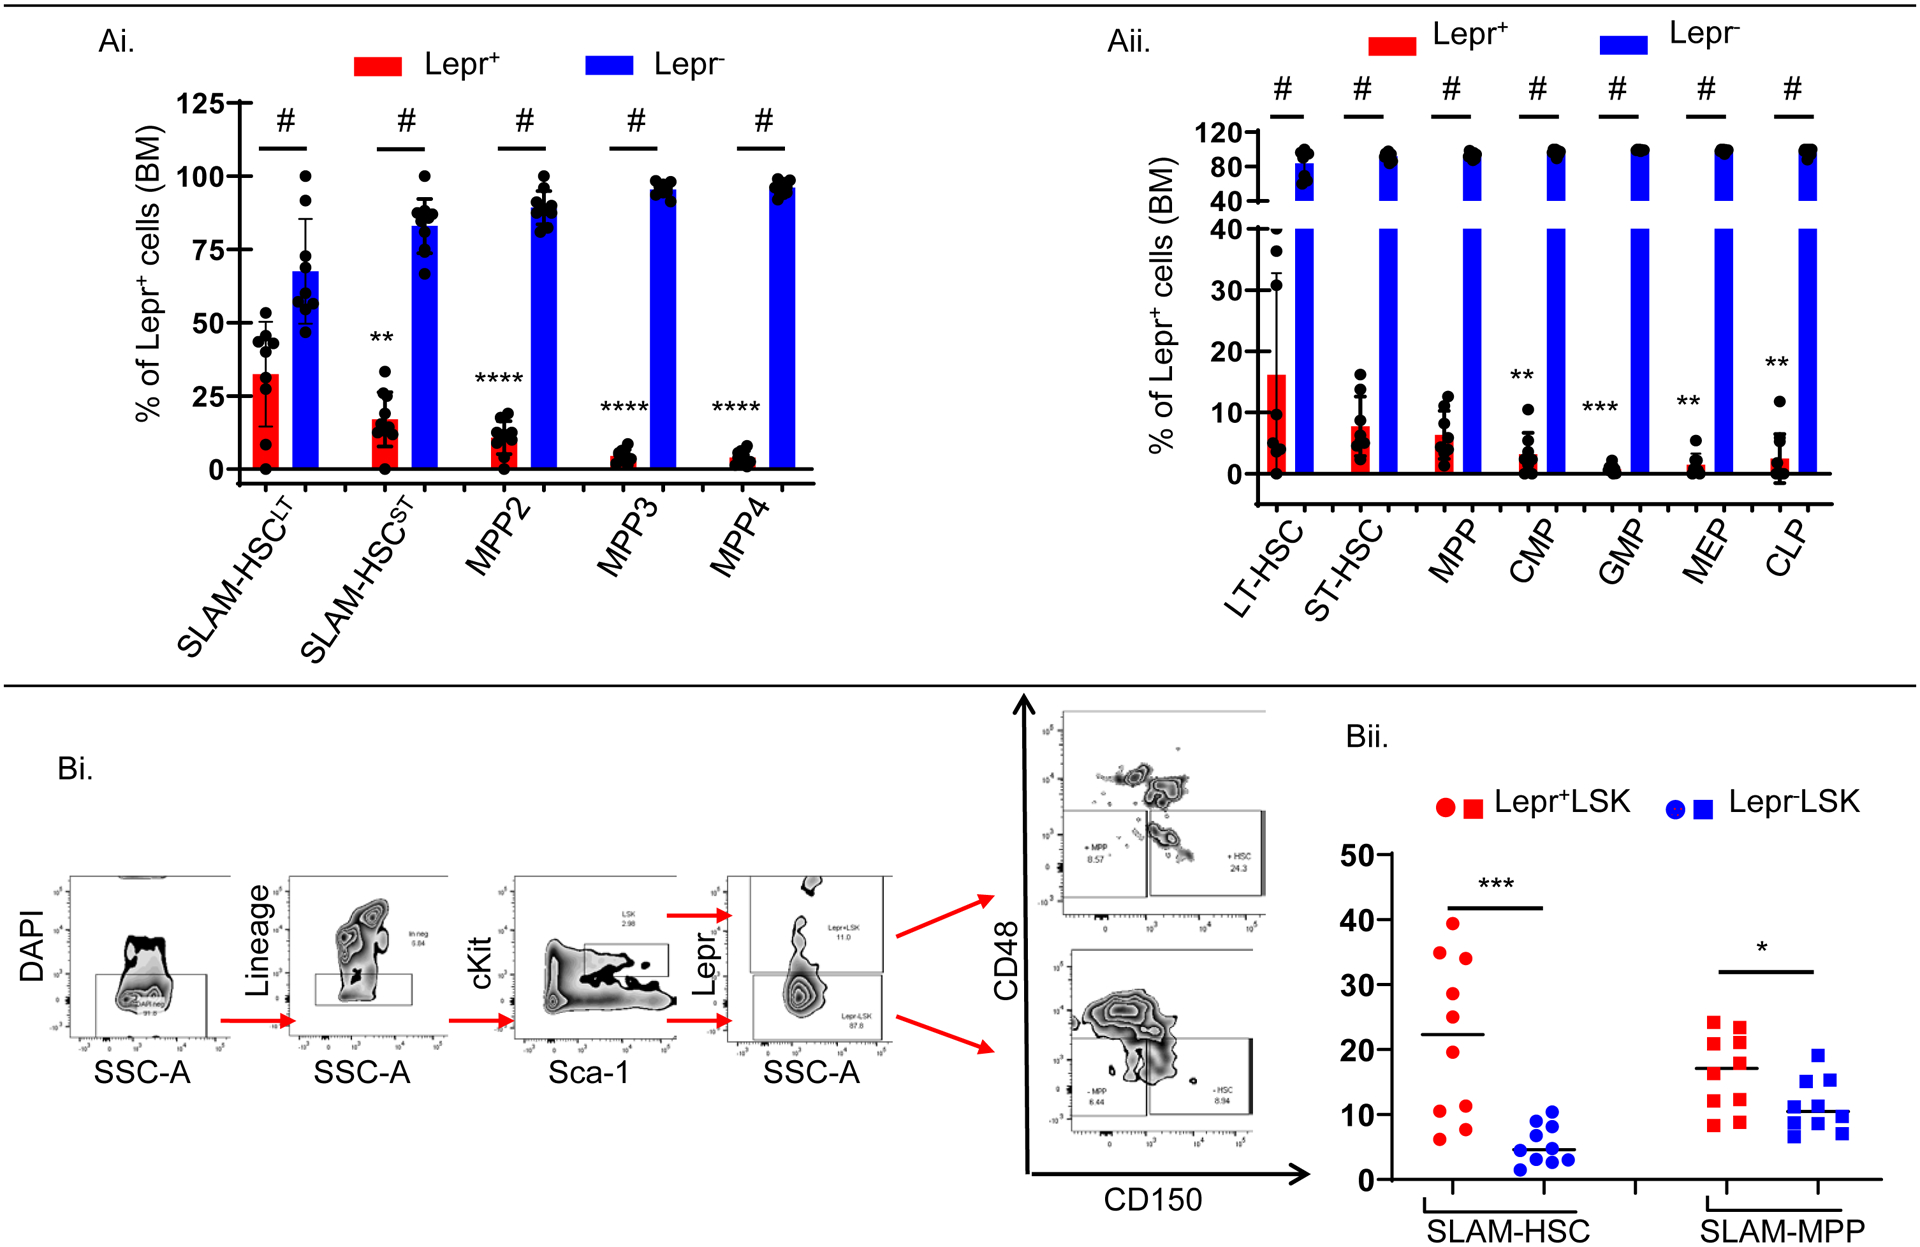
Figure 1_. Lepr+ LSK cells are significantly enriched for phenotypically-defined HSCs, but Lepr+HSCs represent a minor subset out of the total HSC population.

FACS analyses of freshly isolated BM cells from young adult C57BL/6J mice (n=8–10).
(Ai). Percentages of Lepr+ versus Lepr− cells within each population (SLAM-HSCLT, SLAM-HSCST, MPP2, MPP3, MPP4).
(Aii). Percentages of Lepr+ versus Lepr− cells within each population (LT-HSC, ST-HSC, MPP, CMP, GMP, MEP, CLP).
(Bi). Representative gating strategy to determine fractions of SLAM-HSC (LSKCD48−CD150+) and SLAM-MPP (LSKCD48−CD150−) within each population (Lepr+LSK vs. Lepr−LSK).
(Bii). Fractions of SLAM-HSC and SLAM-MPP cells within each population (Lepr+LSK vs. Lepr−LSK).
All data are mean ±SD. # p<0.0001 using Mann-Whitney test comparing Lepr+ versus Lepr− cells within each population in (Ai) and (Aii), * p<0.05, ** p<0.01, *** p<0.001, **** p<0.0001 using Ordinary One-way ANOVA followed with post-hoc Tukey’s multiple comparison test to compare fractions of Lepr+ among different populations to SLAM-HSCLT in (Ai) or LT-HSC in (Aii) or using Mann-Whitney test to compare fractions of SLAM-HSC, SLAM-MPP in (Bii) out of Lepr+ LSK vs. Lepr− LSK cells. N = 2.
