
FIGURE 4.
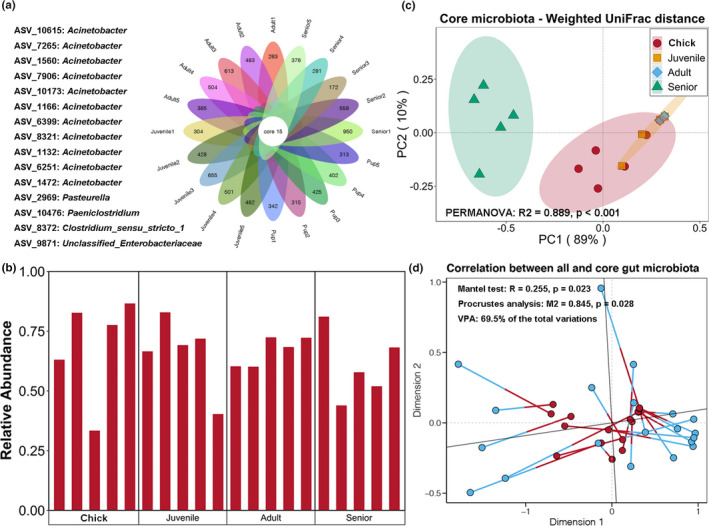
(a) Core ASV shared in all samples. (b) Relative abundance of core microbiota among all samples. (c) Principal coordinate analysis (PCoA) and PERMANOVA test of core microbiota in P. antarctica of different ages based on weighted UniFrac distance. (d) Mantel test, Procrustes analysis, and variation partitioning analysis revealed correlation and contribution of core microbiota to overall variations in gut microbiota