

Abstract
Histology refers to the study of the morphology of cells within their natural tissue environment. As a bio-medical discipline, it dates back to the development of first microscopes which allowed to override the physical visual limitation of the human eye. Since the first observations, it was understood that cell shape predicts function and, therefore, shape alterations can identify and explain dysfunction and diseases. The advancements in morphological investigation techniques have allowed to extend our understanding of the shape-function relationships close to the molecular level of organization of tissues, as well as to derive reliable data not only from fixed, and hence static, biological samples but also living cells and tissues and even for extended time periods. These modern approaches, which encompass quantitative microscopy, precision microscopy and dynamic microscopy, represent the new frontier of morphology. This article summarizes how the microscopy techniques have evolved to properly face the challenges of biomedical sciences, thus transforming Histology from a merely qualitative discipline, which played an ancillary role to traditional ‘major’ sciences such as Anatomy, to a modern experimental science capable of driving knowledge progress in Biology and Medicine.
Keywords: digital imaging, quantitative microscopy, precision microscopy, dynamic microscopy
Graphical Abstract
Introduction
Histology refers to the study of the morphology of the cells in multicellular organisms within their natural environment, the tissues, which constitute organs and apparatuses of the body. Histology as a scientific discipline dates back to the development of first microscopes, which allowed to override the physical visual limitation of the human eye, the so-called resolution limit, and observe the cellular architecture of the tissues for the first time. This was a major step of biological sciences, comparable to the almost contemporary Copernican revolution in planetary astronomy: Indeed, it marks the starting point of a plethora of studies on the morphology of cells and tissues, which in turn led to understand that shape predicts function and, therefore, shape alterations can identify and explain dysfunction and diseases, opening the path to Histopathology. The advancements in morphological investigation techniques have allowed to extend our understanding of the shape-function relationships close to the molecular level of organization of organisms, as well as to generate reliable data not only from fixed, and hence static, biological samples but also from living cells and tissues, and even for extended time periods. Nowadays, these techniques, also called precision microscopy and dynamic microscopy, represent the new frontier of morphology.
This article aims at discussing how morphological techniques have evolved under the stimulus of emerging experimental needs, thus transforming Histology from a merely qualitative discipline playing an ancillary role to traditional ‘noble’ or ‘major’ sciences, such as Anatomy, to a modern experimental science capable of driving the scientific progress in Biology and Medicine. This fascinating transformation has made the evolved histological methods and knowledge indispensable not only to answer classical biomedical questions but also to develop new therapeutic strategies such as stem cell-based regenerative approaches and patient-specific therapy.
Historical notes on the development of image detection systems
The technical innovations in the manufacture of glass that took place in 1500-1600, exemplified by the crafting of the magnificent windows adorning churches in that period, were then prosaically translated into the development of increasingly cheaper graduated lenses to correct visual defects. The relatively low cost and easy availability of these lenses, along with the increased knowledge in optical physics, inspired scientists to build rudimentary albeit effective optical instruments to observe the very far and the very close: respectively, the Galileo Galilei's telescope and the Antoni van Leeuwenhoek's microscope. Figure 1. Of note, van Leeuwenhoek (1632-1723) described in a letter to the Academy of Sciences founded by King Charles II of England (the collection of correspondence of international scholars with this academy during the reign of Charles II will give rise to the Nature journal) his first microscopical observations of bacteria in the dental plaque, spermatozoa and erythrocytes moving in a drop of sperm and blood, respectively. These pioneer observations can be regarded as the onset of Microbiology and Histology.
Figure 1.

Portraits and photographs of some of the protagonists of the development of histology. Right panel: frontispiece of the book by the German anatomist August Franz Josef Karl Mayer, in which the name Histologie was first used to refer to tissues of the human body.
As stated before, most cells are colorless and nearly translucent under natural conditions, thus requiring to be stained for microscopic observation. The enormous development of dyestuff chemistry for the textile industry that occurred between 1600 and 1800 led to the invention of synthetic dyes: on one hand, this favoured the artistic revolution of the Impressionists, who were able to paint in open air, directly inspired by the scenes that they observed; on the other hand, it offered to scientists powerful tools to stain histological samples, and to develop and validate new tissue staining methods. In this field, it is worth mentioning the contribution of the renowned Italian scientist Marcello Malpighi (1628-1694) (Figure 1). Since that era, numerous techniques for tissue fixation, inclusion in inert materials (waxes, resins) to facilitate specimen sectioning and staining were set-up, posing the basis for modern Histology (Figure 2). However, it was in the 19th Century that Histology gained momentum, owing to the rapidly growing theoretical and technical knowledge on lenses. Such knowledge on one hand allowed the birth of ‘optical’ arts, such as photography and cinema and, on the other hand, led to the development of microscopes whose optical characteristics were comparable to the modern instruments. Of note, the biggest microscope manufacturers of this period, i.e. Ernest Abbe, Karl Zeiss and Otto Schott, were best known as producers of photographic cameras (Figure 1).
Figure 2.

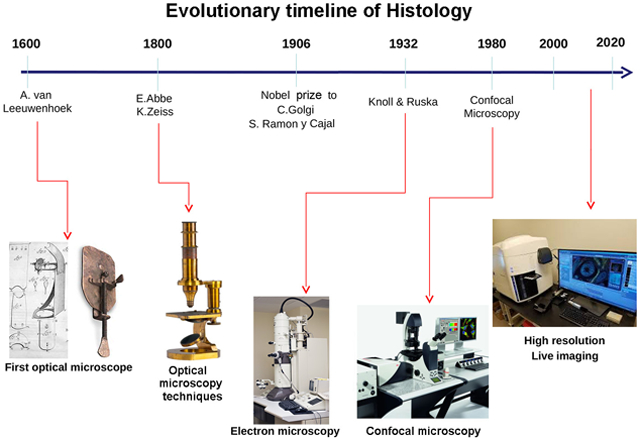
Timeline of the milestones that marked the evolution of Histology.
The milestone of the histological discoveries of the 19th Century can be considered the formulation of the cellular doctrine by Theodor Schwann in 1839, who first hypothesizes that animals and plants are made up of tissues formed by a distinctive spatial distribution of myriads of single cells (Schwann T., 1839). Due to the importance and originality of his contributions, the name of this new discipline devoted to the study of tissues was changed from ‘tissue Anatomy’ to ‘Histology’: this term had been coined in the early 19th century by Marie Francoise Xavier Bichat and reprised by Karl Mayer in 1819 (Figure 1). The official recognition of Histology as a medical discipline dates back to 1906, when Camillo Golgi and Santiago Ramon y Cajal were co-awarded the Nobel Prize for Medicine owing to their fundamental histological studies on nerve cells (Figures 1,3).
Figure 3.

A) Microscope slides from early 1900s attributed to Camillo Golgi, containing sections of the barn owl cerebellum and stained with silver impregnation method. B,C) Digital microphotographs of the same slides, at 4X and 20X magnification, obtained with a Leika ICC50HD microscope equipped with digital camera in April 2019. The slides belong to the "Luigi Cattaneo" collection of the Anatomical Wax Museum, Bologna, directed by Dr. Luisa Leonardi, who kindly granted her consent to publication.
The 20th Century has been hallmarked by the atomic theory and quantum Physics. From the histological perspective, the discovery that both photons and electrons behave as electromagnetic waves led in early ‘30s to the development of the transmission electron microscope (TEM) by Ernst Ruska, in collaboration with Bodo von Borries and Max Knoll (Knoll & Ruska, 1932); Ruska was awarded the Nobel Prize for Physics in 1986 for his fundamental work in electron optics and for the design of the first TEM (Figures 1,2). Exploiting an electron beam with very short wavelength instead of photons, this microscope can attain a 100- to 1000-fold higher magnification and resolving power than optical microscopes operating in the visible spectrum, thus allowing to observe the morphology of subcellular structures, viruses and even large molecular complexes (Figure 4). Electron microscopy also led to improve the existing methods of tissue processing for the specific purposes and characteristics of ultrastructural observation (aldehyde-OsO4 fixation, resin embedding, ultramicrotomy, and electron-dense counterstaining). Few years after the development of TEM, the principle of electron beam imaging was applied to the scanning electron microscope (SEM)(von Ardenne, 1938), in which images result from interactions of the electron beam with the sample surface. The secondary, reflected or back-scattered electrons are collected and their signal used to generate an image of the irradiated surface. However, the use of SEM for bio-medical investigations is currently limited.
Figure 4.

Comparison of achievable resolution in light microscopy and electron microscopy.
The second half of the 20th century saw the discovery of laser (Light Amplification by Stimulated Emission of Radiation), an invention of uncertain authorship which gave rise to a patent controversy lasted over thirty years, and the application of binary mathematics, theoretically introduced by the studies of Gottfried Wilhelm von Leibniz (1646-1716) and George Boole (1815 – 1864), to modern informatics and computer technology. These achievements have been the technological key points to develop confocal laser scanning microscope: this instrument exploits a monochromatic laser beam for 3-D detection of specific fluorescence markers of cells and tissues (see ahead) (Figure 4). In early 2000s, significant advancements were made in super-resolution microscopy (in the nanometer range) that exploits a non-linear optical approach to reduce the amplitude of the spot of incident light on the sample and therefore the background noise given by the illumination of the contours of the observed detail (PSF, Point Spread Function). Among methods inspired by this approach, the most important are indicated by the acronyms STED (STimulated Emission Depletion) (Dyba & Hell, 2003) and SSIM (Saturated Structured Illumination Microscopy) (Gustafsson, 2005). Other high-resolution techniques are based on the transitions between the two molecular states (i.e. on/off) of photons with fluorophores, and exploit both spatial and temporal phenomena that allow the precise location of single fluorescent molecules. Such techniques include STORM (STochastic Optical Reconstruction Microscopy)(Rust et al. 2006) and PALM (PhotoActivated Localization Microscopy)(Manley et al., 2008).
In the present days, the enormous increase in power of modern computers allows to interface different detection devices in order to analyse the same sample simultaneously, and information obtained can be integrated, nearly in real-time, at micrometric to nanometric resolutions. The simultaneous analysis of this multi-level information discloses new relationships between morphology and function undetectable with conventional methods, giving rise to a new branch of Histology called correlative microscopy.
The theory of measurement applied to histology: relevance of the error
For long time, medical observation necessary to propose a diagnosis was based on the classical five senses: sight, taste, smell, touch and hearing, which are intrinsically subjective and often limited by low resolution. Concerning visual observations, their evolution from qualitative and subjective to quantitative and objective, as those available nowadays, has been possible, both conceptually and technically, by the development of the theory of measure and the progress in various disciplines with repercussions on Histology.
A dogma of the theory of measure is that error cannot be eliminated but only reduced in amplitude and frequency by improving the components of the measurement system. Transformation of qualitative microscopic observations into quantitative assessments implies identification of parameters that can be quantified, as well as reduction of the frequency and amplitude of the measurement error, so that the corresponding numerical values are robust and reliable enough to be subjected to statistical analyses.
In Histology, the components of the measurement process susceptible to errors are: 1) the instrument generating the signal, 2) the observer who interprets the signal, and 3) the sample analysed. The overall measurement error results by multiplying the errors of the individual components: hence, to reduce its dimension and frequency, all the 3 components need to be improved, namely through: use of sensitive and precise optical tools; objective interpretation of data, independent of human error related to the observer’s subjectivity; appropriate processing of the sample to be observed in order to generate uniquely interpretable signals.
1) The optical instrument: its error-generating parameters are: i) acuity, or resolution power: the ability to discriminate details as inverse function of their size and proximity; in Optics, resolution power (d) is expressed by the Abbe’s formula: d=0,61 λ/NA, where λ is wavelength of the radiation used to form the image, and NA (numerical aperture) is a light refraction characteristic of the used objective; ii) sensitivity: the range of intensity of the signal at which the instrument can detect it -for optical instruments, it corresponds to the wavelength range of the light forming an image; iii) accuracy: the precision of the objective measurements on a given image; iv) reproducibility: the frequency with which an instrument yields similar measurements of the same subject in independent evaluations made under similar experimental conditions (temperature, pressure, etc.).
2) The observer interpreting the signal: in this instance, the error-generating parameters are: i) decoding: the ability of the observer to distinguish specific signals (objects) from the background noise -this limit is especially relevant for complex images; ii) illusions or false signals: optical mis-perceptions depending on how an image is processed by the human eye and central visual pathways or the used hardware/software systems.
3) The analysed sample: here, the error-generating parameters are: i) Identity: presence of unique markers of the observed subject which are not present, or present at lower levels, in other subjects present in the field -ideally, these markers should persist in repeated observations. Improvement of identity detection of the observed subjects is specific matter for precision microscopy, as described in a following section. ii) Artifacts: with few exceptions, cells and tissues are colorless and prone to post-mortem degeneration. Therefore, prior to microscopical observation, it is necessary to preserve them by fixation and to enhance their visible details by histological staining. Both these procedures are made by chemical-physical treatments that may alter the original cell and tissue morphology generating false signals, or artifacts, the existence of which the observer must be aware. iii) Thickness: the subject under observation must be thin enough to allow the light (or electron beam) forming the image to cross it. In conventional histological analysis, several methods can be employed to achieve an adequate sample thinness for microscopic observation (smear, sectioning, grinding), depending on the nature of the tissue and the scopes of the observation. In addition, these two-dimensional observations may generate mis-interpretation of the actual three-dimensional structure of cells and tissues: for example, a round section profile can belong to both a sphere and a cylinder. iv) Staticity: by definition, fixed cells and tissues yield static images, whose observation is not informative about the movements and reciprocal interactions of the various subjects observed within their natural habitat. The technical advances to address the issues of thickness and staticity will be discussed in the sections on dynamic and three-dimensional microscopy, respectively.
Image generation and interpretation by the observer
For long time, man has been both author and interpreter of visual observations and, therefore, the main source of error. Human vision occurs in two phases: a) early vision, related to the excitation of photoreceptors in the retina, b) late vision, related to transport, coding and interpretation of the optical neural stimuli to and by the visual cortex.
Early vision depends on the mode of action of the eye, which is similar to a photocamera provided with a built-in autofocus system (lens), a light probe that automatically determines opening of the diaphragm (iris), and a self-cleaning fore-lens (cornea and aqueous humor). The limitations and related errors of the human eye can be reduced by microscopes, whose lens systems increase both magnification and acuity, allowing accurate and reproducible observations and measurements of the subject, as better described in a following section.
Late vision occurs upon transmission of the visual neural signal to the brain, which operates like a highly sophisticated hardware system with immense analytical capability. The image recognition process requires 3 main requirements:
1) the image signal is recognized from background noise;
2) the image signal contains enough information (e.g. markers) to identify the subject and define its characteristics;
3) the markers are robust enough to allow that the recognition of the subject is univocal.
The signal and the background.
When our brain interprets an image, it automatically excludes the background and focuses on the signal of the subject, deciphered on the basis of the expected characteristics. This mechanism was elucidated in the second half of the 1900s by studies from the mathematicians Lionel and Roger Penrose (1958), who noted that, in certain circumstances, our brain can mis-recognize images in a process called ‘optical illusion’. Classical examples of optical illusion are represented by the drawings in Figure 5A where the visual signal interferes with the correct spatial perception of our brain. The theory of optical illusion was source of inspiration for various artists of the second half of the 20th century, particularly for the Dutch engraver Maurits Cornelis Escher (1898-1972). One of his most famous works, ‘Plane filling II’ (1957) is shown in Figure 5B. Here, the white and black areas are clearly distinct and our brain can differently interpret the signal depending whether it focuses on the black areas, excluding the white areas as background, or vice versa. Surprisingly, once our brain discovers the trick, it can switch effortlessly from perceiving one or the other of the two images. Discriminating signal from background is more complex for the image shown in Figure 5C, which is similar to a microscopic image. Also in this case, the perception of the image changes when considering the white or black signal as background, but in this case the lack of a defined morphology hinders the evaluation of which signal is the background. As summarized in the following paragraph, conventional microscopic observation can be supported by digital imaging to improve the collection of objective images, but their deciphering and interpretation remains entirely entrusted to the human brain and subjected to possible error of interpretation by the observer.
Figure 5.

The error of perception: optical illusion. A) Examples of graphic forms generating optical illusions that distort spatial perception. Left: forms altering perception of length; right: forms altering perception of space. B) Plane filling II (1957), by Maurits Cornelis Escher, in which interpretation of the image changes depending on the exclusion as background of the black or white signal. C) Example of how a poor resolution between black and white signals inpairs the ability to distinguish between the image and the background.
The demand for objective microscopy: towards digital imaging
In conventional microscopy, the signals (images) are perceived by the observer and the microscope can be considered a mere prothesis that increases acuity of the eye. Accordingly, measurements are carried out by the observer and are subjected to errors related to the visual efficiency of different individuals: for examples, the eventual astigmatism and/or daltonism of the observer will increase the level of error of the observation. These subjective limitations can be addressed owing to technological advancements in digital image recording. The last generation microscopes are equipped with high-resolution digital videocameras capable of discriminating a far broader chromatic and intensity light range than that perceived by the human eye. These cameras transform the visual signal in a digitized image, allowing an objective recording of the observed sample. Digital images are suited for morphometric analysis as well as for archiving and internet-sharing purposes. The immense possibilities of digital imaging can be exemplified by the fact that, nowadays, histopathological images for diagnostic purposes can be transmitted in real time and discussed during conference call by international teams of specialists.
Computer-aided quantitative (computational) microscopy.
Reduction of the observer-dependent error can be achieved by increasing acuity and precision of the optical devices generating the primary image and developing/improving the analysis systems of the digitized images. The first computer-aided microscopy systems were developed in the 1970s: the increasing performances of computers allowed these systems to transform primary images into sets of numerical data. Digitalization divides the image into pixels (arbitrary elementary spaces). The number of pixels per unit area defines the resolution power of a digital image. Each pixel is identified by spatial coordinates: length (X) and height (Y) for a two-dimensional image, and depth (Z) for a three-dimensional image. For images in motion, time (T) is added as a fourth dimension.
In gray level images the brightness of each pixel is represented by a number. The number of bits encoding the values of each pixel is called ‘system dynamic range’: the most used formats are 8, 12, 16 bits for gray images. In a 2-bit system, only black and white can be represented without any gradient, while using a 8-bit system the gray levels are 256 (black = 0, white = 255). When comparing the precision allowed by image digitalization with the human eye, this latter can usually discriminate about 70 shades of gray, and only trained observers (such as radiologists) are able to discriminate up to 100 gray shades.
In colour images, to each pixel are assigned numbers that specify its colour as a combination of 3 basic components: Red, Green, Blue (RGB). Each Red, Green, and Blue component also has a light intensity level for each pixel and the combination of them results in a specific colour. In this way, a fully saturated (i.e. maximum light intensity) yellow pixel is identified by three numbers (255, 255, 0) which mean: Red = 255, Green = 255, Blue = 0. The whole data set is then encoded as a digital file comprehensive of spatial, intensity and eventually timing informations. Clearly, the greater the dynamic range, the broader the nuances of a digital image. Concerning colours, the 24-bit coding allows to discriminate 16.7 million colours, which nearly corresponds to the upper limit of the human eye.
The methodology concerning conversion of microscopic images into digital sets of numbers that can be analyzed and evaluated statistically is referred to as computational microscopy: it offers the advantage of an accurate, objective, repeatable and quantitative analysis of the microscopic images freed from both the limits of human vision and the subjectivity of the observer. Computational microscopy can also contribute to decrease the degree of error due to technical artifacts introduced during preparation of the histological sample, since they can often be minimized by an appropriate setting of the digitalization parameters. Finally, the whole procedure can be automated, thus allowing the simultaneous analysis of a larger number of samples in a shorter time than that required for conventional histological analysis performed by an operator. An example of digital image processing is shown in Figure 6. First, the background is excluded by selection of its threshold value, which can be chosen by the observer or automated. In fact, for some applications, the distribution and intensity of the image pixels, computed with appropriate algorithms and statistical methods, can usually suffice to define the threshold separating the signal from the background noise.
Figure 6.

Example of computational microscopy, i.e. computer-aided digitalization and analysis of a fluorescent microscopic image obtained by a confocal microscope. A) unprocessed digital image of cells immunostained with two antibodies, labelled respectively with red and green fluorochromes and with nuclei counterstained in blue with the fluorescent dye DAPI. B) Selection of the detail to be analysed and of the threshold value of the total area. The instrument’s software then splits the signals for the individual colors (C), performs digitalization of each image attributing a binary value to each of its pixels, and sets the threshold value to exclude the background (D). Finally, the digitally reconstructed subjects of interest can be eventually analysed quantitatively (E). Comparison between the original image (A, bottom right) with its processed counterpart (E) demonstrates how, in the latter one, the cellular events associated with the red and green signal can be partly co-localized in the cytoplasm (yellow = red + green), while part of the red signal is also localized in the nucleus.
Precision microscopy
Until 1950s, a major limitation of Histology was that, with few exceptions, recognition of cells was mainly based on their mere morphology, a criterion which can be fallacious. A substantial advancement has been made with histochemical methods that have allowed to combine general cell morphology with specific staining of cell details obtained by compounds that develop specific colors when they are metabolized by cellular enzymes, similarly to invisible ink. Despite histochemistry can be actually applied to a limited number of purposes, chiefly the detection of typical enzymes of bone marrow-derived cells (myeloperoxidase, acid phosphatase), it has the merit of having focused the notion that, besides their shape, cells can be characterized by their content of specific molecules (proteins, nucleic acids, lipids, etc.). Besides being markers for their identification, such molecules can also be used as indicators of their functional and/or differentiation status, opening the way to the so-called precision microscopy. This methodology mainly exploits fluorescence microscopy due to its capability to detect fluorescent markers (i.e. substances that when excited by UV or short wavelength visible light emit in the visible spectrum at longer wavelenghts) with a higher sensitivity than standard light microscopy. Cell-specific markers that can be used for fluorescence analysis are represented by: i) antibodies against cell proteins, conjugated with synthetic fluorochromes such as fluorescein (immunofluorescence) (Figure 7); ii) metabolic probes, which can be loaded into the cell where they become fluorescent upon reaction with specific metabolites; iii) specific cellular proteins, whose gene has been coupled with that for a naturally occurring fluorescent protein, such as green fluorescent protein (GFP), by molecular biology techniques; when cell activates the expression of the specific protein, this also includes GFP and hence appears fluorescent (Figures 8 and 9).
Figure 7.

Precision microscopy: identification of specific cellular antigens by immunohistochemistry. The left drawings show the main detection systems, immune-enzymatic by means of peroxidase, or immunoperoxidase (top) and immunofluorescence by means of fluorochromes (bottom). The right panels show sections of bone marrow immunolabeled to reveal the transcription factor GATA1 specific for megakaryocytes: wild-type mice show a normal signal while hypo-expressing (Gata1low) mice show a weak signal. Upper row: immunoperoxidase method (nuclei are counterstained with May-Grunwald-Giemsa); lower row: immunofluorescence method (nuclei are counterstained with the fluorescent dye DAPI in blue). Note how immunofluorescence makes the reduction of nuclear GATA1 in megakaryocytes from the mutant mice more evident (the immunoperoxidase images are from Vannucchi et al., 2005).
Figure 8.

Morphological techniques for cell identification based on the fluorescence emitted by Green Fluorescent Protein (GFP). The GFP gene has been cloned and inserted with molecular biology techniques in various types of eukaryotic cells, which become fluorescent when this gene is transcribed into the functional GFP. If the GFP gene is inserted into germ cells of laboratory animals, then the zygote and its cellular progeny, e.g the whole animal, are fluorescent. Besides GFP, other genes encoding for fluorescent proteins emitting in additional channels, can be used for experimental purposes (lower row); currently, about 50 different fluorescent markers, each emitting signals with a specific wave length, are available.
Figure 9.

Green Fluorescent Protein (GFP) allows to track the labelled cells upon in vivo transplantation. GPF-tagged muscle stem cells grafted into the heart of a laboratory animal are located around a blood vessel (asterisk). Nuclei are counterstained in red.
Marking of cells using their antigenic profile: the key contribution of immunohistochemistry to modern Histology.
During the 1970s there was an intense development of techniques for immortalization and in vitro growth of B cells, the cells responsible for the humoral immune response and antibody production. In the meantime, procedures for exploiting antigens and adjuvants were remarkably improved. B cells were stimulated both in vivo in laboratory animals (mainly mice, rats and rabbits) and in in vitro culture to produce specific antibodies. This increased knowledge offered to researchers a formidable precision tool to recognize the molecules uniquely expressed by a given cell type that could be exploited for its identification. This methodology is termed immunohistochemistry (or immunocytochemistry, according to the structural rank of investigation) and has represented an authentic turning point in biomedical sciences. The premises of immunohistochemistry are that: i) cells of different differentiation lineages express specific surface proteins; ii) these proteins induce the generation of specific antibodies when injected into allogeneic animal species or commissioned to challenge B cells in vitro; iii) these antibodies can be purified, labelled to become detectable (e.g. by binding with a fluorochrome) and used as selective probes to identify and locate their specific antigens in cells and tissues. At the same time, oncologists realized that immunohistochemistry had tremendous potential for improving the precision of diagnosis and therapy of tumors. In fact, starting from the assumption that neoplastic transformation usually alters the proteins expressed on the cell surface, it appeared feasible to immunize laboratory animals with cancer cells, isolate and cultivate their reactive B cells, and finally use the specific cancer cell antibodies purified from the culture media for diagnostic and/or immunotherapeutic purposes. This latter application, also defined passive cancer vaccination, raised great hope that would be greatly effective to treat cancer. Indeed, it is assumed that, once injected into the tumor-bearing patients, these antibodies would induce activation of the immune-mediated cytotoxic mechanisms specifically responsible to recognize and kill cancer cells. One of us (ARM) had the privilege of participating in pioneering studies in this field at the TNO laboratories (Rijsvejk, NL) during her PhD. She maintains a vivid memory of the enthusiasm of the researchers involved in injecting rabbits with human cancer cells, collecting and culturing rabbit B cells, purificating their antibodies from the culture media, labelling, and isolating the cancer cell populations by fluorescence-activated cell sorting (FACS). Of note, the first FACS prototype was designed and built in this laboratory: it was an open machine whose lasers had to be tuned daily by the investigators by sticking their heads among the lasers. Once isolated, the labelled cells had to be quickly centrifuged onto slides and immediately observed under a microscope to identify – when luck was on the right side – that the antibody had indeed recognized a specific target. Often, the preparations contained a mixture of different cells, but sometimes all the cells on the slide expressed the same phenotype: these rare fortunate instances gratified the researcher for his/her efforts because indicated that the antibody generated was specific for a given cellular lineage. Originally, these antibodies were termed with disparate names but, soon, researchers felt the need to reach a consensus on their nomenclature to avoid confusion. The first meeting dedicated to the establishment of an international antibody inventory took place in Paris in 1982. This meeting led to reach consensus to identify the antibodies with an alpha-numerical code represented by CD (for Cluster of Differentiation or “common denominator” as a joke), followed by a progressive number based on the order of their full characterization (molecular definition of the antigen recognized by the antibody). This first congress identified the antibodies from CD1 to CD15. Since then, these workshops are held on a regular management and have classified antibodies up to CD371. Unfortunately, these studies failed the ambitious goal to create a vaccine for cancer because their key premise was wrong: cancer cells express on their surface the same proteins expressed by their normal counterparts. Gene instability induced by the mutations which drive the transformation process may induce ‘benign’ mutations (i.e. mutations which have no functional consequences) in genes encoding for surface proteins. Thus, new possibly immunogenetic epitopes are generated, but, since their generation is random by nature, these epitopes are not tumor-specific but rather patient-specific. This phenomenon makes practically impossible to produce an universal vaccine for a specific type of cancer. The recent progresses in whole genome and transcriptome sequencing, has allowed to revisit the concept of cancer vaccine. The new approach involves three steps: sequencing all the genes expressed by the cancer cells of a given patient, identifying mutations on genes encoding potentially immunogenic epitopes on surface proteins; synthesizing peptides corresponding to these epitopes; finally, raising tumor- and patient-specific antibodies in laboratory animals or in B cells in culture to be used as patient-tailored anti-tumoral immunotherapy. This digression is intended as an example of how theoretical and technical advances in histology can have profound medical impacts.
Coming back to Histology, studies on CD expression have dramatically expanded the knowledge on the differentiation pathways of cells from different tissues and organs, as well as on the behaviour and functional properties of their stem cells during ontogenesis, adult life and aging. Besides immunohistochemistry, availability of large panels of CD antibodies has exerted a deep impact on the development of FACS methodology, which plays a fundamental role both for the identification and prospective isolation of living cells. FACS exploits the principle of flow cytometry, which allows to discriminate individual cells in suspension (in culture medium, blood, etc.) based on size, inner organization complexity (organelles, inclusions, etc., assessed as optical impedance), and fluorescent immunolabeling labelling by specific CDs. Briefly, cells run individually through a transparent capillary tube, where they are hit by a light beam, usually emitted by a laser or LED, generating optical events detected by a photomultiplier, recorded, and analysed by a dedicated software. During this process, flow cytometric examinations provide highly specific and sensitive data on the number and type of cells present in the sample under analysis. Being based on computer-aided optical determinations of cell morphology, flow cytometry can rightfully be included among the most sensitive and accurate histological techniques. FACS exploits the same mechanism of flow cytometer but it associates the ability to separate the labelled cells from the remaining pool in a process called ‘cell sorting’, thereby yielding cell populations as pure as the specificity of the markers used for their identification. A practical example of the impact of flow cytometry on conventional histological methods is provided by the determination of the leukocyte formula, a fundamental clinical diagnostic parameter. Until 1980s, leukocyte formula (i.e. the relative frequency of the different types of white blood cells) was processed by highly trained operators by counting under an optical microscope the different types of cells present in a standardized area of the blood smear stained with May-Grunwald Giemsa (Figure 10). Frequency determinations were usually based on approx. 200 viewed cells and was a subjective and time-consuming process. A trained technician was able to evaluate no more than 10 patients per hour. Currently, leukocyte formula determinations are carried out rapidly and objectively by flow cytometry. Blood samples are first labelled with anti-CD45 fluorescent antibodies, which recognizes all leukocytes, coupled with anti-CD14, which does not bind lymphocytes and recognizes granulocytes and monocytes but at different intensity. The labelled blood sample is then analyzed by flow cytometry, which rapidly (in minutes) scores large numbers of cells (~ 10,000). In the meantime, a specific software elaborates the different signals and calculates the leukocyte formula, increasing the numbers and precisions of the determinations that may be performed by a single technician. Typical histological and flow cytometry blood count outputs are shown in Figure 10.
Figure 10.

Determination of the leukocyte formula by the conventional blood smear technique and by flow cytofluorimetry, a technique used today. Note the limited number of events (3 cells per microscopical field, indicated by arrows) on which microscopic determinations are based with respect to the high number of events (category axis: 10,000), measured in a few seconds by the modern flow cytometric analysis. The flow cytometry data represents the cells in the blood of a 13-weeks old human foetus (from Eddleman et al., 1996).
Marking of cells using their gene activation profile
A limitation of antibody-based cell recognition techniques is represented by the fact that protein epitopes may not be recognized when their conformation is altered by the fixation process and/or they became masked by association with other proteins. To overcome this limitation, cells of interest can be labelled, when suitable, by inserting a GFP gene in their genome (Figures 8 and 9), the expression of which is possibly driven by regulatory sequences that makes its expression specific for a given cell type or functional phase (Figure 11). Since this gene is inherited by offspring, all the cells of a specific differentiation linage becomes traceable either in culture or in vivo (Figure 12). This tool has prompted highly sophisticated studies, which have greatly improved our knowledge of the regulation of lineage specification and differentiation. Among others, they have allowed to define the function of non-coding DNA sequences. In fact, since less than 10% of the human genome encodes proteins with the well-defined DNA triplet-protein aminoacid correspondence assured by the ribosome machinery, the information stored in 90% of the human DNA is unknown. It is assumed that this non-protein coding DNA contains information that regulates gene expression as well as specific functional fashion in a cell. However, deciphering the non-coding DNA is matter of intense investigation. Evidence is accumulating that this information is encoded by the epigenome, i.e. the complex of chemical modifications affecting both DNA, such as cytosine methylation - a discovery of the Italian group led by Prof. Scarano (Grippo et al., 1968) - and structural and regulatory proteins interacting with DNA in the chromosome. A typical experimental approach used to define the function of the non-coding sequences is to delete them from the genome of mouse embryos and then to analyse their effects on tissue differentiation during development. The function of these regulatory sequences is then confirmed using them to drive the expression of GFP-labelled proteins in transgenic mice, as shown in Figure 12. Another approach, is to identify all mRNAs expressed by a specific cell type (the so-called transcriptosome) and then to compare shared sequences among all the DNA regions upstream of the genes included in transcriptosome. These experiments, which largely exploit histological techniques, have provided evidence that initiation of lineage-specific epigenomic changes occurs early at the levels of the stem cells, several generations upstream of the differentiated cells in which the genes will be expressed (Huang et al., 2016; Weinreb et al., 2020). Upon its transcription, mRNA is often not immediately translated but may remain dormant through additional cell generations. However, despite these advancements, the molecular mechanisms of epigenomic regulation (so-called non-coding DNA code) have not been completely elucidated yet (Ferreira et al., 2007; Rickels & Shilatifard, 2018). Some key progresses in these direction are represented by identification of the minimum DNA sequences determining whether a gene is expressed in a specific cell type, for example in erythroid cells (Han et al, 2015), and by demonstration that, like mitochondrial DNA, the epigenome is chiefly inherited by the maternal line (Xu & Xie, 2018). Unfortunately, cell identification through GFP-tagging and by transcriptosome characterization is also prone to artifacts and bias. In fact, recent transcriptosome/proteosome correlation studies have shown that cells may express mRNAs for far more genes than those actually translated into proteins (see for example Huang et al., 2016). It is assumed that these untranslated mRNAs may represent either information to be passed on to daughter cells - the case for the mRNA present in the cytoplasm of oocytes that is translated only in the fertilized egg (Sheets et al., 2017) - or a reservoir of expression prompts that cells activate to switch towards a different differentiation pathway in response to stress. For example, this is the case of erythroblasts that express also megakaryocyte-specific mRNAs, which are translated to generate platelets in response to bleeding and vice versa (Vannucchi et al, 2000). In order to unveil more precisely the relationships between cells of different lineages. the most advanced research is moving towards single cell transcriptosome/proteasome determinations. These studies are indicating far more complex relationships than those we are familiar with, which are based on mere morphological observations performed through conventional histological technology.
Figure 11.

Transfection of genes encoding for fluorescent proteins was used to demostrate that different stem cell clones contribute to normal hematopoiesis in zebrafish. In this experiment, each erythropoietic stem cell activates the expression of a distinct fluorochrome protein, yielding a variety of colors. (further details posted by the Zen Laboratory are available at: https://www.youtube.com/watch?v=MIrlUwmmRBY)
Figure 12.

Morphological demonstration of lineage-specific control of the expression of a gene. The upper drawing is a diagram of the regulatory sequences of murine Gata1 gene: various HS (hypersensitive site) sequences regulates the transcription of Gata1 in hematopoietic stem cells, lineage progenitors and mature bone marrow cells. In this experiment, the HS1sequence has been labelled by insertion of the GFP gene in its proximity: GFP is therefore expressed by all cells in which HS1 is active. The below panels are confocal images of the same microscopical fields showing the expression of GFP (left: marked in red with TRITC florochrome) and the immunolabeling for cKit, the receptor for stem cell growth factor, or for CD41, a specific marker of megakaryocytes (centre, marked in green with fluorescein). The co-localization of the two fluorescent signals (red + green = orange) demonstrates that the expression of HS1 (GFP-TRITC) is specific of cKit-positive stem cells and CD14-positive megakaryocytes. This type of analysis can also provide quantitative information on the level of activity of HS1 in various cells (as function of the intensity of GFP fluorescence), as well as on cell frequency and distribution.
Three-dimensional (confocal) microscopy.
Confocal microscopy allows to record digital stacks of bi-dimensional fluorescent images taken at sequential plane depths of a histological preparation. The series of digital images are then processed by a dedicated software that generates a three-dimensional reconstruction of the various signals. This model may be rotated, tilted, expanded, etc. like any other digital 3-D file, providing extremely precise information on the localization of the individual signals within the spatial architecture of cells and tissues. An example of the numerous applications of this technique is shown in Figure 13. This figures details the mechanism that mediates the translocation of the glucocorticoid receptor into the nucleus to activate the expression of the genes mediating the cellular response to stress (Nicolaides et al., 2010). The 3-D images in Figure 13 depict the spatial localization between the glucocorticoid receptor and calreticulin, suggesting that calreticulin chaperons the receptors to the nucleus after ligand binding. In fact, cells stimulated with the receptor agonist dexamethasone exhibit signals for glucocorticoid receptor and calreticulin associated in the cytoplasm up to the border of the nuclear envelope, but only in the nucleus do they show the glucocorticoid receptor signal.
Figure 13.

Example of three-dimensional confocal microscopy. In this experiment, human erythroblasts were labelled with anti-glucocorticoid receptor (GR) antibodies (green) and anti-calreticulin (CALR) antibodies (red), while the nucleus was counterstained in blue. Three-dimensional analysis shows that the signal co-localization (yellow = green+red), indicating the association between these two proteins, stops in the cytoplasmic area at the border of the nuclear envelope (arrow), whereas GR is alone within the nucleus (from Falchi et al., 2017).
Dynamic microscopy
The term dynamic microscopy indicates the different microscopic techniques aimed at the visualization and analysis of living cells and organisms, following their changes over time. A pioneer of dynamic microscopy was Van Leeuwenhoek himself, who left a detailed description of blood flow in the skin microvessels of the ear from a living rabbit performed with his rudimentary microscope, developing the hypothesis, advanced for that time, that the blood circulation is a closed functional system. Between the XIX and XXI centuries, technical innovative microscopic and photographic devices, along with their respective technology, improved enormously our ability to observe and record the morphology of living cells, both in vitro in controlled laboratory conditions and in vivo in their natural habitat. Obviously, the possibility to analyse dynamic phenomena provides a great assets to the advancement of Histology, overcoming its intrinsic limitations of providing only static information. The fields in which dynamic microscopy is providing key and novel information are numerous. Few practical examples are described in detail below.
Dynamic microscopy in vitro
Basically, this term refers to the applications of optical microscopy to the observation of cells cultured in vitro. The need to observe cells growing attached to or in suspension in transparent cell cultureware led to the development of inverted optical microscopes in which the light source and the detection optics are placed, respectively above and below the culture chambers. Due to the low intrinsic contrast of living cells, inverted microscopes usually operate in the phase-contrast mode which exploits special optical systems in order to increase image sharpness and better discriminate details. This is achieved even in the absence of chemical staining most of which, by definition, may not be used with living cells (few exceptions are the vital dyes). Inverted microscopes are usually equipped with digital video cameras that, besides single photographs, allow to take sequential images from the same microscopic field at scalar time points. These images can be then assembled as a video (time-lapse videomicroscopy), thus providing dynamic information on how relevant features, namely: shape, size, number, spatial position, etc., may vary with time (Figures 14,15). In vitro dynamic microscopy is affected by several variables such as: i) basic culture conditions, e.g. maintenance of optimal temperature and availability of oxygen and nutrients in the medium; ii) experimental manipulation, e.g. addition of bioactive molecules (drugs, growth factors, etc.) or co-culture with other cell types; iii) observation conditions, e.g. mechanical stability of the optical components and specimen holder, adverse effects of exposure to prolonged and/or intense illumination, versatility of the support used to grow the cells (microscopic slides, flasks, Petri dishes), capability to compensate possible defocusing due to the movement of the subject with time; iv) acquisition variability of the software, e.g. speed at which the sequential images are captured (frame rate), overall memory storage and image elaboration capability of the instrument, etc. Each instrument configuration must therefore be adapted to the experimental purpose and level of resolution required. For very rapid cellular events, in the order of microseconds (such as Ca2+ transients, events involving molecular channels, synaptic activation, etc.), the time of observation usually lasts only few minutes, thus simplifying the set-up of the experimental conditions, but posing a high demand on the rate with which the sequential frames are recorded. For slow events, lasting between hours to even days, long-term maintenance of supportive culture conditions becomes crucial to avoid experimental bias due to cell toxicity. The final frame set may be then accelerated, slowed down or stopped to study the morpho-functional events in the most suitable time ranges. This process allows to collect detailed information on the modification in size, shape and number, as well as patterns and timing of eventual movement and interactions experienced by individual cells during the observation (Falchi et al., 2015). Usually, these observations may exploit the same tools described earlier for digital image analysis, achieving quantification of the parameters under study. For each experimental purpose, the hardware and software can be set to provide specific data output (morphometry, densitometry, single cell tracking, overall microscopic field analysis, etc.). However, this technology also has intrinsic limitations which the observer must be aware of, and complex and/or very rapid experiments often require manual interventions by trained operators. Most common examples are: out-of-focus frames due to improper timing for automatic focusing; changes of spatial arrangement of the subject during time; disappearance of the subject from the frame due to cell/tissue movements; modifications of exposure conditions due to alteration of medium; photo-bleaching of fluorescent probes; etc.
Figure 14.

Dynamic microscopy in vitro. The upper panel shows an inverted phase-contrast microscope suitable for observation of living cells in culture. The basic instrument can be equipped with accessories (not shown here) to maintain optimal culture conditions for a while, allowing time-lapse video-microscopy. The below panels show a time-lapse phase contrast analysis of cardiac muscle stem cells which tend to progressively coalesce, in the directions of the double arrows, thus mimicking in vitro the developmental process of compaction of the embryonic myocardium.
Figure 15.

Dynamic microscopy in vitro. Screen shots of time-lapse phase contrast analysis of in vitro cultures containing macrophages (large and irregularly shaped) and erythroblasts (small and round), interacting with each other. The time-lapse videos are available online as supplementary file available by Falchi et al. (2015). In the right panel, a macrophage appears to interact with an erythroblast in cytodieresis, suggesting a possible functional role.
Dynamic microscopy in vitro can be combined with the use of fluorescent probes, which can be loaded into the cells where they emit a light signal when they interact with specific metabolites and are excited using appropriate wavelenghts. This methodology has allowed to gather key information to understand on cell function and metabolism. For example, the regulatory role of Ca2+ on muscle contraction has been deeply investigated using FLUO-3, a fluorescent probe emitting signals in the green-blue spectrum directly proportional to Ca2+ concentration. When associated with a detection device with appropriate frame rate, this method allows to detect and measure onset and propagation of the rapid intracellular Ca2+ transient, allowing to detect dynamic functional data (Figure 16A) (Formigli et al., 2005). Other examples of fluorescent metabolic probes are MitoSOX, which reveals the production of reactive oxygen species (ROS) in mitochondria during cellular respiration or oxidative stress, and BODIPY 581/591 C11, whose fluorescence shifts from red to green when it interacts with membrane lipids oxidized by excess ROS (Figure 16B) (Boccalini et al., 2015). Dynamic microscopy with metabolic dyes allows exact cellular localization and timing of functional events, which were previously evaluated only by biochemical assays on cell and tissue extracts with obvious loss of information at the single cell level. This is a constantly expanding field of investigation because of its potential to provide real-time information on the functional state of cells. As a proof, the catalogues of companies producing and distributing the reagents necessary for these experiments are enriched every year with less toxic and more specific fluorescent probes
Figure 16.

Dynamic microscopy in vitro used to follow metabolic phenomena in living cells in culture by means of fluorescent probes A) Cardiac muscle cells loaded with the Ca2+-sensitive probe FLUO-3, which emits a fluorescence whose intensity is proportional to the intracellular Ca2+ levels (white, maximum; blue, minimum). The white arrows indicate the direction of propagation of a Ca2+ pulse (transient) within an elongated peripheral cell. B) Myocardial stem cells subjected to oxidative stress: red MitoSOX fluorescence reveals the increase in the production of reactive oxygen species by mitochondria; green BODIPY 581/591 C11 fluorescence reveals the presence of oxidized by-products of membrane lipids.
Dynamic microscopy in vivo
Small laboratory animals transparent to light, such as zebrafishes, have been among the first models to be used for dynamic microscopic investigations aiming to directly observe cells within their micro-environment. This technique has been then adapted by devising inverted microscopes suited to observe cells in the tissues and organs of more complex laboratory animals. These observations are particularly powerful when the observations are performed on animals genetically modified to express fluorescent proteins taget to specific cell types. An example of labelled red blood cells circulating in a zebrafish is shown in Figure 11. In recent years, miniaturization of opto-electronic devices has allowed to assemble micro-cameras suitable for implantation into the organs of the laboratory animals. These devices allow the detection of the cellular changes within a tissue at the time of their occurrence in vivo, and provide robust information especially when coupled with technologies that tag the observed cells with fluorescent probes. An example of the information that may be provided by a micro-camera inserted in a mouse femur is shown in Figure 17: in the experiment described, this technology was used to track the localization of GFP-tagget hematopoietic stem cells in the trabecular bone of mice transplanted with pure hematopoietic cells from normal mice or from a mouse model of myelofibrosis (Gata1low mouse), a disease characterized by hematopoietic failure in the bone marrow (Spangrude et al., 2016).
Figure 17.

Dynamic microscopy in vivo. A technique combining intrafemoral endoscopy and time-lapse confocal microscopy is described in the upper panel. A micro-camera connected to a confocal microscope was inserted into the femur of normal and Gata1-defective mice, which had been transplanted with GFP-labelled hematopoietic stem cells (HSC). The results are shown in the below panels. Five days after transplantation, HSC (green) were chiefly located near the epiphyseal trabecular bone in the wild-type mice. Conversely, in the Gata1low mice, HSC were evenly located in the epiphysis and diaphysis, suggesting a defect in the bone marrow hosting niche in the mutant mice which appears unable to retain the stem cells. For more information, see Spangrude et al. (2016).
Dynamic microscopy in vivo can provide indications on the cellular mechanisms underlying physiological and pathological events. For example, such observations have been helpful to demonstrate that thrombus formation within blood vessels is triggered primarily by the interaction between deformed erythrocytes and endothelial cells, followed by recruitment of neutrophils, activation of platelets and formation of the clot (Byrnes & Wolberg, 2017). This knowledge is fundamental to identify potential therapies to prevent and/or treat the early events of thrombosis and ischemia. In addition, dynamic microscopic observations on blood vessels in vivo have been used by a team of morphologists and bio-informatics to evaluate in situ blood flow rate and vorticity, allowing to identify the bio-physical parameters required by megakaryocytes to release platelets in the bloodstream (Ito et al., 2018).
Nowadays, to facilitate presentation of dynamic data, many scientific journals solicit the submission of videos that are published as supplementary material and stored in dedicated databases.
Experimental histology
This title does not actually refers to any specific methodology, since all histological techniques have already been described in the previous sections. Rather, here we will recapitulate how histological approaches may be pivotal to answer specific experimental questions.
As specified in the introduction, a science is considered major when the hypotheses are tested through experimentation, i.e. by objective determinations of the changes induced in the studied subject by the applied stimuli. Ideally, stimuli and changes should be quantitatively correlated, in other words each stimulus should induces a positive or negative change proportional to its intensity. The development of quantitative microscopy has finally turned Histology into a major science, by offering the offering the opportunity to quantify the morphological changes induced by a stimulus in the observed subject. Concerning the stimuli, histological observations may now measure both changes induced in the subject before its fixation and processing for static microscopic observations and modifications produced by manipulations of the subject during real-time observations realized by dynamic microscopy.
Manipulations of the experimental subject before observation.
Examples of manipulations of the subject before its preparation for observation were already discussed in the experiments shown in Figure 7, where the subject underwent preliminary deletion of a tract of regulatory DNA; in Figures 9 and 11, where a fluorescent marker gene was inserted in the subject’s genome; and in Figure 17, where both these manipulations were applied. We now report other examples of a priori manipulations of the subject that have been helpful to provide clinical and therapeutic information.
i) As mentioned in a previous sections, the cellular response to stress is regulated by the glucocorticoid receptor (GR), a protein product of an extremely polymorphic gene that encodes for more than 250 GR variants differently distributed among humans. This genetic variability underpins the broad range of stress responses observed in different patients. Glucocorticoids are also capable of inhibiting immune response and inflammation. The GR polymorphism within the human population explains why not all patients respond similarly to glucocorticoids administered as anti-inflammatory drugs. A contribution to better understanding this phenomenon has been offered by the microscopic findings described in Figure 18. The GR gene, besides encoding for the active GR protein called alpha isoform, in some subjects may encodes for GR beta isoform lacking the DNA binding domain. Experiments supported by confocal microscopy on cells manipulated to express a GFP-conjugated GR gene encoding only for the alpha or the beta chain have shown that only those expressing GR alpha are capable to translocate the protein to the nucleus upon ligand stimulation. This finding accounts for the lack of responses to glucocorticoid therapy from patients who express GR beta. Moreover, intensity of the GFP fluorescence in the nuclei of manipulated cells is proportional to the concentration of agonist used in the experiment (Nicolaides et al., 2010). Such experiments have been extremely useful to pharmaceutical companies to design new broad-spectrum glucocorticoids that may also be effective on patients who express the beta GR. Furthermore, such experiments facilitate identifying cell-specific glucocorticoids that are, for example, capable of inhibiting lymphocytes without causing undesired adipocyte activation, which is responsible for weight gain and metabolic side effects of immunosuppressive therapies in the long term.
Figure 18.

Example of experimental histology. The upper drawing shows the structure of the glucocorticoid receptor (GR) gene with its alternative mRNA splicings, giving rise to both functional GRα and inactive GRβ, which is unable to bind glucocorticoids and translocate to the nucleus. The tertiary structure of the two GR receptors is shown in the lower left and centre panels (arrow points at the glucocorticoid binding site, which is lacking in GRβ). The bottom right panel shows cells expressing GFP-labeled GRα or GRβ. After stimulation with the agonist (dexamethasone, Dex), only fluorescent GRα becomes selectively located in the nucleus (see Nicolaides et al., 2010, for further details).
ii) A representative example of in vivo manipulation of the studied subject is shown in Figure 19. In this experiment, mice were injected with an antibody recognizing an adhesion protein selectively expressed on the surface of megakaryocytes. Immunohistochemical analysis of lung tissues taken after sacrifice, disclosed occurrence of labelled cells within the parenchyma of the lungs, providing clear evidence that megakaryocytes are normally present in this organ to exert their platelet-producing functions (Lefrançais et al., 2017). Such methodology provides a wide range of practical applications: for instance, it can be used to determine the efficiency of penetration of anticancer drugs into a solid tumour, an useful information to adjust dose, mode and timing of its administration.
Figure 19.

Example of experimental histology. Mice were injected in vivo with antibodies anti-P-selectin, an adhesion molecule expressed by megakaryocytes. Four hours later, the mice were sacrificed and their organs analyzed by immunohistochemistry to detect P-selectin-positive cells. The brown color (arrows) identifies the presence of typical megakaryocytes in lung parenchyma (Migliaccio, A.R., unpublished observations).
Manipulations of the subject during observation.
The potential of dynamic microscopy for obtaining mechanistic information clearly emerges from the experiments described in Figures 14 and 15, devoted to investigating the time course of events and molecular mechanisms underpinning the aggregation between cardiac cells or hematopoietic cells in in vitro culture. Quantitative measurements of intercellular interactions in the presence of modulating substances in the medium (drugs, cytokines, hormones, antibodies, etc.) can provide precise indications on the mechanisms by which these interactions are regulated. Similarly, the study of hematopoietic stem cell homing in vivo, observed in real time by confocal endoscopy of mouse femurs, as described in the experiment shown in Figure 17, is a powerful tool to identify the adhesion proteins involved (cKit receptor and CXCR4) (Lo Celso et al., 2011) and explain how the homing process may be altered by pharmacological manipulations or in cancer (Lee et al., 2012). Extrapolation of these data from mice to humans can be useful to identify preliminary treatments to accelerate engraftment of hematopoietic stem cells in leukemic patients undergoing bone marrow transplantation.
A final example is depicted in Figure 20, showing a screen shot of a time lapse dynamic microscopy experiment, devoted to validating a new anti-cancer drug. Cancer cells were isolated from a patient’s tumor and grown in vitro as organoids. These cells were then co-cultured with T cells taken from the same patient which were genetically modified to enhance their ability to recognize the cancer cells. Time lapse videomicroscopy was crucial to demonstrate how T cells recognize and bind to cancer cells, causing their death. These findings corroborate the feasibility of the anti-cancer therapeutic approach by exploiting patient-derived instructed cytotoxic T cells, a promising strategy of exploiting vaccinal approach for cancer (Penter & Wu, 2020). This intrinsically simple experimental set may be helpful to devise new therapies, since it is also suitable for studying the modulatory effects of drugs and cytokines, as well as investigating the mechanisms that regulate interactions between tumour cells and T cells, e.g. by means of fluorescent antibodies against intercellular adhesion molecules.
Figure 20.

Example of experimental histology. Screen shot of a time-lapse analysis of organoids of human tumor cells grown in vitro in the presence of T cells isolated from the same patient. The whole movie demonstrates that T cells are able to recognize and kill the tumor cells (Falchi, M. & Lapenta, C., unpublished observations).
Conclusions
At the beginning of the 19th Century the average human life expectancy was only 30-45 years. This high mortality was also due to the fact that, until the mid-XX Century, the drug repertoire available to physicians was very limited and yet substantially similar to that of the Ancient World. The dramatic increase in life expectancy of mankind that occurred after the Second World War is mainly attributable to the impact on everyday life of a relatively low number of key inventions, innovative processes and discoveries. These include the fridge, which decreased food toxicity; the industrial production of aspirin, which reduced the lethal consequences of inflammation; and the discovery of penicillin, intended as the progenitor of antibiotics, which allowed to eradicate deadly bacterial infections. Since then, the exponential development of pharmaceutical chemistry has led to the synthesis of active molecules specifically directed against a large number of diseases, and thus it appears to represent the main culprit for the incremental increase in life expectancy of the current time. On the other hand, the plethora of molecules, which can be introduced in the human body to modify its pathophysiological processes for curative purposes, has also raised the major health issue posed by unwanted side effects. Therefore, a major challenge for the incoming years will be to set-up new effective therapies that minimize the drug adverse effects, with the goal to improve the patients’ quality of life. In this view, the research for diagnostic and therapeutic innovations is shifting from the molecules to the target cells. Thanks to the scientific and technological advancements summarized in this article, Histology can be rightfully considered a ‘major’ science and is ready to play its prominent role in the future challenges of modern Medicine.
Research highlights.
Since its origin, Histology has evolved from a merely qualitative morphological discipline to a modern experimental science capable of yielding reliable morpho-functional information extending close to the molecular level.
The major advances of Histology are parallel to those of digital imaging and computer technology, which allowed to obtain digitized images suitable for quantitative, precision and time-course analyses.
After a historical excursus, this review describes the modern histological methodologies, such as quantitative, precision and dynamic microscopy, and provides key examples of their use in bio-medical research.
Acknowledgments
This study was supported by grants from the National Cancer (P01-CA108671 ARM), National Heart, Lung and Blood Institute (1R01-HL116329, ARM), and Associazione Italiana Ricerca Cancro (AIRC IG17608 and IG23525, ARM). The authors gratefully acknowledge Dr. Guido Gnocchi, CEO of Idelson-Gnocchi Scientific Editions Ltd., for kindly granting us the permission to use proprietary images and contents in this article.
Footnotes
Conflict of Interest Statement
The authors have no conflicts of interest to disclose
References
- von Ardenne M (1938) Das Elektronen-Rastermikroskop, Theoretische Grundlagen. Zeitschrift für Physik, 109, 55. [Google Scholar]
- Boccalini G, Sassoli C, Formigli L, Bani D, & Nistri S (2015) Relaxin protects cardiac muscle cells from hypoxia/reoxygenation injury: involvement of the Notch-1 pathway. The FASEB Journal, 29, 239–249. [DOI] [PubMed] [Google Scholar]
- Byrnes JR, & Wolberg AS(2017) Red blood cells in thrombosis. Blood, 130, 1795–1799. [DOI] [PMC free article] [PubMed] [Google Scholar]
- Dyba M, & Hell SW (2003) Photostability of a fluorescent marker under pulsed excited-state depletion through stimulated emission. Applied Optics, 42, 5123–5129. [DOI] [PubMed] [Google Scholar]
- Eddleman KA, Chervenak FA, George-Siegel P, Migliaccio G, & Migliaccio AR (1996) Circulating hematopoietic stem cell populations in human fetuses: implications for fetal gene therapy and alterations with in utero red cell transfusion. Fetal Diagnosis and Therapy, 11, 231–240. [DOI] [PubMed] [Google Scholar]
- Falchi M, Varricchio L, Martelli F, Masiello F, Federici G, Zingariello M, Girelli G, Whitsett C, Petricoin EF 3rd, Moestrup SK, Zeuner A, & Migliaccio AR (2015) Dexamethasone targeted directly to macrophages induces macrophage niches that promote erythroid expansion. Haematologica, 100, 178–187. [DOI] [PMC free article] [PubMed] [Google Scholar]
- Falchi M, Varricchio L, Martelli F, Marra M, Picconi O, Tafuri A, Girelli G, Uversky VN, & Migliaccio AR (2017) The Calreticulin control of human stress erythropoiesis is impaired by JAK2V617F in polycythemia vera. Experimental Hematology, 50, 53–76. [DOI] [PMC free article] [PubMed] [Google Scholar]
- Ferreira R, Wai A, Shimizu R, Gillemans N, Rottier R, von Lindern M, Ohneda K, Grosveld F, Yamamoto M, & Philipsen S (2007) Dynamic regulation of Gata factor levels is more important than their identity. Blood, 109, 5481–5490. [DOI] [PubMed] [Google Scholar]
- Formigli L, Francini F, Tani A, Squecco R, Nosi D, Polidori L, Nistri S, Chiappini L, Cesati V, Pacini A, Perna AM, Orlandini GE, Zecchi Orlandini S, & Bani D (2005) Morphofunctional integration between skeletal myoblasts and adult cardiomyocytes in coculture is favored by direct cell-cell contacts and relaxin treatment. American Journal of Physiology - Cell Physiology, 288, C795–804. [DOI] [PubMed] [Google Scholar]
- Grippo P, Iaccarino M, Parisi E, & Scarano E (1968) Methylation of DNA in developing sea urchin embryos. Journal of Molecular Biology, 36, 195–208. [DOI] [PubMed] [Google Scholar]
- Gustafsson MG (2005) Nonlinear structured-illumination microscopy: wide-field fluorescence imaging with theoretically unlimited resolution. Proceedings of the National Academy of Sciences U.S.A, 102, 13081–13086. [DOI] [PMC free article] [PubMed] [Google Scholar]
- Han GC, Vinayachandran V, Bataille AR, Park B, Chan-Salis KY, Keller CA, Long M, Mahony S, Hardison RC, & Pugh BF (2015) Genome-wide organization of GATA1 and TAL1 determined at high resolution. Molecular and Cellular Biology, 2015, 36, 157–172. [DOI] [PMC free article] [PubMed] [Google Scholar]
- Huang J, Liu X, Li D, Shao Z, Cao H, Zhang Y, Trompouki E, Bowman TV, Zon LI, Yuan GC, Orkin SH, & Xu J (2016) Dynamic control of enhancer repertoires drives lineage and stage-specific transcription during hematopoiesis. Developmental Cell, 36, 9–23. [DOI] [PMC free article] [PubMed] [Google Scholar]
- Knoll M & Ruska E (1932). Das Elektronenmikroskop. Zeitschrift für Physik, 78, 318–339. [Google Scholar]
- Ito Y, Nakamura S, Sugimoto N, Shigemori T, Kato Y, Ohno M, Sakuma S, Ito K, Kumon H, Hirose H, Okamoto H, Nogawa M, Iwasaki M, Kihara S, Fujio K, Matsumoto T, Higashi N, Hashimoto K, Sawaguchi A, Harimoto KI, Nakagawa M, Yamamoto T, Handa M, Watanabe N, Nishi E, Arai F, Nishimura S, & Eto K (2018) Turbulence activates platelet biogenesis to enable clinical scale ex vivo production. Cell, 174, 636–648. [DOI] [PubMed] [Google Scholar]
- Lee J, Li M, Milwid J, Dunham J, Vinegoni C, Gorbatov R, Iwamoto Y, Wang F, Shen K, Hatfield K, Enger M, Shafiee S, McCormack E, Ebert BL, Weissleder R, Yarmush ML, & Parekkadan B (2012) Implantable microenvironments to attract hematopoietic stem/cancer cells. Proceedings of the National Academy of Sciences U.S.A, 109, 19638–19643. [DOI] [PMC free article] [PubMed] [Google Scholar]
- Lefrançais E, Ortiz-Muñoz G, Caudrillier A, Mallavia B, Liu F, Sayah DM, Thornton EE, Headley MB, David T, Coughlin SR, Krummel MF, Leavitt AD, Passegué E, & Looney MR (2017) The lung is a site of platelet biogenesis and a reservoir for haematopoietic progenitors. Nature, 544, 105–109. [DOI] [PMC free article] [PubMed] [Google Scholar]
- Lo Celso C, Lin CP, & Scadden DT (2011) In vivo imaging of transplanted hematopoietic stem and progenitor cells in mouse calvarium bone marrow. Nature Protocols, 6, 1–14. [DOI] [PMC free article] [PubMed] [Google Scholar]
- Manley S, Gillette JM, Patterson GH, Shroff H, Hess HF, Betzig E, & Lippincott-Schwartz J (2008) High-density mapping of single-molecule trajectories with photoactivated localization microscopy. Nature Methods, 5, 155–157. [DOI] [PubMed] [Google Scholar]
- Nicolaides NC, Galata Z, Kino T, Chrousos GP, & Charmandari E(2010) The human glucocorticoid receptor: molecular basis of biologic function. Steroids, 75, 1–12. [DOI] [PMC free article] [PubMed] [Google Scholar]
- Penrose LS, & Penrose R (1958) Impossible objects: a special type of visual illusion. British Journal of Psychology, 49, 31–33. [DOI] [PubMed] [Google Scholar]
- Penter L, & Wu CJ (2020) Personal tumor antigens in blood malignancies: genomics-directed identification and targeting. Journal of Clinical Investigation, 130, 1595–1607. [DOI] [PMC free article] [PubMed] [Google Scholar]
- Rickels R, & Shilatifard A (2018) Enhancer logic and mechanics in development and disease. Trends in Cell Biology, 28, 608–630. [DOI] [PubMed] [Google Scholar]
- Rust MJ, Bates M, & Zhuang X (2006) Sub-diffraction-limit imaging by stochastic optical reconstruction microscopy (STORM). Nature Methods, 3, 793–795. [DOI] [PMC free article] [PubMed] [Google Scholar]
- Schwann T (1839) Mikroskopische Untersuchungen über die Uebereinstimmung in der Struktur und dem Wachsthum der Thiere und Pflanzen: mit 4 Kupfertafeln. Reimer Verlag, Berlin. [PubMed] [Google Scholar]
- Sheets MD, Fox CA, Dowdle ME, Blaser SI, Chung A, & Park S (2017) Controlling the messenger: regulated translation of maternal mRNAs in Xenopus laevis development. Advancements in Experimental Medicine and Biology, 953, 49–82. [DOI] [PMC free article] [PubMed] [Google Scholar]
- Spangrude GJ, Lewandowski D, Martelli F, Marra M, Zingariello M, Sancilio L, Rana RA, & Migliaccio AR (2016) P-selectin sustains extramedullary hematopoiesis in the GATA1 low model of myelofibrosis. Stem Cells, 34, 67–82. [DOI] [PubMed] [Google Scholar]
- Vannucchi AM, Paoletti F, Linari S, Cellai C, Caporale R, Ferrini PR, Sanchez M, Migliaccio G, & Migliaccio AR (2000) Identification and characterization of a bipotent (erythroid and megakaryocytic) cell precursor from the spleen of phenylhydrazine-treated mice. Blood, 95, 2559–2568. [PubMed] [Google Scholar]
- Vannucchi AM, Bianchi L, Paoletti F, Pancrazzi A, Torre E, Nishikawa M, Zingariello M, Di Baldassarre A, Rana RA, Lorenzini R, Alfani E, Migliaccio G, & Migliaccio AR (2005) A pathobiologic pathway linking thrombopoietin, GATA-1, and TGF-beta1 in the development of myelofibrosis. Blood, 105, 3493–3501. [DOI] [PubMed] [Google Scholar]
- Weinreb C, Rodriguez-Fraticelli A, Camargo FD, & Klein AM (2020) Lineage tracing on transcriptional landscapes links state to fate during differentiation. Science, 367, 6479. [DOI] [PMC free article] [PubMed] [Google Scholar]
- Xu Q, & Xie W (2018) Epigenome in early mammalian development: inheritance, reprogramming and establishment. Trends in Cell Biology, 28, 237–253. [DOI] [PubMed] [Google Scholar]