

Abstract
Liquid-liquid phase separation (LLPS) has been invoked as an underlying mechanism involved in the formation and function of several cellular membraneless compartments. Given the explosion of studies in this field in recent years, it has become essential to converge on clear guidelines and methods to rigorously investigate LLPS and advance our understanding of this phenomenon. Here, we describe basic methods to (1) visualize droplets formed by nucleic acid binding proteins and (2) characterize the liquid-like nature of these droplets under controlled in vitro experimental conditions. We discuss the rationale behind these methods, as well as caveats and limitations. Our ultimate goal is to guide scientists interested in learning how to test for LLPS, while appreciating that the field is evolving rapidly and adjusting constantly to the growing knowledge.
Keywords: Liquid-liquid phase separation, biomolecular condensate, dynamics, liquid-like
Introduction
Several compartments and organelles in cells are not surrounded by membranes and, in many cases, their formation has been shown to rely on a process called liquid-liquid phase separation (LLPS) (Banani et al., 2017; Boeynaems et al., 2018). The formation of these assemblies, more recently named biomolecular condensates, is driven by a network of multivalent interactions, often weak and transient, between macromolecules such as proteins and nucleic acids (Shin and Brangwynne, 2017; Li et al., 2012). Phase-separated assemblies are very dynamic, and while they have visually detectable boundaries, most component molecules can readily diffuse within the condensates and exchange with their surroundings (Brangwynne et al., 2011; Feric et al., 2016). At the structural level, proteins undergoing LLPS often contain self-interaction domains, nucleic acid-binding domains, and/or disordered regions (Kato et al., 2012; Elbaum-Garfinkle et al., 2015; Murray et al., 2017; Nott et al., 2015). LLPS provides a useful perspective to understand how specific cellular processes such as transcription, splicing, and stress responses can be compartmentalized in cells in the absence of membranes (Lyon et al., 2020).
The increasing interest in LLPS has revealed the need for robust methods and assays to study biomolecular condensates. Determining a set of specific criteria that could be used to unequivocally define LLPS has been a major challenge. The list of protocols and guidelines for the study of phase separation has been evolving at a fast pace as we learn more about LLPS (Alberti et al., 2018; 2019; Lyon et al., 2020). It seems, therefore, reductionist and inaccurate to strictly define criteria for LLPS based on our current knowledge. Instead, we should aim at exploring LLPS in biology with an open mind, as we discover the complexity and diversity of LLPS systems in cells. For this reason, we propose to take an unbiased approach, which consists of assessing and measuring key properties of condensates and verifying whether such properties are consistent with LLPS or not. Such properties, which include fusion events between phase separated condensates and reversibility of condensate formation, would not be observed if macromolecular assemblies of interest are aggregates and driven instead by irreversible interactions (Alberti et al. 2019).
Here, we describe basic in vitro assays for studying LLPS using the major heterochromatin protein 1 (HP1) from S. pombe, Swi6, as a model system. Swi6 has been shown to form phase-separated droplets with both chromatin and DNA alone. Further, the ability of Swi6 to form phase-separated droplets in vitro has been correlated with its ability to mediate gene silencing in vivo (Sanulli et al., 2019; Larson et al., 2017; Strom et al., 2017). In general, LLPS assays have helped to better understand how HP1 proteins are recruited to chromatin to mediate compaction and gene silencing. While Swi6 forms condensates with DNA and chromatin, other proteins have been shown to form condensates with RNA, whose study can also benefit from the protocols that we describe (Rhine et al., 2020). Therefore, Swi6 provides a well-validated system to discuss parameters and considerations for performing LLPS studies with nucleic acids.
In this article, we describe how to set up and observe phase separated condensates by microscopy (Basic Protocol 1) and how to pre-treat glass surfaces to minimize interactions between the condensate components and the glass (Support Protocol 1). Then, in Basic Protocol 2, we describe a method to test the reversibility of condensates by changing ionic strength, while Alternative Protocols 1 and 2 describe reversibility tests by dilution and temperature, respectively. Finally, Basic Protocols 3 and 4 describe two assays to quantify phase separation by centrifugation and by turbidity, respectively.
Our goal is to provide scientists approaching the field of phase separation with a practical guide for assessing and visualizing LLPS in vitro.
Strategic planning
The protocols described here require the user to have purified the protein and nucleic acid of interest, and determined their concentrations. Purity and homogeneity of macromolecules used in the assay are essential in order to exclude non-specific and contaminant-driven effects. Care should be taken to prevent proteins from phase separating or aggregating during the purification steps. For example, if the protein phase-separates during purification, changing ionic strength may allow for maintaining the protein in a soluble state. For more details on how to optimize purification conditions, please refer to Alberti et al., 2018.
Proteins are usually purified by an affinity tag and often contain a “solubility-enhancing peptide tag” such as MBP and GFP. It is ideal to remove tags at the final step of protein purification as they can interfere with LLPS. If tag removal is not possible, additional controls should be performed to make sure the tag is not altering the biophysical behavior of the protein (such as folding and oligomerization) and LLPS. For example, users can test LLPS of the tag alone and compare the effect of different tags on the protein’s nucleic acid binding activity or LLPS properties. Where technically feasible, showing that the tag does not affect the cellular functions of the protein is also an acceptable control.
The specific protein used here, the heterochromatin protein Swi6, is recombinantly produced in E. coli with a His-TEV site at the N-terminus (Canzio et al., 2013; Sanulli et al., 2019). After purification with cobalt-beads, the His tag is removed by TEV protease cleavage, and Swi6 is further purified by anion exchange and exclusion size chromatography. Protein concentration and purity are assessed by measuring absorbance at 280 nm and by Coomassie gel, respectively. Swi6 at physiological salt conditions (150 mM KCl) does not phase separate and can be stored at high concentrations without demixing or precipitating (Sanulli et al., 2019). Purified Swi6 is typically obtained with little to no nucleic acid contamination, as indicated by a ratio 260 nm/280 nm of ~ 0.5. The 260 nm/280 nm ratio should be monitored for every purification, as nucleic acid contamination can significantly affect LLPS.
To enhance reproducibility of the protocols described below, it is important to identify buffer conditions that prevent or minimize LLPS and non-specific aggregation of the sample during purification and storage. Such conditions are identified by empirically testing the effect of buffer composition on protein solubility (for example, by monitoring aggregate formation and LLPS with the assays described below). For nucleic acid-binding proteins, increased solubility is often achieved by increasing monovalent salt concentration, changing pH to alter the net charge on the protein, or reducing protein concentration. Before performing the methods described here, the protein of interest should be dialyzed into the reaction buffer used in the assays specific to the protein of interest. In the context of Swi6, it is stored at -80 °C in Swi6 buffer (see Reagents and Solutions) with the addition of 10% glycerol. Swi6 is dialyzed overnight in Swi6 Buffer before performing the assays. The DNA we use in the protocol is a 2 kilobase (kbp) double stranded (ds) fragment, which is purified as described in Sanulli et al. 2019 and stored in TE0.5 (see Reagents and Solutions). The same assay can be performed using DNA fragments of different length, RNA, or chromatin fibers (see Critical Parameters for more considerations).
Basic Protocol 1: Observing phase-separated condensates by microscopy
Here, the user will set up the formation of phase-separated condensates in test tubes and image them in a 384-well glass bottom plate. Phase separation of a protein of interest can be induced by different mechanisms. Depending on the origin of the HP1 protein, HP1 phase separation can be induced in different ways: by phosphorylation of a stretch of Serines at the N-terminus (human HP1α), by forming a complex with dsDNA (human HP1α and Swi6), or by forming a complex with chromatin (human HP1α and Swi6) (Sanulli et al., 2019; Larson et al., 2017). We describe here a protocol to induce phase separation by mixing Swi6 (see Strategic Planning) with a 2 kb fragment of dsDNA (Sanulli et al., 2019) and observe dynamic behavior of droplets by imaging fusion and coalescence.
It is preferable to use an inverted light microscope to image condensates, as they settle at the bottom of the glass plate by gravity. Imaging can be done on the glass bottom where droplets settle, or above the glass, in suspension. Care should be taken to hold constant imaging parameters and elapsed time across samples. When setting up the assay at the microscope, using a phase-separated positive control can help to visualize droplets.
This protocol requires PEG-silane coated glass bottom plates, and we describe how to prepare these in Support Protocol 1.
Materials
Swi6 2X stock solution at 8 μM dialyzed over-night in Swi6 Buffer (see Strategic Planning and Reagents and Solutions)
DNA 2X stock solution at 100 ng/μl in TE0.5 (see Strategic Planning and Reagents and Solutions)
TE0.5 (see Reagents and Solutions)
PEG-silane coated glass bottom plate (see Support Protocol 1)
Plate sealing films (Thermo Fisher Scientific, cat. no. AB-0626)
1.5 ml tubes (Axygen, cat. no. MCT-150-NC)
Inverted microscope
Protocol steps
-
In a clean 1.5 ml tube, induce LLPS by mixing 1 volume of Swi6 2X stock solution with 1 volume of DNA 2X stock solution. For the reaction, about 15 μl of each solution is sufficient. Pipet gently, avoiding bubbles.
After mixing the two solutions, the sample will contain 4 μM Swi6 and 50 ng/μl of DNA in Phase Separation Buffer (see Reagents and Solutions).
-
Prepare, as negative controls, the following in separate tubes: (i) 30 μl of Phase Separation Buffer alone, (ii) 30 μl Swi6 alone in one phase, generated by mixing 15 μl of Swi6 2X solution with 15 μl of TE0.5, and (iii) 30 μl DNA alone in one phase, generated by mixing 15 μl of DNA 2X solution with 15 μl of Swi6 buffer.
If testing, for the first time, whether a macromolecular assembly undergoes LLPS, it is helpful to include a positive control by using a known phase-separating system, such as Swi6.
-
Mix the solutions in each of the four tubes (one sample and three negative controls) gently, making sure the samples are homogeneous, before moving to Step 4.
Make sure the dense phase is not settled at the bottom of the tube.
-
Transfer 20 μl from each tube into three separate wells of a PEG-silane coated plate (Support Protocol 1). Seal wells with a film to prevent sample evaporation.
The samples are now ready for imaging.
Collect few (3-5) representative bright-field images with a 20X objective at the microscope, 30 minutes, 1 hour, and 24 hours after inducing LLPS (Fig. 1).
-
Look for fusion events amongst droplets, and collect movies or sequential snapshots, as shown in Figure 2.
Swi6-DNA assemblies form phase-separated droplets, while in the negative controls, molecules should remain in solution in one phase. After fusion events, droplets quickly relax back to spherical shape. The observation of dynamic and fusing spherical droplets is consistent with LLPS.
Figure 1. Time course experiment of Swi6-DNA condensates.
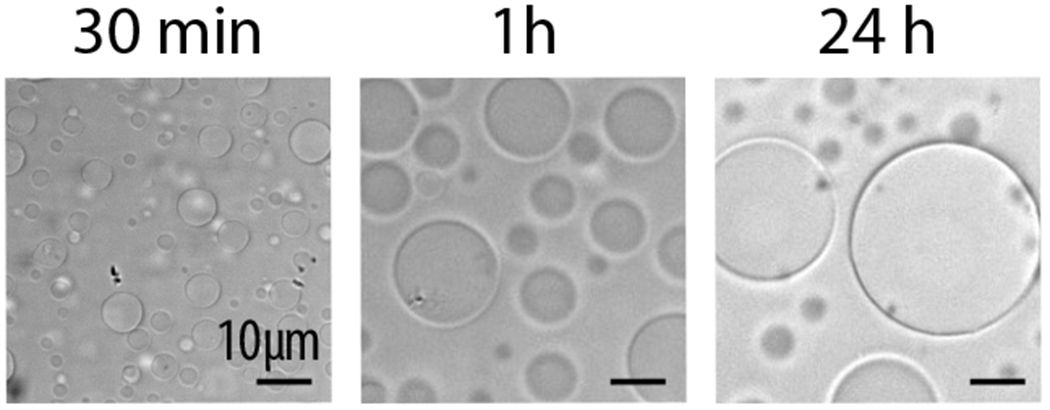
After inducing LLPS, sample is imaged at the indicated times. Early time points show droplets still in suspension. Over time, droplets settle at the bottom of the well and fuse, resulting in larger condensates.
Figure 2. Snapshots of a fusion event between two phase-separated droplets.
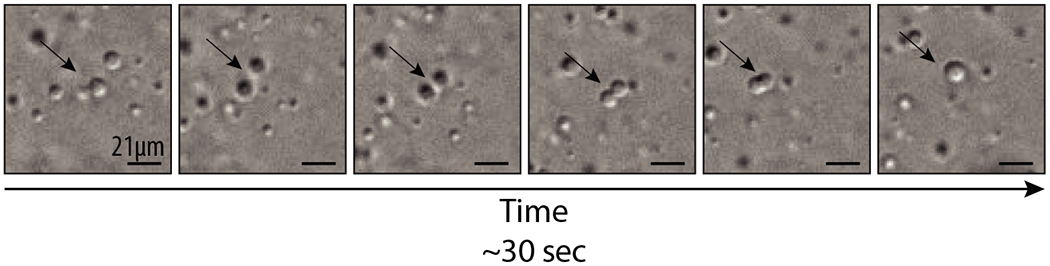
Phase separation was induced by mixing arrays of 12 nucleosomes and Swi6 protein Images reproduced from Sanulli et al., 2019. Arrow points to the fusion event.
Support Protocol 1: Coating of Glass-bottom plate
Condensates are observed in glass-bottom plates that have been treated to minimize the interactions between the glass surface and the droplets (Fig. 3). The treatment preserves condensate properties longer and facilitates imaging and analysis. While a few different methods have been proposed (Alberti et al., 2018), here we describe glass passivation with Poly Ethylene Glycol silane (PEG-Silane). The passivation is started the day before the plates are required for a phase separation assay. It is advised to passivate plates freshly before each assay for best reproducibility.
Figure 3. Effects of PEG-silane coating of glass surface.
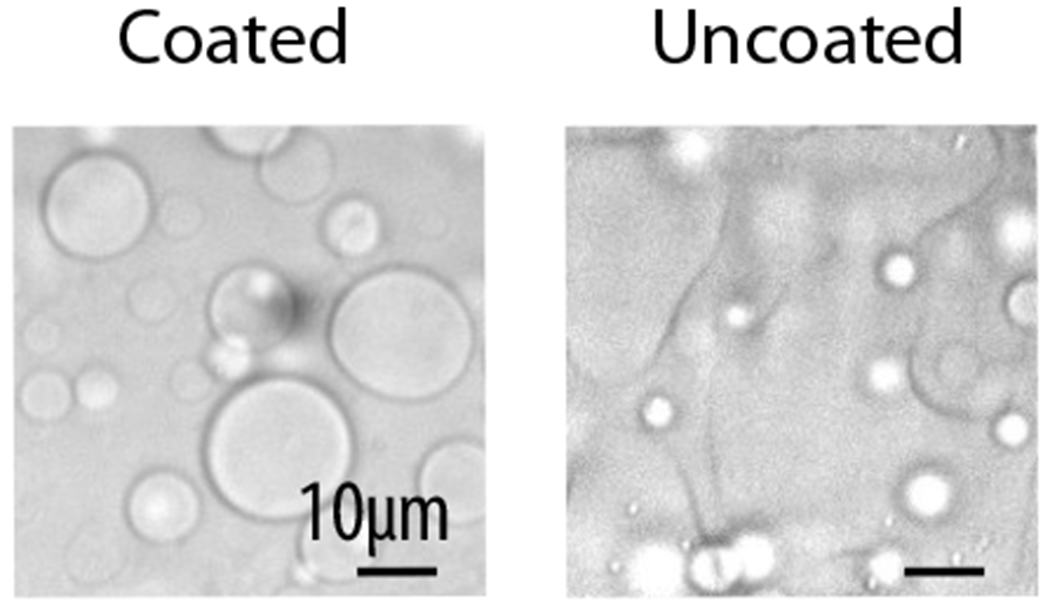
Left panel shows condensates on a coated slide, where droplets remain spherical. Right panel shows condensates on an uncoated slide, where droplets wet on the glass and change their morphology, becoming harder to image.
Materials
dH2O
2% Hellmanex III solution (Millipore Sigma, cat. no. Z805939–1EA)
0.5M NaOH filtered with 0.2 μm filter
PEG-Silane solution (see Reagents and Solutions)
BSA 100 mg/ml filtered with 0.2 μm filter (RPI, cat. no. 9048-46-8).
95% ethanol solution
Phase Separation buffer (see Reagents and Solutions)
Glass bottom plates 384 wells (Greiner Sensoplate™ cat. no. 781892)
Plate sealing films (Thermo Fisher Scientific, cat. no. AB-0626)
Aluminum foil
Protocol steps
-
1.
Rinse two times with dH2O the number of wells you are planning to need for the assay described in Basic Protocol 1, by adding and removing the dH2O.
-
2.
Add 100 μl of 2% Hellmanex III solution. Let sit for 30 minutes to 1 hour at room temperature.
-
3.
Remove the 2% Hellmanex III solution and rinse wells three times with 100 μl dH2O by adding and removing the dH2O.
-
4.
Add 100 μl of 0.5M NaOH. Let sit for 30 minutes at room temperature.
-
5.
Remove 0.5M NaOH and rinse wells three times with 100 μl dH2O.
-
6.
Add 50 μl per well of PEG-silane solution.
-
8.
Seal the plate with the film and cover in aluminum foil to protect from light. Let sit over-night away from light at room temperature.
-
9.
The next day, remove the PEG-silane solution from the wells. Rinse wells three times with 100 μl of 95% ethanol solution. To prevent drying of the plate, leave ~10 μl of 95% ethanol solution at the bottom of each well.
It is important to keep the wells from drying, so you should always leave a small volume of 95% ethanol solution in the plates.
-
10.
Remove the ethanol and rinse wells three times with 100 μl dH2O by adding and removing the dH2O. To prevent drying of the plate, leave ~10 μl at the bottom of each well.
It is important to keep the wells from drying, so you should always leave a volume of water in the plates.
Make sure the PEG-silane solution has been fully washed out before switching wells into dH2O, otherwise it will form a precipitate in water.
-
11.
Add 50 μl of 100 mg/mL BSA. Let sit for 30 minutes at room temperature.
-
12.
Remove the BSA and rinse at least three times with 100 μl dH2O. Avoid letting the plate dry in between washes.
Be careful of leftover BSA, as this can affect the assay results.
-
13.
Rinse twice with 100 μl of Phase Separation buffer. Leave the buffer inside until you are ready to transfer your sample; store the plate at room temperature in the meantime. When ready to transfer the sample into the plate (e.g. from Basic Protocol 1, Step 4), remove all the buffer in the well and transfer the sample quickly.
Make sure to remove all of the Phase Separation buffer before you add the sample to avoid any change in the reaction volume.
Basic Protocol 2: Assessing condensate reversibility by changing ionic strength.
A property of condensates formed by LLPS is that they are reversible and can dissolve when the weak intermolecular interactions that drive their formation are weakened. Therefore, to test whether a macromolecular assembly is formed by LLPS, reversibility assays are often performed by changing variables such as ionic strength, pH, molecule concentration, and temperature. These parameters can promote or inhibit LLPS depending on the type of molecular interactions that drive the specific condensate of interest. Below, we describe a common method to test reversibility of Swi6-DNA condensates by varying ionic strength using buffers with different KCl concentrations and observing changes in droplets formation. Swi6-DNA condensates described in Basic Protocol 1 are in Phase Separation Buffer at 75 mM KCl. To cover a large range of ionic strength, the user will test three additional salt concentrations: 50 mM, 200 mM, and 700 mM. A different and broader range of concentrations can be tested if desired. Alternative approaches to test reversibility by changing molecule concentration and temperature are described in Alternative Protocol 1 and 2, respectively. It is common to assess reversibility by changing at least two parameters, for example salt (described here in Basic Protocol 2) and protein concentration (described in Alternate Protocol 1). Other approaches are often used, such as the treatment with the chemical 1,6-hexenediol (Kroschwald et al. 2018). The use of this chemical that disrupts hydrophobic interactions has been controversial and should, therefore, be used with caution (see more details in the Commentary section).
Materials
Freshly generated Swi6-DNA condensates, as described in Basic Protocol 1, Step 1.
Phase Separation Buffer (see Reagents and Solutions)
Phase Separation Buffer- 450 (see Reagents and Solutions)
Phase Separation Buffer- 1950 (see Reagents and Solutions)
Phase Separation Buffer-0 (see Reagents and Solutions)
PEG-silane coated glass bottom plate (see Support Protocol 1)
Plate sealing films (Thermo Fisher Scientific, cat. no. AB-0626)
Inverted microscope
Protocol Steps
-
To test the effects of three salt concentrations, prepare four identical Swi6-DNA samples and transfer 20 μl of each of these samples to separate wells of a PEG-silane coated slide, as described in steps 1, 3, 4 from Basic Protocol 1. Three of the samples will be used to change final salt concentration and one sample will be used as a control for the dilution factor.
It is important to control for the dilution factor, as phase separation is concentration dependent. If the dilution factor you introduce in the experiment dissolves the condensates of your protein of interest, repeat the experiment with a higher protein concentration.
Increase salt concentration to 200 mM KCl by adding, to one of the 4 wells, 10 μl of Phase Separation Buffer- 450 and mix gently.
Increase ionic strength to 700 mM by adding, to another of the 4 wells, 10 μl of Phase Separation Buffer-1950 and mix gently.
Decrease salt concentration to 50 mM by adding, to yet another of the 4 wells, 10 μl of Phase Separation Buffer-0 and mix gently.
As control for the dilution factor, add 10 μl of Phase Separation Buffer into the remaining well and mix gently.
Seal the plate with a film to prevent sample evaporation.
-
Wait for 30 minutes and collect a few representative (3-5) bright field images of the condensates at the microscope with a 20X objective, always controlling across samples for elapsed time since induction of LLPS.
Users should observe salt-dependent reversible changes in condensate formation, for example changes in condensates size and fusion. Users will also start to appreciate the type of interactions involved in the formation of the condensate of interest. For example, if LLPS is promoted by increasing salt concentration, it suggests that hydrophobic interactions dominate the energetics. On the contrary, if LLPS is inhibited by increasing salt concentration, it suggests that electrostatic interactions dominate the energetics.
Alternate Protocol 1: Assessing condensates reversibility by dilution
Another way to evaluate LLPS is to test whether the process is concentration dependent. Indeed, once the sample is diluted to below the critical concentration (CC), defined as the concentration above which the system switches from a one-phase to a two-phase regime, condensates will dissolve. Concentration dependency assays are often coupled to other tests, such as the one described in Basic Protocol 2 and Alternate Protocol 2. In this section, we describe how to perform serial dilution of Swi6-DNA condensates and observe changes in condensate formation. It is important to make sure that buffer composition is kept constant during the dilution and that only Swi6 and DNA concentrations are diluted. The dilution factor should be determined experimentally for each specific condensate. It is good practice to start with two-fold serial dilutions.
Materials
30 μl of Swi6-DNA condensates generated as described in Basic Protocol 1, step 1
Phase Separation Buffer (see Reagents and Solutions)
PEG-silane coated glass bottom plate (see Support Protocol 1)
Inverted microscope
Protocol steps
Transfer 20 μl of freshly made Swi6-DNA condensates into a PEG-silane coated plate and image at the microscope, as described in Basic Protocol 1, Steps 3-5.
-
Induce a two-fold dilution, by adding 20 μl of Phase Separation Buffer. Mix gently and collect few representative (3-5) bright-field images of the condensates at the microscope with a 20X objective 20 minutes after buffer addition.
Users might observe variation in the condensate size.
-
Add 40 μl of Phase Separation Buffer to the same well for an additional two-fold dilution. Mix gently and once again collect bright-field images of the condensates at the microscope with a 20X objective 20 minutes after buffer addition.
Users should perform as many dilutions as necessary to identify the condition that reverse LLPS for every specific condensate.
Once the sample is diluted below the critical concentration required for LLPS, condensates will dissolve and the sample will go back in one phase. Figure 4 shows an example of Swi6-medited condensates that are reversed upon 4-fold dilution.
Figure 4. Swi6-mediated condensates are reversible and dissolve upon dilution.
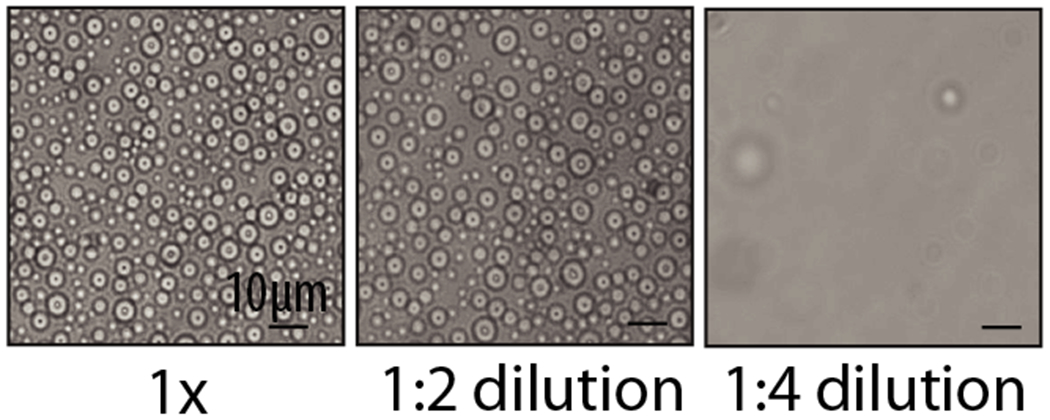
Image reproduced from Sanulli et al., 2019.
Alternate Protocol 2: Assessing condensate reversibility by altering temperature
Phase separation is often modulated by temperature, which can affect inter- and intra-molecular interactions that drive LLPS (Urry et al., 1992). Changes in temperature can promote or inhibit phase separation, as well as modulate the physico-chemical properties of phase-separated condensates. Therefore, it is common to test the effects of temperature changes on phase separation and look for modulation of droplets formation. Here, we describe a method to assess the effect of temperature change on phase-separated condensates that consists of observing condensates under the microscope after switching temperature from 22 °C to 4 °C and 37 °C.
Materials
30 μl of Swi6-DNA condensates, generated as described in Basic Protocol 1, step 1
PEG-silane coated glass bottom plate (see Support Protocol 1)
Plate sealing films (Thermo Fisher Scientific, cat. no. AB-0626)
Inverted microscope with temperature control stage
Protocol steps
Set the temperature of the microscope chamber to 22 °C
Gently transfer 20 μl of Swi6-DNA condensates into the PEG-silane coated slides as described in Basic Protocol 1, steps 3, 4.
Seal the plate with a film to prevent sample evaporation.
Transfer the plate immediately to the microscope chamber in which temperature has been set to 22 °C.
Incubate at 22 °C for 20 minutes and collect bright-field images of the condensates at the microscope with a 20X objective.
-
Evaluate the consequences of lower temperature (for example 4 °C) and higher temperatures (for example, 37 °C or 40 °C). Incubate at the desire temperature for 20 minutes before collecting bright-field images of the condensates at the microscope with a 20X objective.
It can be useful to test a temperature that is close to the physiological conditions of the model system of interest.
Upon temperature change, the user might observe changes in condensate formation, size, or ability to fuse. Such changes depend on the type of interactions that enable LLPS. For example, Swi6-mediated condensates do not show any major change when incubated at 4 °C, 22 °C, or 37 °C.
Basic Protocol 3: Quantifying phase separation by centrifugation assay
Microscopic analysis provides mainly a qualitative analysis of LLPS and, thus, quantitative assays are often used in conjunction with microscopy to measure LLPS and compare condensates. Here, we describe the centrifugation assay as a reliable and simple method to measure Swi6-mediated phase separation of DNA. This approach relies on the fact that, upon LLPS, light and dense phases can be separated by simple centrifugation. Measurement of the concentration of molecules that remain in solution by spectroscopy provides a quantitative measurement of LLPS (Elbaum-Garfinkle et al., 2015; Mackenzie et al., 2017; Wang et al., 2018; Sanulli et al.2019). In this protocol, LLPS is induced by adding increasing concentrations of Swi6, and LLPS is quantified by measuring (at 260 nm) the amount of DNA present in solution. The same assay can also be performed by varying condensate composition or buffer conditions. Importantly, this assay should always be performed together with microscopic analysis to verify the formation of condensates. In addition, if the condensate contains one major component, the concentration of such a component can be accurately measured in the supernatant by spectroscopy, at 280 nm for protein and 260 nm for nucleic acids. However, if multiple components form the condensate, determining which component remains in solution becomes unclear, and a labeling scheme (for example, the use of fluorescently-labeled DNA) must be introduced to discriminate between the different components. In this case, the fluorophore concentration in solution is measured.
Materials
Swi6 stock solutions at 8 μM, 4 μM, 3 μM, and 2 μM dialyzed over-night in Swi6 Buffer (see Strategic Planning and Reagents and Solutions)
DNA 2X stock solution at 100 ng/μl in TE0.5 (see Reagents and Solutions)
1.5 ml tubes (Axygen, cat. no. MCT-150-NC)
Swi6 Buffer (see Reagents and Solutions)
TE0.5 (see Reagents and Solutions)
UV-vis spectrophotometer reader for microvolumes (e. g. Nanodrop)
Tabletop centrifuge
Protocol steps
Prepare four 1.5 ml tubes tubes containing 15 μl each of the different Swi6 stock solution (8 μM, 4 μM, 3 μM, or 2 μM).
Add to each tube 15 μl of DNA 2X stock solution.
In another clean 1.5 ml tube, prepare 15 μl of DNA 2X stock solution and add 15 μl of Swi6 Buffer. This will be the reference for 100% solubility (no LLPS), as DNA is in solution under the described conditions in the absence of Swi6.
-
Prepare four more 1.5 ml tubes containing 15 μl each of the different Swi6 stock solution (8 μM, 4 μM, 3 μM, or 2 μM). This time add 15 μl of TE0.5 instead of DNA to each tube. These samples are used to verify the contribution of Swi6 to the 260 nm absorbance.
At the used Swi6 concentration (4 μM final maximum concentration), Swi6 does not significantly contribute to the detected absorbance at 260 nm. At higher Swi6 concentrations, Swi6 will contribute to the 260 nm absorbance reading, affecting the interpretation of the data. If this issue occurs, one component should be labeled with a fluorophore.
-
Mix the solution gently and incubate at room temperature for 20 minutes.
The Swi6-DNA complex undergoes LLPS and is stable at room temperature. The assay can be performed at different temperatures if desired to modulate LLPS or sample stability.
Centrifuge in a tabletop centrifuge for 10 minutes at 10,000 g at the same temperature the incubation was performed (in this case, room temperature).
Remove samples from the centrifuge gently, taking care not to disrupt the dense phase now sedimented at the bottom of the tube.
-
Measure the concentration of DNA present in solution by reading at 260 nm in the NanoDrop or similar spectrophotometer. Perform three measurements, each time removing sample gently from the meniscus of the tube, to avoid mixing the two phases.
It is important that the A260 reading used in the assay is within the instrument linear range (usually 0.1–1). For example, at the final concentration of DNA used here (50 ng/μl), A260 should be ~1.
-
For each Swi6-DNA sample, calculate the amount of DNA remaining in solution as compared to the DNA alone sample, using this formula:
% of DNA soluble = (A260sample x100)/ A260DNA Alone
-
To calculate mean and standard deviations for the amount of soluble DNA, perform at least 3 independent biological replicates by generating condensates from different stock reagents for Swi6 and DNA. Plot the % of DNA soluble on y-axis as a function of Swi6 concentration on the x-axis. The amount of DNA present in solution will decrease as LLPS is induced. The Swi6 concentration at which 50% of DNA sediments (C50) can be used to quantify LLPS.
Figure 5 shows an example of centrifugation assays in the presence of increasing amounts of Swi6 using different types of chromatin, wild type (WT) or mutant. The difference in C50 between the two plotted data sets highlights how the assay can be used to quantify and compare LLPS.
Figure 5. Centrifugation assay.
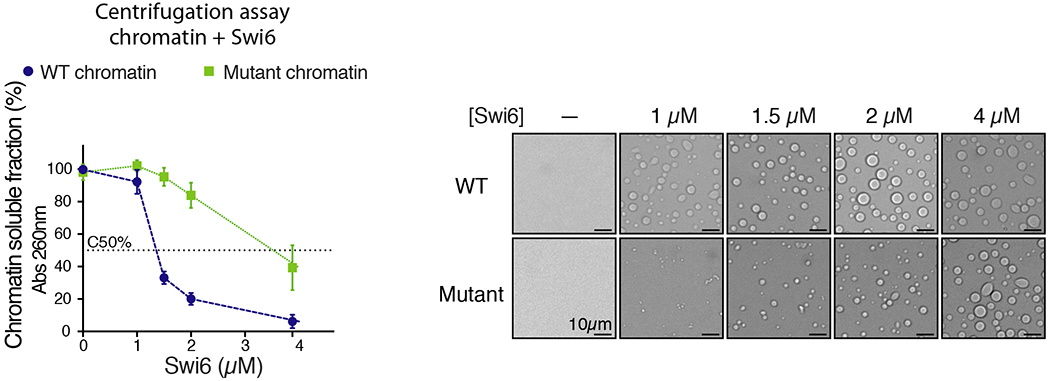
The sedimentation of Swi6-chromatin assemblies is measured with increasing Swi6 concentration in presence of two types of chromatin, WT and mutant. Left panel: y-axis shows the chromatin in solution after centrifugation, as measured by absorbance at 260 nm. X-axis shows Swi6 concentration. The right panels show bright-field microscopy images of the Swi6-chromatin samples in the left panel. Microscopy analysis should always be performed in conjunction with centrifugation assays to assess the formation of condensates. Changes in chromatin solubility correlate with droplet formation. This example highlights how changes in condensates compositions (WT vs mutant chromatin) regulate LLPS, as measured by C50. Data shown represent mean and standard deviation of at least three independent experiments. Figure reproduced from Sanulli et al., 2019.
Basic Protocol 4: Quantifying phase separation by turbidity assay
An additional method to quantify LLPS in vitro relies on sample turbidity. In solution, large macromolecular assemblies of 10s to 100s of nanometers in diameter scatter visible light causing turbidity that can be quantified by measuring optical density at 340 nm. However, since turbidity reports on all kinds of macromolecular assemblies, this method should always be used in conjunction with microscopy to verify the presence of phase-separated droplets and exclude the presence of aggregates or fibers that can also contribute to the readings measured in this assay. Generally, an increase in sample turbidity correlates with a decrease of sample in solution as measured by centrifugation assay. In this protocol, users will induce LLPS by adding increasing concentration of Swi6 as described in Basic Protocol 3, and quantify sample turbidity by measuring absorbance at 340 nm.
Materials
Swi6 stock solutions at 8 μM, 4 μM, 3 μM, and 2 μM dialyzed over-night in Swi6 Buffer (see Strategic Planning and Reagents and Solutions)
DNA 2X stock solution at 100 ng/μl in TE0.5 (see Reagents and Solutions)
1.5 ml tubes (Axygen, cat. no. MCT-150-NC)
Swi6 Buffer (see Reagents and Solutions)
TE0.5 (see Reagents and Solutions)
Clear bottom 384 well plate
Microplate reader
Protocol steps
Prepare samples as described in Basic Protocol 3, steps 1-5.
Mix gently and transfer 20 μl of each sample to a clear-bottom 384 well plate.
Add 20 μl of Phase Separation Buffer to a separate well, to use as negative control.
Seal the plate with a film to prevent sample evaporation.
Read at 340 nm in a plate reader.
-
To calculate mean and standard deviations, perform at least 3 independent biological replicates by generating condensates from different stock reagents for Swi6 and DNA. Plot A340 on y-axis as a function of Swi6 concentration on the x-axis.
As phase separation is induced, A340 will increase, as shown in Figure 6.
Figure 6. Turbidity assay.

Turbidity of Swi6-chromatin assemblies is measured with increasing Swi6 concentration in the presence of two types of chromatin, WT and mutant. Y-axis shows turbidity measured by the absorbance at 340 nm; x-axis shows Swi6 concentration. Data shown represent mean and standard deviation of at least three independent experiments. The increase in turbidity correlates with the decrease in chromatin solubility reported in Figure 5.
Reagents and Solutions
Phase Separation Buffer: 10 mM Hepes pH 7.8, 75 mM KCl, 0.5 mM DTT, 5 mM Tris-HCl, 0.25 mM EDTA.
Phase Separation Buffer-450: 10 mM Hepes pH 7.8, 450 mM KCl, 0.5 mM DTT, 5 mM Tris-HCl, 0.25 mM EDTA.
Phase Separation Buffer-1950: 10 mM Hepes pH 7.8, 1950 mM KCl, 0.5 mM DTT, 5 mM Tris-HCl, 0.25 mM EDTA.
Phase Separation Buffer-0: 10 mM Hepes pH 7.8, 0.5 mM DTT, 5 mM Tris-HCl, 0.25 mM EDTA.
Swi6 Buffer: 20 mM Hepes pH 7.8, 150 mM KCl, 1 mM DTT.
TE0.5: 10 mM Tris-HCl, 0.5 mM EDTA pH 8.
PEG-Silane solution: 20mg/mL PEG-Silane (Laysan Bio, Inc., MPEG-SIL-5000–1g) in 95% ethanol.
Commentary
Background Information
Since the first report of phase separation in biology in 2009 (Brangwynne et al., 2009), major progress has been made in understanding the molecular and physico-chemical determinants of the process (Lyon et al., 2020). Given that many biological macromolecules can undergo phase separation in vitro under certain conditions, it has become important to describe in vitro methods to test for LLPS in a rigorous and yet generally accessible way. The in vitro assays described here, both qualitative and quantitative, are an essential step to understand the formation of a condensate of interest, as these allow users to carefully control condensate composition, molecular concentration, and buffer conditions.
Another major advantage of studying reconstituted condensates in vitro is the possibility of dissecting the molecular interactions driving LLPS by introducing specific mutations within molecules that form condensates (Sanulli et al., 2019). In general, point mutations are preferable and more informative than deletion of whole protein domains. However, the design of mutations is still very challenging in the context of LLPS, since it is often difficult to identify mutants that uncouple LLPS from macromolecule function.
While procedures to study LLPS in vitro have been more clearly defined, how to assess the physiological relevance of LLPS remains a major challenge. On one hand, this is partially due to the challenge of developing in vivo quantitative methods that are broadly adoptable. On the other hand, recent reports show that the diversity and complexity of condensates can give rise to properties that deviate from minimalist phase separation rules that apply to one- or two-components systems, especially in vivo (Riback et al., 2020; McSwiggen et al., 2019). This is likely due to the complexity of the cellular milieu, as well as the variety of heterotypic interactions within multi-component condensates in cells, whose composition can change with time (Riback et al., 2020; Wang et al., 2018). This suggests that in vitro studies of simplified macromolecular assemblies cannot always be used to extrapolate in vivo functional relevance.
In conclusion, in vitro studies of LLPS remain an essential step to further understand phase separation in biology and to guide in vivo functional studies (Mitrea et al., 2018; McSwiggen et al., 2019; Riback et al., 2020). Nevertheless, the use of in vitro approaches should be adjusted as knowledge progresses, with the overall intent to gain insights into the molecular mechanisms and function of LLPS in biology. A major goal for the future is to assess whether the physico-chemical rules of LLPS that have been established for one- or two-components system can be applied to multi-component LLPS systems driven by heterotypic interactions, systems that most likely better represent LLPS in cells.
Critical Parameters
The protocols described here use Swi6 and 2 kb dsDNA as a model system. It should be kept in mind that this is a simplified system that enables exploration of the role of Swi6-DNA interactions in LLPS. However, in vivo DNA is folded around histones to form nucleosome chains, and data have shown differences between Swi6-DNA vs. Swi6-chromatin condensates, including differences in the critical concentration required for phase separation, size of condensates, and the cooperativity of the process (Sanulli et al., 2019). Therefore, the chromatinization of the DNA template could affect LLPS in multiple ways, for example, by regulating the interaction of the DNA-binding protein with DNA and by inducing a conformational change in the protein itself. Finally, the length of dsDNA and chromatin should also be considered as key elements that modulate the properties of condensates (Gibson et al., 2019; Keenen et al., 2020).
Phase separation is extremely sensitive to physico-chemical conditions, including protein concentration, pH, temperature, and ionic strength (Nott et al., 2015). When performing in vitro phase separation assays, it is, therefore, essential to carefully control such conditions for the reproducibility and quality of the assay. The choice of buffer and macromolecular concentrations should be taken into account and should try to mimic physiological conditions when possible.
The addition of synthetic crowding agents such as glycerol, polyethylene glycol, and dextran has been used to mimic the crowded cellular milieu. However, how crowding agents promote phase separation is unclear, and they might not be inert toward the macromolecules used in the assay (Alberti et al., 2019). Consequently, crowders should be used with caution and, if employed, it is good practice to perform additional controls and test different types of crowders to exclude specific chemical effects.
The presence of additives such as DTT, ATP, and BSA can also affect LLPS (Strickfaden et al., 2020; Patel et al., 2017). In general, it is ideal to test phase separation in different comparable buffers. For example, if you have used potassium chloride, also try sodium chloride or potassium acetate. It is preferable to dialyze the macromolecules over-night into the assay buffer to carefully control for buffer conditions.
Phase separation can be induced either in a test tube and then the sample can be carefully transferred into the PEG-silane coated glass plate, or it could be induced directly in the plate. In the first case, attention should be taken to make sure all the sample is transferred to the plate and that the dense and heavier phase does not remain at the bottom of the test tube. In the second case, the sample should be mixed very gently into the well of the plate. Mixing in the plate can be preferred if the sample is unstable and difficult to handle.
Pay attention to not introduce air bubbles in the sample and to not scratch or damage the plate coating, as it can affect LLPS and, in some cases, induce sample aggregation (Alberti et al., 2018). Once condensates are formed, samples should be observed shortly after (~20-30 minutes) and then progressively over time (see below). It is good practice to test the stability of the components after the assay, for example, by analyzing an aliquot of the sample via a Coomassie stained gel. If degradation has occurred, this should be taken into account in the interpretation of the results.
Condensates should be imaged at a constant time after LLPS is induced, for various reasons. First, droplet-settling at the bottom of the glass plate depends on droplet density. Differences in settling time can result in under- or over-estimation of LLPS, as condensates can appear different if imaged in suspension or at the bottom of the plate. Second, depending on their viscoelasticity, droplets can fuse over time and become larger. Third, condensates can change their material properties over time, for example, they can undergo a liquid-to-gel transition. In this case, droplets fail to fuse or, once fused, they are not able to relax into a spherical shape. The rate and type of change can vary widely depending on the molecular composition of the condensates and buffer conditions (Patel et al., 2015). In these liquid-to-gel transitions, it is unclear what is occurring at the molecular level, and the physiological relevance of this observation is not well understood. However, such a transition indicates a change in the molecular interactions within the condensate. For all the above-described reasons, it is of critical importance to monitor the time elapsed after LLPS and to perform experiments using freshly prepared phase-separated condensates. It is also useful to perform time course experiments that can span from few hours to days to observe how material properties change over time.
Troubleshooting
Table 1 describes how to overcome the most common issues faced in the herein described LLPS studies.
Table 1.
Troubleshooting for LLPS in vitro assay.
| Condensate formation issues (Basic Protocol 1) | Possible cause | Solution |
|---|---|---|
| Formation of non-droplet aggregates | • Instability and degradation of protein and/or nucleic acid. • Air bubbles introduced while pipetting. • Damage of the glass plate or incorrect coating. • Samples does not undergo LLPS. |
• Optimize molecule purification and experimental conditions (salt, glycerol, temperature). • Use a positive control that undergoes LLPS. • Mix gently, avoid harsh pipetting. • Repeat plate coating, paying attention to not damage the glass. • Replicate results with different protein and/or nucleic acid stocks. |
| Non-spherical droplets | • Defective glass coating. • Unstable condensates with weaker inter-molecular interactions that tend to interact with the glass plate. • Samples does not undergo LLPS. |
• Repeat plate coating, paying attention not to damage the glass. • Use freshly opened PEG-silane stock. • Test different coating methods (for example lipid-coating) (Alberti et al. 2018). • Use a positive control that undergoes LLPS. |
| No droplets observed | • Sample does not undergo LLPS. • Strong wetting to the glass surface. |
• Use a positive control that undergoes LLPS. • Repeat plate coating or try a different coating method. • Test other buffer conditions and molecule concentrations. |
| Data reproducibility issues in all protocols | Possible Cause | Solution |
| Lack of reproducibility in condensate formation and/or quantitative assays | • Macromolecules have impurities, are not homogeneous, or are unstable. • Poor control of experimental conditions (salt, pH, temperature, additive). |
• Improve macromolecular purification and storage conditions. • Carefully control each experimental step and use same stock of buffers for solution preparations. |
Understanding Results
LLPS can give rise to condensates that are highly dynamic. Such dynamics can be observed at two scales. At the droplets scale, liquid-like condensates can fuse, coalesce, and drip based on their surface tension (Widom, 1988). At the molecular scale, the weak inter-molecular interactions enable rapid internal molecular dynamics, and components can often freely diffuse within the dense phase and between the light and dense phases (Hyman and Brangwynne, 2011; Hyman et al., 2014; Li et al., 2012). Therefore, a criterion often used to define LLPS is the observation of fusion events among droplets, while macromolecular aggregates will not be able to fuse and relax into spherical shape. Droplet fusion can be visualized as described in Basic Protocol 1 and by collecting movies or sequential snapshots (Fig. 2). The timescale of the fusion event can be useful information to record, as this might change across different condensates or over time, indicating differences in the viscoelastic properties of condensates. Fusion events are usually easily observed early after inducing LLPS and they tend to diminish over time as the system reaches equilibrium. However, we must remember that fusion and diffusion are not strict criteria, since biomolecular assemblies formed by LLPS can adopt a continuum of material properties (Weber and Brangwynne, 2012; Alberti and Hyman, 2016). In addition, liquid-like condensates can undergo further material transitions. For example, depending on the molecular composition or concentration, droplets can undergo liquid-to-gel or liquid-to-solid transitions, losing their ability to fuse (Kato et al., 2012; Murray et al., 2017).
The dynamics and diffusion of molecules within the condensates or across the light and dense phase can be evaluated by fluorescently labeling the protein and/or nucleic acid, and by observing exchange of molecules across the condensate by fluorescent microscopy or, in a more quantitative manner, by performing Fluorescence Recovery After Photobleaching (FRAP) experiments (Brangwynne et al., 2009; Taylor et al., 2019). However, in some cases, it has been reported that light used for bleaching can cause cross-linking and induce gelation or aggregation (Alberti et al., 2019). This caveat should be kept in mind for correct data interpretation.
Importantly, phase separation can be driven by different types of interaction, including electrostatic, hydrophobic, cation-π, and π -π (Das et al. 2020). In addition to assessing whether the macromolecular assemblies of interest result in LLPS in vitro, the described protocols should also provide a preliminary understanding of the types of interactions driving LLPS. For example, inhibition of LLPS by increasing salt concentration suggests that electrostatic interactions dominate the energetics. Instead, if LLPS is favored by increasing salt concentration, it indicates that hydrophobic interactions dominate the energetics.
The aliphatic alcohol 1,6-hexanediol has been widely used to probe for phase separation (Kroschwald et al. 2018). However, it is important to note that 1,6-hexanediol disrupts hydrophobic interactions and, therefore, affects only condensates whose formation is driven by hydrophobic interactions. Further, particular caution should be taken to interpret in vivo data, because 1,6-hexanediol changes cell membrane permeability and can cause side effects and artifacts (Alberti et al. 2019).
Upon verification of all troubleshooting aspects detailed in Table 1, users should be able to assess whether their system of interest undergoes LLPS. If users fail to observe LLPS and yet detect other properties that could indicate LLPS, for example in vivo formation of dynamic foci, this might indicate that assays are not performed under the conditions that enable LLPS and/or that the protein of interest is not the major driver of LLPS (for instance other molecular components might be required to induce LLPS).
Time Considerations
The time required for the purification of recombinant macromolecules such as proteins and nucleic acids is variable depending on the system. For instance, recombinant expression and purification of Swi6 requires about 8 to 10 days, while 2 kb dsDNA requires about 5 to 6 days (see Strategic Planning and Sanulli et al. 2019). Coating of glass-bottomed plates takes about 4-5 hours plus an over-night incubation. Once the plates and macromolecular reagents are ready, each microscopy-based or quantitative assay can be completed within a few hours.
Acknowledgements:
We thank members of the Narlikar laboratory for the many stimulating discussions over the years that have helped in formulating this protocol. This work was supported by NIH grant R35 GM127020 to G.J.N. The supporting source had no involvement in protocol design and in the collection, analysis and interpretation of the data.
Footnotes
CONFLICT OF INTEREST STATEMENT
The authors declare no conflict of interest.
DATA AVAILABILITY STATEMENT
The data, tools and material (or their source) that support the protocol are available from the corresponding author upon reasonable request.
Literature cited
- Alberti S, and Hyman AA 2016. Are aberrant phase transitions a driver of cellular aging? BioEssays : news and reviews in molecular, cellular and developmental biology 38:959–968. [DOI] [PMC free article] [PubMed] [Google Scholar]
- Alberti S, Gladfelter A, and Mittag T 2019. Considerations and Challenges in Studying Liquid-Liquid Phase Separation and Biomolecular Condensates. Cell 176:419–434. [DOI] [PMC free article] [PubMed] [Google Scholar]
- Alberti S, Saha S, Woodruff JB, Franzmann TM, Wang J, and Hyman AA 2018. A User’s Guide for Phase Separation Assays with Purified Proteins. Journal of molecular biology 430:4806–4820. [DOI] [PMC free article] [PubMed] [Google Scholar]
- Banani SF, Lee HO, Hyman AA, and Rosen MK 2017. Biomolecular condensates: organizers of cellular biochemistry. Nature reviews. Molecular cell biology 18:285–298. [DOI] [PMC free article] [PubMed] [Google Scholar]
- Boeynaems S, Alberti S, Fawzi NL, Mittag T, Polymenidou M, Rousseau F, Schymkowitz J, Shorter J, Wolozin B, Van Den Bosch L, et al. 2018. Protein Phase Separation: A New Phase in Cell Biology. Trends in cell biology 28:420–435. [DOI] [PMC free article] [PubMed] [Google Scholar]
- Brangwynne CP, Eckmann CR, Courson DS, Rybarska A, Hoege C, Gharakhani J, Jülicher F, and Hyman AA 2009. Germline P granules are liquid droplets that localize by controlled dissolution/condensation. Science (New York, N.Y.) 324:1729–1732. [DOI] [PubMed] [Google Scholar]
- Brangwynne CP, Mitchison TJ, and Hyman AA 2011. Active liquid-like behavior of nucleoli determines their size and shape in Xenopus laevis oocytes. Proceedings of the National Academy of Sciences of the United States of America 108:4334–4339. [DOI] [PMC free article] [PubMed] [Google Scholar]
- Canzio D, Liao M, Naber N, Pate E, Larson A, Wu S, Marina DB, Garcia JF, Madhani HD, Cooke R, et al. 2013. A conformational switch in HP1 releases auto-inhibition to drive heterochromatin assembly. Nature 496:377–381. [DOI] [PMC free article] [PubMed] [Google Scholar]
- Das S, Lin YH., Vernon RM, Forman-Kay JD, Chan HS. 2020. Comparative roles of charge, π, and hydrophobic interactions in sequence-dependent phase separation of intrinsically disordered proteins. Proceedings of the National Academy of Sciences of the United States of America 17(46):28795–28805. [DOI] [PMC free article] [PubMed] [Google Scholar]
- Elbaum-Garfinkle S, Kim Y, Szczepaniak K, Chen CC-H, Eckmann CR, Myong S, and Brangwynne CP 2015. The disordered P granule protein LAF-1 drives phase separation into droplets with tunable viscosity and dynamics. Proceedings of the National Academy of Sciences of the United States of America 112:7189–7194. [DOI] [PMC free article] [PubMed] [Google Scholar]
- Feric M, Vaidya N, Harmon TS, Mitrea DM, Zhu L, Richardson TM, Kriwacki RW, Pappu RV, and Brangwynne CP 2016. Coexisting Liquid Phases Underlie Nucleolar Subcompartments. Cell 165:1686–1697. [DOI] [PMC free article] [PubMed] [Google Scholar]
- Gibson BA, Doolittle LK, Schneider MWG, Jensen LE, Gamarra N, Henry L, Gerlich DW, Redding S, and Rosen MK 2019. Organization of Chromatin by Intrinsic and Regulated Phase Separation. Cell 179:470–484.e21. [DOI] [PMC free article] [PubMed] [Google Scholar]
- Hyman AA, and Brangwynne CP 2011. Beyond stereospecificity: liquids and mesoscale organization of cytoplasm. Developmental cell 21:14–16. [DOI] [PubMed] [Google Scholar]
- Hyman AA, Weber CA, and Jülicher F 2014. Liquid-liquid phase separation in biology. Annual Review of Cell and Developmental Biology 30:39–58. [DOI] [PubMed] [Google Scholar]
- Kato M, Han TW, Xie S, Shi K, Du X, Wu LC, Mirzaei H, Goldsmith EJ, Longgood J, Pei J, et al. 2012. Cell-free formation of RNA granules: low complexity sequence domains form dynamic fibers within hydrogels. Cell 149:753–767. [DOI] [PMC free article] [PubMed] [Google Scholar]
- Keenen MM, Brown D, Brennan LD, Renger R, Khoo H, Carlson CR, Huang B, Grill SW, Narlikar GJ, and Redding S 2021. HP1 proteins compact DNA into mechanically and positionally stable phase separated domains. eLife 10: e64563. [DOI] [PMC free article] [PubMed] [Google Scholar]
- Kroschwald S, Munder MC., Maharana S, Franzmann TM, Richter D, Ruer M, Hyman AA, and Alberti S. (2018). Different Material States of Pub1 Condensates Define Distinct Modes of Stress Adaptation and Recovery. Cell Reports 23, 3327–3339. [DOI] [PubMed] [Google Scholar]
- Larson AG, Elnatan D, Keenen MM, Trnka MJ, Johnston JB, Burlingame AL, Agard DA, Redding S, and Narlikar GJ 2017. Liquid droplet formation by HP1α suggests a role for phase separation in heterochromatin. Nature 547:236–240. [DOI] [PMC free article] [PubMed] [Google Scholar]
- Li P, Banjade S, Cheng H-C, Kim S, Chen B, Guo L, Llaguno M, Hollingsworth JV, King DS, Banani SF, et al. 2012. Phase transitions in the assembly of multivalent signalling proteins. Nature 483:336–340. [DOI] [PMC free article] [PubMed] [Google Scholar]
- Lyon AS, Peeples WB, and Rosen MK 2020. A framework for understanding the functions of biomolecular condensates across scales. Nature reviews. Molecular cell biology 18:285–21. [DOI] [PMC free article] [PubMed] [Google Scholar]
- McSwiggen DT, Hansen AS, Teves SS, Marie-Nelly H, Hao Y, Heckert AB, Umemoto KK, Dugast-Darzacq C, Tjian R, and Darzacq X 2019. Evidence for DNA-mediated nuclear compartmentalization distinct from phase separation. eLife 8:2503. [DOI] [PMC free article] [PubMed] [Google Scholar]
- Mitrea DM, Chandra B, Ferrolino MC, Gibbs EB, Tolbert M, White MR, and Kriwacki RW 2018. Methods for Physical Characterization of Phase-Separated Bodies and Membrane-less Organelles. Journal of molecular biology 430:4773–4805. [DOI] [PMC free article] [PubMed] [Google Scholar]
- Murray DT, Kato M, Lin Y, Thurber KR, Hung I, McKnight SL, and Tycko R 2017. Structure of FUS Protein Fibrils and Its Relevance to Self-Assembly and Phase Separation of Low-Complexity Domains. Cell 171:615–627.e16. [DOI] [PMC free article] [PubMed] [Google Scholar]
- Nott TJ, Petsalaki E, Farber P, Jervis D, Fussner E, Plochowietz A, Craggs TD, Bazett-Jones DP, Pawson T, Forman-Kay JD, et al. 2015. Phase transition of a disordered nuage protein generates environmentally responsive membraneless organelles. Molecular cell 57:936–947. [DOI] [PMC free article] [PubMed] [Google Scholar]
- Patel A, Lee HO, Jawerth L, Maharana S, Jahnel M, Hein MY, Stoynov S, Mahamid J, Saha S, Franzmann TM, et al. 2015. A Liquid-to-Solid Phase Transition of the ALS Protein FUS Accelerated by Disease Mutation. Cell 162:1066–1077. [DOI] [PubMed] [Google Scholar]
- Patel A, Malinovska L, Saha S, Wang J, Alberti S, Krishnan Y, and Hyman AA 2017. ATP as a biological hydrotrope. Science (New York, N.Y.) 356:753–756. [DOI] [PubMed] [Google Scholar]
- Rhine K, Vidaurre V, and Myong S 2020. RNA droplets. Annual Review of Byophysics 49:247–265. [DOI] [PMC free article] [PubMed] [Google Scholar]
- Riback JA, Zhu L, Ferrolino MC, Tolbert M, Mitrea DM, Sanders DW, Wei M-T, Kriwacki RW, and Brangwynne CP 2020. Composition-dependent thermodynamics of intracellular phase separation. Nature 581:209–214. [DOI] [PMC free article] [PubMed] [Google Scholar]
- Sanulli S, Trnka MJ, Dharmarajan V, Tibble RW, Pascal BD, Burlingame AL, Griffin PR, Gross JD, and Narlikar GJ 2019. HP1 reshapes nucleosome core to promote heterochromatin phase separation. Nature 29:220. [DOI] [PMC free article] [PubMed] [Google Scholar]
- Shin Y, and Brangwynne CP 2017. Liquid phase condensation in cell physiology and disease. Science (New York, N.Y.) 357:eaaf4382. [DOI] [PubMed] [Google Scholar]
- Strickfaden H, Tolsma T, Sharma A, Underhill DA, Hansen JC, and Hendzel MJ 2020. Condensed chromatin behaves like a solid on the mesoscale in vitro and in living cells. bioRxiv 78:2020.05.06.079905. [DOI] [PubMed] [Google Scholar]
- Strom AR, Emelyanov AV, Mir M, Fyodorov DV, Darzacq X, and Karpen GH 2017. Phase separation drives heterochromatin domain formation. Nature 547:241–245. [DOI] [PMC free article] [PubMed] [Google Scholar]
- Taylor NO, Wei M-T, Stone HA, and Brangwynne CP 2019. Quantifying Dynamics in Phase-Separated Condensates Using Fluorescence Recovery after Photobleaching. Biophysical journal 117:1285–1300. [DOI] [PMC free article] [PubMed] [Google Scholar]
- Urry DW, Gowda DC, Parker TM, Luan CH, Reid MC, Harris CM, Pattanaik A, and Harris RD 1992. Hydrophobicity scale for proteins based on inverse temperature transitions. Biopolymers 32:1243–1250. [DOI] [PubMed] [Google Scholar]
- Wang J, Choi J-M, Holehouse AS, Lee HO, Zhang X, Jahnel M, Maharana S, Lemaitre R, Pozniakovsky A, Drechsel D, et al. 2018. A Molecular Grammar Governing the Driving Forces for Phase Separation of Prion-like RNA Binding Proteins. Cell 174:688–699.e16. [DOI] [PMC free article] [PubMed] [Google Scholar]
- Weber SC, and Brangwynne CP 2012. Getting RNA and protein in phase. Cell 149:1188–1191. [DOI] [PubMed] [Google Scholar]
- Widom B 1988. Scaling of the surface tension of phase-separated polymer solutions. Journal of Statistical Physics 53:523–529. [Google Scholar]