

SUMMARY
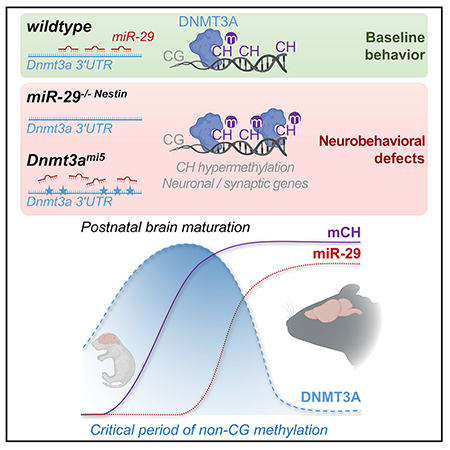
Although embryonic brain development and neurodegeneration have received considerable attention, the events that govern postnatal brain maturation are less understood. Here, we identify the miR-29 family to be strikingly induced during the late stages of brain maturation. Brain maturation is associated with a transient, postnatal period of de novo non-CG (CH) DNA methylation mediated by DNMT3A. We examine whether an important function of miR-29 during brain maturation is to restrict the period of CH methylation via its targeting of Dnmt3a. Deletion of miR-29 in the brain, or knockin mutations preventing miR-29 to specifically target Dnmt3a, result in increased DNMT3A expression, higher CH methylation, and repression of genes associated with neuronal activity and neuropsychiatric disorders. These mouse models also develop neurological deficits and premature lethality. Our results identify an essential role for miR-29 in restricting CH methylation in the brain and illustrate the importance of CH methylation regulation for normal brain maturation.
Graphical abstract
In brief
Non-canonical CH methylation mediated by DNMT3A during neuronal maturation has been recently shown to be critical for brain homeostasis. Swahari et al. identify a key player that is critical for regulating CH methylation: the microRNA miR-29. Failure of miR-29 to regulate the expression of Dnmt3a leads to severe neurobehavioral consequences.
INTRODUCTION
Although there is considerable knowledge surrounding brain development (e.g., neurogenesis, neuronal migration, and postmitotic differentiation), less is known about how the brain matures after this period and how brain homeostasis is maintained throughout adulthood. During brain maturation, widespread changes in synaptic connectivity are evident (Jiang and Nardelli, 2016; Stiles and Jernigan, 2010), and perturbations of synaptic development or maturation can result in severe neurobehavioral sequelae as seen in autism spectrum disorders (ASD), epilepsy, and schizophrenia (Bourgeron, 2015; Forsyth and Lewis, 2017; McTague et al., 2016; Toga et al., 2006).
MicroRNAs (miRNAs), which have the potential to post-transcriptionally silence hundreds of genes, are already known to modulate neurodevelopment (Petri et al., 2014; Sun and Shi, 2015) and neurodegeneration (Abe and Bonini, 2013; Juźwik et al., 2019). Accordingly, specific miRNAs that regulate neuronal activity and synaptic function in established neurons have been identified (Dubes etal., 2019; Edbauer et al., 2010; Schratt et al., 2006; Siegert et al., 2015). However, whether there are miRNAs that are selectively induced and functionally important during postnatal brain maturation is unknown.
Several recent studies have identified a critical period during postnatal mammalian brain development during which there is a dramatic increase in the methylation of the neuronal genome at non-canonical (non-CG) CH sequences (Chen etal., 2015; Gabel et al., 2015; Guo et al., 2014; He and Ecker, 2015; Kinde et al., 2015; Lister et al., 2013; Mo et al., 2015; Xie et al., 2012). This period of de novo CH methylation (where H = A, C, T) starts at birth and persists for 1–4 weeks in mice and 1–15 years in humans (Lister et al., 2013). During this maturation stage, deposition of these methyl-CH (mCH) marks have been hypothesized to regulate neuronal diversity by fine-tuning gene transcription across the genome (Chen et al., 2015; Luo et al., 2017; Rizzardi et al., 2019; Stroud et al., 2017).
CH methylation is catalyzed by the DNA methyltransferase DNMT3A (Gabel et al., 2015; Guo et al., 2014). The time course of mCH deposition in postnatal neurons is tightly controlled such that the level of DNMT3A that are elevated during early brain maturation sharply decline several weeks after birth (Feng et al., 2005; Lister et al., 2013). This decrease in DNMT3A results in a cessation in the deposition of additional mCH and may be essential for proper brain maturation (Lister et al., 2013). The importance of strict control of CH methylation is emphasized by the association of mutations in DNMT3A, as well as in the methyl-binding proteins that bind to mCH (e.g., MeCP2 and the MBD family), with devastating disorders of postnatal brain development, including ASD, epilepsy, and intellectual disability (Gigek et al., 2016; Liu et al., 2018a, 2018b; Lombardi et al., 2015; Tatton-Brown et al., 2014; Yuen et al., 2016). However, the mechanisms that control the repression of DNMT3A expression to regulate CH methylation during postnatal brain development have not yet been identified, and the consequences of unrestricting this critical period of CH methylation remain unclear.
Dnmt3a is known to be targeted by several miRNAs. For example, miR-370 and miR-495 regulate Dnmt3a expression during embryonic development and stem cell differentiation (Qi et al., 2013; Yang et al., 2014), and miR-132 and miR-143 modulate Dnmt3a expression in neurodevelopmental disorders and nerve injury, respectively (Miller et al., 2012; Xu et al., 2017). Additionally, miR-29 regulates Dnmt3a expression in multiple situations including embryonic development, cancer, and other pathologies. In particular, in the context of the nervous system, miR-29-regulated Dnmt3a expression has been associated with neuronal differentiation (Xi et al., 2017), tumorigenesis (Xu et al., 2015), and ischemic injury (Pandi et al., 2013). However, whether the downregulation of Dnmt3a following the critical period of CH methylation during postnatal brain maturation is regulated by miRNAs is unknown.
Here, we conducted an unbiased screen to identify miRNAs that are specifically induced during postnatal brain maturation. We found all three members of the miR-29 family to be highly induced during this period. Conditional deletion of all three miR-29 members in the brain resulted in the dysregulation of DNMT3a and CH hypermethylation that was associated with severe neurological dysfunction and premature lethality. Using a novel Dnmt3a mouse model, we then precisely assessed the direct consequences of disrupting the targeting of Dnmt3a by miR-29 in vivo. Our results identify miR-29 as an essential regulator of CH methylation via its targeting of Dnmt3a and define the importance of restricting CH methylation to a critical period during brain maturation.
RESULTS
miR-29 is the most upregulated miRNA during postnatal brain development
To screen for miRNAs that are induced during brain maturation, we examined the mouse cerebellum, because the timeline for cerebellar postnatal development is well defined. Cerebellar granule neuron precursors undergo rapid proliferation and complete their differentiation into cerebellar granule neurons by postnatal day 18 (P18) (Hatten and Roussel, 2011).Thus, we probed for miRNAs that are differentially expressed between young (P18) and adult (P250) cerebellum. We found that the most upregulated miRNAs in the adult belonged to the miRNA-29 (miR-29) family, which were strikingly increased ∼50-to 70-fold (Figure 1A; Table S1). The miR-29 family consists of three members—miR-29a, miR-29b, and miR-29c—that are expressed from two genomic loci: miR-29ab1 and miR-29b2c (Kriegel et al., 2012). Quantitative PCR analysis for miR-29b, which is expressed from both loci, confirmed that miR-29 expression was markedly increased during late cerebellar maturation (Figure 1B). This increase in miR-29b expression is even more evident in the cortex where the expression of miR-29 is very low during the embryonic period (between E13.5 and P0) but increases substantially postnatally (Li et al., 2014) (starting at P7, Figure 1C). Importantly, although miR-29b shows the highest fold induction, all three miR-29 family members were markedly induced during postnatal cortical maturation (Figures 1D–1F), as seen in the cerebellum (Figure 1A).
Figure 1. miR-29 is sharply upregulated during postnatal brain maturation and is essential for normal postnatal development.
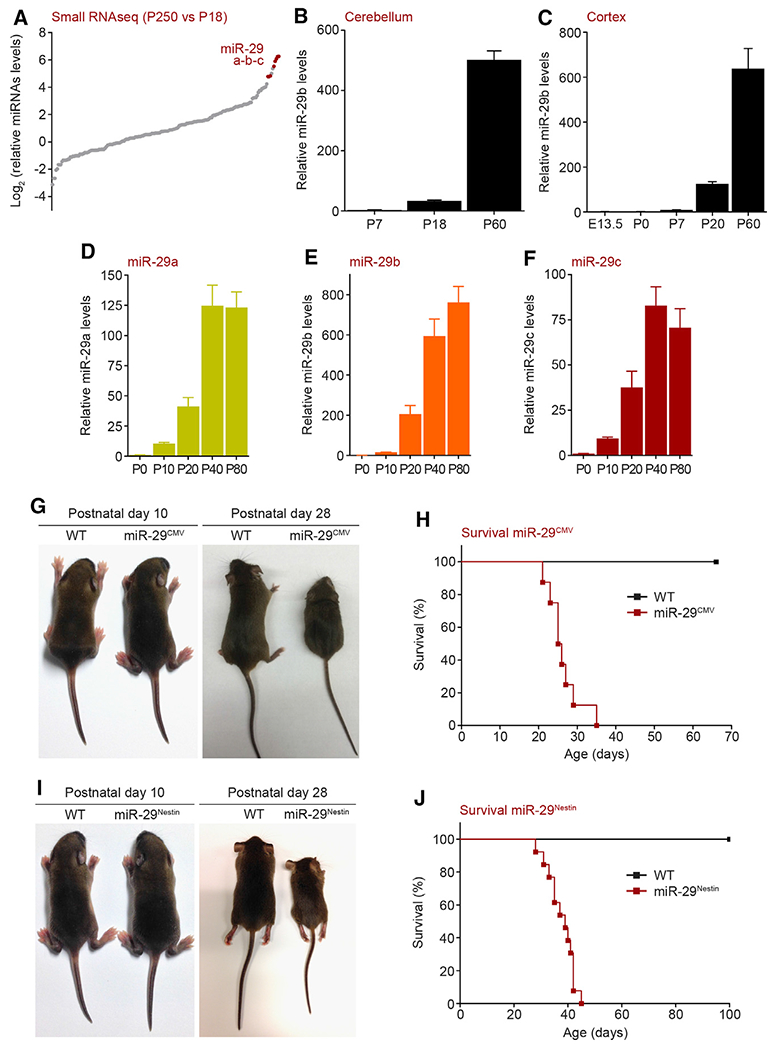
(A) Small RNA sequencing of postnatal P250 versus P18 WT mouse cerebellum.
(B) Quantitative PCR (normalized to U6) analysis of miR-29b levels in the developing WT mouse cerebellum (n = 3). Fold change of miRNA levels compared to P7 are represente.
(C) Quantitative PCR (normalized to U6) analysis of miR-29b levels in the developing WT mouse cortex (n = 3). Fold change of miRNA levels compared to E13.5 are represented.
(D–F) Quantitative PCR (normalized to U6) analysis of miR-29a(D), miR-29b (E), and miR-29c (F) levels in the developing WT mouse cortex (n = 4). Fold change of miRNA levels compared to P0 are represented.
(G) Pictures of WT (left) and miR-29ab1f/f, miR-29b2cf/f, CMV-Cre (miR-29CMV) knockout mice (right) at postnatal P10 and P28.
(H) Kaplan-Meier survival curve of miR-29CMV knockout mice (WT, miR-29CMV n = 8; miR-29CMV median survival: 25.5 days).
(I) Pictures of WT (left) and miR-29ab1f/f, miR-29b2cf/f, Nestin-Cre (miR-29Nestin) knockout mice (right) at postnatal P10 and P28.
(J) Kaplan-Meier survival curve of miR-29Nestin knockout mice (WT n = 12; miR-29Nestin n = 13; miR-29Nestin median survival: 39 days).
Means ± SEM are shown, value n represents the number of independent animals used. See also Figure S1 and Table S1.
miR-29 expression in the brain is essential for normal postnatal development
To examine whether miR-29 is functionally important during brain maturation in vivo, we generated mice that were floxed for both alleles of miR-29. Specifically, miR-29ab1f/f and miR-29b2cf/f mice were crossed together such that all three members of the miR-29 family could be deleted in the presence of a Cre recombinase. Mice deleted for miR-29, either globally (with CMV-Cre-expressing mice; miR-29CMV) or selectively in the brain (with Nestin-Cre-expressing mice; miR-29Nestin), were born at the expected Mendelian ratio, appeared normal at birth, and were indistinguishable from wild-type (WT) littermate controls at postnatal day 10. However, starting at 10 days, the miR-29 knockouts began to exhibit retarded growth, with all mice dying by 45 days of age (Figures 1G–1J and S1A–S1D). Partial deletion of miR-29 from either locus also resulted in lethality by 150 days (Figure S1E). Importantly, consistent with the finding that miR-29 is not expressed during the stages of early brain development, complete deletion of miR-29 in either the miR-29CMV or miR-29Nestin mouse brains did not result in noticeable apoptosis or gross developmental brain malformations at P30 (Figures S1F and S1G).
Deletion of miR-29 in the brain elicits severe neurobehavioral abnormalities
Partial inactivation of miR-29ab1 was previously shown to result in motor dysfunction (Papadopoulou et al., 2015; Roshan et al., 2014). Thus, we examined the behavioral deficits of brain-selective miR-29-deleted mice (P30–P40). Loss of miR-29 in the brain led to ataxic movements and motor deficits, including hindlimb clasping as well as deficits in wire hanging and rotarod tests (Figures 2A, 2B, S2A, and S2B). These mice also demonstrated many features seen in mouse models of neurodevelopmental disorders. For example, the miR-29Nestin mice exhibited repetitive, excessive self-grooming behavior by 20 days of age that led to facial hair loss and self-inflicted ulcerative skin lesions (Figures 2C and 2D; Video S1). Additionally, these mice were hyperactive in open field analyses with an increase in the total distance traveled as well as greater fine movements, a measure of stereotypic behavior (Figures 2E and S2C). miR-29Nestin mice also spent significantly more time in the center region of the open field, suggesting a loss of cautionary avoidance of a novel open area (Figure 2F). The miR-29Nestin mice displayed impaired sensorimotor gating in an acoustic startle test (Figure S2D). Importantly, we observed spontaneous seizures in a subset of these mice that subsequently led to their death. Thus, we examined whether miR-29-deficient mice were more susceptible to kainic acid-induced seizures. All miR-29Nestin mice underwent tonic-clonic seizures and died within 25 min after kainic acid injection, while none of the WT mice sustained seizures or died with the same dose of kainic acid (Figures 2G, 2H, and S2E). Together, these findings show that loss of miR-29 leads to numerous neurobehavioral abnormalities, including an increased risk of seizures.
Figure 2. miR-29 deficiency in the brain results in neurological deficits and susceptibility to seizures.
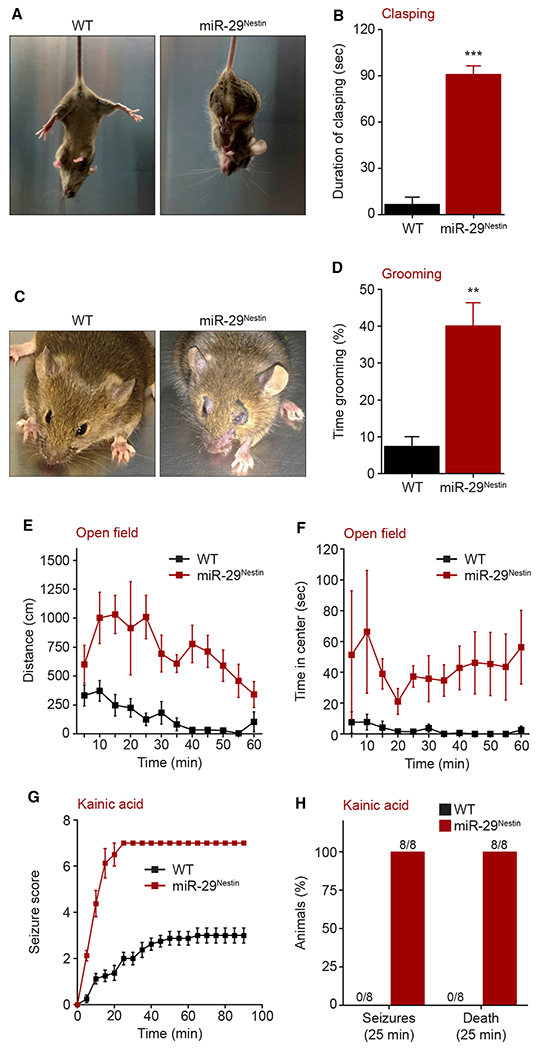
(A and B) Pictures (A) and quantification (B) of hindlimb clasping duration upon tail suspension (90 s) of WT and miR-29Nestin knockout mice (WT, miR-29Nestin n = 4; unpaired, two-tailed Student’s t test ***p < 0.0001).
(C and D) Pictures of facial lesions (C) and time spent grooming (D) over 30-min test (WT n = 4, miR-29Nestin n = 3; unpaired, two-tailed Student’s t test **p = 0.0028).
(E and F) Total distance traveled (E) and time spent in the center (F) of an open field chamber (60-min trial) (WT, miR-29Nestin n = 7; repeated-measures ANOVA, [E] total distance traveled: genotype effect F[1,12] = 52.28, ***p < 0.0001; [F] time spent in the center: genotype effect F [1,12] = 10.51, **p = 0.0071).
(G) Seizure score following intraperitoneal injection of kainic acid (30 mg/kg). The behavioral scores were 1: hypoactivity; 2: head nodding; 3: anterior clonus; 4: loss of balance or repeated falling; 5: severe tonic–clonic seizures; 6, jumping; and 7: death (WT, miR-29Nestin n = 8; two-tailed nonparametric Mann-Whitney test: ***p < 0.0001).
(H) Quantification of seizures and death 25 min after intraperitoneal injection of kainic acid (30 mg/kg) (WT, miR-29Nestin n = 8).
Behaviors and seizures were analyzed at P30–P40. Means ± SEM are shown, value n represents the number of independent animals used, **p = 0.01–0.001, ***p < 0.001. See also Figure S2 and Video S1.
miR-29 deficiency results in the downregulation of many neuronal genes
To gain insight into the specific pathways affected in the miR-29-deficient mice, we conducted an RNA sequencing (RNA-seq) analysis of WT and miR-29Nestin cortices and found 2,823 annotated genes to be differentially expressed (false discovery rate [FDR] <0.1) (Figure 3A; Table S2). As expected from the knockout of a miRNA, many genes were upregulated. Indeed, an unbiased query identified miR-29 as the miRNA predicted to target the largest number of upregulated genes in this gene set (e.g., of the 1,346 upregulated genes, 245 genes are predicted direct targets of miR-29) (Figure 3B; Table S2). Rather unexpectedly, however, miR-29 deletion also resulted in the downregulation of a similarly large number of genes (1,477 genes downregulated) (Figure 3A; Table S2). Importantly, a pathway analysis revealed that, unlike the upregulated genes, the downregulated genes were most significantly associated with many neuronal functions, including axon guidance and synaptic transmission (Figures 3C , 3D, and S3A; Table S2). This set of downregulated genes is also associated with a variety of neuropsychiatric disorders such as autism, schizophrenia, and epilepsy, consistent with the observed behavioral deficits (Figures 3E and S3B; Table S2). These results suggest that the genes downregulated in the miR-29-deficient brains, which are unlikely to be direct targets of miR-29, are associated with the neurological dysfunction observed in the miR-29Nestin mice.
Figure 3. Downregulated genes are involved in neuronal functions in miR-29-deficient brains.
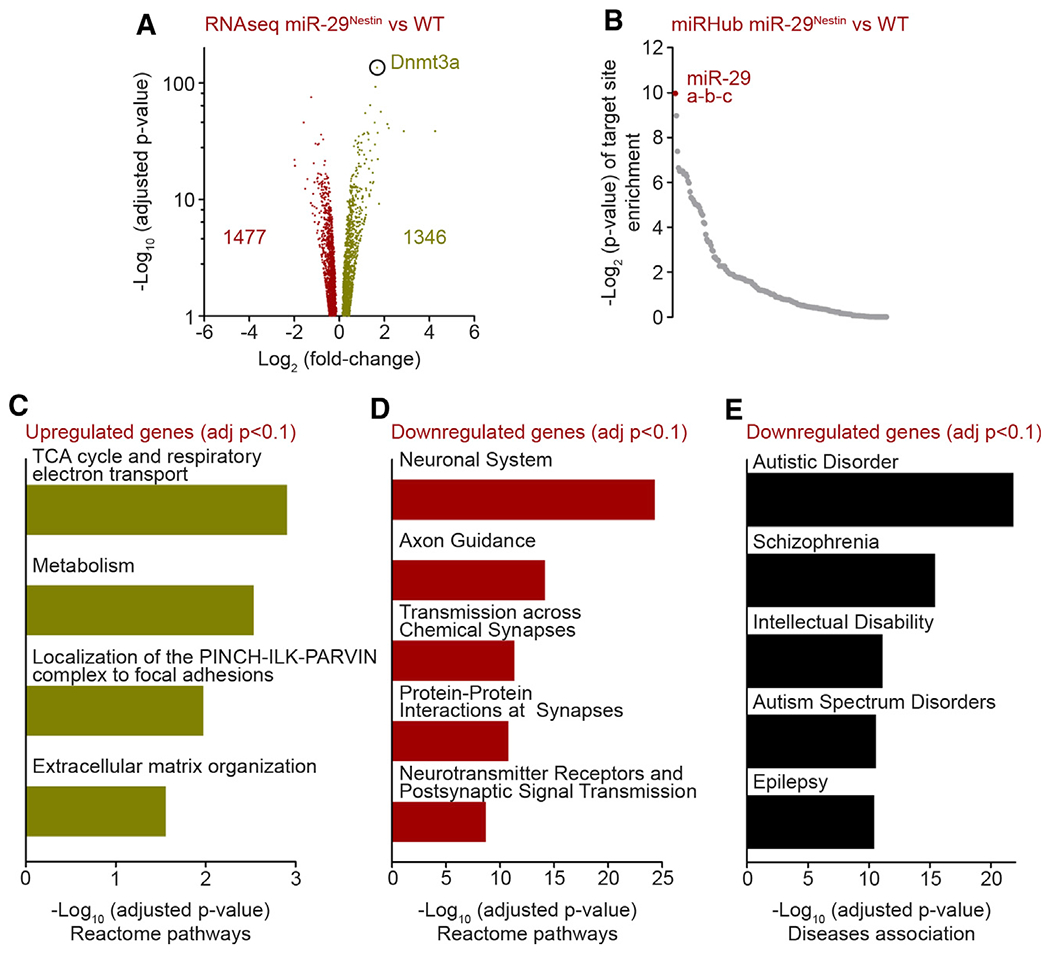
(A) Volcano plot of differentially expressed genes (DESeq2 adjusted p value [adj.p] <0.1) obtained from RNA-seq analysis of P40 WT and miR-29Nestin mice cortex (WT, miR-29Nestin n = 3). Value n represents the number of independent animals used.
(B) MiRHub analysis of upregulated genes in miR-29Nestin cortex compared to WT cortex. The targeting score for each miRNA was normalized to the 3′ UTR length of the genes of interest.
(C and D) Reactome pathway (top terms) analysis of differentially expressed genes in miR-29Nestin cortex.
(E) DisGeNET disease association (top terms) analysis of downregulated genes in miR-29Nestin cortex.
miR-29-deficient brains have increased DNMT3A expression and CH hypermethylation of neuronal genes
To determine how miR-29 deficiency could result in reduced neuronal gene expression, we examined whether any of the direct targets of miR-29 could modulate gene transcription. Among the top ten upregulated genes in the miR-29-deficient brains was the DNA methyltransferase Dnmt3a (Table S2), which can epigenetically regulate gene expression. Dnmt3a expression is known to be tightly regulated in the postnatal brain where it is induced at birth and then sharply declines several weeks later (Feng et al., 2005; Lister et al., 2013). However, the mechanisms that repress DNMT3A expression have not yet been identified. Interestingly, the marked increase in miR-29 starting at P20 coincides with the selective and sharp decrease in Dnmt3a expression that occurs during this period (Figures S4A–S4C) (Feng et al., 2005; Lister et al., 2013). Dnmt3a is known to have multiple evolutionarily conserved miR-29-binding sites in its 3’ UTR (Figure S4D) and has been shown to be targeted by miR-29 (Fabbri et al., 2007; Pandi et al., 2013; Xu et al., 2015). Consistent with the upregulation of Dnmt3a detected by RNA-seq in miR-29Nestin cortex, we found the DNMT3A protein to be markedly elevated in multiple brain regions of the miR-29-deficient mice at P40, a stage at which WT brains have already reduced DNMT3A (Figures 4A–4D).
Figure 4. DNMT3A levels and CH methylation are increased in miR-29-deficient brains.
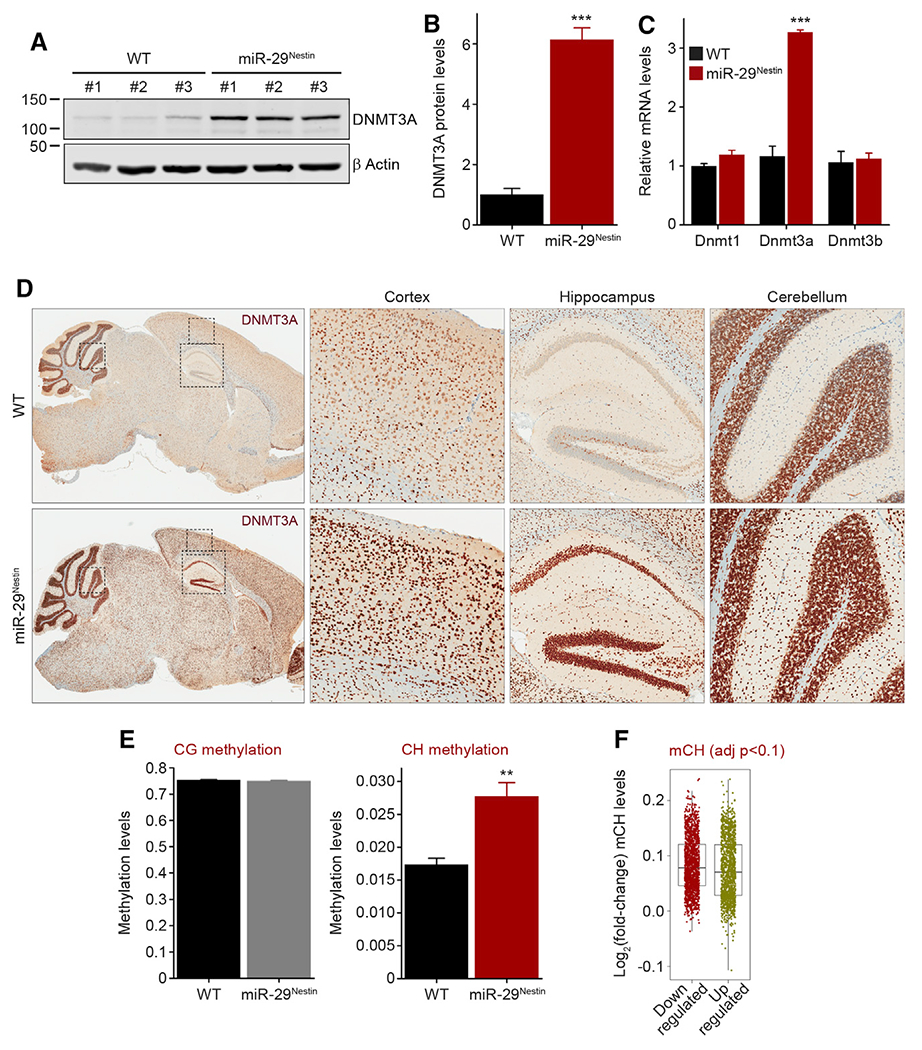
(A and B) Western blot analysis of DNMT3A protein levels in three P40 WT and miR-29Nestin cortices (WT, miR-29Nestin n = 3). Quantifications were normalized to β actin levels (B) (unpaired, two-tailed Student’s t test ***p = 0.0003).
(C) Comparison of Dnmt1, Dnmt3a, and Dnmt3b mRNA levels, normalized to Gapdh, by qPCR in P40 WT and miR-29Nestin brains (WT, miR-29Nestin n = 3; multiple unpaired t test with Holm-Sidak correction, Dnmt3a: ***p < 0.0001).
(D) Representative images of WT and miR-29Nestin mouse (P40) brains immunostained for DNMT3A. Enlargement of cortical, hippocampal, and cerebellar regions are shown.
(E) CG and non-CG (CH) methylation within gene regions quantified by bisulfite sequencing of genomic DNA extracted from the cortex of P40 WT and miR-29Nestin mice (WT, miR-29Nestin n = 4; unpaired, two-tailed Student’s t test, CH: **p = 0.0039).
(F) Fold-change of CH methylation levels in downregulated (red) and upregulated (green) gene regions of miR-29Nestin cortex compared to WT cortex (WT, miR-29Nestin n = 3; Welch’s t test p = 1.567e–05).
Means ± SEM are shown except in (F): medians ± 1.5 interquartile range (IQR) are shown. Value n represents the number of independent animals used, **p = 0.01–0.001, ***p < 0.001. See also Figure S4 and Table S3.
DNMT3a is particularly relevant in the context of brain maturation, because it plays an essential role in de novo methylation of the neuronal genome at non-canonical (non-CG) sites (Chen et al., 2015; Gabel et al., 2015 Guo et al., 2014; He and Ecker, 2015 Kinde et al., 2015; Lister et al., 2013 Mo et al., 2015; Xie et al., 2012). Our observation that DNMT3a levels remain elevated in the miR-29-deficient brains led us to examine whether sustained DNMT3A levels cause persistent CH methylation. Indeed, whole-genome bisulfite sequencing analysis on P40 WT and miR-29Nestin mice revealed that, although there was no increase in CG methylation, loss of miR-29 in the brain led to a striking increase in CH methylation within gene regions (Figure 4E; Table S3). The most prominent increase was observed at CA and CT sites and, to a lesser extent, at CC sites (Figures S4E–S4G).
Although hypermethylation is generally believed to result in gene downregulation (Luo et al., 2016; Moore et al., 2013), recent studies point to a more complex relationship between gene methylation and expression (Keown et al., 2017; Lavery and Zoghbi, 2019; Rizzardi et al., 2019). In our model, although both the upregulated and downregulated genes were CH hypermethylated upon loss of miR-29 expression, there was a small but significant increase in CH hypermethylation in the downregulated genes compared to upregulated genes in the miR-29Nestin cortex (Figure 4F).
Mice with selective disruption of miR-29 binding to Dnmt3a 3’ UTR have neurological deficits
Our results with the miR-29-deleted mice underscore the importance of miR-29 in brain maturation and, specifically, its function in restricting the critical period of CH methylation in the maturing brain potentially via its ability to target Dnmt3a. However, in addition to Dnmt3a, miR-29 has multiple gene targets, several of which are also upregulated in the brains of miR-29-deleted mice (Table S2). To identify the consequences of disrupting the ability of miR-29 to target only Dnmt3a, we developed a novel knockin mouse model in which five binding sites of miR-29 in the 3’ UTR region of Dnmt3a were mutated (hereafter referred to as Dnmt3ami5 mice) (Figure 5A). In these mice, miR-29 should still be able to inhibit all of its target genes except Dnmt3a. Consistent with our expectation that miR-29 directly restricts Dnmt3a expression during brain maturation, we found that Dnmt3ami5 mice selectively express higher levels of DNMT3A (Figures 5B–5D).
Figure 5. Mice unable to restrict Dnmt3a expression via miR-29 display neurological deficits and susceptibility to seizures.
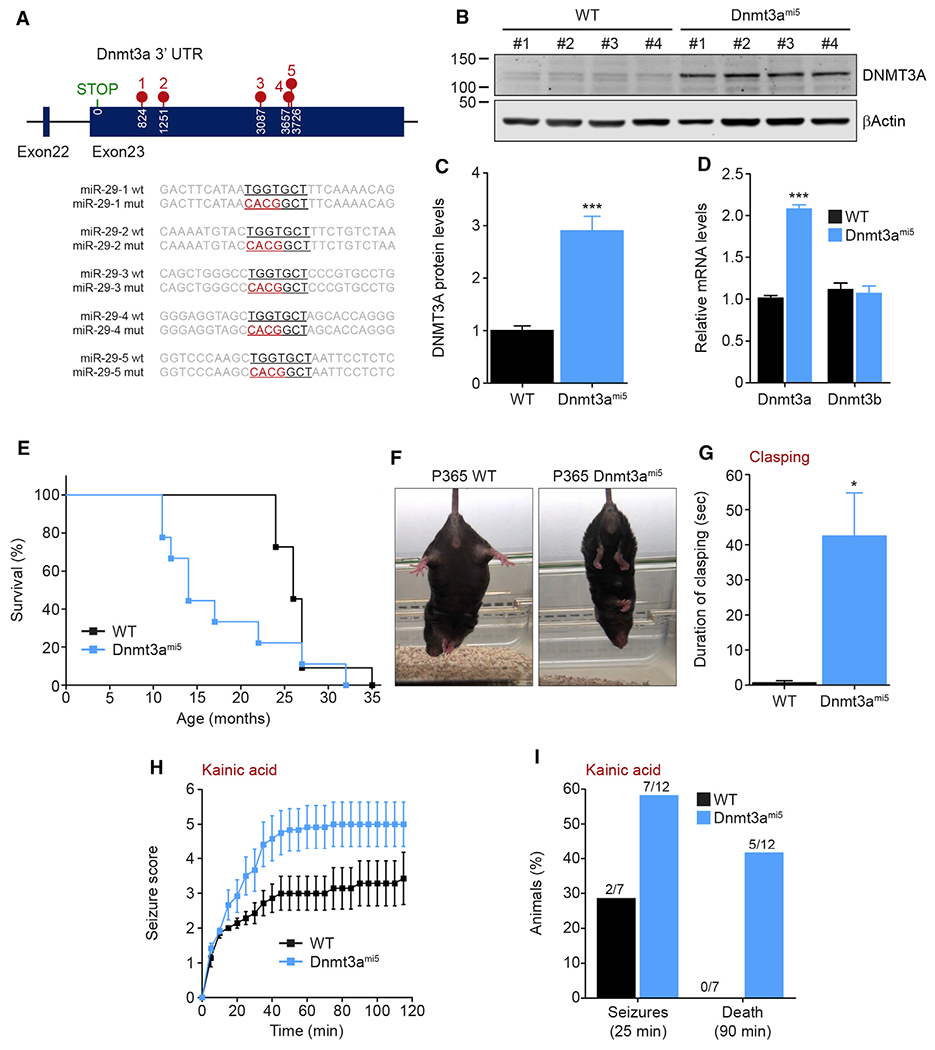
(A) Schematic representation of the CRISPR/Cas9 mutagenesis of five miR-29 binding sites in Dnmt3a 3′ UTR performed to generate the Dnmt3ami5 knockin mice.
(B and C) DNMT3A protein levels analyzed by western blot in three 4.5-month-old WT and Dnmt3ami5 cortices (WT, Dnmt3ami5 n = 4). Quantification were normalized to β actin levels (C) (unpaired, two-tailed Student’s t test, ***p = 0.0004).
(D) Dnmt3a and Dnmt3b mRNA levels analyzed by qPCR in 4.5-month-old WT and Dnmt3ami5 cortex. Quantification was normalized to Gapdh levels (WT, Dnmt3ami5 n = 4; unpaired, two-tailed Student’s t test, Dnmt3a: ***p < 0.0001).
(E) Kaplan-Meier survival curve of Dnmt3ami5 mice (WT n = 11, Dnmt3ami5 n = 9; median survival: WT 26 months, Dnmt3ami514 months; Gehan-Breslow-Wilcoxon test, **p = 0.0086).
(F and G) Pictures (F) and quantification (G) of hindlimb clasping upon suspension (60 s) of 1-year-old WT and Dnmt3ami5 mice (WT n = 3, Dnmt3ami5 n = 4, unpaired, two-tailed Student’s t test *p = 0.0351).
(H) Seizure score following intraperitoneal injection of kainic acid (30 mg/kg) to 4.5-month-old WT and Dnmt3ami5 mice The behavioral scores were 1: hypo-activity; 2: head nodding; 3: anterior clonus; 4: loss of balance or repeated falling; 5: severe tonic–clonic seizures; 6, jumping; and 7: death (WT n = 7, Dnmt3ami5 n = 12; two-tailed nonparametric Mann-Whitney test: ***p < 0.0001).
(I) Quantification of seizures (25 min) and death (90 min) after intraperitoneal injection of kainic acid (30 mg/kg), (WT n = 7, Dnmt3ami5 n = 12).
Means ± SEM are shown, value n represents the number of independent animals used, *p = 0.05–0.01, ***p < 0.001. See also Figure S5.
Dnmt3ami5 mice were born at the expected Mendelian ratio and appeared indistinguishable from WT controls at birth and during the early postnatal period. However, Dnmt3ami5 mice had a reduced lifespan, albeit at a later time point compared to the miR-29Nestin mice (median survival of 14 months) (Figure 5E). The Dnmt3ami5 mice at these late stages displayed severe dermatitis, which did not appear to be due to excessive grooming (Figures S5A and S5B). Although Dnmt3ami5 mice seem normal at P40, they begin exhibiting hindlimb clasping at ∼1 year of age (Figures 5F and 5G). Interestingly, during this 1 year time frame, although these mice did not exhibit overt hyperactivity, they showed increased susceptibility to kainic acid-induced seizures and death as seen in the miR-29Nestin mice (Figures 5H, 5I, and S5C).
Dnmt3ami5 mice exhibit downregulation and CH hypermethylation of genes associated with neurodevelopmental disorders
To confirm that the Dnmt3ami5 mice had increased DNMT3A activity, we quantified CH methylation in the cortex of WT and Dnmt3ami5 mice. As observed with miR-29Nestin mice, there was no difference in CG methylation, but a marked increase in CH methylation within genes in Dnmt3ami5 mice (Figures 6A and S6A–S6C; Table S4). To examine the consequences of CH hypermethylation, we conducted an RNA-seq analysis of cortical samples from WT and Dnmt3ami5 mice. As expected from a mouse model designed for miR-29 to selectively target Dnmt3a, fewer differentially expressed genes (109 downregulated and 34 upregulated genes, FDR <0.1) were observed in the Dnmt3ami5 compared to the miR-29Nestin cortex (Figure 6B; Table S5). However, it is interesting to note that the Dnmt3ami5 cortex had disproportionately more downregulated genes. These downregulated genes exhibited a significant increase in CH methylation as compared to the upregulated genes, a feature that was also seen in the miR-29Nestin cortex (Figure 6C). A pathway analysis revealed that many of the genes that were downregulated in the cortex of Dnmt3ami5 mice were associated with neuronal functions or signaling (Figure 6D; Table S5). Interestingly, as seen in the miR-29Nestin cortex, these genes were also associated with neurodevelopmental disorders including mental retardation, bipolar disorder, schizophrenia, epilepsy, and ASD (Figure 6E; Table S5).
Figure 6. Mice unable to restrict Dnmt3a expression via miR-29 have downregulated genes involved in neuronal signaling and neurodevelopmental disorders.
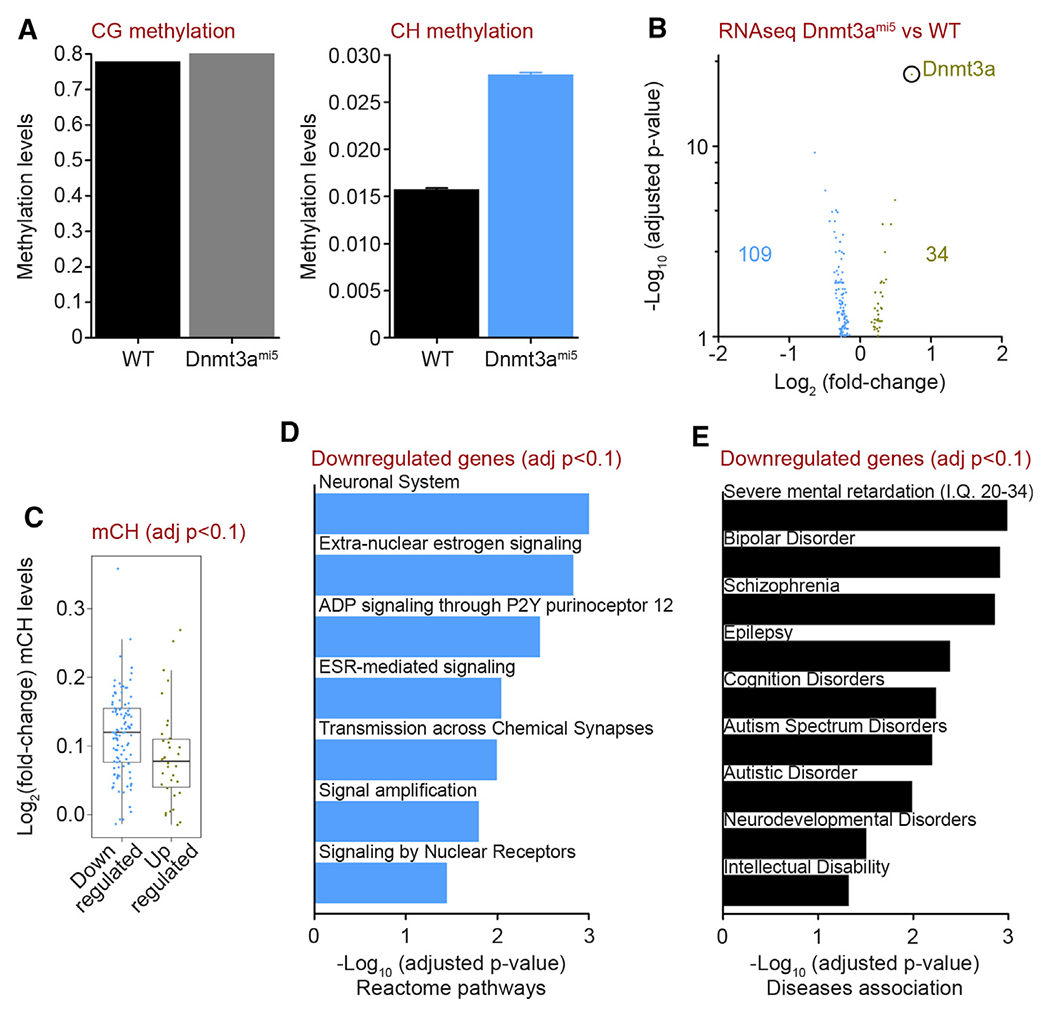
(A) CG and CH methylation of gene regions quantified by bisulfite sequencing of genomic DNA extracted from the cortex of 4.5-month-old WT and Dnmt3ami5 cortex (WT, Dnmt3ami5 n = 2). Means ± SEM are shown.
(B) Volcano plot of differentially expressed genes (DESeq2 adj.p <0.1) obtained from RNA-seq analysis of 4.5-month-old WT and Dnmt3ami5 cortex (WT, Dnmt3ami5 n = 4).
(C) Fold-change of CH methylation in downregulated (blue) and upregulated (green) gene regions of Dnmt3ami5 cortex compared to WT cortex (WT, Dnmt3ami5 n = 4; Welch’s t test p = 0.01986). Medians ± 1.5 IQR are shown.
(D and E) Reactome pathway (D) and DisGeNET disease association analysis (E) of downregulated genes in Dnmt3ami5 cortex.
Value n represents the number of independent animals used. See also Figure S6 and Tables S4 and S5.
miR-29 controls a set of genes associated with neuronal activity via DNMT3A in the brain
The miR-29Nestin mice exhibited a complex phenotype associated with the aberrant expression of a large set of genes, some of which were unexpectedly downregulated. In order to identify the specific role played by DNMT3A in this phenotype, we compared the genes differentially expressed in the cortex of miR-29Nestin mice with those deregulated in the cortex of Dnmt3ami5 mice. Among the differentially expressed genes in the Dnmt3ami5 cortex, there was a substantial overlap between the downregulated genes in Dnmt3ami5 and miR-29Nestin cortex (Figure 7A). The 55 commonly downregulated genes also exhibited a strong correlation in CH methylation levels between both models (Figure 7B). Interestingly, many of these genes have important neuronal functions including Gabrb3 (GABA receptor), Kcnv1 (K+ channel), Nlgn1 (Neuroligin 1), and Nrxn1 (Neurexin 1) (Figure 7C). A pathway analysis showed that the commonly downregulated genes are associated with neuronal functions, including neurotransmission and synaptic signaling (Figure 7D; Table S6). Importantly, these downregulated genes are also associated with many neuropsychiatric disorders such as autism, epilepsy, and schizophrenia (Figure 7E; Table S6). Thus, the loss of miR-29 or the selective inability of miR-29 to target Dnmt3a resulted in the CH hypermethylation and downregulation of a critical set of neuronal genes that are important for establishing normal brain homeostasis.
Figure 7. Cortex from miR-29Nestin and Dnmt3ami5 mice have common downregulated genes involved in neuronal signaling, synaptic activity, and neuropsychiatric disorders.
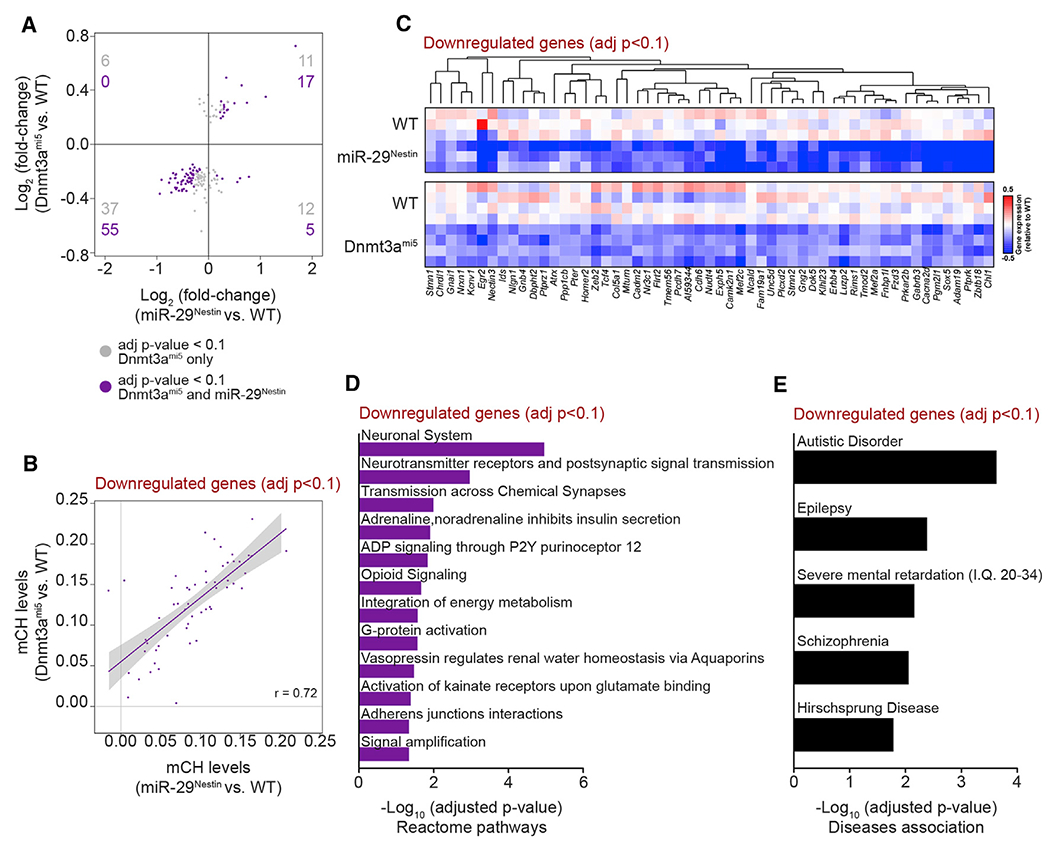
(A) Concordance of gene expression fold-changes between miR-29Nestin cortex and Dnmt3ami5 cortex (WT, miR-29Nestin n = 3, WT, Dnmt3ami5 n = 4). Among the genes that are differentially expressed (DESeq2 adj.p <0.1) in 4.5-month-old Dnmt3ami5 cortex, the genes also found differentially expressed (DESeq2 adj.p <0.1) in miR-29Nestin cortex (purple), and the genes uniquely differentially expressed in Dnmt3ami5 cortex (gray) are shown.
(B) Concordance of CH methylation levels in genes commonly downregulated in miR-29Nestin and Dnmt3ami5 cortex (Pearson correlation r = 0.72).
(C–E) Heatmap (C), Reactome pathway analysis (D), and DisGeNET disease association analysis (E) of genes commonly downregulated in miR-29Nestin and Dnmt3ami5 cortex.
Value n represents the number of independent animals used. See also Table S6.
DISCUSSION
Our results highlight the induction of miR-29 as an event that is crucial for multiple aspects of brain maturation. We found that miR-29, which is induced several hundred fold in the postnatal brain, was not essential for embryonic brain development but was crucial for postnatal brain maturation and homeostasis. Failure to express miR-29 resulted in severe consequences, including hyperactive behaviors, susceptibility to seizures, and premature lethality. Consistent with our observations, dysregulation of miR-29 is associated with psychiatric disorders such as schizophrenia and bipolar disorder (Geaghan and Cairns, 2015; Tonacci et al., 2019). Additionally, reduced expression of miR-29 is observed in multiple contexts of brain dysfunction including ischemia (Khanna et al., 2013; Pandi et al., 2013) and neurodegenerative disorders such as Alzheimer’s (Hébert et al., 2008; Lei et al., 2015) and Parkinson’s disease (Bai et al., 2017; Margis et al., 2011). Interestingly, reducing the levels of miR-29 in neurons of the turquoise killifish resulted in metabolic stress and aging (Ripa et al., 2017). Together, these results indicate that high levels of miR-29 in the postnatal brain are essential for the maintenance of heathy brain function.
The exact mechanisms that regulate the expression of the miR-29 family genes in the brain either during normal development or in neurodevelopmental disorders are unclear. Although all three miR-29 family genes are induced during brain maturation, our observation that miR-29b is disproportionally unregulated suggests that mechanisms controlling miRNA biogenesis (e.g., processing, stability), in addition to transcriptional upregulation, are likely implicated. For example, changes in miRNA biogenesis machinery (DGCR8 and DICER1) are thought to result in altered miRNA expression in the brains of patients with schizophrenia (Beveridge et al., 2010; Santarelli et al., 2011), temporal lobe epilepsy (McKiernan et al., 2012), and in 22q11.2 microdeletion carriers (Stark et al., 2008). These observations are interesting, because DGCR8 and DICER1 appear to differentially affect the expression of the three miR-29 family members in postmitotic neurons (Babiarz et al., 2011).
Although brain maturation is recognized as a period during which experience can fine-tune neuronal activity, the epigenetic mechanisms by which this is achieved are just starting to become uncovered. A major clue has come from recent studies, which found that the early postnatal maturing brain undergoes non-canonical CH methylation mediated by DNMT3A during a critical period (Chen et al., 2015; Gabel et al., 2015; Guo et al., 2014; He and Ecker, 2015; Kinde et al., 2015; Lister et al., 2013; Mo et al., 2015; Xie et al., 2012). However, exactly how DNMT3A expression is regulated and the consequences of unrestricted CH methylation were unknown. Our results identify miR-29 as a key regulator of CH methylation during brain maturation via its ability to target Dnmt3a. Mice in which miR-29 is either deleted or unable to target Dnmt3a, sustain elevated levels of DNMT3A in the mature brain, resulting in hypermethylation at CH sites. Although DNMT3A can mediate both CG and CH methylation, we did not observe any changes in levels of CG methylation at the gene regions or at CpG islands (data not shown) in these mice, a finding that is consistent with the observation that DNMT3A primarily mediates CH methylation during brain maturation.
Interestingly, CH hypermethylation occurred in both the downregulated and upregulated genes, although the levels of CH methylation were higher in the downregulated genes. These results indicate that, although CH methylation is an important factor in the downregulation of gene expression, it alone does not seem to be sufficient to predict whether a specific gene will be upregulated or downregulated. For example, downregulation of some genes (e.g., those coding for a transcriptional repressor), may have secondary effects that increase the expression of their target genes despite their methylation status. Alternatively, some hypermethylated genomic regions may be more efficient at recruiting the gene repression machinery at the expense of other hypermethylated genomic regions, leading to different outcomes on gene expression.
CH methylated DNA is recognized by MeCP2, a protein that primarily functions to mediate transcriptional repression of neuronal genes. Consequently, genes that are methylated at CH sites during brain maturation are preferentially reduced with MeCP2 duplication (Chen et al., 2015; Gabel et al., 2015). Interestingly, mice overexpressing MeCP2 develop multiple neurological abnormalities that are also similar to the defects observed in our miR-29-defcient and Dnmt3ami5 mice, including seizures, as well as premature death (Collins et al., 2004). The fact that both MeCP2-overexpressing mice and miR-29-deficient mice appear normal at birth but then progressively deteriorate illustrates the essential role that these molecules play selectively during brain maturation. Consistent with this, we observed a substantial overlap between the genes downregulated by removal of miR-29 and the gene upregulated in MeCP2 null mouse models (Figure S4H; Table S7). The relevance of regulating CH methylation and fine-tuning neuronal gene expression in humans is underscored by the fact that both the loss or duplication of MeCP2 result in Rett syndrome or intellectual disability, respectively (Lavery and Zoghbi, 2019; Lombardi et al., 2015).
The striking importance of miR-29 in brain maturation is emphasized by the fact that the miR-29-deficient mice exhibited complex behavioral phenotypes. This collection of phenotypes is likely due to the dysregulation of a large number of genes in the miR-29-deficient mice. The Dnmt3ami5 mice that we generated have, however, allowed us to focus specifically on the consequences of CH hypermethylation that result from the inability of miR-29 to target Dnmt3a alone. Interestingly, the Dnmt3ami5 mice have more downregulated than upregulated genes, and these genes have an important role in neuronal activity and are associated with many neurodevelopmental disorders. As anticipated, not all of the phenotypes observed in the miR-29Nestin mice were seen in the Dnmt3ami5 mice. However, the genes downregulated in both models are important for neurotransmission and synaptic signaling and associated with ASD, epilepsy, mental retardation, and schizophrenia. Interestingly, both mouse models have increased susceptibility to seizures, a condition that is frequently associated with these disorders (Frye et al., 2016; Hagerman et al., 2017; Hüfner et al., 2015). In contrast, the behavioral phenotypes selectively observed in the miR-29Nestin mice, which also reflect brain maturation abnormalities, are likely a consequence of the gene dysregulations that are unique to these mice.
Together, these results identify an essential function of miR-29 in brain maturation through its ability to target multiple pathways. Specifically, we show that miR-29 is a key regulator of DNMT3A-mediated CH methylation during brain maturation, also highlighting the importance of restricting CH methylation during a critical window for sustaining normal functions in the mature brain.
STAR ★METHODS
RESOURCE AVAILABILITY
Lead contact
Further information and requests for resources and reagents should be directed to and will be fulfilled by the Lead Contact, Mohanish Deshmukh (mohanish@med.unc.edu).
Materials availability
All unique reagents generated in this study are available from the Lead Contact without restriction.
Data and code availability
The accession numbers for the sequencing data reported in this paper have been deposited in Gene Expression Omnibus (GEO): GSE140163, GSE157841.
EXPERIMENTAL MODEL AND SUBJECT DETAILS
All animal handling and experiments were carried out in accordance with the National Institutes of Health Guide for Care and Use of Laboratory Animals and as approved by the Animal Care and Use Committee of the University of North Carolina (UNC).
Mice were housed 2-5 per cage in a 12 h light, 12 h dark cycle. Food and water were provided ad libitum. Cohorts were composed of animals of both sexes, aged as indicated in figure legends. Control mice (wild-type) were wild-type littermates of mutant mice.
The miR-29ab1f/f, miR-29b2cf/f mice were generated in the 129/SvEv background. The Dnmt3ami5 knock-in mice were in the C57BL/6J background.
METHOD DETAILS
Generation of knock-out and knock-in mice
The miR-29ab1 and miR-29b2c floxed alleles were generated by the Duke Transgenic Mouse Facility by homologous recombination and genomic targeting. An 827 bp or an 817 bp genomic segment containing respectively, miR-29a and miR-29b1, or miR-29b2 and miR-29c, were amplified from 129/SvEv mouse genomic DNA. To amplify the long arm (LA) and short arm (SA), a BAC clone (RP24-248C11 for miR-29ab1 and RP23-465H4 for miR-29b2c) was used as PCR template. miR-29ab1 or miR-29b2c gene segments and their corresponding LA and SA were cloned into the PGKneoF2L2DTA targeting vector. After verification for the absence of mutation, targeting vectors were linearized by SacII (New England BioLabs) restriction enzyme digestion and were used for microinjection of ES cells from 129/SvEv-B6 mice. ES cells were positively selected in neomycin-containing medium, and successful genomic targeting was confirmed by PCR. Animals were bred and maintained in the SPF facility managed by Duke University Division of Laboratory Animal Research. All animal procedures were approved by the Duke University Institutional Animal Care and Use Committee.
The above mice were bred to generate mice floxed at both genomic loci (miR-29ab1f/f, miR-29b2cf/f mice). Deletion of miR-29 was carried out by crossing the above mice with various Cre recombinase lines including CMV-Cre and Nestin-Cre (Jackson Laboratories, #006054 and #003771) to obtain miR-29CMV and miR-29Nestin knock-out mice.
The knock-in mouse with five miR-29-binding sites mutated in Dnmt3a 3’ UTR (Dnmt3ami5 mice) was generated by the UNC Animal Models Core Facility by CRISPR/Cas9 nuclease technology. CRISPR guide RNAs were designed to cut at miR-29-binding site 1 and miR-29-binding site 5 (target sequence miR-29-1: ACATCCCGACTTCATAA; target sequence miR-29-5: GAGGAATTAGCACCAGCT). A donor vector with approximately 1 kb homology arms flanking the 2909 bp region encompassing the 5 miR-29-binding sites, all mutated from TGGTGCT to CACGGCT, was generated. Guide RNAs, Cas9 protein and donor vector were injected into C57BL/6J mouse embryos. Founders were screened for homologous integration of the five mutated miR-29-binding sites.
Small RNA sequencing and analysis
Total RNA was extracted from P18 and P250 wild-type CD-1 mouse cerebellum using miRNeasy kit (QIAGEN, #217004). Libraries were prepared using a modification of the TruSeq protocol. Briefly, 1 μg total RNA was ligated to 3 pmol of 3′ linker using T4 RNA ligase 2. RNA size fractions corresponding to 35-70 nucleotides (insert plus linker) were isolated on gel and ligated to 3 pmol of 5′ linker. Products were reverse transcribed, PCR amplified to mid-log phase, and size isolated. Libraries were barcoded using indexed 5′ linkers before single end sequencing at the High Throughput Genomic Sequencing Facility at UNC Chapel Hill on an Illumina HiSeq 2000 (50 cycles). Small RNA sequencing reads were processed using miRquant (Baran-Gale et al., 2013). MiRquant is a small RNA-sequencing pipeline that involves trimming, alignment to the mouse genome (mm9), miRNA and iso-miRNA assignment of the reads according to miRbase annotations (v18), quantification and normalization to reads per million reads mapped, and differential expression analysis. The filter applied included only those miRNA for which reads per million (RPM) was > 50 in the P250 sample.
RT-qPCR analysis
For miRNA RT-qPCR, total RNA was extracted from mouse cortex and cerebellum using miRNeasy kit (QIAGEN, #217004). RNA (10 ng) was reverse transcribed using Superscript III reverse transcriptase (Invitrogen) and specific RT primers for mature miR-29a, miR-29b, miR-29c and U6 RNA (TaqMan MicroRNA Assays, Applied Biosystems). Real-time PCR was carried out with an ABI7500 thermocycler (Applied Biosystems) and relative quantification was estimated using the ΔΔCt method. Sample variability was corrected by normalizing to U6 RNA levels.
Alternatively, total RNA was extracted from mouse cortex with TRI reagent. Tissues were homogenized in TRI reagent (Zymo Research), RNA was separated with chloroform and precipitated with an equal volume of isopropanol. Total RNA (1 μg) was poly-adenylated with recombinant Poly(A) Polymerase (1.2 U per 20 μl reaction) for 1 h at 37°C. RT-PCR reactions were performed using High-Capacity cDNA Reverse Transcription Kit (Applied Biosystems) with a poly(A) adaptor PCR primer (GCGAGCACAGAATTAATACGACTCACTATAGGTTTTTTTTTTTTVN) (adapted from Biggar et al., 2014). Real-time PCR reactions were run using microRNA-specific forward primers (mir-29b: TAGCACCATTTGAAATCAGT), a universal reverse primer (GCGAGCACAGAATTAATACGAC) and Power Up SYBR green master mix (Applied Biosystems) on a QuantStudio 3 thermocycler (Applied Biosystems). Relative quantification was estimated using the ΔΔCt method and U6 (U6 Forward: CGCTTCGGCAGCACATATAC; U6 Reverse: AAAATATGGAACGCTTCACGA) to normalize each miRNA relative level.
For analysis of Dnmt1, Dnmt3a and Dnmt3b mRNA, cDNA libraries were prepared using High-Capacity cDNA Reverse Transcription Kit (Applied Biosystems) from total RNA (1 μg) extracted from mouse cortex and cerebellum with TRI reagent. Primers were designed using the NCBI primer designing tool. The following primers were used: mGapdh forward: TGTGTCCGTCGTGGATCTGA; mGapdh reverse: CCTGCTTCACCACCTTCTTGA; mDnmt1 forward: CATGCTGCTTCCGCTTGC; mDnmt1 reverse: CTTTCCAAGTCTTTGAGCCGCC; mDnmt3a forward: GCTTTGGCATTGGAGAGCTG; mDnmt3a reverse: GCTTCTCCACACACACCACT; mDnmt3b forward: GCTTGTGCCAGACCTTGGAA; mDnmt3b reverse: GTCTCCCTTCATTGTTTCCTGA. Real-time PCR reactions were performed with Power Up SYBR green master mix (Applied Biosystems) on a QuantStudio 3 thermocycler (Applied Biosystems). Relative quantification was estimated using the ΔΔCt method and Gapdh to normalize each mRNA relative level.
Mouse behavioral analysis: hindlimb clasping
Adult mice, when suspended by the tail, extend their four limbs in anticipation of contact. Instead, mice with defects in various brain regions (i.e., cerebellum, basal ganglia, and neocortex) and the spinal cord display hindlimb clasping toward the abdomen. Each mouse was tail suspended for 90 s and monitored by video recording.
Grooming
Subject were placed and left undisturbed in a new standard mouse cage. Mice were recorded on video and repetitive self-grooming was measured over 30 minutes and expressed as the percentage of time spent grooming.
Open field test
Exploratory activity in a novel environment was assessed by a 60 min trial in an open field chamber (41 cm x 41 cm x 30 cm) crossed by a grid of photobeams (VersaMax system, AccuScan Instruments). Counts were taken of the number of photobeams broken during the trial in 5 min intervals, with separate measures for total distance traveled and fine movements (the repeated breaking of the same set of photobeams). Time spent in the center region of the open field was measured as an index of anxiety-like and risk-taking behavior.
Acoustic startle test
This procedure is based on the reflex whole-body flinch (startle response) that follows exposure to a sudden noise. Measures are taken of prepulse inhibition, which occurs when a weak pre-stimulus leads to a reduced startle in response to a subsequent louder noise. Subjects were tested with a SR-Lab system (San Diego Instruments). Mice were placed in a small Plexiglas cylinder within a larger, sound-attenuating chamber. The cylinder was seated upon a piezoelectric transducer, which allowed vibrations to be quantified. The chamber included a ceiling light, fan, and a loudspeaker for the acoustic stimuli. Background sound levels (70 dB) and calibration of the acoustic stimuli were confirmed with a digital sound level meter (San Diego Instruments). The test began with a 5 min habituation period, followed by forty-two trials. There were seven different types of trials: no-stimulus trials, trials with acoustic startle stimulus alone (40 ms; 120 dB), and trials in which a prepulse stimulus (20 ms; either 74, 78, 82, 86, or 90 dB) occurred 100 ms before the acoustic startle stimulus. The levels of prepulse inhibition at each prepulse sound intensity was calculated as 100 - [(response amplitude for prepulse stimulus and startle stimulus together / response amplitude for startle stimulus alone) x 100].
Wire-hang test for grip strength
At the start of the test, subjects were placed on a large metal cage lid. The lid was gently shaken to induce the mouse to grip onto the metal grid. The cage top was then flipped over, and latency for the mouse to fall from the lid was recorded during the 60 s test.
Rotarod test
Subjects were tested for motor coordination and learning on an accelerating rotarod (Ugo Basile, Stoelting Co.). On a first test session, mice were given three trials, with 45 s between each trial. An additional trial was given 48 h later. The initial speed was set at 3 rpm, with a progressive increase to a maximum of 30 rpm across a total 5 min trial. Measures were taken for latency to fall from the top of the rotating barrel.
Kainic acid-induced seizures scoring
Animals were injected intraperitoneally with 30 mg/kg of kainic acid (Sigma-Aldrich, #K0250) to induce seizures. Following kainic acid administration, mice were placed in a cage and video-recorded for 3 hours or until death was observed. The behavioral scores were as follows: 1: hypoactivity; 2: head nodding; 3: anterior clonus; 4: loss of balance or repeated falling; 5: severe tonic–clonic seizures; 6, jumping; 7: death.
Western blotting
Whole cortex was lysed by homogenization in RIPA buffer. Protein concentrations were quantified by bicinchoninic acid (BCA) assay (Pierce, #23225) and equal amounts of protein were resolved on 8% SDS-polyacrylamide gels before transfer onto Immobilon-FL PVDF membranes (Millipore). After blocking (TBS, 1% ovalbumin, 1% fish gelatin, 0,05% tween 20), membranes were probed with anti-DNMT3A (Abcam, #ab2850, 1:500) and anti-β Actin (Sigma-Aldrich, #A5316, 1:2,000) primary antibodies. Signals from infrared dye-conjugated secondary antibodies (Alexa Fluor 790 & 680, Jackson ImmunoResearch Inc., 1:10,000) were detected using an Odyssey CLx imager (LI-COR) and were quantified using Image Studio software (LI-COR). Regions of interest (ROIs) were drawn around bands of interest and the density was measured. Relative densities were normalized to housekeeping genes (β Actin) and calculated against the average of the WT samples on each membrane.
Whole genome bisulfite-sequencing
Genomic DNA was extracted from mouse cortex with the DNeasy Blood & Tissue Kit (QIAGEN) and sonicated with a Covaris S2 instrument to generate 200 bp fragments. Unmethylated lambda DNA (0.1%–0.5%; Promega D1521) was spiked in to assess conversion rates. Whole genome bisulfite-sequencing was performed similarly as described (Mo et al., 2015) except that the EZ DNA Methylation-Gold Kit (Zymo Research) was used for bisulfite conversion. Libraries were sequenced on a Miseq system (Illumina) by performing a 75×2 cycle run. BSmap v.2.74 (Xi and Li, 2009) was used to map reads to the mm9 mouse genome assembly and only uniquely mapping reads were retained for analyses. Methylation levels were determined by calculating #C/(#C+#T) for the indicated cytosine pair (e.g., CG, CA, CT or CC), where #C is the number of C reads and #T is the number of T reads. All our libraries had less than 1% non-conversion rate assessed by unmethylated lambda DNA spiked into each sample (Tables S3 and S4). Methylation levels were summarized by gene (transcription start site through transcription termination site) using RefSeq gene annotations.
RNA sequencing and analysis
For miR-29Nestin mice, total RNA was extracted from the cortex of P40 mice using RNeasy Mini Kit (QIAGEN). Stranded mRNA libraries were prepared with TruSeq Stranded mRNA Library Prep Kit (Illumina). Paired end sequencing (50 cycles) was performed on an Illumina HiSeq 2500 v4 (high output).
For Dnmt3ami5 mice, total RNA was extracted from the cortex of 4.5 months old mice using Direct-Zol RNA mini-prep kit (Zymo Research, #R2051). Stranded mRNA libraries were prepared using the KAPA stranded mRNaseq kit (KAPA Biosystems). Libraries were dual barcoded before paired end sequencing (50 cycles) on an Illumina HiSeq 4000 (high output). All sequencing were performed at the High Throughput Genomic Sequencing Facility at UNC Chapel Hill. Reads were then trimmed and filtered of adaptor sequencing using cutadapt (Martin, 2011), and required to have at least 90% of bases with quality scores exceeding 20. Reads were then aligned to the reference human genome (hg19) using STAR (Dobin et al., 2013), and transcript abundance was estimated using Salmon (Patro et al., 2017). Differential expression between each genetic model and wild-type control was analyzed using DESeq2 (Love et al., 2014). Differentially expressed genes (adjusted p value < 0.1) were annotated for pathway (Reactome) (Fabregat et al., 2018) and disease (DisGeNET) (Piñero et al., 2017) enrichments using gProfiler (Raudvere et al., 2019). Enrichments with FDR < 0.05 were considered significant.
miRHub analysis
First, we used the seed-based target prediction algorithm TargetScan v.5.2 (Grimson et al., 2007) to determine for each miRNA the number of predicted conserved targets among the genes in our gene sets (genes found upregulated by RNA-seq with fold change > 0 and adjusted p value < 0.1). Each predicted miRNA-gene interaction was assigned a score based on the strength of the seed match, the level of conservation of the target site, and the clustering of target sites within that gene’s 3’ UTR. Finally, for each miRNA, the final targeting score was calculated by summing the scores across all genes and dividing by the number of genes. We repeated this procedure 10,000 times, with a new set of randomly selected mouse genes each time, in order to generate a background distribution of the predicted targeting scores for each miRNA. These score distributions were then used to calculate an empirical p value of the targeting score for each miRNA in our gene set. Genes were selected at random from a pool with similar overall connectivity to the genes in our gene set, and to account for differences in the average 3’ UTR length between the genes of interest and the randomly selected genes in each simulation, the targeting score was normalized by 3’ UTR length.
Immunohistochemistry staining
Mice were anesthetized using isoflurane and transcardially perfused with PBS followed by 4% paraformaldehyde. Brains were post-fixed in 4% paraformaldehyde overnight before paraffin-embedded sections were prepared. Hematoxylin-eosin (H&E) stains were done using an Autostainer XL (Leica Biosystems). Fluorescence (cleaved-Caspase-3, NeuN, PCNA and p27) and chromogenic (DNMT3A) immunohistochemistry were carried out in the Bond fully-automated slide staining system (Leica Microsystems) using .
Slides were dewaxed in Bond Dewax solution (Leica Biosystems, #AR9222) and hydrated in Bond Wash solution (Leica Biosystems, #AR9590). Heat-induced antigen retrieval was performed for 30 min at 100°C in Bond-Epitope Retrieval solution 1 pH-6.0 (Leica Biosystems, #AR9961, for NeuN, PCNA and p27 stainings) or solution2 pH-9.0 (Leica Biosystems, #AR9640, for cleaved-Caspase-3 and DNMT3A stainings). The antigen retrieval was followed with 5 min Bond peroxide blocking step (Leica Biosystems, #DS9800) and with 30 min with Rodent Block M (Biocare Medical, #RBM96IL). After pretreatment, slides are incubated with primary antibody. Primary antibodies were as follows: anti-cleaved-Caspase-3 (Biocare Medical, #CP229C, Lot 110513,1:200,4 h), anti-NeuN (Millipore, #MAB377, lot NG1876252, 1:1000, 1 h), anti-PCNA (Cell Signaling Technology, #2586, 1:1000, 6h), anti-p27 (Cell Signaling Technology, #3686, 1:1000, 6h) and anti-DNMT3A (Abcam, #ab13888, lot GR222526, 1:100, 4 h).
For cleaved-Caspase-3 and NeuN, fluorescence detection was performed using Bond polymer Refine Detection kit (Leica Biosystems, #DS9800) and EnVision+ System-HRP labeled polymer anti-mouse (Dako, #K4001), respectively. For PCNA and p27, fluorescence detection was performed using Cy5-labeled anti-mouse IgG (KPL #072-02-18-18) and Alexa Fluor® 555 anti-rabbit IgG (Molecular Probes, #A-21429), respectively, and Bond Research Detection System (Leica Biosystems, #DS9455). Stained slides were counterstained with Hoechst 33258 (Invitrogen, #H3569) and mounted with ProLong Gold antifade reagent (Invitrogen, #P36934).
For DNMT3A, chromogenic detection was performed using EnVision+ System- HRP labeled polymer anti-mouse (Dako, #K4001) and Bond Intense R Detection System (Leica Biosystems, #DS9263). Stained slides were dehydrated and mounted.
Representative images from brains (n = 3) were acquired with Aperio ScanScope XT (Leica) using 20× objective. All staining and imaging were performed at the Translational Pathology Laboratory, UNC Chapel Hill.
QUANTIFICATION AND STATISTICAL ANALYSIS
For all experiments, the value n represents the number of independent animals used and can be found in the figure legends. No statistical methods were used to predetermine sample sizes which were estimated based on similar samples sizes reported in the literature. No sample was excluded from the analysis. All behavior studies were performed blind to genotype. Biochemical analysis were performed without blinding.
Data visualization and statistical analyses were performed using GraphPad Prism v.8.3.1 and R v.3.5.1. Bar and line graphs represent the mean ± SEM and box-and-whiskers plots depict the median and interquartile range (IQR, 25th and 75th percentiles) ± 1.5x IQR. For all dataset, normality was tested using the Shapiro-Wilk normality test. No data was excluded from any analysis. The statistical tests used are indicated in the figure legends. In particular, for all assays comparing two groups with normal data distributions, the Student’s t test (unpaired, two-tailed) with a 95% confidence interval (CI) was performed. For multiple comparison tests, multiple unpaired t test with Holm-Sidak correction or one-way Analysis of Variance (ANOVA) with post hoc Dunnett’s multiple comparisons test were performed. For behavioral assays based on repeated-measurements, data with normal distribution were analyzed using repeated-measures ANOVA with a 95% CI for the factor genotype, followed by a post hoc Sidak’s multiple comparisons test. For samples with unequal sizes and/or variances, Welch’s t test (two-tailed). For all data not normally distributed, the Mann Whitney test (two-tailed) with a 95% CI was used. For survival analysis, the Gehan-Breslow-Wilcoxon test was performed.
Supplementary Material
KEY RESOURCES TABLE
| REAGENT or RESOURCE | SOURCE | IDENTIFIER |
|---|---|---|
| Antibodies | ||
| Rabbit polyclonal anti-DNMT3A | Abcam | Cat# ab2850, RRID:AB_303355 |
| Mouse monoclonal anti-beta-Actin | Sigma-Aldrich | Cat# A5316, RRID:AB_476743 |
| Alexa Fluor 790-AffiniPure Goat Anti-Rabbit IgG (H+L) | Jackson ImmunoResearch Labs | Cat# 111-655-144, RRID:AB_2338086 |
| Alexa Fluor 680-AffiniPure Goat Anti-Mouse IgG (H+L) | Jackson ImmunoResearch Labs | Cat# 115-625-146, RRID:AB_2338935 |
| Rabbit polyclonal anti-cleaved-Caspase-3 | Biocare Medical | Cat# CP229C |
| Mouse monoclonal anti-NeuN | Millipore | Cat# MAB377, RRID:AB_2298772 |
| Mouse monoclonal anti-PCNA (PC10) | Cell Signaling Technology | Cat# 2586, RRID:AB_2160343 |
| Rabbit monoclonal anti-27 Kip1 (D69C12) | Cell Signaling Technology | Cat# 3686, RRID:AB_2077850 |
| Mouse monoclonal anti-DNMT3A | Abcam | Cat# ab13888, RRID:AB_300714 |
| Dako EnVision+ System-HRP Labeled Polymer antibody | Agilent | Cat# K4001, RRID:AB_2827819 |
| Cy5-Labeled Anti-Mouse IgG (H+L) RbSA | KPL | Cat# 072-02-18-18 |
| Alexa Fluor 555 Goat anti-Rabbit IgG (H+L) | Molecular Probes | Cat# A-21429, RRID:AB_2535850 |
| Chemicals, peptides, and recombinant proteins | ||
| Kainic acid monohydrate | Sigma-Aldrich | Cat# K0250, CAS: 58002-62-3 |
| Critical commercial assays | ||
| miRNeasy Mini Kit | QIAGEN | Cat# 217004 |
| Direct-Zol RNA mini-prep kit | Zymo Research | Cat# R2051 |
| High-Capacity cDNA Reverse Transcription Kit | Applied Biosystems | Cat# 4368814 |
| Power Up SYBR green master mix | Applied Biosystems | Cat# A25779 |
| DNeasy Blood & Tissue Kit | QIAGEN | Cat# 69504 |
| EZ DNA Methylation-Gold | Zymo Research | Cat# D5005 |
| TruSeq Stranded mRNA Library Prep kit | Illumina | Cat# 20020594 |
| Stranded RNA-Seq Kit | KAPA Biosystems | Cat# KK8401 |
| Deposited data | ||
| Cortical gene expression data from miR-29Nestin and dnmt3ami5 mice | This paper | GEO: GSE140163 GEO: GSE157841 |
| Amygdala gene expression data from MeCP2-deficient mice | Samaco et al., 2012 | GEO: GSE33457 |
| Hypothalamic gene expression data from MeCP2-deficient mice | Chahrour et al., 2008 | GEO: GSE11150 |
| Experimental models: organisms/strains | ||
| mouse: miR-29ab1f/f, miR-29b2cf/f | This paper | N/A |
| mouse: dnmt3ami5 | This paper | N/A |
| mouse: B6.C-Tg(CMV-cre)1Cgn/J | Jackson Laboratories | Cat# 006054 |
| mouse: B6.Cg-Tg(Nes-cre)1Kln/J | Jackson Laboratories | Cat# 003771 |
| Oligonucleotides | ||
| poly(A) adaptor RT-PCR primer: GCGAGCACAGAATTAATACGACTCACTATAGGTTTTTTTTTTTTVN | This paper | N/A |
| universal reverse qPCR primer: GCGAGCACAGAATTAATACGAC | This paper | N/A |
| microRNA-specific forward qPCR primers for mir-29b: TAGCACCATTTGAAATCAGT | This paper | N/A |
| U6 Forward qPCR primer: CGCTTCGGCAGCACATATAC | Long et al., 2011 | N/A |
| U6 Reverse qPCR primer: AAAATATGGAACGCTTCACGA | Long et al., 2011 | N/A |
| U6 snRNA TaqMan microRNA Control Assay | Thermo Fisher Scientific | Cat# 4427975 Assay ID 001973 |
| hsa-miR-29a TaqMan microRNA Control Assay | Thermo Fisher Scientific | Cat# 4427975 Assay ID 002112 |
| hsa-miR-29b TaqMan microRNA Control Assay | Thermo Fisher Scientific | Cat# 4427975 Assay ID 000413 |
| hsa-miR-29c TaqMan microRNA Control Assay | Thermo Fisher Scientific | Cat# 4427975 Assay ID 000587 |
| mGapdh forward qPCR primer: TGTGTCCGTCGTGGATCTGA | Knight et al., 2015 | N/A |
| mGapdh reverse qPCR primer: CCTGCTTCACCACCTTCTTGA | Knight et al., 2015 | N/A |
| mDnmt1 forward qPCR primer: CATGCTGCTTCCGCTTGC | This paper | N/A |
| mDnmt1 reverse qPCR primer: CTTTCCAAGTCTTTGAGCCGCC | This paper | N/A |
| mDnmt3a forward qPCR primer: GCTTTGGCATTGGAGAGCTG | This paper | N/A |
| mDnmt3a reverse qPCR primer: GCTTCTCCACACACACCACT | This paper | N/A |
| mDnmt3b forward qPCR primer: GCTTGTGCCAGACCTTGGAA | This paper | N/A |
| mDnmt3b reverse qPCR primer: GTCTCCCTTCATTGTTTCCTGA | This paper | N/A |
| Software and algorithms | ||
| Prism v8.3.1 | GraphPad | https://www.graphpad.com:443/ |
| R v3.5.1 | R Core Team | https://www.R-project.org |
| TargetScan v.5.2 & v7.2 | Grimson et al., 2007 | http://www.targetscan.org/mmu_72/ |
| miRBase v.18 | Griffiths-Jones et al., 2006 | http://www.mirbase.org/ |
| Samtools v1.2 | Li et al., 2009 | https://github.com/samtools/samtools |
| Bowtie v1.1.1 | Langmead et al., 2009 | http://bowtie-bio.sourceforge.net/ |
| STRING v.9.0 | Szklarczyk et al., 2011 | https://string-db.org/ |
| Bsmap v2.74 | Xi and Li, 2009 | https://code.google.com/archive/p/bsmap/ |
| Cutadapt | Martin, 2011 | https://cutadapt.readthedocs.io/en/stable/ |
| STAR | Dobin et al., 2013 | https://code.google.com/archive/p/rna-star/ |
| Salmon | Patro et al., 2017 | https://github.com/COMBINE-lab/salmon |
| DESeq2 | Love et al., 2014 | http://www.bioconductor.org/packages/release/bioc/html/DESeq2.html |
| gProfiler | Raudvere et al., 2019 | https://biit.cs.ut.ee/gprofiler/ |
| Reactome | Fabregat et al., 2018 | https://reactome.org |
| DisGeNET | Piñero et al., 2017 | https://www.disgenet.org/ |
| Aperio ImageScope v12.3.3 | LeicaBiosystems | https://www.leicabiosystems.com/digital-pathology/manage/aperio-imagescope/ |
| 7500 System SDS v1.4 | Applied Biosystems | https://www.thermofisher.com/us/en/home/technical-resources/software-downloads/applied-biosystems-7500-real-time-pcr-system.html |
| QuantStudio Design and Analysis Software v1.5 | Applied Biosystems | https://www.thermofisher.com/us/en/home/global/forms/life-science/quantstudio-3-5-software.html |
| Image Studio acquisition software v4.0 | Li-Cor | https://www.licor.com/bio/image-studio/resources |
Highlights.
miR-29 is markedly upregulated during postnatal brain maturation
miR-29 targets Dnmt3a to restrict its expression in vivo in the maturing brain
miR-29 regulates Dnmt3a and mCH to control the expression of synaptic genes
Failure of miR-29 to restrict Dnmt3a leads to neurobehavioral deficits
ACKNOWLEDGMENTS
We thank the members of the Deshmukh Lab for critical review of this manuscript. We also acknowledge Dr. Natallia Riddick, Viktoriya Nikolova, and Dr. Kara Agster at the UNC Mouse Behavioral Phenotyping Laboratory, for their technical assistance. We thank Mervi Eeva, Ying Li, and Bentley Midkiff at the UNC Translational Pathology Laboratory for expert technical assistance. We also appreciate the technical assistance provided by Janice Weaver and Carolyn Suitt at the UNC Animal Histopathology and the Center for Gastrointestinal Biology and Disease (CGIBD), respectively. The graphical abstract was created partly with BioRender.com. This work was supported by NIH, United States (GM118331 and AG055304 to M.D.). H.S. is a Howard Hughes Medical Institute Fellow of the Damon Runyon Cancer Research Foundation, United States (DRG-2194-14). J.M.S. and T.S.P. were supported by The Eunice Kennedy Shriver National Institute of Child Health and Human Development (U54HD079124) and NINDS (P30NS045892) of United States. The UNC Mouse Behavioral Phenotyping Laboratory is supported by a grant from the National Institute of Child Health and Human Development (NICHD), United States (U54-HD079124). The UNC Translational Pathology Laboratory is supported in part by grants from the NCI (5P30CA016086-42), NIH (U54-CA156733), NIEHS (5 P30 ES010126-17), UCRF, and NCBT (2015-IDG-1007) of United States.
Footnotes
SUPPLEMENTAL INFORMATION
Supplemental information can be found online at https://doi.org/10.1016/j.celrep.2021.108946.
DECLARATION OF INTERESTS
The authors declare no competing interests.
REFERENCES
- Abe M, and Bonini NM (2013). MicroRNAs and neurodegeneration: role and impact. Trends Cell Biol. 23, 30–36. [DOI] [PMC free article] [PubMed] [Google Scholar]
- Babiarz JE, Hsu R, Melton C, Thomas M, Ullian EM, and Blelloch R (2011). A role for noncanonical microRNAs in the mammalian brain revealed by phenotypic differences in Dgcr8 versus Dicer1 knockouts and small RNA sequencing. RNA 17, 1489–1501. [DOI] [PMC free article] [PubMed] [Google Scholar]
- Bai X, Tang Y, Yu M, Wu L, Liu F, Ni J, Wang Z, Wang J, Fei J, Wang W, et al. (2017). Downregulation of blood serum microRNA 29 family in patients with Parkinson’s disease. Sci. Rep 7, 5411. [DOI] [PMC free article] [PubMed] [Google Scholar]
- Baran-Gale J, Fannin EE, Kurtz CL, and Sethupathy P (2013). Beta cell 5′-shifted isomiRs are candidate regulatory hubs in type 2 diabetes. PLoS ONE 8, e73240. [DOI] [PMC free article] [PubMed] [Google Scholar]
- Beveridge NJ, Gardiner E, Carroll AP, Tooney PA, and Cairns MJ (2010). Schizophrenia is associated with an increase in cortical microRNA biogenesis. Mol. Psychiatry 15, 1176–1189. [DOI] [PMC free article] [PubMed] [Google Scholar]
- Biggar KK, Wu C-W, and Storey KB (2014). High-throughput amplification of mature microRNAs in uncharacterized animal models using polyadenylated RNA and stem-loop reverse transcription polymerase chain reaction. Anal. Biochem. 462, 32–34. [DOI] [PubMed] [Google Scholar]
- Bourgeron T (2015). From the genetic architecture to synaptic plasticity in autism spectrum disorder. Nat. Rev. Neurosci. 16, 551–563. [DOI] [PubMed] [Google Scholar]
- Chahrour M, Jung SY, Shaw C, Zhou X, Wong ST, Qin J, and Zoghbi HY (2008). MeCP2, a key contributor to neurological disease, activates and represses transcription. Science 320, 1224–1229. [DOI] [PMC free article] [PubMed] [Google Scholar]
- Chen L, Chen K, Lavery LA, Baker SA, Shaw CA, Li W, and Zoghbi HY (2015). MeCP2 binds to non-CG methylated DNA as neurons mature, influencing transcription and the timing of onset for Rett syndrome. Proc. Natl. Acad. Sci. USA 112, 5509–5514. [DOI] [PMC free article] [PubMed] [Google Scholar]
- Collins AL, Levenson JM, Vilaythong AP, Richman R, Armstrong DL, Noebels JL, David Sweatt J, and Zoghbi HY (2004). Mild overexpression of MeCP2 causes a progressive neurological disorder in mice. Hum. Mol. Genet. 13, 2679–2689. [DOI] [PubMed] [Google Scholar]
- Dobin A, Davis CA, Schlesinger F, Drenkow J, Zaleski C, Jha S, Batut P, Chaisson M, and Gingeras TR (2013). STAR: ultrafast universal RNA-seq aligner. Bioinformatics 29, 15–21. [DOI] [PMC free article] [PubMed] [Google Scholar]
- Dubes S, Favereaux A, Thoumine O, and Letellier M (2019). miRNA-Dependent Control of Homeostatic Plasticity in Neurons. Front. Cell. Neurosci. 13, 536. 10.3389/fncel.2019.00536. [DOI] [PMC free article] [PubMed] [Google Scholar]
- Edbauer D, Neilson JR, Foster KA, Wang C-F, Seeburg DP, Batterton MN, Tada T, Dolan BM, Sharp PA, and Sheng M (2010). Regulation of synaptic structure and function by FMRP-associated microRNAs miR-125b and miR-132. Neuron 65, 373–384. [DOI] [PMC free article] [PubMed] [Google Scholar]
- Fabbri M, Garzon R, Cimmino A, Liu Z, Zanesi N, Callegari E, Liu S, Alder H, Costinean S, Fernandez-Cymering C, et al. (2007). MicroRNA-29 family reverts aberrant methylation in lung cancer by targeting DNA methyltransferases 3A and 3B. Proc. Natl. Acad. Sci. USA 104, 15805–15810. [DOI] [PMC free article] [PubMed] [Google Scholar]
- Fabregat A, Jupe S, Matthews L, Sidiropoulos K, Gillespie M, Garapati P, Haw R, Jassal B, Korninger F, May B, et al. (2018). The Reactome Pathway Knowledgebase. Nucleic Acids Res. 46 (D1), D649–D655. [DOI] [PMC free article] [PubMed] [Google Scholar]
- Feng J, Chang H, Li E, and Fan G (2005). Dynamic expression of de novo DNA methyltransferases Dnmt3a and Dnmt3b in the central nervous system. J. Neurosci. Res. 79, 734–746. [DOI] [PubMed] [Google Scholar]
- Forsyth JK, and Lewis DA (2017). Mapping the Consequences of Impaired Synaptic Plasticity in Schizophrenia through Development: An Integrative Model for Diverse Clinical Features. Trends Cogn. Sci. 21, 760–778. [DOI] [PMC free article] [PubMed] [Google Scholar]
- Frye RE, Casanova MF, Fatemi SH, Folsom TD, Reutiman TJ, Brown GL, Edelson SM, Slattery JC, and Adams JB (2016). Neuropathological Mechanisms of Seizures in Autism Spectrum Disorder. Front. Neurosci. 10, 192. 10.3389/fnins.2016.00192. [DOI] [PMC free article] [PubMed] [Google Scholar]
- Gabel HW, Kinde B, Stroud H, Gilbert CS, Harmin DA, Kastan NR, Hemberg M, Ebert DH, and Greenberg ME (2015). Disruption of DNA-methylation-dependent long gene repression in Rett syndrome. Nature 522, 89–93. [DOI] [PMC free article] [PubMed] [Google Scholar]
- Geaghan M, and Cairns MJ (2015). MicroRNA and Posttranscriptional Dysregulation in Psychiatry. Biol. Psychiatry 78, 231–239. [DOI] [PubMed] [Google Scholar]
- Gigek CO, Chen ES, and Smith MAC (2016). Methyl-CpG-Binding Protein (MBD) Family: Epigenomic Read-Outs Functions and Roles in Tumorigenesis and Psychiatric Diseases. J. Cell. Biochem. 117, 29–38. [DOI] [PubMed] [Google Scholar]
- Griffiths-Jones S, Grocock RJ, van Dongen S, Bateman A, and Enright AJ (2006). miRBase: microRNA sequences, targets and gene nomenclature. Nucleic Acids Res. 34, D140–D144. [DOI] [PMC free article] [PubMed] [Google Scholar]
- Grimson A, Farh KK-H, Johnston WK, Garrett-Engele P, Lim LP, and Bartel DP (2007). MicroRNA targeting specificity in mammals: determinants beyond seed pairing. Mol. Cell 27, 91–105. [DOI] [PMC free article] [PubMed] [Google Scholar]
- Guo JU, Su Y, Shin JH, Shin J, Li H, Xie B, Zhong C, Hu S, Le T, Fan G, et al. (2014). Distribution, recognition and regulation of non-CpG methylation in the adult mammalian brain. Nat. Neurosci. 17, 215–222. [DOI] [PMC free article] [PubMed] [Google Scholar]
- Hagerman RJ, Berry-Kravis E, Hazlett HC, Bailey DB Jr., Moine H, Kooy RF, Tassone F, Gantois I, Sonenberg N, Mandel JL, and Hagerman PJ (2017). Fragile X syndrome. Nat. Rev. Dis. Primers 3, 17065. [DOI] [PubMed] [Google Scholar]
- Hatten ME, and Roussel MF (2011). Development and cancer of the cerebellum. Trends Neurosci. 34, 134–142. [DOI] [PMC free article] [PubMed] [Google Scholar]
- He Y, and Ecker JR (2015). Non-CG Methylation in the Human Genome. Annu. Rev. Genomics Hum. Genet. 16, 55–77. [DOI] [PMC free article] [PubMed] [Google Scholar]
- Hébert SS, Horré K, Nicolaï L, Papadopoulou AS, Mandemakers W, Silahtaroglu AN, Kauppinen S, Delacourte A, and De Strooper B (2008). Loss of microRNA cluster miR-29a/b-1 in sporadic Alzheimer’s disease correlates with increased BACE1/beta-secretase expression. Proc. Natl.Acad. Sci. USA 105, 6415–6420. [DOI] [PMC free article] [PubMed] [Google Scholar]
- Hüfner K, Frajo-Apor B, and Hofer A (2015). Neurology issues in schizophrenia. Curr. Psychiatry Rep. 17, 32. [DOI] [PubMed] [Google Scholar]
- Jiang X, and Nardelli J (2016). Cellular and molecular introduction to brain development. Neurobiol. Dis. 92 (Pt A), 3–17. [DOI] [PMC free article] [PubMed] [Google Scholar]
- Juźwik CA, Drake SS, Zhang Y, Paradis-Isler N, Sylvester A, Amar-Zifkin A, Douglas C, Morquette B, Moore CS, and Fournier AE (2019). microRNA dysregulation in neurodegenerative diseases: A systematic review. Prog. Neurobiol. 182, 101664. [DOI] [PubMed] [Google Scholar]
- Keown CL, Berletch JB, Castanon R, Nery JR, Disteche CM, Ecker JR, and Mukamel EA (2017). Allele-specific non-CG DNA methylation marks domains of active chromatin in female mouse brain. Proc. Natl. Acad. Sci. USA 114, E2882–E2890. [DOI] [PMC free article] [PubMed] [Google Scholar]
- Khanna S, Rink C, Ghoorkhanian R, Gnyawali S, Heigel M, Wijesinghe DS, Chalfant CE, Chan YC, Banerjee J, Huang Y, et al. (2013). Loss of miR-29b following acute ischemic stroke contributes to neural cell death and infarct size. J. Cereb. Blood Flow Metab. 33, 1197–1206. [DOI] [PMC free article] [PubMed] [Google Scholar]
- Kinde B, Gabel HW, Gilbert CS, Griffith EC, and Greenberg ME (2015). Reading the unique DNA methylation landscape of the brain: Non-CpG methylation, hydroxymethylation, and MeCP2. Proc. Natl. Acad. Sci. USA 112, 6800–6806. [DOI] [PMC free article] [PubMed] [Google Scholar]
- Knight ERW, Patel EY, Flowers CA, Crowther AJ, Ting JP, Miller CR, Gershon TR, and Deshmukh M (2015). ASC deficiency suppresses proliferation and prevents medulloblastoma incidence. Oncogene 34, 394–402. [DOI] [PMC free article] [PubMed] [Google Scholar]
- Kriegel AJ, Liu Y, Fang Y, Ding X, and Liang M (2012). The miR-29 family: genomics, cell biology, and relevance to renal and cardiovascular injury. Physiol. Genomics 44, 237–244. [DOI] [PMC free article] [PubMed] [Google Scholar]
- Langmead B, Trapnell C, Pop M, and Salzberg SL (2009). Ultrafast and memory-efficient alignment of short DNA sequences to the human genome. Genome Biol. 10, R25. [DOI] [PMC free article] [PubMed] [Google Scholar]
- Lavery LA, and Zoghbi HY (2019). The distinct methylation landscape of maturing neurons and its role in Rett syndrome pathogenesis. Curr. Opin. Neurobiol 59, 180–188. [DOI] [PMC free article] [PubMed] [Google Scholar]
- Lei X, Lei L, Zhang Z, Zhang Z, and Cheng Y (2015). Downregulated miR-29c correlates with increased BACE1 expression in sporadic Alzheimer’s disease. Int. J. Clin. Exp. Pathol. 8, 1565–1574. [PMC free article] [PubMed] [Google Scholar]
- Li H, Handsaker B, Wysoker A, Fennell T, Ruan J, Homer N, Marth G, Abecasis G, and Durbin R; 1000 Genome Project Data Processing Subgroup (2009). The Sequence Alignment/Map format and SAMtools. Bioinformatics 25,2078–2079. [DOI] [PMC free article] [PubMed] [Google Scholar]
- Li H, Mao S, Wang H, Zen K, Zhang C, and Li L (2014). MicroRNA-29a modulates axon branching by targeting doublecortin in primary neurons. Protein Cell 5, 160–169. [DOI] [PMC free article] [PubMed] [Google Scholar]
- Lister R, Mukamel EA, Nery JR, Urich M, Puddifoot CA, Johnson ND, Lucero J, Huang Y, Dwork AJ, Schultz MD, et al. (2013). Global epigenomic reconfiguration during mammalian brain development. Science 341, 1237905. [DOI] [PMC free article] [PubMed] [Google Scholar]
- Liu K, Xu C, Lei M, Yang A, Loppnau P, Hughes TR, and Min J (2018a). Structural basis for the ability of MBD domains to bind methyl-CG and TG sites in DNA. J. Biol. Chem. 293, 7344–7354. [DOI] [PMC free article] [PubMed] [Google Scholar]
- Liu Z, Li Z, Zhi X, Du Y, Lin Z, and Wu J (2018b). Identification of De Novo DNMT3A Mutations That Cause West Syndrome by Using Whole-Exome Sequencing. Mol. Neurobiol. 55, 2483–2493. [DOI] [PubMed] [Google Scholar]
- Lombardi LM, Baker SA, and Zoghbi HY (2015). MECP2 disorders: from the clinic to mice and back. J. Clin. Invest. 125, 2914–2923. [DOI] [PMC free article] [PubMed] [Google Scholar]
- Long J, Wang Y, Wang W, Chang BHJ, and Danesh FR (2011). MicroRNA-29c is a signature microRNA under high glucose conditions that targets Sprouty homolog 1, and its in vivo knockdown prevents progression of diabetic nephropathy. J. Biol. Chem. 286, 11837–11848. [DOI] [PMC free article] [PubMed] [Google Scholar]
- Love MI, Huber W, and Anders S (2014). Moderated estimation of fold change and dispersion for RNA-seq data with DESeq2. Genome Biol. 15, 550. [DOI] [PMC free article] [PubMed] [Google Scholar]
- Luo C, Lancaster MA, Castanon R, Nery JR, Knoblich JA, and Ecker JR (2016). Cerebral Organoids Recapitulate Epigenomic Signatures of the Human Fetal Brain. Cell Rep. 17, 3369–3384. [DOI] [PMC free article] [PubMed] [Google Scholar]
- Luo C, Keown CL, Kurihara L, Zhou J, He Y, Li J, Castanon R, Lucero J, Nery JR, Sandoval JP, et al. (2017). Single-cell methylomes identify neuronal subtypes and regulatory elements in mammalian cortex. Science 357, 600–604. [DOI] [PMC free article] [PubMed] [Google Scholar]
- Margis R, Margis R, and Rieder CR (2011). Identification of blood micro-RNAs associated to Parkinsonĭs disease. J. Biotechnol. 152, 96–101. [DOI] [PubMed] [Google Scholar]
- Martin M (2011). Cutadapt removes adapter sequences from high-throughput sequencing reads. EMBnet.journal 17, 10–12. [Google Scholar]
- McKiernan RC, Jimenez-Mateos EM, Bray I, Engel T, Brennan GP, Sano T, Michalak Z, Moran C, Delanty N, Farrell M, et al. (2012). Reduced mature microRNA levels in association with dicer loss in human temporal lobe epilepsy with hippocampal sclerosis. PLoS ONE 7, e35921. [DOI] [PMC free article] [PubMed] [Google Scholar]
- McTague A, Howell KB, Cross JH, Kurian MA, and Scheffer IE (2016). The genetic landscape of the epileptic encephalopathies of infancy and childhood. Lancet Neurol. 15, 304–316. [DOI] [PubMed] [Google Scholar]
- Miller BH, Zeier Z, Xi L, Lanz TA, Deng S, Strathmann J, Willoughby D, Kenny PJ, Elsworth JD, Lawrence MS, et al. (2012). MicroRNA-132 dysregulation in schizophrenia has implications for both neurodevelopment and adult brain function. Proc. Natl. Acad. Sci. USA 109, 3125–3130. [DOI] [PMC free article] [PubMed] [Google Scholar]
- Mo A, Mukamel EA, Davis FP, Luo C, Henry GL, Picard S, Urich MA, Nery JR, Sejnowski TJ, Lister R, et al. (2015). Epigenomic Signatures of Neuronal Diversity in the Mammalian Brain. Neuron 86, 1369–1384. [DOI] [PMC free article] [PubMed] [Google Scholar]
- Moore LD, Le T, and Fan G (2013). DNA methylation and its basic function. Neuropsychopharmacology 38, 23–38. [DOI] [PMC free article] [PubMed] [Google Scholar]
- Pandi G, Nakka VP, Dharap A, Roopra A, and Vemuganti R (2013). MicroRNA miR-29c down-regulation leading to de-repression of its target DNA methyltransferase 3a promotes ischemic brain damage. PLoS ONE 8, e58039. [DOI] [PMC free article] [PubMed] [Google Scholar]
- Papadopoulou AS, Serneels L, Achsel T, Mandemakers W, Callaerts-Vegh Z, Dooley J, Lau P, Ayoubi T, Radaelli E, Spinazzi M, et al. (2015). Deficiency of the miR-29a/b-1 cluster leads to ataxic features and cerebellar alterations in mice. Neurobiol. Dis. 73, 275–288. [DOI] [PubMed] [Google Scholar]
- Patro R, Duggal G, Love MI, Irizarry RA, and Kingsford C (2017). Salmon provides fast and bias-aware quantification of transcript expression. Nat. Methods 14, 417–419. [DOI] [PMC free article] [PubMed] [Google Scholar]
- Petri R, Malmevik J, Fasching L, Åkerblom M, and Jakobsson J (2014). miRNAs in brain development. Exp. Cell Res. 321, 84–89. [DOI] [PubMed] [Google Scholar]
- Piñero J, Bravo À, Queralt-Rosinach N, Gutiérrez-Sacristán A, Deu-Pons J, Centeno E, García-García J, Sanz F, and Furlong LI (2017). DisGeNET: a comprehensive platform integrating information on human disease-associated genes and variants. Nucleic Acids Res. 45 (D1), D833–D839. [DOI] [PMC free article] [PubMed] [Google Scholar]
- Qi L, Hongjuan H, Ning G, Zhengbin H, Yanjiang X, Tiebo Z, Zhijun H, and Qiong W (2013). miR-370 is stage-specifically expressed during mouse embryonic development and regulates Dnmt3a. FEBS Lett. 587, 775–781. [DOI] [PubMed] [Google Scholar]
- Raudvere U, Kolberg L, Kuzmin I, Arak T, Adler P, Peterson H, and Vilo J (2019). g:Profiler: a web server for functional enrichment analysis and conversions of gene lists (2019 update). Nucleic Acids Res. 47 (W1), W191–W198. [DOI] [PMC free article] [PubMed] [Google Scholar]
- Ripa R, Dolfi L,Terrigno M, Pandolfini L, Savino A, Arcucci V, Groth M, Terzibasi Tozzini E, Baumgart M, and Cellerino A (2017). MicroRNA miR-29 controls a compensatory response to limit neuronal iron accumulation during adult life and aging. BMC Biol. 15, 9. [DOI] [PMC free article] [PubMed] [Google Scholar]
- Rizzardi LF, Hickey PF, Rodriguez DiBlasi V, Tryggvadóttir R, Callahan CM, Idrizi A, Hansen KD, and Feinberg AP (2019). Neuronal brain-region-specific DNA methylation and chromatin accessibility are associated with neuropsychiatric trait heritability. Nat. Neurosci. 22, 307–316. [DOI] [PMC free article] [PubMed] [Google Scholar]
- Roshan R, Shridhar S, Sarangdhar MA, Banik A, Chawla M, Garg M, Singh VP, and Pillai B (2014). Brain-specific knockdown of miR-29 results in neuronal cell death and ataxia in mice. RNA 20, 1287–1297. [DOI] [PMC free article] [PubMed] [Google Scholar]
- Samaco RC, Mandel-Brehm C, McGraw CM, Shaw CA, McGill BE, and Zoghbi HY (2012). Crh and Oprm1 mediate anxiety-related behavior and social approach in a mouse model of MECP2 duplication syndrome. Nat. Genet. 44, 206–211. [DOI] [PMC free article] [PubMed] [Google Scholar]
- Santarelli DM, Beveridge NJ, Tooney PA, and Cairns MJ (2011). Upregulation of dicer and microRNA expression in the dorsolateral prefrontal cortex Brodmann area 46 in schizophrenia. Biol. Psychiatry 69, 180–187. [DOI] [PubMed] [Google Scholar]
- Schratt GM, Tuebing F, Nigh EA, Kane CG, Sabatini ME, Kiebler M, and Greenberg ME (2006). A brain-specific microRNA regulates dendritic spine development. Nature 439, 283–289. [DOI] [PubMed] [Google Scholar]
- Siegert S, Seo J, Kwon EJ, Rudenko A, Cho S, Wang W, Flood Z, Martorell AJ, Ericsson M, Mungenast AE, and Tsai L-H (2015). The schizophrenia risk gene product miR-137 alters presynaptic plasticity. Nat. Neurosci. 18, 1008–1016. [DOI] [PMC free article] [PubMed] [Google Scholar]
- Stark KL, Xu B, Bagchi A, Lai WS, Liu H, Hsu R, Wan X, Pavlidis P, Mills AA, Karayiorgou M, and Gogos JA (2008). Altered brain microRNA biogenesis contributes to phenotypic deficits in a 22q11-deletion mouse model. Nat. Genet. 40, 751–760. [DOI] [PubMed] [Google Scholar]
- Stiles J, and Jernigan TL (2010). The basics of brain development. Neuropsychol. Rev. 20, 327–348. [DOI] [PMC free article] [PubMed] [Google Scholar]
- Stroud H, Su SC, Hrvatin S, Greben AW, Renthal W, Boxer LD, Nagy MA, Hochbaum DR, Kinde B, Gabel HW, and Greenberg ME (2017). Early-Life Gene Expression in Neurons Modulates Lasting Epigenetic States. Cell 171, 1151–1164.e16. [DOI] [PMC free article] [PubMed] [Google Scholar]
- Sun E, and Shi Y (2015). MicroRNAs: Small molecules with big roles in neurodevelopment and diseases. Exp. Neurol. 268, 46–53. [DOI] [PubMed] [Google Scholar]
- Szklarczyk D, Franceschini A, Kuhn M, Simonovic M, Roth A, Minguez P, Doerks T, Stark M, Muller J, Bork P, et al. (2011). The STRING database in 2011: functional interaction networks of proteins, globally integrated and scored. Nucleic Acids Res. 39, D561–D568. [DOI] [PMC free article] [PubMed] [Google Scholar]
- Tatton-Brown K, Seal S, Ruark E, Harmer J, Ramsay E, Del Vecchio Duarte S, Zachariou A, Hanks S, O’Brien E, Aksglaede L, et al. ; Childhood Overgrowth Consortium (2014). Mutations in the DNA methyltransferase gene DNMT3A cause an overgrowth syndrome with intellectual disability. Nat. Genet. 46, 385–388. [DOI] [PMC free article] [PubMed] [Google Scholar]
- Toga AW, Thompson PM, and Sowell ER (2006). Mapping brain maturation. Trends Neurosci. 29, 148–159. [DOI] [PMC free article] [PubMed] [Google Scholar]
- Tonacci A, Bagnato G, Pandolfo G, Billeci L, Sansone F, Conte R, and Gangemi S (2019). MicroRNA Cross-Involvement in Autism Spectrum Disorders and Atopic Dermatitis: A Literature Review. J. Clin. Med. 8, 88. [DOI] [PMC free article] [PubMed] [Google Scholar]
- Xi Y, and Li W (2009). BSMAP: whole genome bisulfite sequence MAPping program. BMC Bioinformatics 10, 232. [DOI] [PMC free article] [PubMed] [Google Scholar]
- Xi J, Wu Y, Li G, Ma L, Feng K, Guo X, Jia W, Wang G, Yang G, Li P, and Kang J (2017). Mir-29b Mediates the Neural Tube versus Neural Crest Fate Decision during Embryonic Stem Cell Neural Differentiation. Stem Cell Reports 9, 571–586. [DOI] [PMC free article] [PubMed] [Google Scholar]
- Xie W, Barr CL, Kim A, Yue F, Lee AY, Eubanks J, Dempster EL, and Ren B (2012). Base-resolution analyses of sequence and parent-of-origin dependent DNA methylation in the mouse genome. Cell 148, 816–831. [DOI] [PMC free article] [PubMed] [Google Scholar]
- Xu H, Sun J, Shi C, Sun C, Yu L, Wen Y, Zhao S, Liu J, Xu J, Li H, et al. (2015). miR-29s inhibit the malignant behavior of U87MG glioblastoma cell line by targeting DNMT3A and 3B. Neurosci. Lett. 590, 40–46. [DOI] [PubMed] [Google Scholar]
- Xu B, Cao J, Zhang J, Jia S, Wu S, Mo K, Wei G, Liang L, Miao X, Bekker A, and Tao Y-X (2017). Role of MicroRNA-143 in Nerve Injury-Induced Upregulation of Dnmt3a Expression in Primary Sensory Neurons. Front. Mol. Neurosci. 10, 350. [DOI] [PMC free article] [PubMed] [Google Scholar]
- Yang D, Wang G, Zhu S, Liu Q, Wei T, Leng Y, Duan T, and Kang J (2014). MiR-495 suppresses mesendoderm differentiation of mouse embryonic stem cells via the direct targeting of Dnmt3a. Stem Cell Res. (Amst.) 12, 550–561. [DOI] [PubMed] [Google Scholar]
- Yuen RKC, Merico D, Cao H, Pellecchia G, Alipanahi B, Thiruvahindrapuram B, Tong X, Sun Y, Cao D, Zhang T, et al. (2016). Genome-wide characteristics of de novo mutations in autism. NPJ Genom. Med. 1, 160271–1602710. [DOI] [PMC free article] [PubMed] [Google Scholar]
Associated Data
This section collects any data citations, data availability statements, or supplementary materials included in this article.
Supplementary Materials
Data Availability Statement
The accession numbers for the sequencing data reported in this paper have been deposited in Gene Expression Omnibus (GEO): GSE140163, GSE157841.