

Abstract
Clinical studies have indicated that obesity and diabetes are associated with Alzheimer's disease (AD) and neurodegeneration. However, the mechanism by which obesity/diabetes and AD interact with each other and contribute to dementia remains elusive. To obtain insights into their interaction at molecular levels, we performed gene expression analysis of APP;ob/ob mice, which were generated by crossing transgenic AD model mice (APP23 mice) with ob/ob mice, which are obese and mildly diabetic. The Aβ level in these mice was reduced compared with that in pure APP mice. However, we identified a cluster of genes (cluster 10) upregulated in APP;ob/ob mice but not in either APP or ob/ob mice. Interestingly, genes upregulated in the human AD brain were enriched in cluster 10. Moreover, genes in cluster 10 formed a network and shared upregulated genes with a cell model of neurodegeneration and other models of neurological disorders such as ischemia and epilepsy. In silico analyses showed that serum response factor (SRF), recently identified in a single‐cell analysis of human brains as a transcription factor that can control the conversion from healthy cells to AD cells, might be a common transcriptional regulator for a subset of cluster 10 genes. These data suggest that upregulation of genes uniquely associated with APP;ob/ob mice is an evidence of the interaction between obesity/diabetes and AD.
Keywords: Alzheimer's disease, animal models, diabetes, interaction, obesity
Abbreviations
- AD
Alzheimer's disease
- APP
amyloid precursor protein
- Aβ
β‐amyloid
- Btg2
BTG anti‐proliferation factor 2
- CNS
central nervous system
- Cyr61
cysteine‐rich angiogenic inducer 61
- Dap12
DNAX‐activation protein 12
- Dusp1
dual specificity phosphatase 1
- Fos
fos proto‐oncogene, AP‐1 transcription factor subunit
- GFAP
glial fibrillary acidic protein
- JunB
junB proto‐oncogene, AP‐1 transcription factor subunit
- Lss
lanosterol synthase
- Mag
myelin‐associated glycoprotein
- Npas4
neuronal PAS domain protein 4
- Plp1
proteolipid protein 1
- Trem2
triggering receptor expressed on myeloid cells 2
1. INTRODUCTION
Emerging evidence suggests that diabetes is associated with Alzheimer's disease (AD) and neurodegeneration, 1 , 2 , 3 , 4 , 5 , 6 , 7 although the mechanisms underlying this association remain elusive. 8 , 9 Several neuropathological studies have reported that diabetes is not associated with amyloid accumulation or neurofibrillary tangles (NFT) formation, 10 , 11 , 12 , 13 while some studies have indicated that amyloid accumulation is lower in AD patients with diabetes than in those without diabetes. 14 , 15 , 16 , 17 Diabetes exacerbates frontal and temporal lobe atrophy, and patients with diabetes present clinically with decreased executive function and processing speed. 18 Obesity, which is closely linked to diabetes, also increases the risk of dementia. 19 The FINGER study showed that multidomain interventions, such as exercise, diet, cardiovascular control, and cognitive training, ameliorate cognitive functions such as executive function and processing speed in subjects with obesity and other risk factors for dementia. 20 Therefore, cognitive function exacerbated by obesity/diabetes might be preserved by exercise, diet, and cardiovascular control, although the effect of cognitive training in the FINGER study cannot be excluded. Therefore, determining the mechanisms by which obesity/diabetes increase the risk of dementia would provide insight into the development of novel therapeutics for dementia.
To clarify the molecular mechanisms by which obesity/diabetes modify cognitive function, we performed gene expression analysis of amyloid precursor protein (APP);ob/ob mice, which are AD model mice with diabetes‐linked obesity. 21 , 22 We generated APP;ob/ob mice by crossing transgenic AD model mice (APP23 mice) with ob/ob mice. APP23 mice overexpress APP with Swedish familial AD mutations and exhibit amyloid deposition. 23 Ob/ob mice are leptin‐deficient and become obese and diabetic. 24 , 25 , 26 We previously observed that APP;ob/ob mice exhibit cognitive dysfunction at a young age and neurodegeneration in later life. 21 , 27 Here, we identified a unique set of genes that are upregulated in the mouse brain only when obesity and ectopic APP expression are combined. Indeed, these genes exhibit substantial overlap with genes upregulated in the hippocampus of humans with AD. Moreover, these genes are upregulated in a cell model of neurodegeneration 28 and in animal models of neurological disorders, such as ischemia models 29 and an epilepsy model, 30 indicating the common roles of these genes in neurodegeneration. These data suggest that upregulation of a subset of genes in APP;ob/ob mice is the evidence of the interaction between obesity/diabetes and AD.
2. MATERIALS AND METHODS
2.1. Animals
All animal experiments were performed in compliance with the Guidelines for the Care and Use of Laboratory Animals of Osaka University School of Medicine. Animals were maintained at room temperature (25 ± 2°C) under a standard 12/12‐h light–dark cycle, with free access to water and standard chow. All mice were on the same genetic background (C57BL/6 J) and were housed without enrichment structures in a specific pathogen‐free environment. APP;ob/ob mice were generated by crossbreeding APP23 mice with ob/ob mice (Charles River Japan Inc., Japan) as we previously described. 21 Male heterozygous APP23 (APP) mice were crossbred with female heterozygous ob/+ mice to generate APP;ob/+ and ob/+ founder mice. We then intercrossed these mice to obtain APP;ob/ob, APP, ob/ob, and wild‐type littermate mice. We used real‐time PCR to assess APP expression in the brains of these mice. Male 16‐month‐old mice were used for analysis.
2.2. Tissue collection and sample preparation
Mice were anesthetized with xylazine and ketamine (20 and 100 mg/kg, respectively). After transcardial perfusion with PBS supplemented with complete protease inhibitor cocktail (Nacalai Tesque), the brain was removed and divided along the sagittal plane; then, the right hemisphere (cortical and hippocampal areas) was snap frozen in liquid nitrogen and stored at −80°C until biochemical analysis. The left hemisphere was fixed with 4% paraformaldehyde overnight and was then embedded in paraffin for histological analysis. For biochemical analysis, tissues were pulverized in a prechilled (on dry ice) BioPulverizer (BioSpec) and homogenized with a polytron homogenizer (Kinematica) at a ratio of 20 mL/g wet weight brain tissue in ice‐cold RIPA lysis buffer (Millipore) containing 0.1% SDS and complete protease inhibitor cocktail (Roche) on ice. After centrifugation at 100,000 × g for 1 h at 4°C, the supernatant was collected and used for biochemical analysis. The order of sample preparation and subsequent analyses was randomly assigned independent of genotype.
2.3. RNA‐seq
Total RNA was extracted using an RNeasy Lipid Tissue Mini Kit (Qiagen). mRNA was isolated from purified total RNA using a Micropoly(A)PuristTM mRNA Purification Kit (Thermo Fisher Scientific). cDNA was reverse transcribed from mRNA after fragmentation using a SOLIDTM Total RNA‐Seq Kit (Thermo Fisher Scientific). The quality of RNA and cDNA was assessed with a bioanalyzer (Agilent). Sequencing was performed using a next‐generation sequencing system (5500xl SOLiD System, Thermo Fisher Scientific).
2.4. Classification of differentially expressed genes (DEGs)
We selected 2543 DEGs with a q < 0.05 in a comparison between any two groups. Next, we used agglomerative hierarchical clustering based on Ward's method and the Euclidean distance to separate the DEGs into 10 clusters. The number of clusters was set to 10 based on the gap statistic (Figure S1). 31 All analyses were performed in R. 32
2.5. Enrichment analysis of cell‐specific genes
To analyze the enrichment of cell‐specific genes in each cluster, we used publicly available RNA‐seq datasets of neurons, astrocytes, oligodendrocyte precursor cells (OPCs), newly formed oligodendrocytes (NFOs), myelinating oligodendrocytes (MOs), microglia, endothelial cells, and pericytes from the mouse cerebral cortex. 33 We used seven of these eight cell types (all except pericytes). Among 22,458 genes, we selected 10,952 genes with gene expression fold changes of >5 when mean values were compared between any two cell types. Next, we used agglomerative hierarchical clustering based on Ward's method and the Euclidean distance to separate these 10,952 genes into 20 clusters. Among the 20 clusters, we manually curated 7 that generally showed a prominent peak in a specific cell type (Figure S2A). NFOs and MOs were integrated into one cluster. We finally defined the genes in each cluster as cell‐specific genes (Figure S2B). To examine the extent of overlap between the cell‐specific genes and the genes in a cluster, we calculated the p‐value using a hypergeometric distribution test and the fold enrichment ratio (FER), as follows:
where x is the number of genes overlapping between the set of cell‐specific genes and the set of genes in a cluster, m is the number of cell‐specific genes, n is the number of genes in a cluster, N is the total number of genes, and E is the expected value. An FER of greater than 1 indicates that the overlap between the cell‐specific genes and the genes in a cluster is higher than expected.
2.6. Enrichment analysis of DEGs in the human AD brain
We used AlzData to identify the genes up‐ or downregulated in the human AD brain. 27 AlzData is a database that stores statistical meta‐analysis results analyzed in the entorhinal cortex (EC), frontal cortex (FC), hippocampus (HIP), and temporal cortex (TC). Gene expression levels were analyzed with a linear regression model including age and sex as covariates. We downloaded processed data from AlzData and used the log2‐fold change (log2FC) values and FDR‐adjusted p‐values in the processed data. To examine the extent of overlap between the DEGs (adjusted p < 0.05) in the human AD brain and the genes in a cluster, we calculated the p‐values with a hypergeometric distribution test and determined the FER.
2.7. Prediction of potential regulators
To predict transcription factors (TFs) that may regulate the expression levels of the genes in cluster 10, we used oPOSSUM (version 3.0) to search for conserved TF‐binding sites in regions ±5 kb from the transcription start sites of the genes. 34 The TFs exhibited a z‐score of ≥10 and a Fisher score of ≥7 (default values) in “Mouse Single Site Analysis” in oPOSSUM.
2.8. Quantitative real‐time PCR
Total RNA was purified from brain tissues using an RNeasy Lipid Tissue Mini kit (QIAGEN) and was then eluted in nuclease‐free water and stored at −80°C. Reverse transcription was performed using ReverTra Ace® qPCR RT Master Mix (TOYOBO). Real‐time PCR was conducted with Luna Universal qPCR Master Mix (New England Biolabs) in an i1000 thermal cycler (Bio‐Rad) to detect the mRNA levels of glial fibrillary acidic protein (Gfap), myelin‐associated glycoprotein (Mag), proteolipid protein 1 (Plp1), DNAX‐activation protein 12 (Dap12), triggering receptor expressed on myeloid cells 2 (Trem2), C‐C motif chemokine ligand 3 (Ccl3), C‐C motif chemokine ligand 4 (Ccl4), BTG anti‐proliferation factor 2 (Btg2), cysteine‐rich angiogenic inducer 61 (Cyr61), an AP‐1 transcription factor subunit (JunB), lanosterol synthase (Lss), dual specificity phosphatase 1 (Dusp1), Fos (an AP‐1 transcription factor subunit), neuronal PAS domain protein 4 (Npas4), β‐tubulin (Tubb4a), and β‐actin. The following primers were used: β‐actin forward primer: AGTGTGACGTTGACATCCGTA and reverse primer: GCCAGAGCAGTAATCTCCTTC; Trem2 forward primer: TGCTGGCAAAGGAAAGGT and reverse primer: GTTGAGGGCTTGGGACAGG; Dap12 forward primer: GTTGACTCTGCTGATTGCCCT and reverse primer: CCCTTCCGCTGTCCCTTGA (all obtained from Integrated DNA Technologies); Btg2 forward primer: ATGAGCCACGGGAAGAGAAC and reverse primer: GCCCTACTGAAAACCTTGAGTC; Cyr61 forward primer: CTGCGCTAAACAACTCAACGA and reverse primer: GCAGATCCCTTTCAGAGCGG; JunB forward primer: TCACGACGACTCTTACGCAG and reverse primer: CCTTGAGACCCCGATAGGGA; Lss forward primer: TCGTGGGGGACCCTATAAAAC and reverse primer: CGTCCTCCGCTTGATAATAAGTC; Dusp1 forward primer, GTTGTTGGATTGTCGCTCCTT and reverse primer: TTGGGCACGATATGCTCCAA; Fos forward primer: CGGGTTTCAACGCCGACTA and reverse primer: TTGGCACTAGAGACGGACAGA; Npas4 forward primer: AGCATTCCAGGCTCATCTGAA and reverse primer, GGCGAAGTAAGTCTTGGTAGGATT; β‐tubulin forward primer: CACCTGCAAGCCGGTCAAT and reverse primer: TCCCCATGATAGGTCCCAGTG; Gfap forward primer: CGGAGACGCATCACCTCTG and reverse primer: AGGGAGTGGAGGAGTCATTCG; Ccl3 forward primer: TTCTCTGTACCATGCACTCTGC and reverse primer: CGTGGAATCTTCCGGCTGTAG; Ccl4 forward primer: TTCCTGCTGTTTCTCTTACACCT and reverse primer: CTGTCTGCCTCTTTTGGTCAG; Mag forward primer: CTGCCGCTGTTTTGGATAATGA and reverse primer: CATCGGGGAAGTCGAAACGG; and Plp1 forward primer: CCAGAATGTATGGTGTTCTCCC and reverse primer: GGCCCATGAGTTTAAGGACG. The relative expression levels were quantified and analyzed using Bio‐Rad iCycler iQ software (Bio‐Rad). Relative mRNA levels were calculated using the ΔΔCt method with β‐actin or β‐tubulin, as appropriate, as the internal control for each specific gene amplification reaction.
2.9. ELISA and other biochemical assays
The levels of GFAP and CD11b were measured using ELISA as previously described. 35 Colorimetric quantification was performed with an iMark plate reader (Bio‐Rad) after incubation with horseradish peroxidase (HRP)‐conjugated Avidin‐D (Vector) or anti‐rabbit IgG (H + L), HRP conjugate (Promega), and the 3,3′,5,5′‐tetramethylbenzidine substrate (Sigma‐Aldrich). For measurement of Aβ, brain samples were homogenized in 5 volumes (w/v) of 1% Triton X‐100 in 25 mM Tris‐buffered saline (TBS) (pH 7.9) containing complete protease inhibitor (Roche) using a Teflon‐glass homogenizer. After incubation on ice for 3 h, the homogenate was centrifuged at 100,000 × g for 20 min at 4°C. The supernatant was saved as the Triton X‐100 soluble fraction. The resulting pellet was mixed with 5 volumes (w/v) of 5 M guanidine HCl, sonicated, and incubated for 2 h at room temperature. The mixtures were diluted with TBS and centrifuged at 4000 × g for 20 min at 4°C. The supernatants were neutralized before loading onto the ELISA plates. Human/rat Aβ40 and Aβ42 levels were measured by ELISA following the manufacturer's instructions (Wako).
2.10. Immunohistochemical staining
Mouse brains were fixed as described in the “Tissue collection and sample preparation” section. Brain samples were embedded in paraffin and sliced into 10‐μm‐thick sections. Brain sections were submerged in EDTA buffer (1 mM, pH 8.0) and autoclaved for antigen retrieval. The sections were immersed in 95% formic acid for Aβ staining. Endogenous peroxidase activity was quenched by incubating the sections with hydrogen peroxide. Sections were incubated with primary antibodies at 4°C overnight; we used an anti‐Aβ (6E10, epitope: 3–8 aa of Aβ) antibody (Merck). Sections were then incubated with an HRP‐conjugated secondary antibody and diaminobenzidine reaction mixture (Vector Laboratories). The stained sections were evaluated under a microscope (BZ‐X810, Keyence).
2.11. Klüver–Barrera (KB) staining
Brain sections were treated with Luxol Fast Blue solution (Muto Pure Chemical, Japan) at 65°C overnight. The sections were chilled to room temperature, rinsed with 95% ethanol and distilled water, treated with 0.1% lithium carbonate and 70% ethanol, rinsed with distilled water and counterstained with 0.1% cresyl violet acetate solution (Muto Pure Chemicals) containing 10% acetic acid. Sections were dehydrated with 95% ethanol, cleared with xylene, and mounted with Entelan® New (Merck, USA). Histological analysis was performed using a Leica microscope (DM5000B, Leica, Wetzlar, Germany), and images of the paramedial corpus callosum in each group were acquired.
2.12. Statistical analysis
Statistical analyses were performed using JMP Pro software (version 12, SAS Institute Inc.). All data are expressed as the means ± S.E.M. values. Two‐group comparisons were performed with Student's t‐test. Comparison of means among three or more groups was performed by analysis of variance (ANOVA) followed by the Tukey–Kramer multiple‐range test. Values of p < 0.05 were considered to indicate significant differences.
3. RESULTS
We previously generated an animal model reflecting the pathologic condition of both AD and diabetes‐linked obesity (APP;ob/ob mice) and reported early cognitive impairment, neuroinflammation, vascular dysfunction, and insulin signalling disturbances despite a trends of reduced Aβ accumulation, especially in old age. 21 Consistent with these findings, Aβ accumulation was significantly reduced in APP;ob/ob mice compared with APP mice at 16 months of age, as shown by the results of both immunohistochemical staining (Figure S3A) and biochemical analyses (Figure S3B‐E). This pattern might be in part due to the lower expression of APP in APP;ob/ob mice (Figure 3F). To characterize changes at the molecular level in more detail, we performed RNA‐seq on brain samples of these mice at this age. Gene expression analysis showed the characteristic features of each genotype. Accordingly, we classified these expression patterns into 10 clusters (Figure 1A). Clusters 1, 2, and 3 contained genes that were generally downregulated in ob/ob, APP, and APP;ob/ob mice compared with wild‐type mice. Cluster 4 contained genes that were downregulated specifically in APP mice, while clusters 6 and 8 contained genes that were upregulated in APP mice. Notably, cluster 10 contained genes that were upregulated in APP;ob/ob mice but not in either APP or ob/ob mice (Figure 1B).
FIGURE 1.
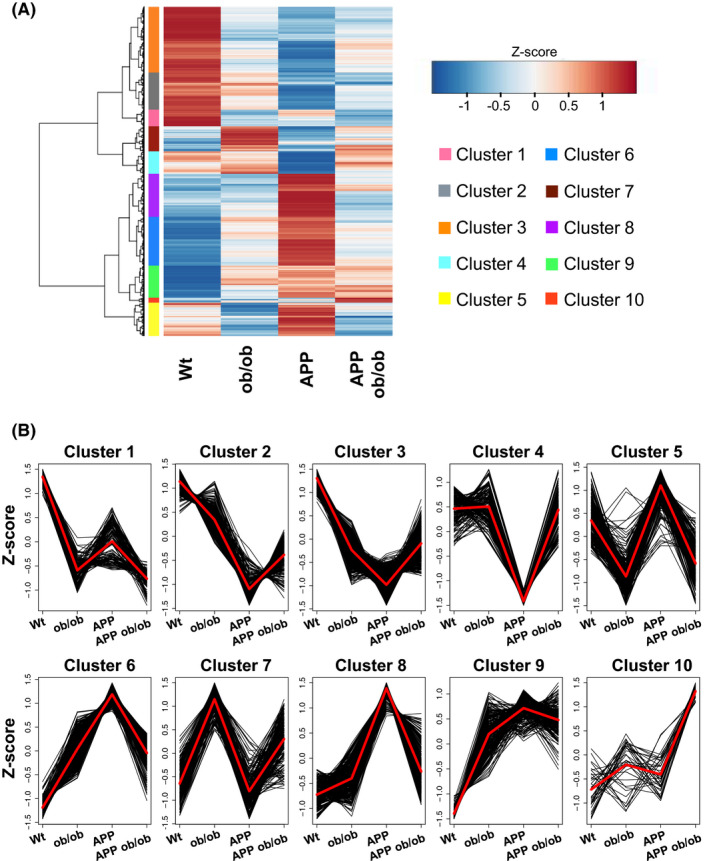
Classification of DEGs. (A) Hierarchical clustering and heatmap of wild‐type (WT), APP23 (APP), diabetic (ob/ob), and APP;ob/ob mice. The expression levels of each gene were averaged over biological replicates (n = 3 mice/group) and were transformed into z‐scores for the four mouse genotypes. Each row and each element represent each gene and the z‐score for that gene, respectively. In this analysis, 2543 genes that were significantly differentially expressed (FDR <0.05) in at least one comparison between mouse genotypes were analyzed. The colors to the left of the heatmap indicate each cluster. (B) Detailed gene expression patterns in each cluster shown in A. The black and red polygonal lines indicate the z‐scores of the genes and their averaged z‐scores, respectively. Clustering was performed using Ward's method. The number of clusters was set to 10 based on the gap statistic (Figure S1)
We next performed enrichment analysis on each gene cluster to understand the properties represented by each cluster. Enrichment analysis of gene function showed that clusters 1, 2, and 3 containing genes with reduced expression in APP, ob/ob, and APP;ob/ob mice were enriched with genes involved in translation and mitochondrial function (Table S1). Enrichment analysis of cell‐specific genes showed that cluster 5, containing genes with downregulated expression in both ob/ob and APP;ob/ob mice (i.e., mice on the ob/ob background), was enriched with genes specific to oligodendrocyte and microglial cells (Figure 2). Moreover, genes specific to astrocytes and microglial cells were enriched in cluster 8, which contained genes with increased expression in APP mice but not in APP;ob/ob mice. To confirm the results of RNA‐seq, we performed real‐time qPCR; indeed, the levels of genes belonging to clusters 5 and 8, including the astrocyte marker (Gfap), microglial‐related genes (Dap12, Trem2, Ccl3, and Ccl4), and oligodendrocyte‐related genes (Mag and Plp1), exhibited changes similar to those observed in the RNA‐seq data (Figure 3A‐G). The protein levels of an astrocyte marker (GFAP) and a microglial‐related marker (CD11b) showed trends similar to those in their mRNA levels (Figure 3H and I). Notably, apparent white matter lesions were observed in ob/ob and APP;ob/ob mice, suggesting that the levels of oligodendrocyte‐related genes were decreased in these mice (Figure S4).
FIGURE 2.
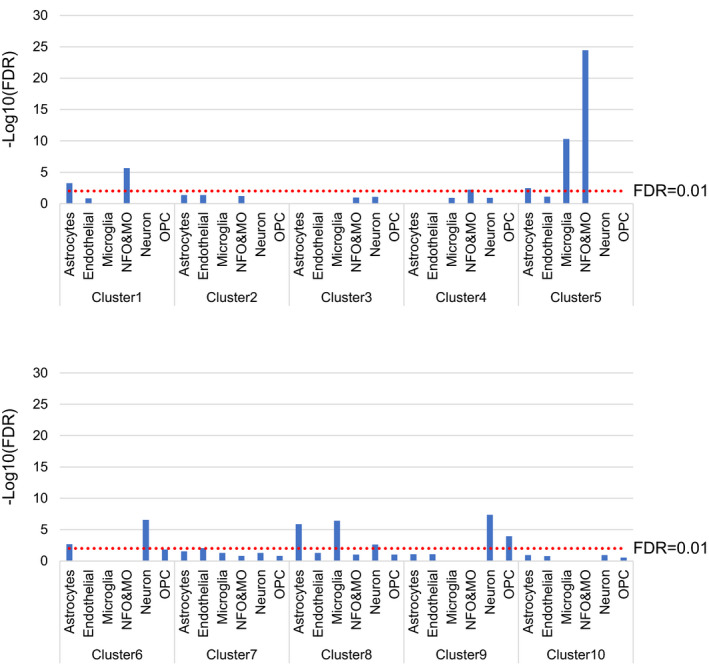
Enrichment analysis of cell‐specific genes. The y‐axis shows the –log10 FDR‐adjusted p‐values calculated by the hypergeometric test. Each bar shows only the –log10(FDR) with FER >1. An FER of greater than one means that the proportion of cell‐specific genes is higher than the expected proportion. The red line indicates an FDR‐adjusted p‐value of 0.01. NFO: newly formed oligodendrocytes, MO: myelinating oligodendrocytes, and OPC: oligodendrocyte precursor cells
FIGURE 3.
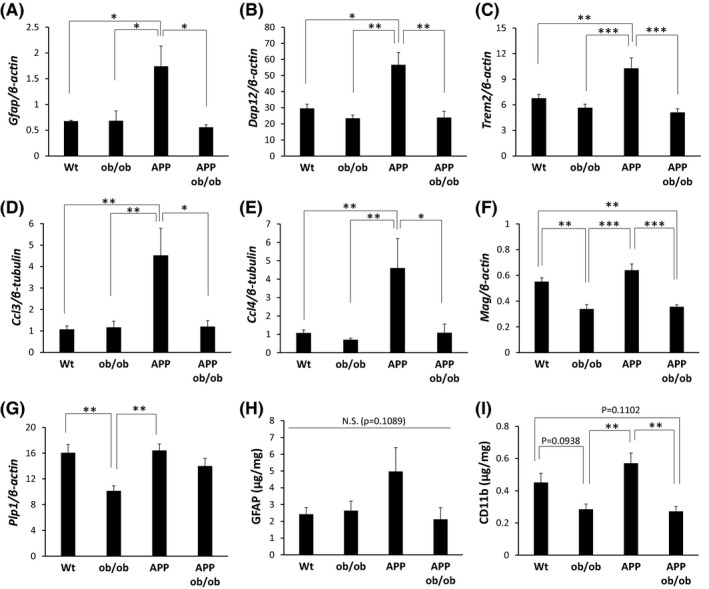
Validation of gene expression patterns for clusters 5 and 8 by real‐time PCR or ELISA. The mRNA levels of Gfap (A), Dap12 (B), Trem2 (C), Ccl3 (D), Ccl4 (E), Mag (F), and Plp1 (G) were measured using real‐time PCR and were compared among the genotypes (n = 4–6 mice/group). The protein levels of GFAP (H) and CD11b (I) were measured using ELISA and compared among the genotypes (n = 4–6 mice/group). The data are presented as the adjusted means ± standard errors of the mean. *p < 0.05, **p < 0.01, and ***p < 0.001 by the Tukey–Kramer test. Wt = wild‐type
Then, we compared our RNA‐seq data with publicly available datasets of data from human AD brains and examined their overlap (Figure 4 and Table S2). Clusters 5, 6, and 8 were overrepresented with genes with upregulated expression in brains from patients with AD. On the other hand, clusters 2, 3, and 4 were enriched with genes with downregulated expression in brains from patients with AD. Interestingly, similar to clusters 5, 6, and 8, cluster 10 was enriched with genes with upregulated expression in brains from patients with AD, especially in the hippocampal area that is most vulnerable in AD patients, suggesting their critical roles in AD pathogenesis.
FIGURE 4.
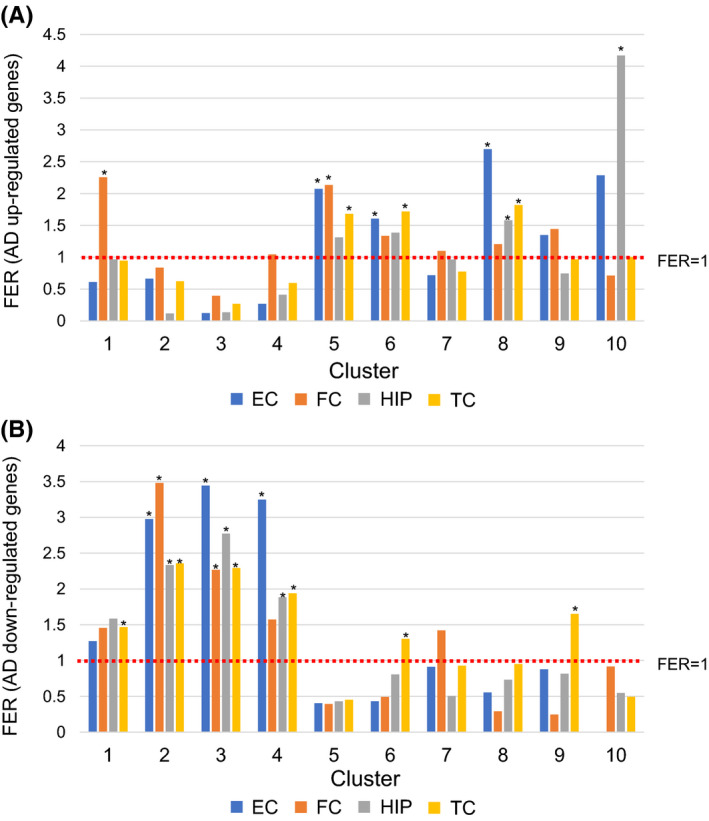
Enrichment analysis of differentially expressed genes (DEGs) in Alzheimer's disease (AD). Evaluation of number of genes with upregulated expression (A) and downregulated expression (B) in brains from patients with AD depending on brain regions. The y‐axis shows the fold enrichment ratio (FER), which indicates the ratio of the number of DEGs to the expected number. A FER of greater than one indicates that the proportion of DEGs is higher than the expected proportion. The asterisks indicate the FERs satisfying the criteria of FER >1 and FDR‐adjusted p < 0.05. p‐values were calculated by the hypergeometric test. The red line indicates an FER of 1. EC: entorhinal cortex, FC: frontal cortex, HIP: hippocampus, TC: temporal cortex
As the expression pattern of cluster 10 suggests an interaction between obesity/diabetes and AD, we further characterized this cluster. Cluster 10 included Btg2, Cyr61, JunB, Lss, Dusp1, Fos, and Npas4, which were also confirmed by real‐time PCR (Figure 5A and Table S3). These genes in cluster 10 were also upregulated in a cell model of neurodegeneration (i.e., Btg2, Cyr61, Dusp1, JunB, and Npas4 28 ) and animal models of neurological disorders, such as ischemia models (i.e., Btg2, Cyr61, Dusp1, Fos, JunB, and Npas4 29 ), and an epilepsy model (i.e., Btg2, Cyr61, Dusp1, Fos, JunB, and Npas4 30 ), suggesting their important roles in general neurodegenerative diseases. Finally, we used bioinformatics approaches to determine whether cluster 10 genes had a common transcriptional regulator. Via oPOSSUM software, 34 we found that four TFs—serum response factor (SRF), specificity protein 1 (SP1), insulinoma‐associated protein 1 (INSM1), and myeloid zinc finger 1 (MZF1)—can regulate the expression of genes in cluster 10. In particular, genes targeted by SRF were the most abundant (Figure 5B and Table S4), and the significant enrichment of SRF binding in the upstream region of cluster 10 genes was confirmed in the ChIP‐Atlas database (Table S5).
FIGURE 5.
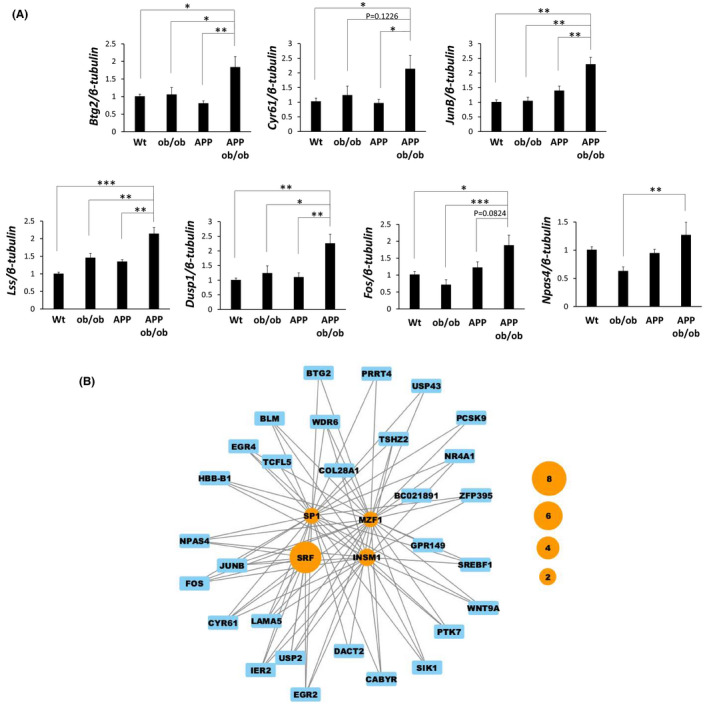
Analysis of cluster 10. (A) Validation of gene expression patterns in cluster 10 by real‐time PCR; the mRNA levels of Btg2, Cyr61, JunB, Lss, Dusp1, Fos and Npas4 were measured using real‐time PCR and were compared among the genotypes (n = 4–6 mice/group). The data are presented as the adjusted means ± standard errors of the mean. *p < 0.05, **p < 0.01, and ***p < 0.001 by the Tukey–Kramer test. Wt = wild‐type. (B) The network shows the relationships between TFs and their target genes. The orange nodes represent TFs with a z‐score of ≥10 and a Fisher score of ≥7 (default values) in “Mouse Single Site Analysis” in oPOSSUM. The blue nodes represent cluster 10 genes that contain binding motifs for the linked TFs. The node size of the TF indicates the magnitude of the FER
4. DISCUSSION
While clinical studies have indicated associations between obesity/diabetes and dementia, the mechanisms by which obesity/diabetes increase the risk of dementia are incompletely understood. Previously, we showed that APP;ob/ob mice, AD model mice with diabetes‐linked obesity, exhibit cognitive dysfunction at a young age and inflammatory and vascular changes at 12 months of age. 21 In this study, we sought to investigate the precise mechanisms involved in these changes by quantifying gene expression in the brains of APP;ob/ob mice at 16 months of age. Notably, the Aβ level was reduced in APP;ob/ob mice compared with APP mice, likely to be partially due to the lower expression of APP at this age (Figure S3). However, we observed upregulated expression of a subset of genes in APP;ob/ob mice, which might illuminate the molecular mechanism underlying the interaction between obesity/diabetes and AD.
Genes specific to oligodendrocytes and microglial cells were downregulated in both ob/ob and APP;ob/ob mice (i.e., mice on the ob/ob background). These results are consistent with clinical evidence indicating that diabetes is associated with reduced white matter volume 36 as well as with reductions in hippocampal volume 1 , 36 and gray matter volume. 37 In addition, diabetes is associated with aberrant functional connectivity of the posterior cingulate cortex with the temporal gyrus 38 and frontal gyrus, 39 suggesting white matter abnormalities occur in diabetes. In this study, we found that the expression of Mag, a myelin‐associated glycoprotein, was reduced in both ob/ob and APP;ob/ob mice (Figure 3). Mag is thought to be involved in myelination, and deficiency of this protein results in demyelinating leukodystrophy in humans. 40 Diabetes is associated with dysregulation of macrophages in the peripheral system in humans 41 and animal models. 42 Indeed, diabetes increases susceptibility to infection 43 and impairs wound healing. 41 , 44 Recently emerging evidence supports the hypothesis that dysfunction of microglia, the counterpart of macrophages in the brain, plays important roles in the pathogenesis of AD. 45 , 46 , 47 Therefore, downregulation of genes specific to oligodendrocytes and microglial cells in the ob/ob background might increase susceptibility to Aβ accumulation.
On the other hand, genes specific to astrocytes and microglial cells were upregulated in APP mice (Figure 3), consistent with previous reports. By contrast, those genes were not upregulated in APP;ob/ob mice, probably because Aβ levels are lower in APP;ob/ob mice than in APP mice at 16 months of age. Several neuropathological studies have revealed that patients with AD who have been diagnosed with diabetes exhibit decreased amyloid accumulation compared with patients without diabetes, 14 , 15 , 16 while several neuropathological studies reported no association between diabetes and amyloid accumulation. 10 , 11 , 12 , 13 In our analysis of the National Alzheimer's Coordinating Center (NACC, in the United States) database, diabetes was associated with decreased amyloid accumulation, and the difference was especially significant in APOE3 carriers. 17 Consistent with this finding, we recently reported that Aβ levels were decreased in male APP knock‐in ob/ob mice compared with APP knock‐in mice. 48 In the current study, we also observed that the expression level of APP was reduced in APP;ob/ob mice compared with APP mice, although the mechanism underlying this difference is unclear. Future studies are required to investigate whether APP expression is reduced by obesity/diabetes in humans.
Most importantly, we identified a cluster, cluster 10, that contained genes upregulated in APP;ob/ob mice but not in either APP or ob/ob mice. Genes upregulated in the brains of humans with AD, especially the hippocampal area, were enriched in cluster 10. Interestingly, genes in cluster 10 formed a network, and the upregulated genes partially overlapped with those in a cell model of neurodegeneration 28 and the animal models of neurological disorders, such as ischemia models 29 and an epilepsy model. 30 Zhang et al. identified a genomic program in hippocampal neurons that mediates synaptic activity‐induced, acquired neuroprotection; this program includes B‐cell translocation gene 2 (Btg2), Cyr61, Dusp1, and JunB. 28 Btg2 is involved in regulating the proliferation of inflammatory cells, and Cyr61 is essential for angiogenesis. 49 , 50 These molecules might be related to the inflammatory and vascular phenotypes, respectively, in these mice, as we previously reported. 21 In addition, we found that the transcription factor SRF might be a common transcriptional regulator for some genes in cluster 10. Interestingly, a recent single‐cell analysis of human postmortem brain tissue suggested that SRF can control the conversion from healthy cells to AD cells. 51 Moreover, the transcriptional activity of SRF is reported to be increased in the skeletal muscle of patients with type 2 diabetes with a family history, and pharmacological inhibition of SRF improves insulin resistance in animal models. 52 Additionally, conditional genetic ablation of SRF diminishes epilepsy‐associated neurodegeneration in the abovementioned epilepsy model. 30 Seizures, a major symptom of epilepsy, are an early symptom of autosomal‐dominant AD. 27 Therefore, further examination is needed to validate the importance of genes involved in cluster 10 in the interaction between obesity/diabetes and AD.
Our animal models have several limitations. In this study, we selected APP transgenic mice as a model of AD and ob/ob mice as a model of diabetes‐linked obesity. APP transgenic mice overexpress APP, and ob/ob mice become obese and mildly diabetic resulting from leptin deficiency. In future studies, we will study the interaction between obesity/diabetes and AD in both humans and other animal models. Also, we did not fully characterize phenotypes of APP;ob/ob mice at 16 months of age, while they showed cognitive changes at young age and vascular changes at 12 months of age. 21 Together with the reduction of their Aβ levels at 16 months of age, genes upregulated in APP;ob/ob mice indeed might contribute to some biological defense against AD insults, rather than synergistic harmful effects. Further studies would be necessary to address the roles of these upregulated genes.
The upregulated expression of a subset of genes in APP;ob/ob mice provides a clue to understand the interaction between diabetes‐linked obesity and AD. An understanding of the precise mechanisms underlying this interaction will likely provide novel therapeutic targets for obesity/diabetes and AD. Further studies are required to determine the precise contributions of these genes to the pathogenesis of AD and obesity/diabetes in vitro and in vivo.
CONFLICT OF INTERESTS
The authors have no conflicts of interest related to the content of this article to declare.
AUTHORS’ CONTRIBUTIONS
Conceptualization: N. S.; Methodology: M. S., M. K., and N. S.; Bioinformatic Analysis: M. K.; Histological analysis: Y. T. and K. S.; Other investigation: M. S., M. O. T., Y. N., S. T., M. M., S. N., A. F., and N. S.; Writing‐Original Draft: M. S., M. K., and N. S.; Funding Acquisition: M. S., and N. S.; Supervision: R. M., A. N., and N. S. All authors have read and approved the final manuscript.
Supporting information
Supplementary Material
ACKNOWLEDGMENTS
We thank Ms. Junko Hirokawa, Miho Yamamoto, Tomomi Tajiri, and Tomomi Sato for providing technical assistance; Ms. Saki Ishino at Osaka University for RNA‐seq, and Dr. Noboru Ogiso for providing technical support in the Laboratory of Experimental Animals at National Center for Geriatrics and Gerontology (NCGG). We also thank Drs. Matthias Staufenbiel, Ulf Neumann, and Tobias Keck at Novartis Pharma AG for providing APP23 mice. We thank Prof. Masashi Narita for providing critical reading and discussions. We also thank laboratory members in the Department of Aging Neurobiology at NCGG and Drs. Kiyoshi Takeda, Yasushi Fujio, Toshihisa Tanaka, and Atsuyuki Morishima for participating in helpful discussions. This work was supported in part by Research Funding for Longevity Sciences from NCGG (28‐45, 19‐3 & 19‐9 to NS); Grants‐in‐Aid from Japan Promotion of Science/The Ministry of Education, Culture, Sports, Science and Technology (JP26293167, JP15K15272 & JP17H04154 to NS; JP17H07419 & JP18H02725 to MiS); a Takeda Science Foundation Research Encouragement Grant (to NS and MiS); a SENSHIN Medical Research Foundation Research Grant (to NS); a Novartis Foundation for Gerontological Research Award (to NS); an Annual Research Award Grant from the Japanese Society of Anti‐aging Medicine (to NS); a Takeda Medical Research Foundation Research Grant (to NS); a research grant from the Japan Foundation For Aging And Health (to MiS); and a research grant from the Uehara Memorial Foundation (to MiS).
Mitsuru Shinohara, Masataka Kikuchi are contributed equally to this work.
REFERENCES
- 1. Roberts RO, Knopman DS, Przybelski SA, et al. Association of type 2 diabetes with brain atrophy and cognitive impairment. Neurology. 2014;82:1132‐1141. [DOI] [PMC free article] [PubMed] [Google Scholar]
- 2. Morris JK, Vidoni ED, Honea RA, Burns JM. Impaired glycemia increases disease progression in mild cognitive impairment. Neurobiol Aging. 2014;35:585‐589. [DOI] [PMC free article] [PubMed] [Google Scholar]
- 3. Maher PA, Schubert DR. Metabolic links between diabetes and Alzheimer's disease. Expert Rev Neurother. 2009;9:617‐630. [DOI] [PubMed] [Google Scholar]
- 4. Kopf D, Frolich L. Risk of incident Alzheimer's disease in diabetic patients: a systematic review of prospective trials. J Alzheimers Dis. 2009;16:677‐685. [DOI] [PubMed] [Google Scholar]
- 5. Ott A, Stolk RP, van Harskamp F, Pols HA, Hofman A, Breteler MM. Diabetes mellitus and the risk of dementia: the Rotterdam Study. Neurology. 1999;53:1937‐1942. [DOI] [PubMed] [Google Scholar]
- 6. Matsuzaki T, Sasaki K, Tanizaki Y, et al. Insulin resistance is associated with the pathology of Alzheimer disease: the Hisayama study. Neurology. 2010;75:764‐770. [DOI] [PubMed] [Google Scholar]
- 7. Leibson CL, Rocca WA, Hanson VA, et al. Risk of dementia among persons with diabetes mellitus: a population‐based cohort study. Am J Epidemiol. 1997;145:301‐308. [DOI] [PubMed] [Google Scholar]
- 8. Shinohara M, Sato N. Bidirectional interactions between diabetes and Alzheimer's disease. Neurochem Int. 2017;108:296‐302. [DOI] [PubMed] [Google Scholar]
- 9. Sutherland GT, Lim J, Srikanth V, Bruce DG. Epidemiological approaches to understanding the link between type 2 diabetes and dementia. J Alzheimers Dis. 2017;59:393‐403. [DOI] [PubMed] [Google Scholar]
- 10. Heitner J, Dickson D. Diabetics do not have increased Alzheimer‐type pathology compared with age‐matched control subjects. A retrospective postmortem immunocytochemical and histofluorescent study. Neurology. 1997;49:1306‐1311. [DOI] [PubMed] [Google Scholar]
- 11. Arvanitakis Z, Schneider JA, Wilson RS, et al. Diabetes is related to cerebral infarction but not to AD pathology in older persons. Neurology. 2006;67:1960‐1965. [DOI] [PubMed] [Google Scholar]
- 12. Abner EL, Nelson PT, Kryscio RJ, et al. Diabetes is associated with cerebrovascular but not Alzheimer's disease neuropathology. Alzheimers Dement. 2016;12:882‐889. [DOI] [PMC free article] [PubMed] [Google Scholar]
- 13. Dos Santos Matioli MNP, Suemoto CK, Rodriguez RD, et al. Diabetes is not associated with Alzheimer's disease neuropathology. J Alzheimers Dis. 2017;60:1035‐1043. [DOI] [PMC free article] [PubMed] [Google Scholar]
- 14. Kalaria RN. Neurodegenerative disease: diabetes, microvascular pathology and Alzheimer disease. Nat Rev Neurol. 2009;5:305‐306. [DOI] [PubMed] [Google Scholar]
- 15. Beeri MS, Silverman JM, Davis KL, et al. Type 2 diabetes is negatively associated with Alzheimer's disease neuropathology. J Gerontol A Biol Sci Med Sci. 2005;60:471‐475. [DOI] [PMC free article] [PubMed] [Google Scholar]
- 16. Nelson PT, Smith CD, Abner EA, et al. Human cerebral neuropathology of Type 2 diabetes mellitus. Biochim Biophys Acta. 2009;1792:454‐469. [DOI] [PMC free article] [PubMed] [Google Scholar]
- 17. Shinohara M, Tashiro Y, Suzuki K, Fukumori A, Bu G, Sato N. Interaction between APOE genotype and diabetes in cognitive decline. Alzheimer's Dement Diagn Assessm Dis Monit. 2020;12:e12006. [DOI] [PMC free article] [PubMed] [Google Scholar]
- 18. Sato N, Morishita R. Brain alterations and clinical symptoms of dementia in diabetes: abeta/tau‐dependent and independent mechanisms. Front Endocrinol (Lausanne). 2014;5:143. [DOI] [PMC free article] [PubMed] [Google Scholar]
- 19. Anstey KJ, Cherbuin N, Budge M, Young J. Body mass index in midlife and late‐life as a risk factor for dementia: a meta‐analysis of prospective studies. Obes Rev. 2011;12:e426‐e437. [DOI] [PubMed] [Google Scholar]
- 20. Ngandu T, Lehtisalo J, Solomon A, et al. A 2 year multidomain intervention of diet, exercise, cognitive training, and vascular risk monitoring versus control to prevent cognitive decline in at‐risk elderly people (FINGER): a randomised controlled trial. Lancet. 2015;385(9984):2255‐2263. [DOI] [PubMed] [Google Scholar]
- 21. Takeda S, Sato N, Uchio‐Yamada K, et al. Diabetes‐accelerated memory dysfunction via cerebrovascular inflammation and Abeta deposition in an Alzheimer mouse model with diabetes. Proc Natl Acad Sci USA. 2010;107:7036‐7041. [DOI] [PMC free article] [PubMed] [Google Scholar]
- 22. Sato N, Takeda S, Uchio‐Yamada K, et al. Role of insulin signaling in the interaction between Alzheimer disease and diabetes mellitus: a missing link to therapeutic potential. Curr Aging Sci. 2011;4:118‐127. [DOI] [PubMed] [Google Scholar]
- 23. Sturchler‐Pierrat C, Abramowski D, Duke M, et al. Two amyloid precursor protein transgenic mouse models with Alzheimer disease‐like pathology. Proc Natl Acad Sci. 1997;94:13287‐13292. [DOI] [PMC free article] [PubMed] [Google Scholar]
- 24. Pelleymounter M, Cullen M, Baker M, et al. Effects of the obese gene product on body weight regulation in ob/ob mice. Science. 1995;269:540‐543. [DOI] [PubMed] [Google Scholar]
- 25. Halaas J, Gajiwala K, Maffei M, et al. Weight‐reducing effects of the plasma protein encoded by the obese gene. Science. 1995;269:543‐546. [DOI] [PubMed] [Google Scholar]
- 26. Campfield L, Smith F, Guisez Y, Devos R, Burn P. Recombinant mouse OB protein: evidence for a peripheral signal linking adiposity and central neural networks. Science. 1995;269:546‐549. [DOI] [PubMed] [Google Scholar]
- 27. Voglein J, Noachtar S, McDade E, et al. Seizures as an early symptom of autosomal dominant Alzheimer's disease. Neurobiol Aging. 2019;76:18‐23. [DOI] [PMC free article] [PubMed] [Google Scholar]
- 28. Zhang SJ, Zou M, Lu L, et al. Nuclear calcium signaling controls expression of a large gene pool: identification of a gene program for acquired neuroprotection induced by synaptic activity. PLoS Genet. 2009;5:e1000604. [DOI] [PMC free article] [PubMed] [Google Scholar]
- 29. Ohtomo R, Bannai T, Ohtomo G, et al. Cilostazol alleviates white matter degeneration caused by chronic cerebral hypoperfusion in mice: implication of its mechanism from gene expression analysis. Neurosci Lett. 2018;662:247‐252. [DOI] [PubMed] [Google Scholar]
- 30. Losing P, Niturad CE, Harrer M, et al. SRF modulates seizure occurrence, activity induced gene transcription and hippocampal circuit reorganization in the mouse pilocarpine epilepsy model. Mol Brain. 2017;10:30. [DOI] [PMC free article] [PubMed] [Google Scholar]
- 31. Tibshirani R, Walther G, Hastie T. Estimating the number of clusters in a data set via the gap statistic. J R Stat Soc Ser B (Stat Methodol). 2001;63:411‐423. [Google Scholar]
- 32. Team RC . Computing RFfS: R: a language and environment for statistical computing. In: Book R: A Language and Environment for Statistical Computing (Editor ed.^eds.). City; 2019.
- 33. Zhang Y, Chen K, Sloan SA, et al. An RNA‐sequencing transcriptome and splicing database of glia, neurons, and vascular cells of the cerebral cortex. J Neurosci. 2014;34:11929‐11947. [DOI] [PMC free article] [PubMed] [Google Scholar]
- 34. Ho Sui SJ, Mortimer JR, Arenillas DJ, et al. oPOSSUM: identification of over‐represented transcription factor binding sites in co‐expressed genes. Nucleic Acids Res. 2005;33:3154‐3164. [DOI] [PMC free article] [PubMed] [Google Scholar]
- 35. Shinohara M, Fujioka S, Murray ME, et al. Regional distribution of synaptic markers and APP correlate with distinct clinicopathological features in sporadic and familial Alzheimer's disease. Brain. 2014;137:1533‐1549. [DOI] [PMC free article] [PubMed] [Google Scholar]
- 36. Moran C, Phan TG, Chen J, et al. Brain atrophy in type 2 diabetes: regional distribution and influence on cognition. Diabetes Care. 2013;36:4036‐4042. [DOI] [PMC free article] [PubMed] [Google Scholar]
- 37. Garcia‐Casares N, Berthier ML, Jorge RE, et al. Structural and functional brain changes in middle‐aged type 2 diabetic patients: a cross‐sectional study. J Alzheimers Dis. 2014;40:375‐386. [DOI] [PubMed] [Google Scholar]
- 38. Chen YC, Jiao Y, Cui Y, et al. Aberrant brain functional connectivity related to insulin resistance in type 2 diabetes: a resting‐state FMRI study. Diabetes Care. 2014;37:1689‐1696. [DOI] [PubMed] [Google Scholar]
- 39. Hoogenboom WS, Marder TJ, Flores VL, et al. Cerebral white matter integrity and resting‐state functional connectivity in middle‐aged patients with type 2 diabetes. Diabetes. 2014;63:728‐738. [DOI] [PMC free article] [PubMed] [Google Scholar]
- 40. Lossos A, Elazar N, Lerer I, et al. Myelin‐associated glycoprotein gene mutation causes Pelizaeus‐Merzbacher disease‐like disorder. Brain. 2015;138:2521‐2536. [DOI] [PMC free article] [PubMed] [Google Scholar]
- 41. Falanga V. Wound healing and its impairment in the diabetic foot. Lancet. 2005;366:1736‐1743. [DOI] [PubMed] [Google Scholar]
- 42. Shultz LD, Schweitzer PA, Christianson SW, et al. Multiple defects in innate and adaptive immunologic function in NOD/LtSz‐scid mice. J Immunol. 1995;154:180‐191. [PubMed] [Google Scholar]
- 43. Ratter JM, Tack CJ, Netea MG, Stienstra R. Environmental signals influencing myeloid cell metabolism and function in diabetes. Trends Endocrinol Metab. 2018. [DOI] [PubMed] [Google Scholar]
- 44. Dinh T, Tecilazich F, Kafanas A, et al. Mechanisms involved in the development and healing of diabetic foot ulceration. Diabetes. 2012;61:2937‐2947. [DOI] [PMC free article] [PubMed] [Google Scholar]
- 45. Guerreiro R, Wojtas A, Bras J, et al. TREM2 variants in Alzheimer's disease. N Engl J Med. 2012;368:117‐127. [DOI] [PMC free article] [PubMed] [Google Scholar]
- 46. Jonsson T, Stefansson H, Steinberg S, et al. Variant of TREM2 associated with the risk of Alzheimer's disease. N Engl J Med. 2012;368:107‐116. [DOI] [PMC free article] [PubMed] [Google Scholar]
- 47. Hansen DV, Hanson JE, Sheng M. Microglia in Alzheimer’s disease. J Cell Biol. 2018;217:459. [DOI] [PMC free article] [PubMed] [Google Scholar]
- 48. Shinohara M, Tashiro Y, Shinohara M, et al. Increased levels of Aβ42 decrease the lifespan of ob/ob mice with dysregulation of microglia and astrocytes. FASEB J. 2020;34:2425‐2435. [DOI] [PubMed] [Google Scholar]
- 49. Babic AM, Kireeva ML, Kolesnikova TV, Lau LF. CYR61, a product of a growth factor‐inducible immediate early gene, promotes angiogenesis and tumor growth. Proc Natl Acad Sci. 1998;95:6355‐6360. [DOI] [PMC free article] [PubMed] [Google Scholar]
- 50. Yuniati L, Scheijen B, van der Meer LT, van Leeuwen FN. Tumor suppressors BTG1 and BTG2: beyond growth control. J Cell Physiol. 2019;234:5379‐5389. [DOI] [PMC free article] [PubMed] [Google Scholar]
- 51. Grubman A, Chew G, Ouyang JF, et al. A single‐cell atlas of entorhinal cortex from individuals with Alzheimer’s disease reveals cell‐type‐specific gene expression regulation. Nat Neurosci. 2019;22:2087‐2097. [DOI] [PubMed] [Google Scholar]
- 52. Jin W, Goldfine AB, Boes T, et al. Increased SRF transcriptional activity in human and mouse skeletal muscle is a signature of insulin resistance. J Clin Investig. 2011;121:918‐929. [DOI] [PMC free article] [PubMed] [Google Scholar]
Associated Data
This section collects any data citations, data availability statements, or supplementary materials included in this article.
Supplementary Materials
Supplementary Material