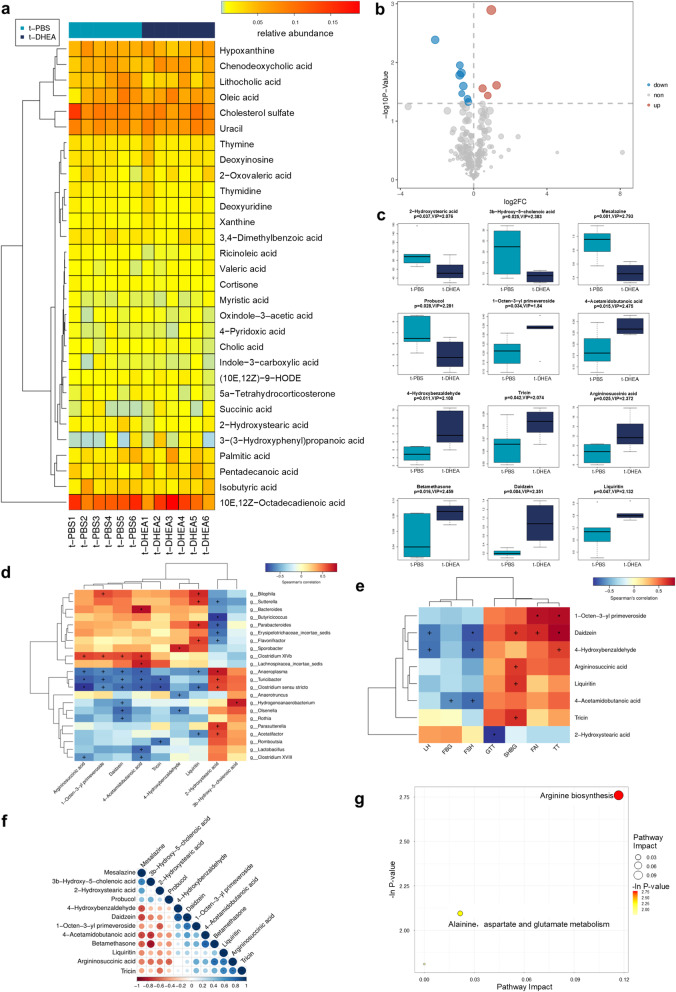
Fig. 4.
Non-target metabolomic analysis of faecal samples in FMT recipient rats. a Heat map presenting top 30 metabolites detected in faecal samples of t-PBS group and t-DHEA group. b Volcano plot of the differentially expressed metabolites. c Boxplot of the upregulated and downregulated metabolites in t-DHEA group. p value of student’s t test and variable importance in the projection score of OPLS-DA were both used to select differentially expressed metabolites. Correlation analysis between metabolites and gut microbes (d), between metabolites and clinical parameters (e) and between each 2 of the differentially expressed metabolites (f). Correlations were determined by Spearman’s rho correlation test or Pearson’s correlation test (+ p < 0.10; p < 0.05). g Bubble plot shows differentially enriched metabolic pathways following distinct gut microbiota transplantation. Each bubble indicates an enriched pathway. Horizontal axis and size of the bubble indicate the impact of the pathway. Vertical axis and colour of the bubble indicate the significance of enrichment. n = 6 rats per group

